The Belle II Collaboration
Measurement of CP asymmetries in decays at Belle II
Abstract
We report a measurement of decay-time dependent charge-parity (CP) asymmetries in decays. We use pairs collected at the resonance with the Belle II detector at the SuperKEKB asymmetric-energy electron-positron collider. We reconstruct 220 signal events and extract the CP-violating parameters and from a fit to the distribution of the decay-time difference between the two mesons. The resulting confidence region is consistent with previous measurements in and decays, and with predictions based on the standard model.
I Introduction
In the standard model (SM), the charmless three-body decay is mediated by the quark transition, which is dominated by a one-loop process, the so-called penguin amplitude. Charge-conjugate decays are implied hereafter unless specified otherwise. Penguin amplitudes are suppressed in the SM, e.g, Workman et al. (2022), and imply exchanges of virtual particles where SM particles can be replaced by a broad class of non-SM particles. These features make these decays sensitive to possible contributions from non-SM physics Grossman and Worah (1997). A key probe of such contributions is provided by decay-time dependent CP-violating asymmetries of the and decay rates. These asymmetries arise from interference between amplitudes for direct decay and decay following flavor oscillations, due to the irreducible phase in the Cabibbo-Kobayashi-Maskawa (CKM) quark-mixing matrix Kobayashi and Maskawa (1973). Precise measurements of these asymmetries using pairs are a primary goal of experiments in electron-positron collisions at the resonance. If one of the neutral mesons, , decays into a CP eigenstate at proper time and the other, , decays into a flavor-specific final state at proper time , the probability density for observing a with flavor at is Carter and Sanda (1980, 1981); Bigi and Sanda (1981)
| (1) | ||||
where the flavor is for , is the lifetime, is the mass difference between the two mass eigenstates of the - system, and the CP asymmetries and express mixing-induced and direct CP violation, respectively111The coefficients are written elsewhere.. The SM predicts that and for decays into the CP-even final state Cheng et al. (2005). The mixing phase is a combination of CKM matrix-elements. The uncertainty in the SM prediction for is smaller than 0.01; hence, a large deviation in decays would indicate non-SM physics. The Belle Kang et al. (2021) and BaBar Lees et al. (2012) experiments reported these asymmetries with comparable uncertainties dominated by the sample size, yielding world-average values and Amhis et al. (2023). While these agree with the SM predictions, the large uncertainties limit the sensitivity to non-SM sources. Additional measurements are needed.
We report a measurement of and in decays using electron-positron collisions at the collected by the Belle II experiment. We reconstruct signal () decays followed by decays and suppress background using two multivariate classifiers. We then measure using the remaining charged particles in the event and from the distance between the decay positions of and . We divide the events into two classes based on the quality of the information: time-differential (TD) events use and determine and , while time-integrated (TI) events do not use and contribute to the determination of only. Fits to signal-discriminating observables and decay time (when appropriate) determine the signal yield and CP asymmetries. We use the decay as a control channel to constrain the fit model from data.
II The Belle II detector and data sample
The Belle II experiment is located at SuperKEKB, which collides electrons and positrons at and near the resonance Akai et al. (2018). The Belle II detector Abe et al. (2010) has a cylindrical geometry and includes a six-layer silicon detector (VXD) and a 56-layer central drift chamber (CDC). These detectors reconstruct trajectories of charged particles (tracks). The VXD consists of two layers of silicon-pixel detectors (PXD) surrounded by four layers of double-sided silicon-strip detectors Adamczyk et al. (2022). Only the innermost PXD layer, and one sixth of the outermost layer are installed for the data analyzed here. The symmetry axis of these detectors, defined as the axis, is almost coincident with the direction of the electron beam. Surrounding the CDC, which also provides energy-loss measurements, is a time-of-propagation counter Kotchetkov et al. (2019) in the central region and an aerogel-based ring-imaging Cherenkov counter in the forward region. These detectors provide charged-particle identification. Surrounding them is an electromagnetic calorimeter based on CsI(Tl) crystals that primarily provides energy and timing measurements for photons and electrons. Outside of the calorimeter is a superconducting solenoid magnet. The magnet provides a 1.5 T magnetic field parallel to the axis. Its flux return is instrumented with resistive-plate chambers and plastic-scintillator modules to detect muons, mesons, and neutrons.
We use data collected at the resonance in 2019–2022, corresponding to an integrated luminosity of and containing pairs. We use simulated samples to train the multivariate classifiers and define fit models. The sample is generated using evtgen Lange (2001) and pythia Sjöstrand et al. (2015). In the simulated signal sample, one of the mesons decays to the signal mode or the control mode according to phase space. The simulated sample, where indicates an , , , or quark, is generated using the kkmc Jadach et al. (2000) generator interfaced with pythia. We also use evtgen to simulate the decay of short-lived particles. The detector response is simulated by geant4 Agostinelli et al. (2003). Experimental and simulated data are analyzed with the Belle II software Kuhr et al. (2019); Belle II Collaboration .
III Event reconstruction
The is produced at the collision point with a Lorentz boost () of 0.288 and subsequently decays to a and a meson, which are both nearly at rest in the center-of-mass (c.m.) frame. Therefore, the -meson pairs propagate nearly along the boost direction with known velocity in the laboratory. This allows one to approximate the difference between their decay times as , where is the decay position of projected onto the boost axis.
Events are selected online based on the number of charged particles and total energy deposited in the calorimeter with nearly 100% efficiency. Pairs of oppositely-charged particles are used to reconstruct candidates. The four-momentum and decay vertex of the candidate are obtained from a kinematic fit of the and tracks. To reduce combinatorial background from incorrectly reconstructed candidates, we use a boosted-decision-tree (BDT) classifier with 15 input variables that include the flight length, the impact parameters of the candidate and the , and the number of measurement points (hits) in the VXD associated with the . The most discriminating variables are the angle between the momentum and the displacement of the decay vertex from the beam interaction point (IP) and the flight length normalized by its uncertainty. We select candidates with invariant mass between 462.6 and 532.6, corresponding to about 35 units of the relevant resolution, and with an requirement that accepts 91% of mesons. The mass window is wide since the BDT efficiently suppresses the background. These criteria are optimized as described later.
We reconstruct candidates by combining three candidates and treat the particles not belonging to as decay products. We select candidates using the invariant mass and the beam energy constrained mass , where and are the beam energy and the momentum of the meson in the c.m. frame. We retain candidates satisfying and , but exclude those satisfying and to avoid contamination by decays.
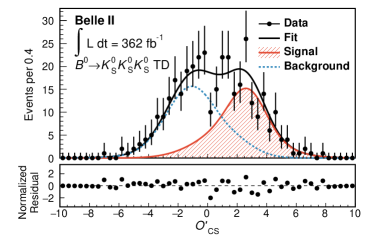
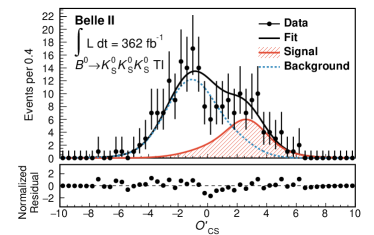
The dominant source of background is the continuum. We suppress this background by using another BDT classifier, , with the following input variables that exploit event topology: the cosine of the angle between the thrust axes of and in the c.m. frame; the magnitude of the thrust; the sum of the transverse momenta of the particles in the event; the squared four-momentum difference between the beams and the detected particles in the c.m. frame; and the modified Fox-Wolfram moments Lee et al. (2003). The thrust axis is a unit vector that maximizes the thrust magnitude , where is the momentum of the meson’s -th decay-product in the c.m. frame. The BDT classifier ranges from zero for background-like events to one for signal-like events. We use simulated events to train the classifier. A requirement of results in 51% background rejection with a signal efficiency of 98%. We then calculate a transformation of the classifier, , which yields a classifier distribution more convenient to parametrize. The selection criteria on candidate mass and are determined by maximizing , where and are the expected yields of signal and background events determined from simulation, respectively, meeting the following signal-enhancement conditions: , , and .
In addition to the nonresonant decay amplitude, quasi-two-body decays via intermediate resonances due to and transitions contribute to decays. We consider decays to be signal, but we veto contributions to measure the CP asymmetries for the transition. We expect a significant contribution only from decays based on the rates of decays where indicates a or meson Workman et al. (2022). The branching fraction is around 5% of the signal branching fraction. We reject signal candidates if the invariant mass of any combination of two candidates is in the range . This requirement rejects 90% of the background from decays and 7.2% of signal.
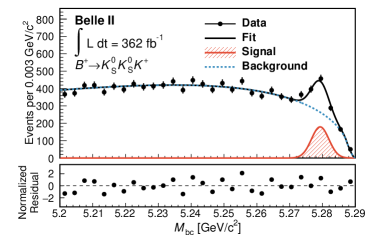
The control channel is reconstructed from two mesons and a track and is similar to the signal decay. We require the particle identification information for the track to be consistent with a . We use the control channel to constrain the parameters of -vertex-resolution model for signal, as well as those of the shapes of the mass and background distributions. We do not veto decays for the control channel because their kinematic distributions are the same as those of the final state.
IV Measurement of -meson flavor and decay-time difference
We use a category-based BDT algorithm to identify the flavor Abudinén et al. (2022). The algorithm uses 13 BDTs, each geared toward discriminating a specific signature of cascade decays using particle identification and kinematic variables of the charged decay products. The outputs from these BDTs are combined by the top-level BDT to return the flavor value and tagging quality , where is the probability for wrong flavor assignment. The probability density of Eq. (1) is modified to include the parameter , and its difference between and , ,
| (2) | ||||
The events are classified into seven independent intervals (bins). For each bin, and are determined using flavor-specific meson decays with large branching fractions Adachi et al. (2023). Since the signal purity varies as a function of , using the distribution of improves the statistical sensitivity to the CP asymmetries.
To measure , we reconstruct the and decay vertices using information about the IP. The spatial distribution of the IP is described by a three-dimensional Gaussian whose parameters are regularly measured in a calibration based on events. The IP size is typically 250 in the boost direction, 10 in the horizontal direction, and 0.3 in the vertical direction Abudinen et al. (2023). The vertex position is reconstructed from the six final-state pions using a decay-chain vertex fit, which constrains the to originate from the IP (IP constraint) Krohn et al. (2020). Due to their long lifetime, a fraction of mesons decay outside of the VXD volume resulting in poorly measured decay positions. This causes the vertex resolution to depend strongly on the number of mesons with associated VXD hits. In simulation, the fractions of signal decays in which zero, one, two, or three mesons have VXD hits are 0.4%, 7.9%, 37.9%, or 53.8%, respectively. When only one meson has VXD hits, the IP constraint significantly improves the vertex resolution, reducing the average vertex-position uncertainty in the boost direction from around 270 to 120. The average uncertainty with the IP constraint is 49 when two mesons have VXD hits and 35 when all three have such hits.
We use the tracks to reconstruct the vertex, excluding those having no associated PXD hits. We also exclude pairs of oppositely-charged pions consistent with a decay because they are likely to be produced away from the vertex. Similarly to the vertex, we constrain the to originate from the IP to improve the vertex resolution and reconstruction efficiency Dey and Soffer (2020). In order to reduce the contamination from tracks from secondary and tertiary displaced vertices, which would bias the determination of the vertex position, the fit is repeated by iteratively removing the tracks contributing the largest increase to the vertex-fit until a satisfactory fit quality is achieved. A selection on fit quality and vertex-position uncertainty is applied to ensure the quality of the measurement.
We divide the remaining candidates into two classes based on the quality of the information to maximize the sensitivity of the measurement of and . For the time-differential (TD) analysis that determines both and , we require candidates that satisfy the following criteria: both tracks from one or more signal are associated with at least one VXD hit, the decay-time-difference satisfies , satisfactory vertex-fit quality, and small vertex-position uncertainty. The resolution is around 0.9 in the TD events. The information of the other events is not used. They are included in the time-integrated (TI) analysis, which contributes only to . The probability density in Eq. (2) is integrated over for TI events, yielding
| (3) |
For 1.1% of simulated signal events, multiple (typically two) candidates are reconstructed. We choose the candidate with the best vertex-fit quality for such events, which retains the correctly reconstructed candidates in 82% of these events. This requirement has negligible impact on the distribution and the CP asymmetry results. The reconstruction efficiency including the selection is 28.3% in simulation. For the control channel, we reconstruct the vertex without using the track to emulate the vertex fit. We discard candidates that fail the TD criteria. The reconstruction efficiency for the control channel is 24.7%.
V Determination of signal yield
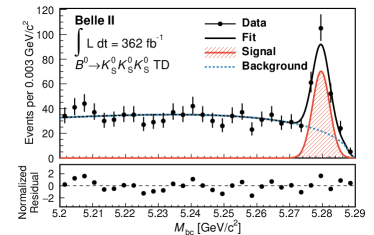
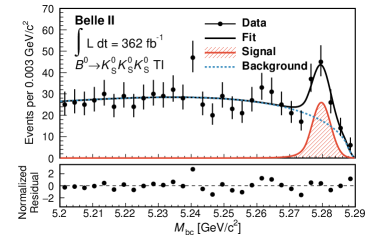
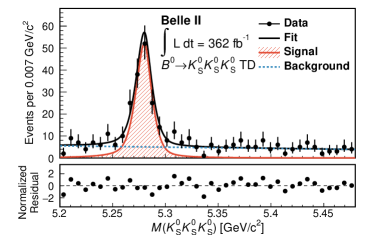
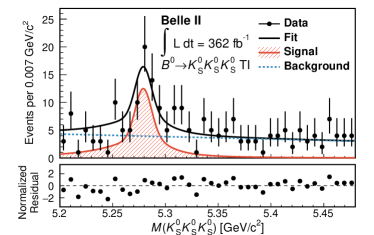
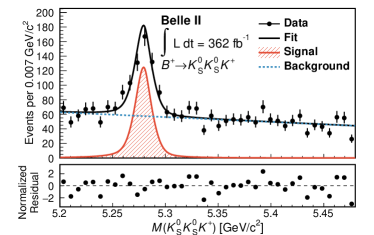
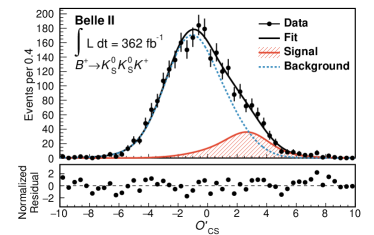
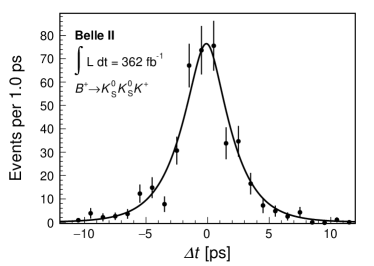
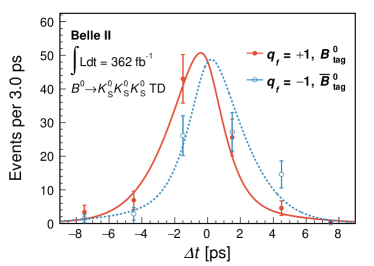
We extract the yields for TD, TI, and control channel events from a three-dimensional likelihood fit to the unbinned distributions of ; , where indicates a or meson; and . The likelihood function includes two sample components, signal and background. We determine the shape of the signal component from fits to distributions of simulated signal and control samples. The distribution is modeled with a Gaussian function for the signal TD and control samples and with a Crystal Ball shape Gaiser (1982); Skwarnicki (1986) for the signal TI sample. The signal and control-sample distribution is modeled with the sum of a Gaussian function and an asymmetric Breit-Wigner function. The signal and control-sample distribution is modeled with the sum of a symmetric and an asymmetric Gaussian function. For the background, the distribution is modeled with an ARGUS function Albrecht et al. (1990), the distribution with a linear function, and the distribution with the sum of a symmetric and an asymmetric Gaussian function. The endpoint of the ARGUS function is set to , which is calibrated using other decays. The parameter sets for the shapes are shared between TD and TI events. We use the same parameter set for the and background shapes across the three samples as the kinematic properties are similar to those of the signal decay, as confirmed in simulation. The fit simultaneously determines the yield of each sample and 14 background shape parameters James and Roos (1975).
Figures 1, 2, and 3 show the data distributions with fit results overlaid. The low-mass tails of the distribution of the signal TI component is mainly due to decays, which occur in 3% of the reconstructed signal events. Such events are mostly classified as TI events due to the poor vertex fit quality. We define the signal region as , , and . Each range for and retains 99.73% of signal TD events. The signal yield and the purity in the signal region is and 57% for TD events, and 40% for TI events, and and 22% for the control channel events.
VI Determination of CP asymmetries
We determine the CP asymmetries and from a maximum-likelihood fit to the unbinned and binned distributions combining TD, TI, and events restricted to the signal region. The contribution to the likelihood function from the -th TD event is
| (4) | ||||
where is the response function of the measurement (resolution function), is the signal probability of the -th event, and is the distribution of background events. We use a resolution function developed by the Belle collaboration Tajima et al. (2004). The resolution function is the convolution of four components: detector resolution for the vertex, detector resolution for the vertex, bias due to secondary particles from charmed intermediate states for the vertex, and corrections to the boost factor due to the nonzero c.m. momentum of the mesons. The correction to the boost factor is calculated analytically using the cosine of the angle between the momentum and the boost direction in the c.m. frame, , on an event-by-event basis. The resolution-function parameters are fixed to those obtained from a fit to simulated signal events, but the width in simulation is scaled by a parameter that accounts for data-simulation differences and that is determined simultaneously with and . The distribution is the sum of two Gaussian functions that depend on vertex quality and vertex-position uncertainty. The parameters are determined by a fit to the sideband data. We calculate the signal probability on an event-by-event basis using the five-dimensional PDF of , , , , and . The PDF contains signal and background components, whose fractions are determined by the signal and background yields. No correlation is assumed between the variables. The last two variables are included to avoid fit biases (0.03 for and 0.02 for ) due to implicitly assuming equal distributions that differ across sample components Punzi (2003). The distribution for background is obtained from the sideband. For , we assume a uniform distribution for background and for signal. For TI events, we use the likelihood in Eq. (4) integrated over ,
| (5) |
We include the decays in the fit using the likelihood in Eq. (4) summed over and using the lifetime instead of the lifetime. The control channel helps to constrain since its signal yield is 2.5 times larger than the TD signal. The resolution-function parameters and are the same as those of the events except for the parameters that model the effect of secondary particles. They differ since, compared to mesons, mesons yield fewer mesons and more mesons, which have shorter lifetimes. We define the background distribution for with an independent parameter set from and with an additional Gaussian function.
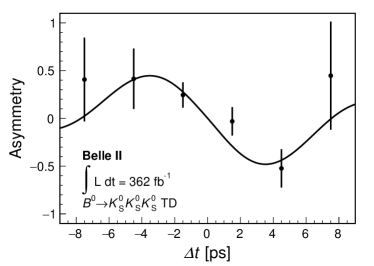
Figure 4 shows the background-subtracted distributions using the technique Pivk and Le Diberder (2005) and their asymmetry with fit projections overlaid. We obtain , , and . Linear correlation coefficients are between and , between and , and between and . However, simulation studies show that the above point estimates are not reliable. While the likelihood has no secondary maxima, the small sample size leads to biases and non-Gaussian uncertainties. For more reliable results, we construct confidence intervals for the CP-violating parameters as described in Sec. VIII.
VII Systematic uncertainties
| Source | ||
|---|---|---|
| , , and | 0.009 | 0.000 |
| Signal modeling | 0.014 | 0.008 |
| resolution function | 0.013 | 0.008 |
| Background modeling | 0.004 | 0.002 |
| Flavor tagging | 0.013 | 0.012 |
| Fit bias | 0.014 | 0.004 |
| Tag-side interference | 0.011 | 0.006 |
| Vertex reconstruction | 0.011 | 0.004 |
| Tracker misalignment | 0.008 | 0.007 |
| Total | 0.032 | 0.020 |
We consider various sources of systematic uncertainties, which are listed in Table 1. To evaluate the systematic uncertainties in and related to assumptions made on parameters of the fit model, we repeat the fit on data using alternative values of the parameters sampled from Gaussian distributions based on their uncertainties. The widths of the resulting distributions of and are taken as contributions to the systematic uncertainty. This approach is used for , , and ; the parameters of the , , and shapes (referred to as signal modeling in the table); the parameters describing the resolution function; the parameters for the background shape; and the parameters related to flavor tagging.
We sample the world averages of the and lifetimes and including their uncertainties Workman et al. (2022). The parameters of signal probability, resolution function, and background shape have uncertainties from the fits used to determine them, which depend on the size of data and simulated samples. The systematic uncertainty in the resolution function includes the uncertainty due to the choice of the model, which is determined by analyzing a simulated sample with alternative resolution models whose dependence on the vertex-fit quality is partly or entirely removed. The simulation assumes and . The systematic uncertainty due to flavor tagging includes the bias due to the flavor asymmetry in the tagging efficiency between and . Two sets of simplified simulated experiments are generated, with and without the asymmetry, and fits for and are performed in both ignoring the asymmetry. The difference between the mean values of and obtained in the two sets is the uncertainty. We repeat the simplified simulation assuming various input CP asymmetries and take the maximum difference. We observe correlations between and vertex-fit quality for ( for TD events), and between and (0.15), which are not included in the default model. To evaluate the bias due to these correlations, and to a mismodeling of the distribution, we use simplified simulated samples generated with and without these effects in the same way as above. The CP asymmetries are affected by the interference between a CKM-favored transition and a doubly CKM-suppressed transition on the tag side Long et al. (2003). We assign as a systematic uncertainty the effect of the tag-side interference assuming the world average values and Amhis et al. (2023). The systematic uncertainty due to the vertex reconstruction is determined by varying the parameters describing the IP profile and boost vector, the track requirements used in the vertex reconstruction, and the criteria to select TD events, and repeating the fit on data. To evaluate the effect from possible misalignment of the vertex detector, we use four simulated samples, each assuming a different misalignment configuration and CP asymmetries of and . We compare the resulting CP asymmetries with those in the sample without misalignment and the maximum deviation is taken as the systematic uncertainty.
VIII Results and summary
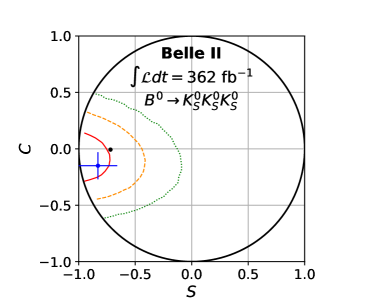
Since the point estimates from the fit are not reliable, we construct confidence intervals for our results based on likelihood-ratio ordering Feldman and Cousins (1998). For the construction, simplified simulated experiments are generated by sampling the likelihoods of the yield fit and asymmetry fit. The nuisance parameters in the models are fixed to the values fitted to the data and the systematic uncertainty is not taken into account as its size is negligible. Figure 5 shows the resulting two-dimensional confidence intervals where and are constrained within their physical boundary, . The two-dimensional intervals are and at the 68.3% confidence level, and at the 95.5% confidence level, and and at the 99.7% confidence level. The results are consistent with the SM predictions and current best determinations by the Belle and BaBar experiments Kang et al. (2021); Lees et al. (2012); Amhis et al. (2023).
In summary, we report a measurement of decay-time dependent CP asymmetries in decays using a data set of pairs reconstructed from electron-positron collisions at the and collected with Belle II experiment from 2019 to 2022. We reconstruct 220 signal events and extract the CP-violating parameters from a fit to the distribution of the decay-time difference of the two mesons. We determine a two-dimensional confidence region for the relevant parameters and obtaining results that are consistent with the SM predictions and previous determinations.
This work, based on data collected using the Belle II detector, which was built and commissioned prior to March 2019, was supported by Higher Education and Science Committee of the Republic of Armenia Grant No. 23LCG-1C011; Australian Research Council and Research Grants No. DP200101792, No. DP210101900, No. DP210102831, No. DE220100462, No. LE210100098, and No. LE230100085; Austrian Federal Ministry of Education, Science and Research, Austrian Science Fund No. P 31361-N36 and No. J4625-N, and Horizon 2020 ERC Starting Grant No. 947006 “InterLeptons”; Natural Sciences and Engineering Research Council of Canada, Compute Canada and CANARIE; National Key R&D Program of China under Contract No. 2022YFA1601903, National Natural Science Foundation of China and Research Grants No. 11575017, No. 11761141009, No. 11705209, No. 11975076, No. 12135005, No. 12150004, No. 12161141008, and No. 12175041, and Shandong Provincial Natural Science Foundation Project ZR2022JQ02; the Czech Science Foundation Grant No. 22-18469S; European Research Council, Seventh Framework PIEF-GA-2013-622527, Horizon 2020 ERC-Advanced Grants No. 267104 and No. 884719, Horizon 2020 ERC-Consolidator Grant No. 819127, Horizon 2020 Marie Sklodowska-Curie Grant Agreement No. 700525 “NIOBE” and No. 101026516, and Horizon 2020 Marie Sklodowska-Curie RISE project JENNIFER2 Grant Agreement No. 822070 (European grants); L’Institut National de Physique Nucléaire et de Physique des Particules (IN2P3) du CNRS and L’Agence Nationale de la Recherche (ANR) under grant ANR-21-CE31-0009 (France); BMBF, DFG, HGF, MPG, and AvH Foundation (Germany); Department of Atomic Energy under Project Identification No. RTI 4002, Department of Science and Technology, and UPES SEED funding programs No. UPES/R&D-SEED-INFRA/17052023/01 and No. UPES/R&D-SOE/20062022/06 (India); Israel Science Foundation Grant No. 2476/17, U.S.-Israel Binational Science Foundation Grant No. 2016113, and Israel Ministry of Science Grant No. 3-16543; Istituto Nazionale di Fisica Nucleare and the Research Grants BELLE2; Japan Society for the Promotion of Science, Grant-in-Aid for Scientific Research Grants No. 16H03968, No. 16H03993, No. 16H06492, No. 16K05323, No. 17H01133, No. 17H05405, No. 18K03621, No. 18H03710, No. 18H05226, No. 19H00682, No. 20H05850, No. 20H05858, No. 22H00144, No. 22K14056, No. 22K21347, No. 23H05433, No. 26220706, and No. 26400255, the National Institute of Informatics, and Science Information NETwork 5 (SINET5), and the Ministry of Education, Culture, Sports, Science, and Technology (MEXT) of Japan; National Research Foundation (NRF) of Korea Grants No. 2016R1D1A1B02012900, No. 2018R1A2B3003643, No. 2018R1A6A1A06024970, No. 2019R1I1A3A01058933, No. 2021R1A6A1A03043957, No. 2021R1F1A1060423, No. 2021R1F1A1064008, No. 2022R1A2C1003993, and No. RS-2022-00197659, Radiation Science Research Institute, Foreign Large-Size Research Facility Application Supporting project, the Global Science Experimental Data Hub Center of the Korea Institute of Science and Technology Information and KREONET/GLORIAD; Universiti Malaya RU grant, Akademi Sains Malaysia, and Ministry of Education Malaysia; Frontiers of Science Program Contracts No. FOINS-296, No. CB-221329, No. CB-236394, No. CB-254409, and No. CB-180023, and SEP-CINVESTAV Research Grant No. 237 (Mexico); the Polish Ministry of Science and Higher Education and the National Science Center; the Ministry of Science and Higher Education of the Russian Federation and the HSE University Basic Research Program, Moscow; University of Tabuk Research Grants No. S-0256-1438 and No. S-0280-1439 (Saudi Arabia); Slovenian Research Agency and Research Grants No. J1-9124 and No. P1-0135; Agencia Estatal de Investigacion, Spain Grant No. RYC2020-029875-I and Generalitat Valenciana, Spain Grant No. CIDEGENT/2018/020; National Science and Technology Council, and Ministry of Education (Taiwan); Thailand Center of Excellence in Physics; TUBITAK ULAKBIM (Turkey); National Research Foundation of Ukraine, Project No. 2020.02/0257, and Ministry of Education and Science of Ukraine; the U.S. National Science Foundation and Research Grants No. PHY-1913789 and No. PHY-2111604, and the U.S. Department of Energy and Research Awards No. DE-AC06-76RLO1830, No. DE-SC0007983, No. DE-SC0009824, No. DE-SC0009973, No. DE-SC0010007, No. DE-SC0010073, No. DE-SC0010118, No. DE-SC0010504, No. DE-SC0011784, No. DE-SC0012704, No. DE-SC0019230, No. DE-SC0021274, No. DE-SC0021616, No. DE-SC0022350, No. DE-SC0023470; and the Vietnam Academy of Science and Technology (VAST) under Grants No. NVCC.05.12/22-23 and No. DL0000.02/24-25.
These acknowledgements are not to be interpreted as an endorsement of any statement made by any of our institutes, funding agencies, governments, or their representatives.
We thank the SuperKEKB team for delivering high-luminosity collisions; the KEK cryogenics group for the efficient operation of the detector solenoid magnet; the KEK computer group and the NII for on-site computing support and SINET6 network support; and the raw-data centers at BNL, DESY, GridKa, IN2P3, INFN, and the University of Victoria for off-site computing support.
References
- Workman et al. (2022) R. L. Workman et al. (Particle Data Group), PTEP 2022, 083C01 (2022).
- Grossman and Worah (1997) Y. Grossman and M. P. Worah, Phys. Lett. B 395, 241 (1997), arXiv:hep-ph/9612269 .
- Kobayashi and Maskawa (1973) M. Kobayashi and T. Maskawa, Prog. Theor. Phys. 49, 652 (1973).
- Carter and Sanda (1980) A. B. Carter and A. I. Sanda, Phys. Rev. Lett. 45, 952 (1980).
- Carter and Sanda (1981) A. B. Carter and A. I. Sanda, Phys. Rev. D 23, 1567 (1981).
- Bigi and Sanda (1981) I. I. Y. Bigi and A. I. Sanda, Nucl. Phys. B 193, 85 (1981).
- Note (1) The coefficients are written elsewhere.
- Cheng et al. (2005) H. Y. Cheng, C. K. Chua, and A. Soni, Phys. Rev. D 72, 094003 (2005), arXiv:hep-ph/0506268 .
- Kang et al. (2021) K. H. Kang et al. (Belle Collaboration), Phys. Rev. D 103, 032003 (2021), arXiv:2011.00793 [hep-ex] .
- Lees et al. (2012) J. P. Lees et al. (BaBar Collaboration), Phys. Rev. D 85, 054023 (2012), arXiv:1111.3636 [hep-ex] .
- Amhis et al. (2023) Y. S. Amhis et al. (HFLAV Collaboration), Phys. Rev. D 107, 052008 (2023), arXiv:2206.07501 [hep-ex] .
- Akai et al. (2018) K. Akai, K. Furukawa, and H. Koiso (SuperKEKB), Nucl. Instrum. Meth. A907, 188 (2018), arXiv:1809.01958 [physics.acc-ph] .
- Abe et al. (2010) T. Abe et al. (Belle II Collaboration), (2010), arXiv:1011.0352 [physics.ins-det] .
- Adamczyk et al. (2022) K. Adamczyk et al. (Belle II SVD Collaboration), JINST 17, P11042 (2022), arXiv:2201.09824 [physics.ins-det] .
- Kotchetkov et al. (2019) D. Kotchetkov et al., Nucl. Instrum. Meth. A 941, 162342 (2019), arXiv:1804.10782 [physics.ins-det] .
- Lange (2001) D. J. Lange, Proceedings, 7th International Conference on B physics at hadron machines (BEAUTY 2000): Maagan, Israel, September 13-18, 2000, Nucl. Instrum. Meth. A462, 152 (2001).
- Sjöstrand et al. (2015) T. Sjöstrand, S. Ask, J. R. Christiansen, R. Corke, N. Desai, P. Ilten, S. Mrenna, S. Prestel, C. O. Rasmussen, and P. Z. Skands, Comput. Phys. Commun. 191, 159 (2015), arXiv:1410.3012 [hep-ph] .
- Jadach et al. (2000) S. Jadach, B. F. L. Ward, and Z. Was, Comput. Phys. Commun. 130, 260 (2000), arXiv:hep-ph/9912214 [hep-ph] .
- Agostinelli et al. (2003) S. Agostinelli et al., Nucl. Instrum. Meth. A506, 250 (2003).
- Kuhr et al. (2019) T. Kuhr, C. Pulvermacher, M. Ritter, T. Hauth, and N. Braun (Belle II Framework Software Group), Comput. Softw. Big Sci. 3, 1 (2019), arXiv:1809.04299 [physics.comp-ph] .
- (21) Belle II Collaboration, “Belle ii analysis software framework (basf2),” Zenodo.
- Lee et al. (2003) S. H. Lee et al. (Belle Collaboration), Phys. Rev. Lett. 91, 261801 (2003), arXiv:hep-ex/0308040 .
- Abudinén et al. (2022) F. Abudinén et al. (Belle II Collaboration), Eur. Phys. J. C 82, 283 (2022), arXiv:2110.00790 [hep-ex] .
- Adachi et al. (2023) I. Adachi et al. (Belle II Collaboration), (2023), The calibration described in this note has been updated with the larger dataset used in the present analysis., arXiv:2302.12898 [hep-ex] .
- Abudinen et al. (2023) F. J. Abudinen et al. (Belle II Collaboration), Phys. Rev. D 107, L031103 (2023), arXiv:2208.08573 [hep-ex] .
- Krohn et al. (2020) J. F. Krohn et al. (Belle II Analysis Software Group), Nucl. Instrum. Meth. A 976, 164269 (2020), arXiv:1901.11198 [hep-ex] .
- Dey and Soffer (2020) S. Dey and A. Soffer, Springer Proc. Phys. 248, 411 (2020).
- Gaiser (1982) J. Gaiser, Charmonium Spectroscopy from Radiative Decays of the and , Ph.D. thesis, Stanford University (1982).
- Skwarnicki (1986) T. Skwarnicki, A study of the radiative CASCADE transitions between the Upsilon-Prime and Upsilon resonances, Ph.D. thesis, Cracow, INP (1986).
- Albrecht et al. (1990) H. Albrecht et al. (ARGUS Collaboration), Phys. Lett. B 241, 278 (1990).
- James and Roos (1975) F. James and M. Roos, Comput. Phys. Commun. 10, 343 (1975).
- Tajima et al. (2004) H. Tajima et al., Nucl. Instrum. Meth. A 533, 370 (2004), arXiv:hep-ex/0301026 .
- Punzi (2003) G. Punzi, eConf C030908, WELT002 (2003), arXiv:physics/0401045 .
- Pivk and Le Diberder (2005) M. Pivk and F. R. Le Diberder, Nucl. Instrum. Meth. A 555, 356 (2005), arXiv:physics/0402083 .
- Long et al. (2003) O. Long, M. Baak, R. N. Cahn, and D. P. Kirkby, Phys. Rev. D 68, 034010 (2003), arXiv:hep-ex/0303030 .
- Feldman and Cousins (1998) G. J. Feldman and R. D. Cousins, Phys. Rev. D 57, 3873 (1998), arXiv:physics/9711021 .