Examining Lyman-alpha Emitters through MillenniumTNG in anticipation of DESI-II
Abstract
The new frontier of cosmological experiments will be aimed at targeting galaxies at higher redshifts. The goal of this study is to conduct a timely analysis of the high-redshift star-forming galaxy populations, which will be informative in designing next-generation experiments and their extragalactic targets. We use the hydrodynamical simulation MillenniumTNG (MTNG) to model Lyman-alpha Emitting (LAE) galaxies to extract key properties such as their clustering and occupation statistics. We define LAEs through an empirical relation between star formation rate (SFR) and Lyman-alpha flux. We also explore two other definitions, finding that imposing an additional cut on the maximum stellar mass of the galaxy sample, which approximates the effect of a low escape fraction at high halo mass, leads to a 5-10% decrease of the linear bias of the population. As expected, we find that the HOD mass parameters rapidly (and logarithmically) decrease with increasing number density. Additionally, the HOD parameter also decreases with number density, implying that the SFR-halo mass relationship becomes tighter for low-luminosity objects. Surprisingly, the non-linear clustering, estimated by the parameter , is fixed at fixed number density across the two redshifts we study, whereas the linear bias parameter varies with redshift as , suggesting that our LAE samples are relatively stable and long-lived. Finally, we study the amount of galaxy assembly bias present at and find that while at it is roughly 10%, at it decreases significantly to 5%. This suggests that assembly bias effects become less important at high likely due to the lower number of cumulative two-halo interactions (mergers, splashback, stripping, etc.). While our study is based on a single full-physics simulation, we expect our results to reflect qualitatively the properties of LAEs in the Universe. We demonstrate that our findings are in good agreement with previous results in the literature using both observations and simulations.
I Introduction
Thanks to the influx of high-volume, high-quality observational data in the next decade, photometric and spectroscopic galaxy surveys such as the Dark Energy Survey [DES, 1, 2], the Dark Energy Spectroscopic Instrument [DESI, 3], Euclid [4], the Vera Rubin Observatory [Rubin 5] and Nancy Grace Roman Space Telescope [Roman, 6, 7] will provide an extraordinary opportunity to stress test the current cosmological paradigm and improve our models of galaxy formation and evolution. The ‘golden standard’ of spectroscopic galaxy surveys is the analysis of the baryon acoustic oscillations (BAO) peak [8], which enables the extraction of cosmological information from the large-scale clustering of galaxies. However, an alternative path to unraveling the long-standing mysteries of dark matter, dark energy, gravity, and neutrinos lies in the decade scale between the BAO scale and the non-linear scale, which upcoming surveys will measure with exquisite precision.
The small-scale signal encodes the relationship between galaxies and the underlying dark matter distribution, which can help us refine our understanding of galaxy formation and evolution and also quantify the impact of small-scale physics on the large scales used in cosmological analysis. Most standard methods for modeling the small-scale galaxy distribution rely on the tenet that galaxy formation requires a gravitationally-bound dark matter halo or subhalo to accumulate and condense gas [9, 10, 11, 12, 13, 14, 15].
The most prominent examples of such galaxy-(sub)halo models are the halo occupation distribution model [HOD, 13, 14, 16, 17] and the subhalo abundance matching model [SHAM, 18, 19, 20, 21, 22, 23]. The HOD prescription takes as input the average number of central and satellite galaxies in a given halo as a function of halo mass and outputs a summary statistic of interest or a galaxy catalog. On the other hand, SHAM connects galaxies to dark matter subhalos assuming a (typically) monotonic relation between a galaxy property such as stellar mass or star formation rate and a subhalo dark-matter property such as maximum circular velocity. Both methods come with well-known shortcomings when fitting observational and simulated data [e.g., 24, 25, 26, 27, 28, 29]. For reviews on modeling the galaxy-halo connection and dark-matter simulations, see Wechsler and Tinker [30], Angulo and Hahn [31]
One of the main limitations of these empirical models is their handling of the effect of ‘galaxy assembly bias’ [32]. Galaxy assembly bias refers to a manifestation of a discrepancy between the actual distribution of galaxies and one inferred from dark matter halos using their present-day mass alone [e.g., 33]. Additional halo properties, for example halo formation time, local environment, concentration, triaxiality, spin, or velocity dispersion need to be considered to describe the clustering correctly. The standard implementation of the popular HOD model does not consider halo properties apart from mass, and hence completely neglects galaxy assembly bias. Similarly, the baseline SHAM model does not take baryonic effects such as tidal stripping and disruption into consideration, which affect subhalos in -body and hydro simulations differently and may thus distort the subhalo properties in the presence of baryons [see e.g., 34].
As ongoing experiments exhaust the potential of these measurements at low redshift, the next-generation of planned experiments will target the high-redshift Universe. One of these new-frontier experiments is DESI-II, the successor of DESI, which will provide clean low-noise measurements of large-scale observables deep into the past of our Universe. As measurements of the clustering at high redshifts have not been featured extensively in precision cosmology studies, various details about the galaxy-halo connection of the targeted galaxy populations warrant careful theoretical modeling. Luckily, recent progress in the realm of hydrodynamical simulations, which provide a plausible picture of the real Universe, offer an exciting venue for obtaining high-fidelity models of the high-redshift Universe.
Hydrodynamical simulations [e.g., 35, 36, 37, 38, 39, 40] simulate the dark matter component along with the gas and stars. In this type of simulations, baryonic and galaxy processes are tracked by a combination of fluid equations and subgrid models, which renders them too expensive to run in the volumes needed to analyze modern galaxy surveys. Nonetheless, they can still provide invaluable insight into how and where galaxies form in relation to their dark-matter hosts. In this study, we employ the new full-physics simulation MillenniumTNG (MTNG), which has comparable resolution to the largest simulation from the IllustrisTNG suite, TNG300-1, but offers a factor of 15 improvement in the volume [for a review of the IllustrisTNG project, see 39]. The improved statistics open up the possibility of selecting galaxy samples with lower number densities, making MTNG an ideal testing ground for developing and validating various theoretical tools in anticipation of the future high-redshift galaxy surveys.
The Lyman-alpha (Ly) emission line is commonly observed in the spectra of high-redshift galaxies [e.g., 41, 42, 43]. Detections of Ly emitting galaxies (LAEs) in large numbers at using narrow-band filters have opened up a new window for probing cosmology at earlier epochs. In this paper, we address the long-standing question of modeling the large-scale properties of LAEs at and 3, a regime that is of interest to future wide-field surveys. Our goal is to conduct a timely analysis of the high-redshift star-forming galaxy populations, which we hope will be informative in designing the next-generation experiments and their extragalactic targets. While our study is based on the MTNG740 simulation, we expect our results to reflect qualitatively the properties of the real Universe. An overview of the full simulation suite of MillenniumTNG and an analysis of its matter clustering and halo statistics is given in Hernández-Aguayo et al. [44], while Pakmor et al. [45] provide a detailed description of the hydro simulation together with an examination of the properties of its galaxy clusters. Further introductory papers present analyses of high-redshift galaxies [46], weak gravitational lensing [47], intrinsic alignment [48], galaxy clustering [49], cosmological inference from galaxy clustering [50], one- and two-halo term analysis [51, 52], and semi-analytic galaxies on the light cone [53].
This paper is organized as follows. In Section II, we describe the MTNG740 hydrodynamical simulation and provide details about our LAE selection procedure as well as basic definitions of the large-scale statistics used in our study. In Section III, we discuss our main findings pertaining to the galaxy-halo modeling, linear bias, redshift-space clustering and assembly bias properties of our LAE samples. Finally, in Section V, we summarize our main results and put our work into perspective, providing a qualitative comparison with similar studies performed in simulations and observations.
II Methods
II.1 The MillenniumTNG simulations
The aim of the MillenniumTNG project is to provide a set of numerical simulations that make accurate predictions about the complex interaction between galaxy processes and large-scale structure in sufficiently large volumes. While the full simulation suite consists of several hydrodynamical and -body simulations at various resolutions and box sizes, here we employ only one of these products, namely, the largest available full-physics box, MTNG740. This simulation contains resolution elements in a comoving volume of , which corresponds to a mass resolution of in the baryons and in the dark matter. Throughout this paper, we refer to this simulation as MTNG for simplicity.
The physics and cosmology model of MTNG echoes that of IllustrisTNG [54, 55, 56, 57, 58, 59, 60, 61, 62], with a resolution comparable to but slightly lower than that of the largest IllustrisTNG box, TNG300-1. MTNG also uses the same hydrodynamical moving-mesh code AREPO [63], a main feature of which is the use of a Voronoi tessellation for the construction of the computational mesh. Haloes (groups) in MTNG are identified by applying the standard friends-of-friends [FoF, 64] algorithm to the dark matter particles, adopting a linking length of (in units of the mean interparticle distance). Gravitationally bound substructures in halos are identified with the SUBFIND-HBT algorithm described in Springel et al. [65].
We derive the two quantities halo mass and halo radius as the total mass (and corresponding radius) enclosed in a sphere around the halo center with mean density times the critical density of the Universe. is defined using the generalized solution of the collapse of a spherical top-hat perturbation in a low-density universe and fit by the polynomial function [66]:
| (1) |
where , and is the matter energy density at redshift .
II.2 Halo occupation distribution
One way to quantify the connection between galaxies and the underlying dark-matter distribution is through the halo occupation distribution (HOD). Studying the HOD of a given galaxy population can provide us with vital insight on cosmic formation and evolution. The HOD is usually studied separately for the central and satellite populations. The central galaxies are typically bright galaxies located in the center of their respective dark matter halo. Thus, for a given halo, there will either be zero or one central galaxy. In contrast, satellite galaxies orbit around the central galaxy. A given halo can have anywhere between 0 and 100 satellite galaxies. The HOD predicts the average number of central and satellite galaxies, respectively, as a function of halo mass.
The distribution of central and satellite galaxies for magnitude-limited and red galaxies can be modeled using the formalism of Zheng et al. [67]:
| (2) |
| (3) |
Where roughly represents the mass threshold at which halos can form a central galaxy, denotes how quickly the central galaxy slope transitions between zero and one, is the cut-off mass at which halos can host satellite galaxies, is a normalization factor, and represents the slope of the satellite galaxy curve. In our analysis we use as our mass proxy (see Eq. 1).
In this study, we are interested in modeling Lyman-alpha emitting galaxies (LAEs), the HOD of which is not well constrained. We will show that the formalism of Zheng et al. [67] works well for the most simplistic method of selecting those galaxies in MTNG.
II.3 Galaxy selection
In this section, we summarize the different methods we employ in this study to select LAEs.
Since LAEs often contain young and massive stars, a good proxy for selecting these galaxies from simulations is the star formation rate (SFR). However, there are several other factors that can influence their identification, including the escape fraction, equivalent width and radiative transfer effects [68]. In addition, because Ly scatters through the ISM and IGM, it is difficult to determine the amount of extinction, whereas SFR derived from the UV flux density is likely more stable. For this reason, we use the relation from Dijkstra and Westra [69] to approximate the Ly SFR:
| (4) |
where is a random variable drawn from the logarithmic probability distribution function:
| (5) |
where and for . We can express the Lyman-alpha luminosity () as:
| (6) |
The observable quantity through which LAEs are typically selected is the Lyman-alpha flux, , defined as:
| (7) |
where is the luminosity distance to an object at some particular redshift. In this work, we will consider LAEs at and 3. As future high-redshift observatories such as DESI-II begin to prepare for the target selection of LAEs, in this work, we explore a range of threshold values in an effort to inform these future efforts.
LAEs may be selected by an additional cut in rest-frame equivalent width (REW). As some future missions are considering making such a selection, we also examine how a cut in REW affects the LAE clustering and occupation statistics. We obtain a proxy to the REW as follows:
| (8) |
where , Å, and is defined in Eqs. 4, 5. We note that ideally REW would be tied to the internal properties of the galaxy, however such detailed modeling is beyond the scope of this work, and we leave a more realistic modeling of that effect for future investigations that utilize radiative transfer simulations. Finally, since our galaxies also lack dust, we test the effect of applying an upper threshold cut in stellar mass, which mimics the effect of lower escape fractions at higher halo masses [71]. To summarize, we construct three different samples defined below:
-
•
Default: Our default sample consists of applying a flux cut, . In particular, future surveys such as DESI-II will likely apply a cut in the range of and . The corresponding number densities are and , respectively. Our default sample is the mid-point flux threshold of , corresponding to a number density of at redshift of and at . In later sections, we study how the parameters change as we vary this threshold.
-
•
Default REW: We next construct a sample, which in addition to the default cut, has an REW cut of Å, which is equivalent to imposing a cut of . We effectively remove 39572 galaxies and obtain a corresponding number density of . Given our model for the equivalent width (see Eq. 5), this process is equivalent to a ‘random downsampling’ of objects with probability .
-
•
Default stellar mass: Finally, we study the effect of applying a stellar mass maximum threshold instead of an REW cut, such that the number of galaxies remains the same as in the previous selection, default REW. This corresponds to a stellar mass cut of and a number density of .
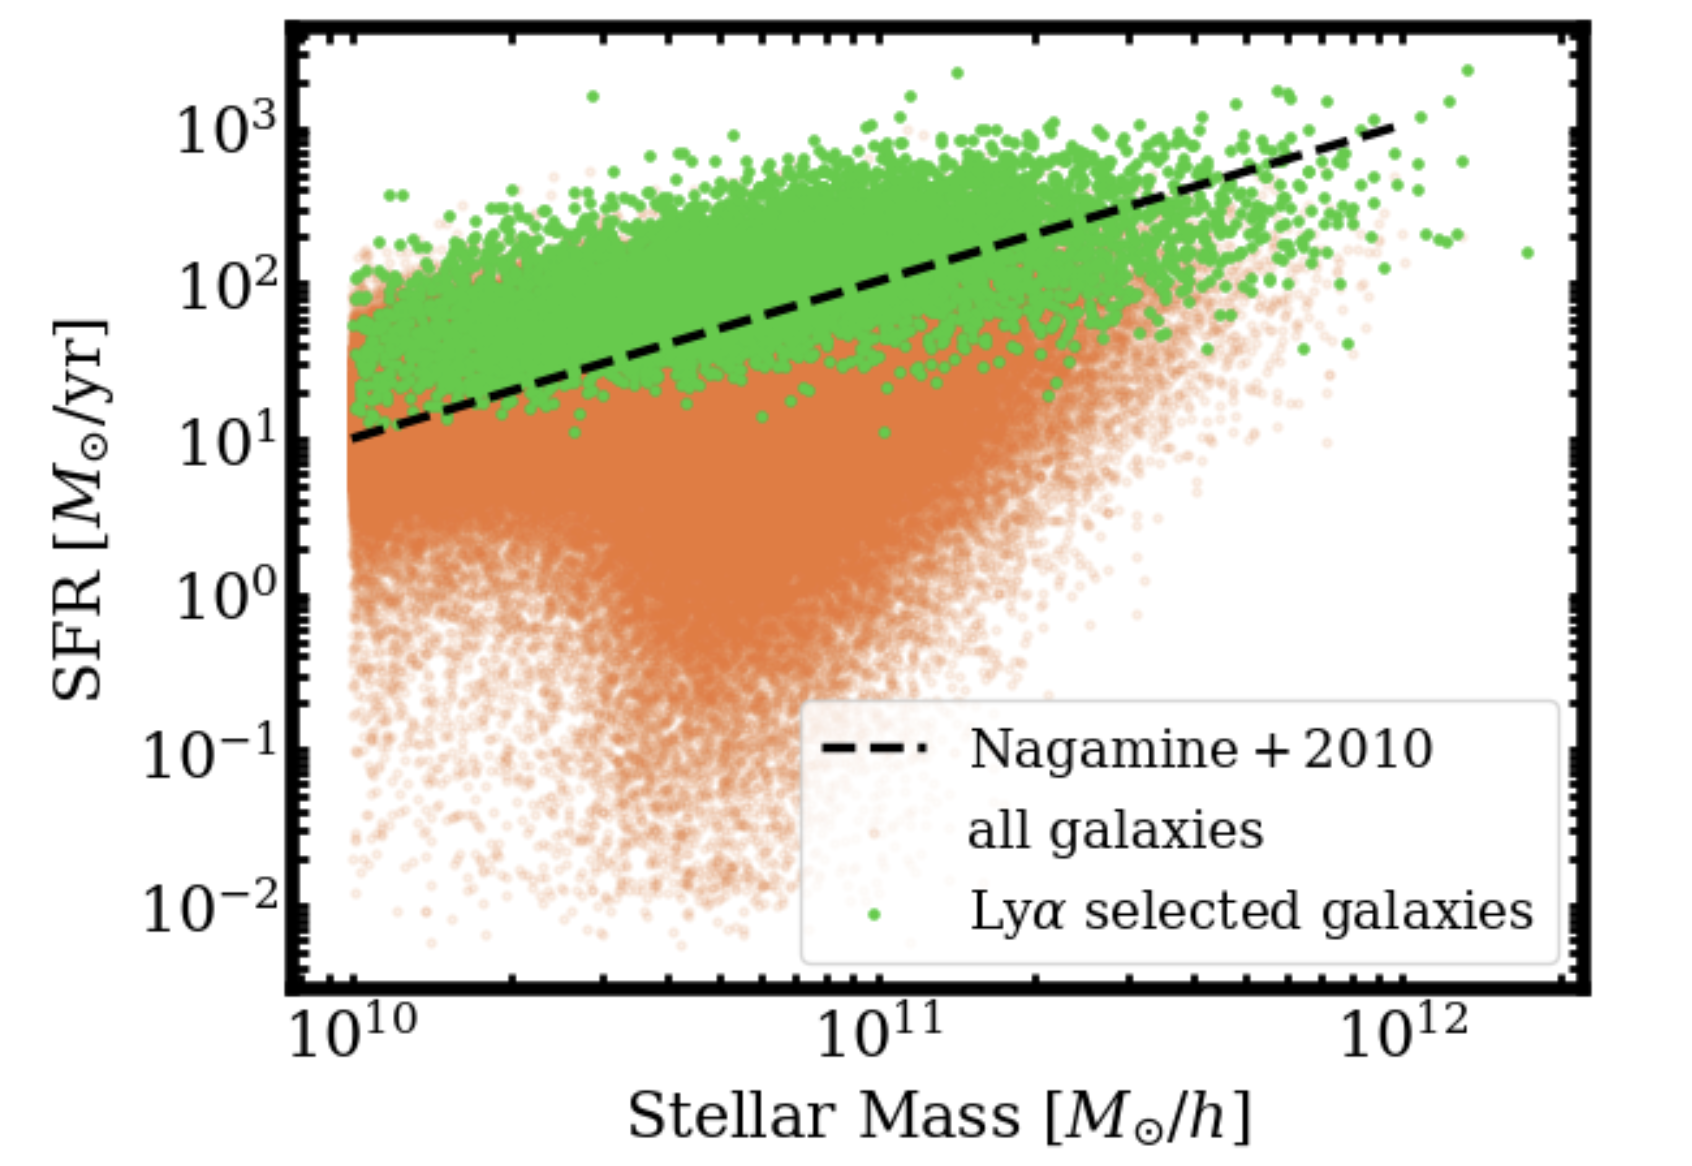
We show a scatter plot of SFR and stellar mass at in Fig. 1, which illustrates the default galaxy selection ( ). We find that it occupies the upper region in the plot, which corresponds to highly star-forming galaxies, as expected. Due to the correlation of these two quantities, we see that our approximate cut on SFR also predominantly selects galaxies with large stellar masses. We also show a comparison to the mean SFR-stellar mass curve for LAEs from Nagamine et al. [70] and find that it is in very good agreement with the galaxies we have identified as LAEs in MTNG.
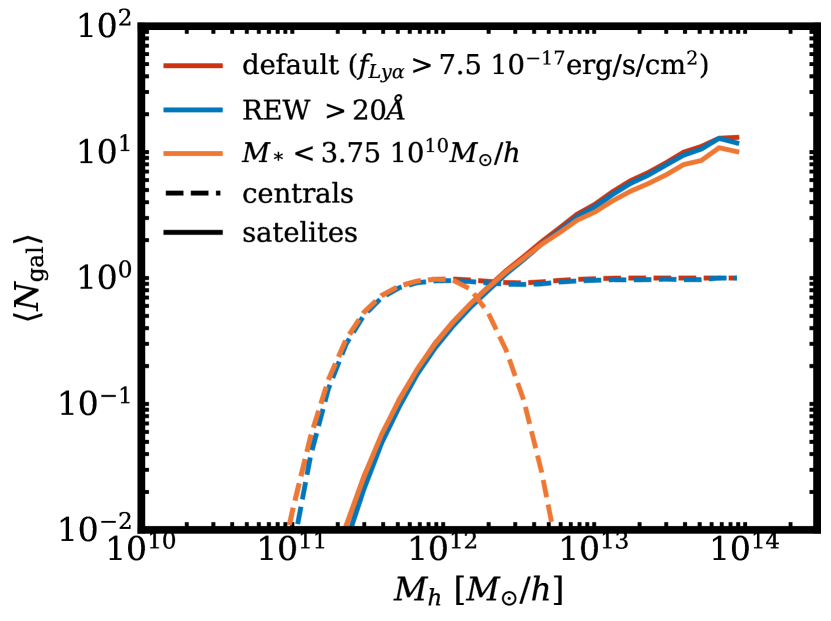
In Fig. 2, we examine the occupation statistics of our three samples at . We see that the HOD of the default and the default REW samples are very similar to each other and well-approximated by the Zheng et al. [67] formalism. Since the REW cut effectively downsamples the number of galaxies in the selection, the main impact on the HOD is to slightly lower the occupation distribution of the centrals and satellites. On the other hand, the maximum stellar mass selection has noticeably different central occupation distribution. Namely, the HOD of the centrals declines steeply past , since the majority of stellar massive galaxies live in massive halos. While there is some obscuration of high-mass halos, it is likely that our rather simplistic treatment leads to a more exaggerated effect. The default stellar mass sample can thus give us a rough estimate of the maximum effect of dust obscuration on the HOD and clustering of LAEs. We plan to examine other strategies in future work.
II.4 Clustering statistics
Another quantity that allows us to study LAEs and extract information about their large-scale distribution is the correlation function. In a cubic box with periodic boundary conditions, we can obtain the correlation function in real space using the natural estimator as:
| (9) |
is the normalized number of galaxy pairs in a spherical shell at a distance , and is the normalized number of pairs in the same spherical shell for a randomly generated galaxy sample. We can split the obtained correlation function into a ‘one-halo’ and a ‘two-halo’ piece, where the ‘one-halo’ piece receives contributions from within the halo (i.e., central-satellite and satellite-satellite pairs in the same halo), whereas the ‘two-halo’ piece comes from central-central, central-satellite, satellite-satellite in two distinct halos.
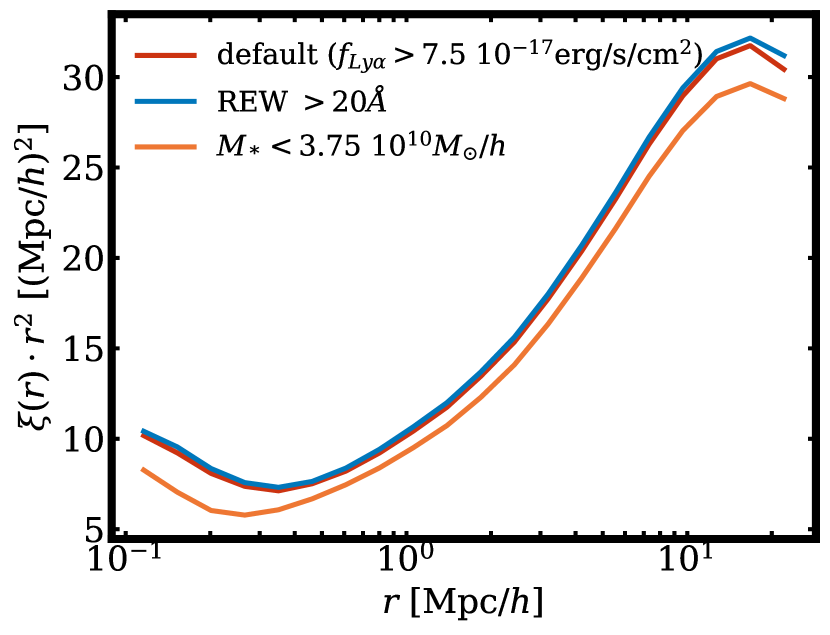
In Fig. 3, we display the correlation function for the three LAE samples defined in Section II.3. Similarly to Fig. 2, we find that the default and the default REW samples result in almost indistinguishable correlation functions. The small difference that we see can be attributed to the slight shift of central and satellite occupations towards higher halo masses (and thus higher linear bias) when we apply the REW cut. The default stellar mass sample, on the other hand, has two distinctive features. On one hand, the amplitude (linear bias) is lower on large scales by roughly 5-10% due to the elimination of some of the most massive (and thus most clustered) halos when we impose the stellar mass cut. On the other, the one-halo term is more reduced and shifted towards smaller values of the pair distance , as our maximum stellar mass cut has reduced the mean halo mass and thus halo radius to smaller values, curtailing the range of the one-halo term (which scales as the mean virial radius of the host halos).
Using the galaxy correlation function, we define the galaxy bias in real space as
| (10) |
where is the non-linear correlation function of the matter distribution, which in our case, is obtained from the downsampled dark matter particles in the dark-matter-only counterpart to MTNG-740. Over a range of scales near the non-linear scale, the correlation function can be modeled by a power law with a slope of . In this work, we will hold this slope fixed and can thus approximately express the clustering on quasi-linear scales as:
| (11) |
where is a characteristic amplitude, which is effectively also a measure of the linear bias. Throughout this work, we quote the linear bias as the value of at and fit by using Eq. 11 as our model via curvefit. The large-scale bias should hold on large, linear scales while the power-law form holds in the non-linear regime. Our choice of scale is thus a compromise between these two regimes.
II.5 Redshift space distortions
In reality, when measuring the 3D distribution of galaxies, we always observe them in redshift-space, where the redshift information of a given galaxy contains both a Hubble flow as well as a peculiar velocity term. The observed redshift of a galaxy can be expressed as the sum of two components:
| (12) |
where is the scale factor, is the speed of light, is the component of the ‘peculiar velocity’ along the line-of-sight (LOS) and is the cosmological redshift. This second term results from the proper motion of the galaxies and contributes a shift to their apparent comoving positions, given by
| (13) |
where is the Hubble parameter at . We refer to this distortion in the galaxy density field along the LOS as redshift space distortions (RSDs).
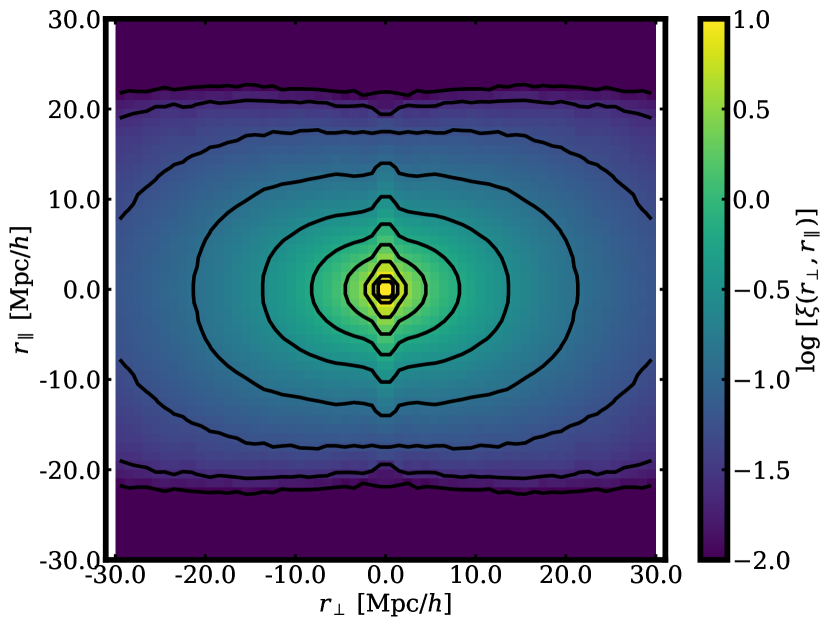
The RSD effects distort the observed coordinates in the LOS direction, so we can consider the clustering signal, , as a function of two variables: the LOS separation, , and the separation transverse to the LOS, . We show the clustering signal of our default sample (see Sec. II.3) in Fig. 4, which has two main features: ‘squashing’ in the LOS direction on large scales () due to the reduction in apparent separation between pairs of galaxies, and ‘stretching’ on small scales (i.e., at ) due to the thermal motions of the galaxies within their dark matter halo hosts. We refer to these as the Kaiser and the Finger-of-God effects, which are caused by the infall of galaxies into clusters and the virial motions of galaxies within the halo, respectively [see e.g., 72]. In subsequent sections, we examine the amplitude of the LAE redshift-space effects. We look at these redshift distortion effects for default + REW and default stellar mass selection processes, which are outlined in section IIC. While Fig. 4, gives us a nice qualitative understanding of these ‘squashing’ and ‘stretching’ effects, it is easier to understand this phenomena through plotting the Legendre multipoles:
| (14) |
due to the fact that the majority of redshift space information can be accessed by measuring the first three even multipoles (). Here, is the redshift space separation, , denotes the cosine angle of the galaxy pair with respect to the line of sight, and is the Legendre polynomial of order .
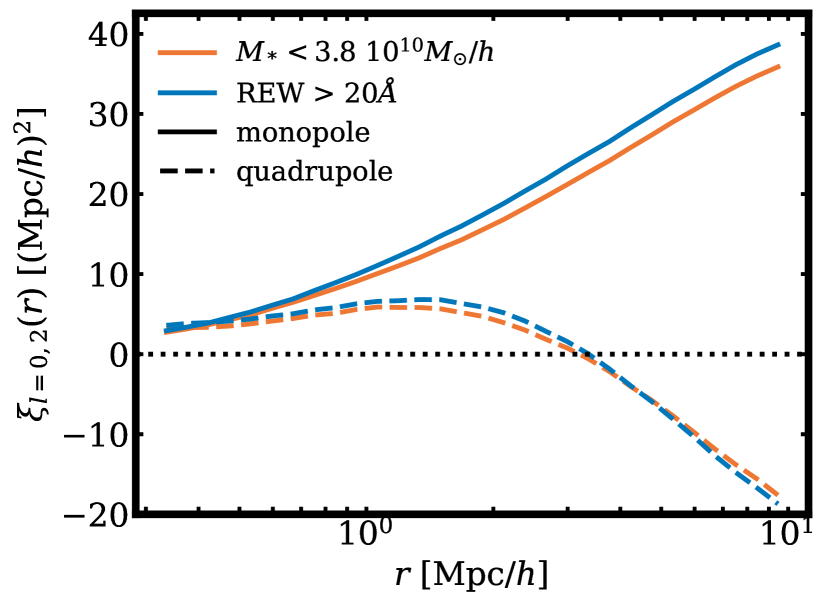
The correlation function multipoles for our three samples (see Section II.3) at shown in Fig. 5. The monopole signal () measures the isotropic clustering, while the quadrupole signal () measures the non-isotropic signal due to LOS (Finger-of-God and Kaiser) effects. For both the default and default REW samples, we find the quadrupole crosses zero at . This feature is important to note as this crossover happens at a much lower value in comparison to luminous red galaxies (LRGs), where the crossover happens at around [72]. This difference suggests that the Finger-of-God effects for LAEs are weaker. Between the two selection processes, we see that the default stellar mass sample has a slightly lower crossing point and a slightly lower amplitude, meaning the Finger-of-God effects are slightly weaker for that sample. We surmise that this difference is the result of the lower mean halo mass of the default stellar mass sample, which implies smaller virial velocities of the galaxies and thus smaller Finger-of-God effects. On large scales, we see that the quadrupole signal for both samples is pretty similar, whereas the monopole is smaller for the default stellar mass sample, suggesting that the amount of anistropicity for that sample is larger. This is generally expected for lower-mass samples.
III Results
III.1 HOD parameters
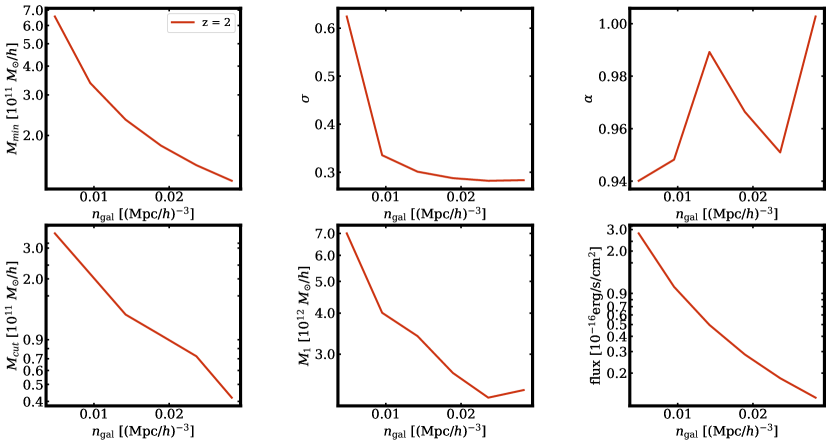
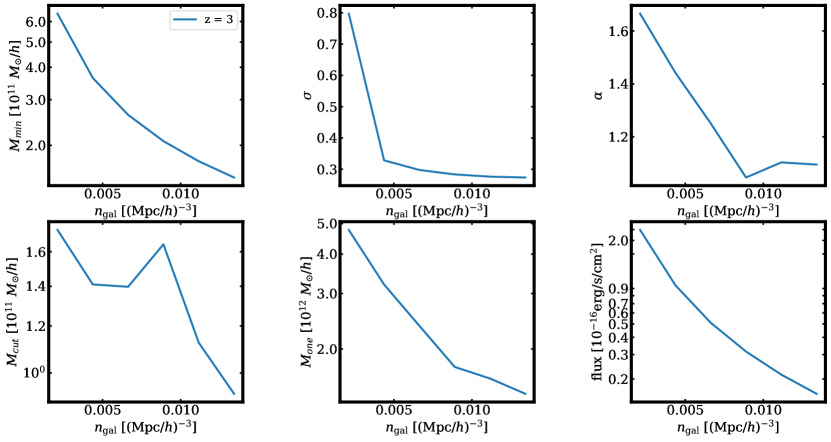
In Fig. 6 and Fig. 7, we show the variation of the five standard HOD parameters from the Zheng et al. [67] formalism with number density, which have been fit via scipy’s curvefit function. In the last panel (lower right) in each figure, we also show the relation between number density and Ly flux. Overall, we find a rapid (logarithmic) decrease with number density for all three mass-based HOD parameters (, , and ). Qualitatively, that is expected, as when we go to lower luminosities (fluxes), we include more low-mass halos, whose biases are also lower (see Table 1 and the following section on clustering). These findings hold true in the case of , though we find that the fits for the parameter are a bit more noisy. Interestingly, the parameter , controlling the rate at which the HOD of the centrals transitions from zero to one, also drops very rapidly with number density. This suggests that the SFR () and halo mass relation becomes tighter, as we include more low-luminosity galaxies. Another striking feature is the behavior of the parameter , which determines the power-law slope of the satellite occupation distribution. While at , it takes a stable value of (note for magnitude-limited and stellar-mass-selected samples), at it varies between 1.7 and 1.1. Upon close inspection, we find that these differences are due to the fact that lower-density probes do not exhibit the typical broken power-law behavior expected of satellites in the Zheng et al. [67] HOD model. These high values for imply that when performing fits to data from upcoming surveys, one might need to free the prior on that parameter and allow the analysis chains to explore a broader parameter space.
III.2 Galaxy clustering
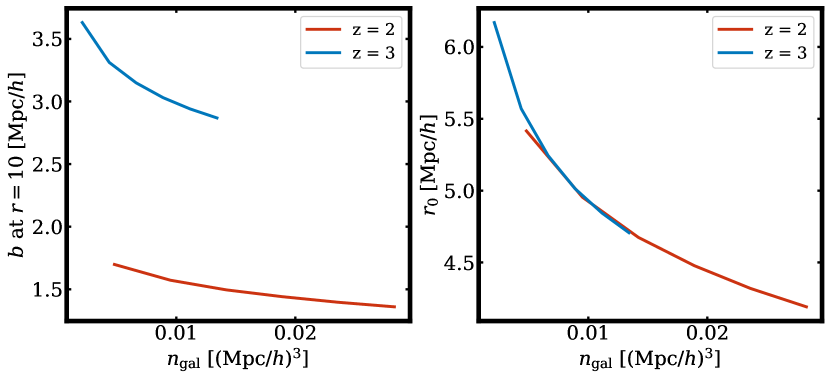
Similarly to the previous section where we studied how the standard HOD parameters vary as a function of number density, here we extend the analysis to some clustering statistics such as the linear bias, (Eq. 10), and the power-law amplitude, (Eq. 11). As before, the number densities shown correspond to a range of flux cuts between and at redshifts . The results are shown in Fig. 8. As expected, both bias parameters decrease as a function of number density, since the high-number density samples include a larger fraction of low-mass halos, which trace regions of lower density. Furthermore, we see that the linear bias is larger at than at . This is because at higher redshifts, high-bias objects are even rarer, resulting in a larger linear bias. We see a very similar trend in values: decreases as a function of number density and is larger at higher redshifts. However, unlike the case of the linear bias parameter, the values overlap at and at fixed number density.
| [Mpc-3] | [ ] | – | [ ] | [ ] | – | [ s-1 erg/cm2] | – | [] |
| 0.00481 | 6.57 | 0.62 | 3.64 | 7.00 | 0.94 | 2.79 | 1.71 | 5.43 |
| 0.00951 | 3.38 | 0.34 | 2.14 | 4.01 | 0.95 | 1.02 | 1.58 | 4.96 |
| 0.0142 | 2.34 | 0.30 | 1.25 | 3.41 | 0.99 | 0.50 | 1.50 | 4.67 |
| 0.0189 | 1.81 | 0.29 | 0.95 | 2.63 | 0.97 | 0.28 | 1.44 | 4.47 |
| 0.0236 | 1.49 | 0.28 | 0.72 | 2.21 | 0.95 | 0.18 | 1.40 | 4.32 |
| 0.0283 | 1.27 | 0.28 | 0.42 | 2.33 | 1.00 | 0.13 | 1.36 | 4.19 |
| 0.00211 | 6.43 | 0.79 | 1.74 | 4.77 | 1.67 | 2.38 | 3.63 | 6.17 |
| 0.00437 | 3.65 | 0.33 | 1.41 | 3.20 | 1.44 | 0.95 | 3.31 | 5.57 |
| 0.00663 | 2.62 | 0.30 | 1.40 | 2.37 | 1.25 | 0.50 | 3.15 | 5.24 |
| 0.00889 | 2.08 | 0.28 | 1.65 | 1.75 | 1.05 | 0.32 | 3.03 | 5.01 |
| 0.0112 | 1.74 | 0.28 | 1.12 | 1.61 | 1.10 | 0.21 | 2.94 | 4.84 |
| 0.0134 | 1.50 | 0.27 | 0.92 | 1.44 | 1.10 | 0.16 | 2.87 | 4.70 |
We provide an intuitive explanation for why that might be the case as follows. At these redshifts, the star-forming population of galaxies (which we select to be our default LAE-like sample) also has a large stellar mass (see Fig. 1). By tracing the merger history of the LAE progenitors, we find a large overlap () between the objects identified as LAEs at and , suggesting that these populations are relatively stable and long-lived. As a result, we can approximately express their linear bias as being proportional to . Indeed, provided that this is true, the ‘non-linear bias’, for which is a good proxy, is expected to remain stable at fixed number density in order to counteract the drop in the matter clustering, which is exactly what we find. We note that it is possible that a more realistic selection of LAEs (e.g., including radiative transfer effects) would feature a younger and less stable sample of star-forming galaxies (as in the case of our extreme default stellar mass sample), and we leave this for future work.
III.3 Assembly bias signature
Galaxy assembly bias originates from two effects: halo assembly bias and halo occupation variation. The former manifests itself as a difference in the halo clustering among halos of the same mass that differ by some secondary property [e.g., formation time, concentration, spin, see also 73], while the latter comes from the dependence of the halo occupancy (i.e., the number of galaxies per halo) on properties of the host halo other than its mass [e.g., 74, 75]. In this section, we perform the standard ‘shuffling test’ to estimate the effect of occupation variation. The reason the latter is of particular interest to future surveys is that modern analysis of the small-scale signal often makes use of cosmological -body simulations, which do not implement any baryonic processes but trace the dark-matter component, providing accurate statistics of its virialized structures (i.e., halos) and thus halo assembly bias [see e.g., 76]. In particular, often small-scale analysis is based on emulators built on an extensive suite of -body simulations [e.g., 77], spanning a number of cosmologies, which enables the extraction of cosmological constraints by marginalizing over the parameters of the (sub)halo model. As such, these emulators already encapsulate halo assembly bias effects, as the halo statistics are dynamically tracked in the simulation 111A caveat in that statement is the dependence of halo properties on the halo finding algorithm and simulation resolution. The shuffling procedure, on the other hand, directly probes the connection between the luminous component and its dark matter host beyond the clustering properties of the halos.
Below, we outline the steps of our shuffling test. Broadly, its aim is to estimate how large of an effect is hidden in the halo properties beyond halo mass. This is done by preserving the halo occupation dependence on mass while randomly shuffling the galaxy occupations at fixed halo mass. This procedure mimics the standard implementation of the baseline HOD model, as it preserves the mean occupation number as a function of mass. At the same time, it makes no assumptions regarding the shape of the HOD or the statistical distribution of the central and satellite occupations (typically taken to be binomial and Poisson, respectively). In detail, we first identify the halo hosts of our LAE-like galaxies, which provides us with an occupancy number for each halo. We next define logarithmic mass bins between and of width , in units of . We test that the width of the bins does not affect the final result. In each mass bin,
-
1.
We randomly shuffle the galaxy occupations of the halos belonging to that bin.
-
2.
As our interest is in the effect on quasilinear scales (), we place the galaxies in the shuffled sample at the center of their host halo. Alternatively, we could adopt a simple one-halo-term prescription or simply preserve the spatial distribution of the halos with respect to the halo center when performing the shuffling. However, even so the one- to two-halo term transition would not be ideally matched as more simplistic recipes disregard the non-spherical shape of the halo and its substructure. We leave a more dedicated study of the one-halo term of LAEs for future analysis.
-
3.
Measure a large-scale statistics of choice such as the two-point clustering. The correlation function can be calculated using the natural estimator (see Eq. 9). To obtain the mean correlation function, ratio of shuffled to unshuffled clustering, and corresponding errors for the full box, we calculate the mean and jackknife errors of the correlation functions for the 125 subsamples:
(15) (16) where and is the correlation function value at for subsample (i.e. excluding the galaxies residing within volume element in the correlation function computation).
Previous studies have shown that the effect of using the full-physics rather than the dark-matter-only counterpart of the simulation is negligible [28], as the mass properties of the halos are largely unaffected by the presence of baryonic physics (note that this does not hold true for the subhalo properties).
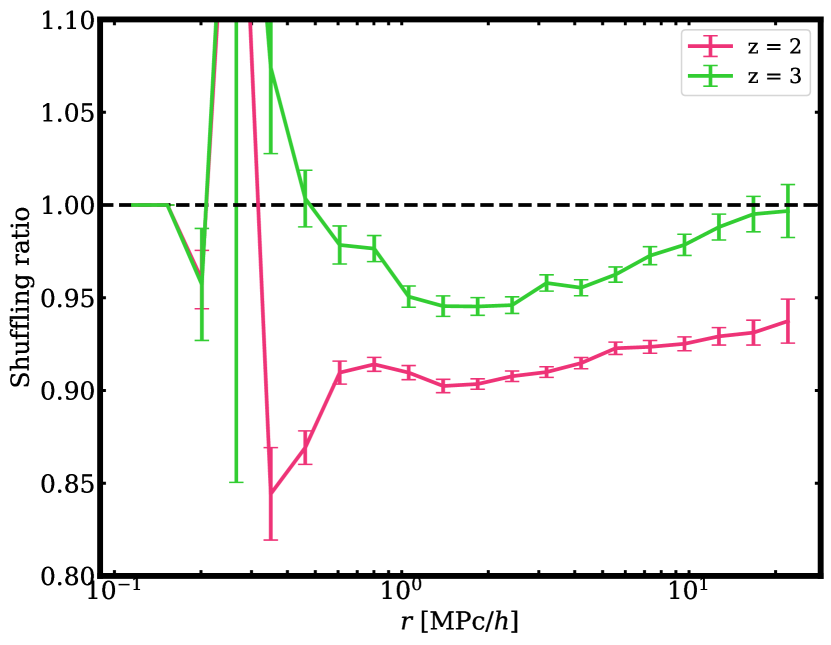
In Fig. 9, we show the ratio of the shuffled sample to the original (unshuffled) sample, i.e. . The results are shown for our default selection of LAEs (see Section II.3) at the two redshifts of interest, and 3. We see that on average, the deviation from one is about 8% at for the galaxies at , and about 3% for the LAEs at , demonstrating that assembly bias affects this galaxy population less at the higher redshift compared with the lower one. The discrepancy at is reminiscent of that of LRGs and ELGs found in previous studies [e.g., 79]. We interpret the finding at as being the consequence of astrophysical and numerical effects. The numerical effects are related to the well-known fact that in highly clustered regions, spatial halo finding algorithms such as the FoF algorithm (used to define halos in MTNG) struggle with deblending halos, which can lead to biases in the reported halo masses: for example, an intermediate-sized halo on the outskirts of a larger halo may have its mass underestimated and hence have fewer galaxies ascribed to it by a mass-only HOD prescription compared with the number it would have received if its mass had been correctly identified. That issue is of course exacerbated at lower redshifts, for which we are more likely to find large galaxy clusters and halos in close proximity [80].
We also expect that galaxy formation and evolution is impacted by environmental and tidal effects, which can lead to splashback effects, quenching or triggering of star formation, merging of halos, and stripping of the dark matter envelope of small infalling halos [see e.g., 52, for a similar study of red and blue galaxies]. These astrophysical considerations suggest that one needs to take into account additional properties of the halo beyond its mass in order to correctly predict the clustering of LAE galaxies. These effects are less pronounced at both due to the fact that the cumulative number of halo interactions is lower and also because being less massive at this redshift, halos are less likely to have active AGNs, which cause quenching of the star-forming galaxies. We leave for the future a more comprehensive study of the properties the help reconcile the observed discrepancy with the mass-only prediction. After identifying these properties, it is important to incorporate a dependence on them in the galaxy-halo models used to analyze observations in order to get an unbiased inference on halo mass and cosmological parameters [see e.g., 51, for a similar study of red and blue galaxies].
IV Discussion
LAEs have been an object of study for both observers and simulators. In this section, to put our findings into context, we discuss several relevant works using either simulations or observations.
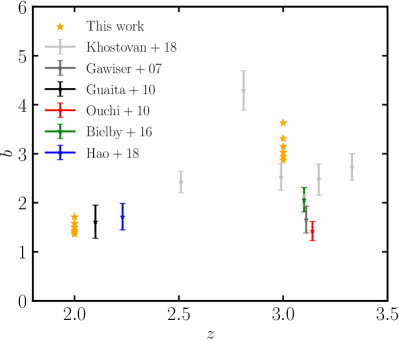
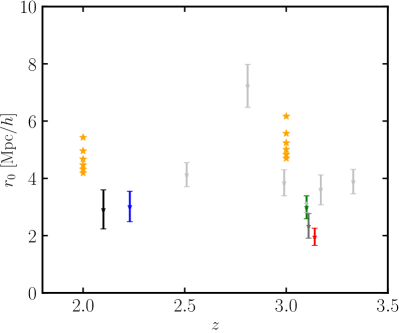
The small-scale clustering of LAEs at has been measured by various groups in the last couple of decades [81, 82, 83, 84, 85, 86, 87, 88]. In Fig. 10, we show a comparison between the linear bias and clustering parameter obtained in this study and the observational constraints on these parameters. We find overall good agreement between our inferred bias at and and the observational probes. In particular, similarly to Guaita et al. [82] and Hao et al. [85], we find that the bias at ranges between and 2, while at it increases to values around 3. Our values for at are a bit higher than Bielby et al. [84], Ouchi et al. [83] and Gawiser et al. [81], but are comparable to the Khostovan et al. [86] findings. Similarly, we find that our values of are roughly consistent with observations, albeit again a bit higher, especially at the low-redshift end. While this quantity is sensitive to the scales used in the fit, the difference (both for and ) could also be attributed to the fact that our simulation lacks an escape fraction model and other radiative transfer effects, which if accounted for, might have led us to select a slightly less massive (less clustered) sample.
Several groups have also identified LAEs using hydrodynamical simulations and semi-analytic models and studied their clustering properties and galaxy-halo connection [e.g., 89, 90, 91, 70, 92]. In Fig. 1, we showed that our SFR-stellar mass relation for the LAEs agrees very well with the Nagamine et al. [70] fit. In addition, Fig. 8 and Table 2 of Nagamine et al. [70] presents the bias and clustering parameter at for two different scenarios: ‘stochastic’ and ‘escape fraction’. We find good agreement with their values of about for their ‘stochastic scenario’ and consistent values for for both scenarios (). Additionally, we compare our HOD to Fig. 11 in Garel et al. [92] and find it to be consistent with their mid-luminosity sample, which roughly matches the luminosity range of our sample as well. We attribute differences on the high-mass end to the fact that we do not incorporate dust attenuation, escape fraction, EW modeling and resonant scattering, which their semi-analytic model does feature. A key finding of that paper is the similitude between their LAE and LBG sample, since both populations target star-forming galaxies with bright UV emission. The authors attribute the remaining differences to: “EW selections, UV detection limits, and a decreasing Lya-to-UV escape fraction ratio in high SFR galaxies”. We leave a comparative study of LAEs and LBGs for future work.
V Conclusions
Future cosmological experiments such as DESI-II will likely target strongly emitting galaxies at high redshifts (). In this study, we use the hydrodynamical simulation MillenniumTNG (MTNG) to study Lyman-alpha Emitting (LAE) galaxies at and 3, with the hope that our analysis will inform these planned galaxy surveys. In particular, we are interested in determining key galaxy-halo properties of LAEs such as their clustering and occupation statistics.
In Section II.3, we define LAEs in three different ways. Our default sample is obtained through an empirical relation linking star formation rate (SFR) and Lyman-alpha flux (see Fig. 1). We also explore a sample that imposes an additional REW cut (default REW), which behaves qualitatively almost identically to the default case. Finally, we study a sample that combines a Ly flux cut with a stellar mass maximum threshold (default stellar mass). This last definition approximates the effect of a steady lowering of the escape fraction of photons with increasing halo mass. This is reflected on the halo occupation of the centrals as seen in Fig. 2 as well as on the correlation function (shown in Fig. 3), which sees a 5-10% decrease of the clustering amplitude at . Furthermore, the redshift clustering of the default LAEs suggests that the Finger-of-God effects are weaker compared with a typical low-redshift red population, with a transition scale of (see Fig. 4 and Fig. 5).
In Fig. 6 and Fig. 7, we show the evolution of HOD parameters as a function of number density (or equivalently, Ly flux) at the two redshifts of interest. We find that the HOD mass parameters rapidly (and logarithmically) decrease with increasing number density, due to the overall lowering of the mean halo mass of the population. Additionally, the HOD parameter also decreases with number density, implying that the SFR-halo mass relationship becomes tighter for low-luminosity objects. At , the power-law slope parameter takes a surprisingly large range of values (1.1 to 1.7).
In Fig. 8, we showcase the linear and quasi-linear ‘bias’ parameters and , respectively, as a function of number density at both redshifts. Interestingly, the non-linear clustering parameter appears to be fixed at fixed number density and constant at both epochs. On the other hand, the linear bias parameter varies with redshift as in order to cancel the drop in the matter clustering with increasing redshift. This suggests that the LAE samples defined in this work are relatively stable and long-lived. Indeed, we find that a large fraction of the LAE progenitors at have a large overlap with the sample at .
In Fig. 9, we examine the amount of galaxy assembly bias at and 3 through a shuffling test. We report that at the discrepancy between the shuffling and original sample is roughly 10%, suggesting that a cosmological analysis of the small-scale clustering that ignores the effect of halo properties beyond halo mass could potentially lead to substantial (10%) biases on the inferred cosmological parameters (e.g., and mean halo mass). At , the assembly bias effect decreases to about 5%, which implies that assembly bias effects become less important at high . We conjecture that this is the case due to the lower cumulative number of two-halo interactions (mergers, splashback, stripping, etc.) between massive galaxies at higher redshifts.
While our study is based on a single full-physics simulation (MTNG), we expect our results to reflect accurately the qualitative behavior of LAEs in the Universe. In subsequent work, we plan to investigate the effect of incorporating radiative transfer physics on this population of LAEs, on their astrophysical and cosmological properties [93, 94, 95, 96].
Acknowledgements.
We wish to acknowledge the support of the PI2 program for supporting J.R. through the summer of 2023. B.H. is grateful to the Miller Institute for their generous support.References
- Abbott et al. [2018] T. M. C. Abbott, F. B. Abdalla, A. Alarcon, J. Aleksić, S. Allam, S. Allen, A. Amara, J. Annis, J. Asorey, S. Avila, D. Bacon, E. Balbinot, M. Banerji, N. Banik, W. Barkhouse, M. Baumer, E. Baxter, K. Bechtol, M. R. Becker, A. Benoit-Lévy, B. A. Benson, G. M. Bernstein, E. Bertin, J. Blazek, S. L. Bridle, D. Brooks, D. Brout, E. Buckley-Geer, D. L. Burke, M. T. Busha, A. Campos, D. Capozzi, A. Carnero Rosell, M. Carrasco Kind, J. Carretero, F. J. Castander, R. Cawthon, C. Chang, N. Chen, M. Childress, A. Choi, C. Conselice, R. Crittenden, M. Crocce, C. E. Cunha, C. B. D’Andrea, L. N. da Costa, R. Das, T. M. Davis, C. Davis, J. De Vicente, D. L. DePoy, J. DeRose, S. Desai, H. T. Diehl, J. P. Dietrich, S. Dodelson, P. Doel, A. Drlica-Wagner, T. F. Eifler, A. E. Elliott, F. Elsner, J. Elvin-Poole, J. Estrada, A. E. Evrard, Y. Fang, E. Fernandez, A. Ferté, D. A. Finley, B. Flaugher, P. Fosalba, O. Friedrich, J. Frieman, J. García-Bellido, M. Garcia-Fernandez, M. Gatti, E. Gaztanaga, D. W. Gerdes, T. Giannantonio, M. S. S. Gill, K. Glazebrook, D. A. Goldstein, D. Gruen, R. A. Gruendl, J. Gschwend, G. Gutierrez, S. Hamilton, W. G. Hartley, S. R. Hinton, K. Honscheid, B. Hoyle, D. Huterer, B. Jain, D. J. James, M. Jarvis, T. Jeltema, M. D. Johnson, M. W. G. Johnson, T. Kacprzak, S. Kent, A. G. Kim, A. King, D. Kirk, N. Kokron, A. Kovacs, E. Krause, C. Krawiec, A. Kremin, K. Kuehn, S. Kuhlmann, N. Kuropatkin, F. Lacasa, O. Lahav, T. S. Li, A. R. Liddle, C. Lidman, M. Lima, H. Lin, N. MacCrann, M. A. G. Maia, M. Makler, M. Manera, M. March, J. L. Marshall, P. Martini, R. G. McMahon, P. Melchior, F. Menanteau, R. Miquel, V. Miranda, D. Mudd, J. Muir, A. Möller, E. Neilsen, R. C. Nichol, B. Nord, P. Nugent, R. L. C. Ogando, A. Palmese, J. Peacock, H. V. Peiris, J. Peoples, W. J. Percival, D. Petravick, A. A. Plazas, A. Porredon, J. Prat, A. Pujol, M. M. Rau, A. Refregier, P. M. Ricker, N. Roe, R. P. Rollins, A. K. Romer, A. Roodman, R. Rosenfeld, A. J. Ross, E. Rozo, E. S. Rykoff, M. Sako, A. I. Salvador, S. Samuroff, C. Sánchez, E. Sanchez, B. Santiago, V. Scarpine, R. Schindler, D. Scolnic, L. F. Secco, S. Serrano, I. Sevilla-Noarbe, E. Sheldon, R. C. Smith, M. Smith, J. Smith, M. Soares-Santos, F. Sobreira, E. Suchyta, G. Tarle, D. Thomas, M. A. Troxel, D. L. Tucker, B. E. Tucker, S. A. Uddin, T. N. Varga, P. Vielzeuf, V. Vikram, A. K. Vivas, A. R. Walker, M. Wang, R. H. Wechsler, J. Weller, W. Wester, R. C. Wolf, B. Yanny, F. Yuan, A. Zenteno, B. Zhang, Y. Zhang, J. Zuntz, and Dark Energy Survey Collaboration, Dark Energy Survey year 1 results: Cosmological constraints from galaxy clustering and weak lensing, Phys. Rev. D 98, 043526 (2018), arXiv:1708.01530 [astro-ph.CO] .
- Abbott et al. [2022] T. M. C. Abbott, M. Aguena, A. Alarcon, S. Allam, O. Alves, A. Amon, F. Andrade-Oliveira, J. Annis, S. Avila, D. Bacon, E. Baxter, K. Bechtol, M. R. Becker, G. M. Bernstein, S. Bhargava, S. Birrer, J. Blazek, A. Brandao-Souza, S. L. Bridle, D. Brooks, E. Buckley-Geer, D. L. Burke, H. Camacho, A. Campos, A. Carnero Rosell, M. Carrasco Kind, J. Carretero, F. J. Castander, R. Cawthon, C. Chang, A. Chen, R. Chen, A. Choi, C. Conselice, J. Cordero, M. Costanzi, M. Crocce, L. N. da Costa, M. E. da Silva Pereira, C. Davis, T. M. Davis, J. De Vicente, J. DeRose, S. Desai, E. Di Valentino, H. T. Diehl, J. P. Dietrich, S. Dodelson, P. Doel, C. Doux, A. Drlica-Wagner, K. Eckert, T. F. Eifler, F. Elsner, J. Elvin-Poole, S. Everett, A. E. Evrard, X. Fang, A. Farahi, E. Fernandez, I. Ferrero, A. Ferté, P. Fosalba, O. Friedrich, J. Frieman, J. García-Bellido, M. Gatti, E. Gaztanaga, D. W. Gerdes, T. Giannantonio, G. Giannini, D. Gruen, R. A. Gruendl, J. Gschwend, G. Gutierrez, I. Harrison, W. G. Hartley, K. Herner, S. R. Hinton, D. L. Hollowood, K. Honscheid, B. Hoyle, E. M. Huff, D. Huterer, B. Jain, D. J. James, M. Jarvis, N. Jeffrey, T. Jeltema, A. Kovacs, E. Krause, R. Kron, K. Kuehn, N. Kuropatkin, O. Lahav, P. F. Leget, P. Lemos, A. R. Liddle, C. Lidman, M. Lima, H. Lin, N. MacCrann, M. A. G. Maia, J. L. Marshall, P. Martini, J. McCullough, P. Melchior, J. Mena-Fernández, F. Menanteau, R. Miquel, J. J. Mohr, R. Morgan, J. Muir, J. Myles, S. Nadathur, A. Navarro-Alsina, R. C. Nichol, R. L. C. Ogando, Y. Omori, A. Palmese, S. Pandey, Y. Park, F. Paz-Chinchón, D. Petravick, A. Pieres, A. A. Plazas Malagón, A. Porredon, J. Prat, M. Raveri, M. Rodriguez-Monroy, R. P. Rollins, A. K. Romer, A. Roodman, R. Rosenfeld, A. J. Ross, E. S. Rykoff, S. Samuroff, C. Sánchez, E. Sanchez, J. Sanchez, D. Sanchez Cid, V. Scarpine, M. Schubnell, D. Scolnic, L. F. Secco, S. Serrano, I. Sevilla-Noarbe, E. Sheldon, T. Shin, M. Smith, M. Soares-Santos, E. Suchyta, M. E. C. Swanson, M. Tabbutt, G. Tarle, D. Thomas, C. To, A. Troja, M. A. Troxel, D. L. Tucker, I. Tutusaus, T. N. Varga, A. R. Walker, N. Weaverdyck, R. Wechsler, J. Weller, B. Yanny, B. Yin, Y. Zhang, J. Zuntz, and DES Collaboration, Dark Energy Survey Year 3 results: Cosmological constraints from galaxy clustering and weak lensing, Phys. Rev. D 105, 023520 (2022), arXiv:2105.13549 [astro-ph.CO] .
- DESI Collaboration et al. [2016] DESI Collaboration, A. Aghamousa, J. Aguilar, S. Ahlen, S. Alam, L. E. Allen, C. Allende Prieto, J. Annis, S. Bailey, C. Balland, O. Ballester, C. Baltay, L. Beaufore, C. Bebek, T. C. Beers, E. F. Bell, J. L. Bernal, R. Besuner, F. Beutler, C. Blake, H. Bleuler, M. Blomqvist, R. Blum, A. S. Bolton, C. Briceno, D. Brooks, J. R. Brownstein, E. Buckley-Geer, A. Burden, E. Burtin, N. G. Busca, R. N. Cahn, Y.-C. Cai, L. Cardiel-Sas, R. G. Carlberg, P.-H. Carton, R. Casas, F. J. Castander, J. L. Cervantes-Cota, T. M. Claybaugh, M. Close, C. T. Coker, S. Cole, J. Comparat, A. P. Cooper, M. C. Cousinou, M. Crocce, J.-G. Cuby, D. P. Cunningham, T. M. Davis, K. S. Dawson, A. de la Macorra, J. De Vicente, T. Delubac, M. Derwent, A. Dey, G. Dhungana, Z. Ding, P. Doel, Y. T. Duan, A. Ealet, J. Edelstein, S. Eftekharzadeh, D. J. Eisenstein, A. Elliott, S. Escoffier, M. Evatt, P. Fagrelius, X. Fan, K. Fanning, A. Farahi, J. Farihi, G. Favole, Y. Feng, E. Fernandez, J. R. Findlay, D. P. Finkbeiner, M. J. Fitzpatrick, B. Flaugher, S. Flender, A. Font-Ribera, J. E. Forero-Romero, P. Fosalba, C. S. Frenk, M. Fumagalli, B. T. Gaensicke, G. Gallo, J. Garcia-Bellido, E. Gaztanaga, N. Pietro Gentile Fusillo, T. Gerard, I. Gershkovich, T. Giannantonio, D. Gillet, G. Gonzalez-de-Rivera, V. Gonzalez-Perez, S. Gott, O. Graur, G. Gutierrez, J. Guy, S. Habib, H. Heetderks, I. Heetderks, K. Heitmann, W. A. Hellwing, D. A. Herrera, S. Ho, S. Holland, K. Honscheid, E. Huff, T. A. Hutchinson, D. Huterer, H. S. Hwang, J. M. Illa Laguna, Y. Ishikawa, D. Jacobs, N. Jeffrey, P. Jelinsky, E. Jennings, L. Jiang, J. Jimenez, J. Johnson, R. Joyce, E. Jullo, S. Juneau, S. Kama, A. Karcher, S. Karkar, R. Kehoe, N. Kennamer, S. Kent, M. Kilbinger, A. G. Kim, D. Kirkby, T. Kisner, E. Kitanidis, J.-P. Kneib, S. Koposov, E. Kovacs, K. Koyama, A. Kremin, R. Kron, L. Kronig, A. Kueter-Young, C. G. Lacey, R. Lafever, O. Lahav, A. Lambert, M. Lampton, M. Landriau, D. Lang, T. R. Lauer, J.-M. Le Goff, L. Le Guillou, A. Le Van Suu, J. H. Lee, S.-J. Lee, D. Leitner, M. Lesser, M. E. Levi, B. L’Huillier, B. Li, M. Liang, H. Lin, E. Linder, S. R. Loebman, Z. Lukić, J. Ma, N. MacCrann, C. Magneville, L. Makarem, M. Manera, C. J. Manser, R. Marshall, P. Martini, R. Massey, T. Matheson, J. McCauley, P. McDonald, I. D. McGreer, A. Meisner, N. Metcalfe, T. N. Miller, R. Miquel, J. Moustakas, A. Myers, M. Naik, J. A. Newman, R. C. Nichol, A. Nicola, L. Nicolati da Costa, J. Nie, G. Niz, P. Norberg, B. Nord, D. Norman, P. Nugent, T. O’Brien, M. Oh, K. A. G. Olsen, C. Padilla, H. Padmanabhan, N. Padmanabhan, N. Palanque-Delabrouille, A. Palmese, D. Pappalardo, I. Pâris, C. Park, A. Patej, J. A. Peacock, H. V. Peiris, X. Peng, W. J. Percival, S. Perruchot, M. M. Pieri, R. Pogge, J. E. Pollack, C. Poppett, F. Prada, A. Prakash, R. G. Probst, D. Rabinowitz, A. Raichoor, C. H. Ree, A. Refregier, X. Regal, B. Reid, K. Reil, M. Rezaie, C. M. Rockosi, N. Roe, S. Ronayette, A. Roodman, A. J. Ross, N. P. Ross, G. Rossi, E. Rozo, V. Ruhlmann-Kleider, E. S. Rykoff, C. Sabiu, L. Samushia, E. Sanchez, J. Sanchez, D. J. Schlegel, M. Schneider, M. Schubnell, A. Secroun, U. Seljak, H.-J. Seo, S. Serrano, A. Shafieloo, H. Shan, R. Sharples, M. J. Sholl, W. V. Shourt, J. H. Silber, D. R. Silva, M. M. Sirk, A. Slosar, A. Smith, G. F. Smoot, D. Som, Y.-S. Song, D. Sprayberry, R. Staten, A. Stefanik, G. Tarle, S. Sien Tie, J. L. Tinker, R. Tojeiro, F. Valdes, O. Valenzuela, M. Valluri, M. Vargas-Magana, L. Verde, A. R. Walker, J. Wang, Y. Wang, B. A. Weaver, C. Weaverdyck, R. H. Wechsler, D. H. Weinberg, M. White, Q. Yang, C. Yeche, T. Zhang, G.-B. Zhao, Y. Zheng, X. Zhou, Z. Zhou, Y. Zhu, H. Zou, and Y. Zu, The DESI Experiment Part I: Science,Targeting, and Survey Design, arXiv e-prints , arXiv:1611.00036 (2016), arXiv:1611.00036 [astro-ph.IM] .
- Laureijs et al. [2011] R. Laureijs, J. Amiaux, S. Arduini, J. L. Auguères, J. Brinchmann, R. Cole, M. Cropper, C. Dabin, L. Duvet, A. Ealet, B. Garilli, P. Gondoin, L. Guzzo, J. Hoar, H. Hoekstra, R. Holmes, T. Kitching, T. Maciaszek, Y. Mellier, F. Pasian, W. Percival, J. Rhodes, G. Saavedra Criado, M. Sauvage, R. Scaramella, L. Valenziano, S. Warren, R. Bender, F. Castander, A. Cimatti, O. Le Fèvre, H. Kurki-Suonio, M. Levi, P. Lilje, G. Meylan, R. Nichol, K. Pedersen, V. Popa, R. Rebolo Lopez, H. W. Rix, H. Rottgering, W. Zeilinger, F. Grupp, P. Hudelot, R. Massey, M. Meneghetti, L. Miller, S. Paltani, S. Paulin-Henriksson, S. Pires, C. Saxton, T. Schrabback, G. Seidel, J. Walsh, N. Aghanim, L. Amendola, J. Bartlett, C. Baccigalupi, J. P. Beaulieu, K. Benabed, J. G. Cuby, D. Elbaz, P. Fosalba, G. Gavazzi, A. Helmi, I. Hook, M. Irwin, J. P. Kneib, M. Kunz, F. Mannucci, L. Moscardini, C. Tao, R. Teyssier, J. Weller, G. Zamorani, M. R. Zapatero Osorio, O. Boulade, J. J. Foumond, A. Di Giorgio, P. Guttridge, A. James, M. Kemp, J. Martignac, A. Spencer, D. Walton, T. Blümchen, C. Bonoli, F. Bortoletto, C. Cerna, L. Corcione, C. Fabron, K. Jahnke, S. Ligori, F. Madrid, L. Martin, G. Morgante, T. Pamplona, E. Prieto, M. Riva, R. Toledo, M. Trifoglio, F. Zerbi, F. Abdalla, M. Douspis, C. Grenet, S. Borgani, R. Bouwens, F. Courbin, J. M. Delouis, P. Dubath, A. Fontana, M. Frailis, A. Grazian, J. Koppenhöfer, O. Mansutti, M. Melchior, M. Mignoli, J. Mohr, C. Neissner, K. Noddle, M. Poncet, M. Scodeggio, S. Serrano, N. Shane, J. L. Starck, C. Surace, A. Taylor, G. Verdoes-Kleijn, C. Vuerli, O. R. Williams, A. Zacchei, B. Altieri, I. Escudero Sanz, R. Kohley, T. Oosterbroek, P. Astier, D. Bacon, S. Bardelli, C. Baugh, F. Bellagamba, C. Benoist, D. Bianchi, A. Biviano, E. Branchini, C. Carbone, V. Cardone, D. Clements, S. Colombi, C. Conselice, G. Cresci, N. Deacon, J. Dunlop, C. Fedeli, F. Fontanot, P. Franzetti, C. Giocoli, J. Garcia-Bellido, J. Gow, A. Heavens, P. Hewett, C. Heymans, A. Holland, Z. Huang, O. Ilbert, B. Joachimi, E. Jennins, E. Kerins, A. Kiessling, D. Kirk, R. Kotak, O. Krause, O. Lahav, F. van Leeuwen, J. Lesgourgues, M. Lombardi, M. Magliocchetti, K. Maguire, E. Majerotto, R. Maoli, F. Marulli, S. Maurogordato, H. McCracken, R. McLure, A. Melchiorri, A. Merson, M. Moresco, M. Nonino, P. Norberg, J. Peacock, R. Pello, M. Penny, V. Pettorino, C. Di Porto, L. Pozzetti, C. Quercellini, M. Radovich, A. Rassat, N. Roche, S. Ronayette, E. Rossetti, B. Sartoris, P. Schneider, E. Semboloni, S. Serjeant, F. Simpson, C. Skordis, G. Smadja, S. Smartt, P. Spano, S. Spiro, M. Sullivan, A. Tilquin, R. Trotta, L. Verde, Y. Wang, G. Williger, G. Zhao, J. Zoubian, and E. Zucca, Euclid Definition Study Report, arXiv e-prints , arXiv:1110.3193 (2011), arXiv:1110.3193 [astro-ph.CO] .
- LSST Science Collaboration et al. [2009] LSST Science Collaboration, P. A. Abell, J. Allison, S. F. Anderson, J. R. Andrew, J. R. P. Angel, L. Armus, D. Arnett, S. J. Asztalos, T. S. Axelrod, S. Bailey, D. R. Ballantyne, J. R. Bankert, W. A. Barkhouse, J. D. Barr, L. F. Barrientos, A. J. Barth, J. G. Bartlett, A. C. Becker, J. Becla, T. C. Beers, J. P. Bernstein, R. Biswas, M. R. Blanton, J. S. Bloom, J. J. Bochanski, P. Boeshaar, K. D. Borne, M. Bradac, W. N. Brandt, C. R. Bridge, M. E. Brown, R. J. Brunner, J. S. Bullock, A. J. Burgasser, J. H. Burge, D. L. Burke, P. A. Cargile, S. Chandrasekharan, G. Chartas, S. R. Chesley, Y.-H. Chu, D. Cinabro, M. W. Claire, C. F. Claver, D. Clowe, A. J. Connolly, K. H. Cook, J. Cooke, A. Cooray, K. R. Covey, C. S. Culliton, R. de Jong, W. H. de Vries, V. P. Debattista, F. Delgado, I. P. Dell’Antonio, S. Dhital, R. Di Stefano, M. Dickinson, B. Dilday, S. G. Djorgovski, G. Dobler, C. Donalek, G. Dubois-Felsmann, J. Durech, A. Eliasdottir, M. Eracleous, L. Eyer, E. E. Falco, X. Fan, C. D. Fassnacht, H. C. Ferguson, Y. R. Fernandez, B. D. Fields, D. Finkbeiner, E. E. Figueroa, D. B. Fox, H. Francke, J. S. Frank, J. Frieman, S. Fromenteau, M. Furqan, G. Galaz, A. Gal-Yam, P. Garnavich, E. Gawiser, J. Geary, P. Gee, R. R. Gibson, K. Gilmore, E. A. Grace, R. F. Green, W. J. Gressler, C. J. Grillmair, S. Habib, J. S. Haggerty, M. Hamuy, A. W. Harris, S. L. Hawley, A. F. Heavens, L. Hebb, T. J. Henry, E. Hileman, E. J. Hilton, K. Hoadley, J. B. Holberg, M. J. Holman, S. B. Howell, L. Infante, Z. Ivezic, S. H. Jacoby, B. Jain, R, Jedicke, M. J. Jee, J. Garrett Jernigan, S. W. Jha, K. V. Johnston, R. L. Jones, M. Juric, M. Kaasalainen, Styliani, Kafka, S. M. Kahn, N. A. Kaib, J. Kalirai, J. Kantor, M. M. Kasliwal, C. R. Keeton, R. Kessler, Z. Knezevic, A. Kowalski, V. L. Krabbendam, K. S. Krughoff, S. Kulkarni, S. Kuhlman, M. Lacy, S. Lepine, M. Liang, A. Lien, P. Lira, K. S. Long, S. Lorenz, J. M. Lotz, R. H. Lupton, J. Lutz, L. M. Macri, A. A. Mahabal, R. Mandelbaum, P. Marshall, M. May, P. M. McGehee, B. T. Meadows, A. Meert, A. Milani, C. J. Miller, M. Miller, D. Mills, D. Minniti, D. Monet, A. S. Mukadam, E. Nakar, D. R. Neill, J. A. Newman, S. Nikolaev, M. Nordby, P. O’Connor, M. Oguri, J. Oliver, S. S. Olivier, J. K. Olsen, K. Olsen, E. W. Olszewski, H. Oluseyi, N. D. Padilla, A. Parker, J. Pepper, J. R. Peterson, C. Petry, P. A. Pinto, J. L. Pizagno, B. Popescu, A. Prsa, V. Radcka, M. J. Raddick, A. Rasmussen, A. Rau, J. Rho, J. E. Rhoads, G. T. Richards, S. T. Ridgway, B. E. Robertson, R. Roskar, A. Saha, A. Sarajedini, E. Scannapieco, T. Schalk, R. Schindler, S. Schmidt, S. Schmidt, D. P. Schneider, G. Schumacher, R. Scranton, J. Sebag, L. G. Seppala, O. Shemmer, J. D. Simon, M. Sivertz, H. A. Smith, J. Allyn Smith, N. Smith, A. H. Spitz, A. Stanford, K. G. Stassun, J. Strader, M. A. Strauss, C. W. Stubbs, D. W. Sweeney, A. Szalay, P. Szkody, M. Takada, P. Thorman, D. E. Trilling, V. Trimble, A. Tyson, R. Van Berg, D. Vanden Berk, J. VanderPlas, L. Verde, B. Vrsnak, L. M. Walkowicz, B. D. Wandelt, S. Wang, Y. Wang, M. Warner, R. H. Wechsler, A. A. West, O. Wiecha, B. F. Williams, B. Willman, D. Wittman, S. C. Wolff, W. M. Wood-Vasey, P. Wozniak, P. Young, A. Zentner, and H. Zhan, LSST Science Book, Version 2.0, arXiv e-prints , arXiv:0912.0201 (2009), arXiv:0912.0201 [astro-ph.IM] .
- Spergel et al. [2015] D. Spergel, N. Gehrels, C. Baltay, D. Bennett, J. Breckinridge, M. Donahue, A. Dressler, B. S. Gaudi, T. Greene, O. Guyon, C. Hirata, J. Kalirai, N. J. Kasdin, B. Macintosh, W. Moos, S. Perlmutter, M. Postman, B. Rauscher, J. Rhodes, Y. Wang, D. Weinberg, D. Benford, M. Hudson, W. S. Jeong, Y. Mellier, W. Traub, T. Yamada, P. Capak, J. Colbert, D. Masters, M. Penny, D. Savransky, D. Stern, N. Zimmerman, R. Barry, L. Bartusek, K. Carpenter, E. Cheng, D. Content, F. Dekens, R. Demers, K. Grady, C. Jackson, G. Kuan, J. Kruk, M. Melton, B. Nemati, B. Parvin, I. Poberezhskiy, C. Peddie, J. Ruffa, J. K. Wallace, A. Whipple, E. Wollack, and F. Zhao, Wide-Field InfrarRed Survey Telescope-Astrophysics Focused Telescope Assets WFIRST-AFTA 2015 Report, arXiv e-prints , arXiv:1503.03757 (2015), arXiv:1503.03757 [astro-ph.IM] .
- Eifler et al. [2021] T. Eifler, H. Miyatake, E. Krause, C. Heinrich, V. Miranda, C. Hirata, J. Xu, S. Hemmati, M. Simet, P. Capak, A. Choi, O. Doré, C. Doux, X. Fang, R. Hounsell, E. Huff, H.-J. Huang, M. Jarvis, J. Kruk, D. Masters, E. Rozo, D. Scolnic, D. N. Spergel, M. Troxel, A. von der Linden, Y. Wang, D. H. Weinberg, L. Wenzl, and H.-Y. Wu, Cosmology with the Roman Space Telescope - multiprobe strategies, MNRAS 507, 1746 (2021), arXiv:2004.05271 [astro-ph.CO] .
- Eisenstein et al. [2005] D. J. Eisenstein, I. Zehavi, D. W. Hogg, R. Scoccimarro, M. R. Blanton, R. C. Nichol, R. Scranton, H.-J. Seo, M. Tegmark, Z. Zheng, S. F. Anderson, J. Annis, N. Bahcall, J. Brinkmann, S. Burles, F. J. Castander, A. Connolly, I. Csabai, M. Doi, M. Fukugita, J. A. Frieman, K. Glazebrook, J. E. Gunn, J. S. Hendry, G. Hennessy, Z. Ivezić, S. Kent, G. R. Knapp, H. Lin, Y.-S. Loh, R. H. Lupton, B. Margon, T. A. McKay, A. Meiksin, J. A. Munn, A. Pope, M. W. Richmond, D. Schlegel, D. P. Schneider, K. Shimasaku, C. Stoughton, M. A. Strauss, M. SubbaRao, A. S. Szalay, I. Szapudi, D. L. Tucker, B. Yanny, and D. G. York, Detection of the Baryon Acoustic Peak in the Large-Scale Correlation Function of SDSS Luminous Red Galaxies, ApJ 633, 560 (2005), arXiv:astro-ph/0501171 [astro-ph] .
- Peacock and Smith [2000] J. A. Peacock and R. E. Smith, Halo occupation numbers and galaxy bias, MNRAS 318, 1144 (2000), arXiv:astro-ph/0005010 [astro-ph] .
- Seljak [2000] U. Seljak, Analytic model for galaxy and dark matter clustering, MNRAS 318, 203 (2000), arXiv:astro-ph/0001493 [astro-ph] .
- Benson et al. [2000] A. J. Benson, S. Cole, C. S. Frenk, C. M. Baugh, and C. G. Lacey, The nature of galaxy bias and clustering, MNRAS 311, 793 (2000), arXiv:astro-ph/9903343 [astro-ph] .
- White et al. [2001] M. White, L. Hernquist, and V. Springel, The Halo Model and Numerical Simulations, ApJ 550, L129 (2001), arXiv:astro-ph/0012518 [astro-ph] .
- Berlind and Weinberg [2002] A. A. Berlind and D. H. Weinberg, The Halo Occupation Distribution: Toward an Empirical Determination of the Relation between Galaxies and Mass, ApJ 575, 587 (2002), arXiv:astro-ph/0109001 [astro-ph] .
- Cooray and Sheth [2002] A. Cooray and R. Sheth, Halo models of large scale structure, Phys. Rep. 372, 1 (2002), arXiv:astro-ph/0206508 [astro-ph] .
- Yang et al. [2009] X. Yang, H. J. Mo, and F. C. van den Bosch, Galaxy Groups in the SDSS DR4. III. The Luminosity and Stellar Mass Functions, ApJ 695, 900 (2009), arXiv:0808.0539 [astro-ph] .
- Yang et al. [2004] X. Yang, H. J. Mo, Y. P. Jing, F. C. van den Bosch, and Y. Chu, Populating dark matter haloes with galaxies: comparing the 2dFGRS with mock galaxy redshift surveys, MNRAS 350, 1153 (2004), arXiv:astro-ph/0303524 [astro-ph] .
- Zheng et al. [2005] Z. Zheng, A. A. Berlind, D. H. Weinberg, A. J. Benson, C. M. Baugh, S. Cole, R. Davé, C. S. Frenk, N. Katz, and C. G. Lacey, Theoretical Models of the Halo Occupation Distribution: Separating Central and Satellite Galaxies, ApJ 633, 791 (2005), arXiv:astro-ph/0408564 [astro-ph] .
- Conroy et al. [2006] C. Conroy, R. H. Wechsler, and A. V. Kravtsov, Modeling Luminosity-dependent Galaxy Clustering through Cosmic Time, ApJ 647, 201 (2006), arXiv:astro-ph/0512234 [astro-ph] .
- Behroozi et al. [2010] P. S. Behroozi, C. Conroy, and R. H. Wechsler, A Comprehensive Analysis of Uncertainties Affecting the Stellar Mass-Halo Mass Relation for 0 ¡ z ¡ 4, ApJ 717, 379 (2010), arXiv:1001.0015 [astro-ph.CO] .
- Reddick et al. [2014] R. M. Reddick, J. L. Tinker, R. H. Wechsler, and Y. Lu, Cosmological Constraints from Galaxy Clustering and the Mass-to-number Ratio of Galaxy Clusters: Marginalizing over the Physics of Galaxy Formation, ApJ 783, 118 (2014), arXiv:1306.4686 [astro-ph.CO] .
- Guo et al. [2016] H. Guo, Z. Zheng, P. S. Behroozi, I. Zehavi, C.-H. Chuang, J. Comparat, G. Favole, S. Gottloeber, A. Klypin, F. Prada, S. A. Rodríguez-Torres, D. H. Weinberg, and G. Yepes, Modelling galaxy clustering: halo occupation distribution versus subhalo matching, MNRAS 459, 3040 (2016), arXiv:1508.07012 [astro-ph.CO] .
- Chaves-Montero et al. [2016] J. Chaves-Montero, R. E. Angulo, J. Schaye, M. Schaller, R. A. Crain, M. Furlong, and T. Theuns, Subhalo abundance matching and assembly bias in the EAGLE simulation, MNRAS 460, 3100 (2016), arXiv:1507.01948 [astro-ph.GA] .
- Favole et al. [2022] G. Favole, A. D. Montero-Dorta, M. C. Artale, S. Contreras, I. Zehavi, and X. Xu, Subhalo abundance matching through the lens of a hydrodynamical simulation, MNRAS 509, 1614 (2022), arXiv:2101.10733 [astro-ph.GA] .
- Norberg et al. [2001] P. Norberg, C. M. Baugh, E. Hawkins, S. Maddox, J. A. Peacock, S. Cole, C. S. Frenk, J. Bland-Hawthorn, T. Bridges, R. Cannon, M. Colless, C. Collins, W. Couch, G. Dalton, R. De Propris, S. P. Driver, G. Efstathiou, R. S. Ellis, K. Glazebrook, C. Jackson, O. Lahav, I. Lewis, S. Lumsden, D. Madgwick, B. A. Peterson, W. Sutherland, and K. Taylor, The 2dF Galaxy Redshift Survey: luminosity dependence of galaxy clustering, MNRAS 328, 64 (2001), astro-ph/0105500 .
- Zehavi et al. [2002a] I. Zehavi, M. R. Blanton, J. A. Frieman, D. H. Weinberg, H. J. Mo, M. A. Strauss, S. F. Anderson, J. Annis, N. A. Bahcall, M. Bernardi, J. W. Briggs, J. Brinkmann, S. Burles, L. Carey, F. J. Castander, A. J. Connolly, I. Csabai, J. J. Dalcanton, S. Dodelson, M. Doi, D. Eisenstein, M. L. Evans, D. P. Finkbeiner, S. Friedman, M. Fukugita, J. E. Gunn, G. S. Hennessy, R. B. Hindsley, Ž. Ivezić, S. Kent, G. R. Knapp, R. Kron, P. Kunszt, D. Q. Lamb, R. F. Leger, D. C. Long, J. Loveday, R. H. Lupton, T. McKay, A. Meiksin, A. Merrelli, J. A. Munn, V. Narayanan, M. Newcomb, R. C. Nichol, R. Owen, J. Peoples, A. Pope, C. M. Rockosi, D. Schlegel, D. P. Schneider, R. Scoccimarro, R. K. Sheth, W. Siegmund, S. Smee, Y. Snir, A. Stebbins, C. Stoughton, M. SubbaRao, A. S. Szalay, I. Szapudi, M. Tegmark, D. L. Tucker, A. Uomoto, D. Vanden Berk, M. S. Vogeley, P. Waddell, B. Yanny, and D. G. York, Galaxy Clustering in Early Sloan Digital Sky Survey Redshift Data, ApJ 571, 172 (2002a), arXiv:astro-ph/0106476 [astro-ph] .
- Leauthaud et al. [2017] A. Leauthaud, S. Saito, S. Hilbert, A. Barreira, S. More, M. White, S. Alam, P. Behroozi, K. Bundy, J. Coupon, T. Erben, C. Heymans, H. Hildebrandt, R. Mandelbaum, L. Miller, B. Moraes, M. E. S. Pereira, S. A. Rodríguez-Torres, F. Schmidt, H.-Y. Shan, M. Viel, and F. Villaescusa-Navarro, Lensing is low: cosmology, galaxy formation or new physics?, MNRAS 467, 3024 (2017), arXiv:1611.08606 [astro-ph.CO] .
- Zehavi et al. [2019] I. Zehavi, S. E. Kerby, S. Contreras, E. Jiménez, N. Padilla, and C. M. Baugh, On the Prospect of Using the Maximum Circular Velocity of Halos to Encapsulate Assembly Bias in the Galaxy-Halo Connection, ApJ 887, 17 (2019), arXiv:1907.05424 [astro-ph.GA] .
- Hadzhiyska et al. [2020] B. Hadzhiyska, S. Bose, D. Eisenstein, L. Hernquist, and D. N. Spergel, Limitations to the ‘basic’ HOD model and beyond, MNRAS 493, 5506 (2020), arXiv:1911.02610 [astro-ph.CO] .
- Contreras et al. [2021] S. Contreras, R. E. Angulo, and M. Zennaro, A flexible subhalo abundance matching model for galaxy clustering in redshift space, MNRAS 508, 175 (2021), arXiv:2012.06596 [astro-ph.CO] .
- Wechsler and Tinker [2018] R. H. Wechsler and J. L. Tinker, The Connection Between Galaxies and Their Dark Matter Halos, ARA&A 56, 435 (2018), arXiv:1804.03097 [astro-ph.GA] .
- Angulo and Hahn [2022] R. E. Angulo and O. Hahn, Large-scale dark matter simulations, Living Reviews in Computational Astrophysics 8, 1 (2022), arXiv:2112.05165 [astro-ph.CO] .
- Gao et al. [2005] L. Gao, V. Springel, and S. D. M. White, The age dependence of halo clustering, MNRAS 363, L66 (2005), arXiv:astro-ph/0506510 [astro-ph] .
- Croton et al. [2007] D. J. Croton, L. Gao, and S. D. M. White, Halo assembly bias and its effects on galaxy clustering, MNRAS 374, 1303 (2007), arXiv:astro-ph/0605636 [astro-ph] .
- Hadzhiyska et al. [2021a] B. Hadzhiyska, S. Bose, D. Eisenstein, and L. Hernquist, Extensions to models of the galaxy-halo connection, MNRAS 501, 1603 (2021a), arXiv:2008.04913 [astro-ph.CO] .
- Vogelsberger et al. [2014a] M. Vogelsberger, S. Genel, V. Springel, P. Torrey, D. Sijacki, D. Xu, G. Snyder, D. Nelson, and L. Hernquist, Introducing the Illustris Project: simulating the coevolution of dark and visible matter in the Universe, MNRAS 444, 1518 (2014a), arXiv:1405.2921 [astro-ph.CO] .
- Vogelsberger et al. [2014b] M. Vogelsberger, S. Genel, V. Springel, P. Torrey, D. Sijacki, D. Xu, G. Snyder, S. Bird, D. Nelson, and L. Hernquist, Properties of galaxies reproduced by a hydrodynamic simulation, Nature 509, 177 (2014b), arXiv:1405.1418 [astro-ph.CO] .
- Genel et al. [2014] S. Genel, M. Vogelsberger, V. Springel, D. Sijacki, D. Nelson, G. Snyder, V. Rodriguez-Gomez, P. Torrey, and L. Hernquist, Introducing the Illustris project: the evolution of galaxy populations across cosmic time, MNRAS 445, 175 (2014), arXiv:1405.3749 [astro-ph.CO] .
- Schaye et al. [2015] J. Schaye, R. A. Crain, R. G. Bower, M. Furlong, M. Schaller, T. Theuns, C. Dalla Vecchia, C. S. Frenk, I. G. McCarthy, J. C. Helly, A. Jenkins, Y. M. Rosas-Guevara, S. D. M. White, M. Baes, C. M. Booth, P. Camps, J. F. Navarro, Y. Qu, A. Rahmati, T. Sawala, P. A. Thomas, and J. Trayford, The EAGLE project: simulating the evolution and assembly of galaxies and their environments, MNRAS 446, 521 (2015), arXiv:1407.7040 [astro-ph.GA] .
- Nelson et al. [2019a] D. Nelson, V. Springel, A. Pillepich, V. Rodriguez-Gomez, P. Torrey, S. Genel, M. Vogelsberger, R. Pakmor, F. Marinacci, R. Weinberger, L. Kelley, M. Lovell, B. Diemer, and L. Hernquist, The IllustrisTNG simulations: public data release, Computational Astrophysics and Cosmology 6, 2 (2019a), arXiv:1812.05609 [astro-ph.GA] .
- Kannan et al. [2022] R. Kannan, E. Garaldi, A. Smith, R. Pakmor, V. Springel, M. Vogelsberger, and L. Hernquist, Introducing the THESAN project: radiation-magnetohydrodynamic simulations of the epoch of reionization, MNRAS 511, 4005 (2022), arXiv:2110.00584 [astro-ph.GA] .
- Shapley et al. [2003] A. E. Shapley, C. C. Steidel, M. Pettini, and K. L. Adelberger, Rest-Frame Ultraviolet Spectra of z~3 Lyman Break Galaxies, ApJ 588, 65 (2003), arXiv:astro-ph/0301230 [astro-ph] .
- Ouchi et al. [2005] M. Ouchi, K. Shimasaku, M. Akiyama, K. Sekiguchi, H. Furusawa, S. Okamura, N. Kashikawa, M. Iye, T. Kodama, T. Saito, T. Sasaki, C. Simpson, T. Takata, T. Yamada, H. Yamanoi, M. Yoshida, and M. Yoshida, The Discovery of Primeval Large-Scale Structures with Forming Clusters at Redshift 6, ApJ 620, L1 (2005), arXiv:astro-ph/0412648 [astro-ph] .
- Hu and Cowie [2006] E. M. Hu and L. L. Cowie, High-redshift galaxy populations, Nature 440, 1145 (2006).
- Hernández-Aguayo et al. [2023] C. Hernández-Aguayo, V. Springel, R. Pakmor, M. Barrera, F. Ferlito, S. D. M. White, L. Hernquist, B. Hadzhiyska, A. M. Delgado, R. Kannan, S. Bose, and C. Frenk, The MillenniumTNG Project: high-precision predictions for matter clustering and halo statistics, MNRAS 524, 2556 (2023), arXiv:2210.10059 [astro-ph.CO] .
- Pakmor et al. [2023] R. Pakmor, V. Springel, J. P. Coles, T. Guillet, C. Pfrommer, S. Bose, M. Barrera, A. M. Delgado, F. Ferlito, C. Frenk, B. Hadzhiyska, C. Hernández-Aguayo, L. Hernquist, R. Kannan, and S. D. M. White, The MillenniumTNG Project: the hydrodynamical full physics simulation and a first look at its galaxy clusters, MNRAS 524, 2539 (2023), arXiv:2210.10060 [astro-ph.CO] .
- Kannan et al. [2023] R. Kannan, V. Springel, L. Hernquist, R. Pakmor, A. M. Delgado, B. Hadzhiyska, C. Hernández-Aguayo, M. Barrera, F. Ferlito, S. Bose, S. D. M. White, C. Frenk, A. Smith, and E. Garaldi, The MillenniumTNG project: the galaxy population at z 8, MNRAS 524, 2594 (2023), arXiv:2210.10066 [astro-ph.GA] .
- Ferlito et al. [2023] F. Ferlito, V. Springel, C. T. Davies, C. Hernández-Aguayo, R. Pakmor, M. Barrera, S. D. M. White, A. M. Delgado, B. Hadzhiyska, L. Hernquist, R. Kannan, S. Bose, and C. Frenk, The MillenniumTNG Project: the impact of baryons and massive neutrinos on high-resolution weak gravitational lensing convergence maps, MNRAS 524, 5591 (2023), arXiv:2304.12338 [astro-ph.CO] .
- Delgado et al. [2023] A. M. Delgado, D. Anglés-Alcázar, L. Thiele, S. Pandey, K. Lehman, R. S. Somerville, M. Ntampaka, S. Genel, F. Villaescusa-Navarro, and L. Hernquist, Predicting the impact of feedback on matter clustering with machine learning in CAMELS, MNRAS 10.1093/mnras/stad2992 (2023), arXiv:2301.02231 [astro-ph.GA] .
- Bose et al. [2023] S. Bose, B. Hadzhiyska, M. Barrera, A. M. Delgado, F. Ferlito, C. Frenk, C. Hernández-Aguayo, L. Hernquist, R. Kannan, R. Pakmor, V. Springel, and S. D. M. White, The MillenniumTNG Project: the large-scale clustering of galaxies, MNRAS 524, 2579 (2023), arXiv:2210.10065 [astro-ph.CO] .
- Contreras et al. [2023] S. Contreras, R. E. Angulo, V. Springel, S. D. M. White, B. Hadzhiyska, L. Hernquist, R. Pakmor, R. Kannan, C. Hernández-Aguayo, M. Barrera, F. Ferlito, A. M. Delgado, S. Bose, and C. Frenk, The MillenniumTNG Project: inferring cosmology from galaxy clustering with accelerated N-body scaling and subhalo abundance matching, MNRAS 524, 2489 (2023), arXiv:2210.10075 [astro-ph.GA] .
- Hadzhiyska et al. [2023a] B. Hadzhiyska, D. Eisenstein, L. Hernquist, R. Pakmor, S. Bose, A. M. Delgado, S. Contreras, R. Kannan, S. D. M. White, V. Springel, C. Frenk, C. Hernández-Aguayo, F. F. Barrera, and Monica, The MillenniumTNG Project: an improved two-halo model for the galaxy-halo connection of red and blue galaxies, MNRAS 524, 2507 (2023a), arXiv:2210.10072 [astro-ph.CO] .
- Hadzhiyska et al. [2023b] B. Hadzhiyska, L. Hernquist, D. Eisenstein, A. M. Delgado, S. Bose, R. Kannan, R. Pakmor, V. Springel, S. Contreras, M. Barrera, F. Ferlito, C. Hernández-Aguayo, S. D. M. White, and C. Frenk, The MillenniumTNG Project: refining the one-halo model of red and blue galaxies at different redshifts, MNRAS 524, 2524 (2023b), arXiv:2210.10068 [astro-ph.CO] .
- Barrera et al. [2023] M. Barrera, V. Springel, S. D. M. White, C. Hernández-Aguayo, L. Hernquist, C. Frenk, R. Pakmor, F. Ferlito, B. Hadzhiyska, A. M. Delgado, R. Kannan, and S. Bose, The MillenniumTNG Project: semi-analytic galaxy formation models on the past lightcone, MNRAS 525, 6312 (2023), arXiv:2210.10419 [astro-ph.CO] .
- Weinberger et al. [2017] R. Weinberger, V. Springel, L. Hernquist, A. Pillepich, F. Marinacci, R. Pakmor, D. Nelson, S. Genel, M. Vogelsberger, J. Naiman, and P. Torrey, Simulating galaxy formation with black hole driven thermal and kinetic feedback, MNRAS 465, 3291 (2017), arXiv:1607.03486 [astro-ph.GA] .
- Pillepich et al. [2018a] A. Pillepich, V. Springel, D. Nelson, S. Genel, J. Naiman, R. Pakmor, L. Hernquist, P. Torrey, M. Vogelsberger, R. Weinberger, and F. Marinacci, Simulating galaxy formation with the IllustrisTNG model, MNRAS 473, 4077 (2018a), arXiv:1703.02970 [astro-ph.GA] .
- Pillepich et al. [2018b] A. Pillepich, D. Nelson, L. Hernquist, V. Springel, R. Pakmor, P. Torrey, R. Weinberger, S. Genel, J. P. Naiman, F. Marinacci, and M. Vogelsberger, First results from the IllustrisTNG simulations: the stellar mass content of groups and clusters of galaxies, MNRAS 475, 648 (2018b), arXiv:1707.03406 [astro-ph.GA] .
- Nelson et al. [2018] D. Nelson, A. Pillepich, V. Springel, R. Weinberger, L. Hernquist, R. Pakmor, S. Genel, P. Torrey, M. Vogelsberger, G. Kauffmann, F. Marinacci, and J. Naiman, First results from the IllustrisTNG simulations: the galaxy colour bimodality, MNRAS 475, 624 (2018), arXiv:1707.03395 [astro-ph.GA] .
- Naiman et al. [2018] J. P. Naiman, A. Pillepich, V. Springel, E. Ramirez-Ruiz, P. Torrey, M. Vogelsberger, R. Pakmor, D. Nelson, F. Marinacci, L. Hernquist, R. Weinberger, and S. Genel, First results from the IllustrisTNG simulations: a tale of two elements - chemical evolution of magnesium and europium, MNRAS 477, 1206 (2018), arXiv:1707.03401 [astro-ph.GA] .
- Marinacci et al. [2018] F. Marinacci, M. Vogelsberger, R. Pakmor, P. Torrey, V. Springel, L. Hernquist, D. Nelson, R. Weinberger, A. Pillepich, J. Naiman, and S. Genel, First results from the IllustrisTNG simulations: radio haloes and magnetic fields, MNRAS 480, 5113 (2018), arXiv:1707.03396 [astro-ph.CO] .
- Springel et al. [2018] V. Springel, R. Pakmor, A. Pillepich, R. Weinberger, D. Nelson, L. Hernquist, M. Vogelsberger, S. Genel, P. Torrey, F. Marinacci, and J. Naiman, First results from the IllustrisTNG simulations: matter and galaxy clustering, MNRAS 475, 676 (2018), arXiv:1707.03397 [astro-ph.GA] .
- Nelson et al. [2019b] D. Nelson, A. Pillepich, V. Springel, R. Pakmor, R. Weinberger, S. Genel, P. Torrey, M. Vogelsberger, F. Marinacci, and L. Hernquist, First results from the TNG50 simulation: galactic outflows driven by supernovae and black hole feedback, MNRAS 490, 3234 (2019b), arXiv:1902.05554 [astro-ph.GA] .
- Pillepich et al. [2019] A. Pillepich, D. Nelson, V. Springel, R. Pakmor, P. Torrey, R. Weinberger, M. Vogelsberger, F. Marinacci, S. Genel, A. van der Wel, and L. Hernquist, First results from the TNG50 simulation: the evolution of stellar and gaseous discs across cosmic time, MNRAS 490, 3196 (2019), arXiv:1902.05553 [astro-ph.GA] .
- Springel [2010] V. Springel, E pur si muove: Galilean-invariant cosmological hydrodynamical simulations on a moving mesh, MNRAS 401, 791 (2010), arXiv:0901.4107 [astro-ph.CO] .
- Davis et al. [1985] M. Davis, G. Efstathiou, C. S. Frenk, and S. D. M. White, The evolution of large-scale structure in a universe dominated by cold dark matter, ApJ 292, 371 (1985).
- Springel et al. [2021] V. Springel, R. Pakmor, O. Zier, and M. Reinecke, Simulating cosmic structure formation with the GADGET-4 code, MNRAS 506, 2871 (2021), arXiv:2010.03567 [astro-ph.IM] .
- Bryan and Norman [1998] G. L. Bryan and M. L. Norman, Statistical Properties of X-Ray Clusters: Analytic and Numerical Comparisons, ApJ 495, 80 (1998), arXiv:astro-ph/9710107 [astro-ph] .
- Zheng et al. [2005] Z. Zheng, A. A. Berlind, D. H. Weinberg, A. J. Benson, C. M. Baugh, S. Cole, R. Dave, C. S. Frenk, N. Katz, and C. G. Lacey, Theoretical models of the halo occupation distribution: Separating central and satellite galaxies, Astrophys. J. 633, 791 (2005), arXiv:astro-ph/0408564 [astro-ph] .
- Ouchi et al. [2020] M. Ouchi, Y. Ono, and T. Shibuya, Observations of the Lyman- Universe, ARA&A 58, 617 (2020), arXiv:2012.07960 [astro-ph.GA] .
- Dijkstra and Westra [2010] M. Dijkstra and E. Westra, Star formation indicators and line equivalent width in Ly galaxies, MNRAS 401, 2343 (2010), arXiv:0911.1357 [astro-ph.CO] .
- Nagamine et al. [2010] K. Nagamine, M. Ouchi, V. Springel, and L. Hernquist, Lyman- Emitters and Lyman-Break Galaxies at z = 3-6 in Cosmological SPH Simulations, PASJ 62, 1455 (2010), arXiv:0802.0228 [astro-ph] .
- Inoue et al. [2014] A. K. Inoue, I. Shimizu, I. Iwata, and M. Tanaka, An updated analytic model for attenuation by the intergalactic medium, MNRAS 442, 1805 (2014), arXiv:1402.0677 [astro-ph.CO] .
- Reid and White [2011] B. A. Reid and M. White, Towards an accurate model of the redshift-space clustering of haloes in the quasi-linear regime, MNRAS 417, 1913 (2011), arXiv:1105.4165 [astro-ph.CO] .
- Gao and White [2007] L. Gao and S. D. M. White, Assembly bias in the clustering of dark matter haloes, MNRAS 377, L5 (2007), arXiv:astro-ph/0611921 [astro-ph] .
- Zehavi et al. [2018] I. Zehavi, S. Contreras, N. Padilla, N. J. Smith, C. M. Baugh, and P. Norberg, The Impact of Assembly Bias on the Galaxy Content of Dark Matter Halos, ApJ 853, 84 (2018), arXiv:1706.07871 [astro-ph.GA] .
- Artale et al. [2018] M. C. Artale, I. Zehavi, S. Contreras, and P. Norberg, The impact of assembly bias on the halo occupation in hydrodynamical simulations, MNRAS 480, 3978 (2018), arXiv:1805.06938 [astro-ph.GA] .
- Yuan et al. [2022] S. Yuan, L. H. Garrison, B. Hadzhiyska, S. Bose, and D. J. Eisenstein, ABACUSHOD: a highly efficient extended multitracer HOD framework and its application to BOSS and eBOSS data, MNRAS 510, 3301 (2022), arXiv:2110.11412 [astro-ph.CO] .
- Maksimova et al. [2021] N. A. Maksimova, L. H. Garrison, D. J. Eisenstein, B. Hadzhiyska, S. Bose, and T. P. Satterthwaite, ABACUSSUMMIT: a massive set of high-accuracy, high-resolution N-body simulations, MNRAS 508, 4017 (2021), arXiv:2110.11398 [astro-ph.CO] .
- Note [1] A caveat in that statement is the dependence of halo properties on the halo finding algorithm and simulation resolution.
- Hadzhiyska et al. [2021b] B. Hadzhiyska, S. Tacchella, S. Bose, and D. J. Eisenstein, The galaxy-halo connection of emission-line galaxies in IllustrisTNG, MNRAS 502, 3599 (2021b), arXiv:2011.05331 [astro-ph.GA] .
- More et al. [2011] S. More, A. V. Kravtsov, N. Dalal, and S. Gottlöber, The Overdensity and Masses of the Friends-of-friends Halos and Universality of Halo Mass Function, ApJS 195, 4 (2011), arXiv:1103.0005 [astro-ph.CO] .
- Gawiser et al. [2007] E. Gawiser, H. Francke, K. Lai, K. Schawinski, C. Gronwall, R. Ciardullo, R. Quadri, A. Orsi, L. F. Barrientos, G. A. Blanc, G. Fazio, J. J. Feldmeier, J.-s. Huang, L. Infante, P. Lira, N. Padilla, E. N. Taylor, E. Treister, C. M. Urry, P. G. van Dokkum, and S. N. Virani, Ly-Emitting Galaxies at z = 3.1: L* Progenitors Experiencing Rapid Star Formation, ApJ 671, 278 (2007), arXiv:0710.2697 [astro-ph] .
- Guaita et al. [2010] L. Guaita, E. Gawiser, N. Padilla, H. Francke, N. A. Bond, C. Gronwall, R. Ciardullo, J. J. Feldmeier, S. Sinawa, G. A. Blanc, and S. Virani, Ly-emitting Galaxies at z = 2.1 in ECDF-S: Building Blocks of Typical Present-day Galaxies?, ApJ 714, 255 (2010), arXiv:0910.2244 [astro-ph.CO] .
- Ouchi et al. [2010] M. Ouchi, K. Shimasaku, H. Furusawa, T. Saito, M. Yoshida, M. Akiyama, Y. Ono, T. Yamada, K. Ota, N. Kashikawa, M. Iye, T. Kodama, S. Okamura, C. Simpson, and M. Yoshida, Statistics of 207 Ly Emitters at a Redshift Near 7: Constraints on Reionization and Galaxy Formation Models, ApJ 723, 869 (2010), arXiv:1007.2961 [astro-ph.CO] .
- Bielby et al. [2016] R. M. Bielby, P. Tummuangpak, T. Shanks, H. Francke, N. H. M. Crighton, E. Bañados, J. González-López, L. Infante, and A. Orsi, The VLT LBG redshift survey - V. Characterizing the z = 3.1 Lyman emitter population, MNRAS 456, 4061 (2016), arXiv:1501.01215 [astro-ph.GA] .
- Hao et al. [2018] C.-N. Hao, J.-S. Huang, X. Xia, X. Zheng, C. Jiang, and C. Li, A Deep Ly Survey in ECDF-S and COSMOS. I. General Properties of Ly Emitters at z 2, ApJ 864, 145 (2018), arXiv:1808.02704 [astro-ph.GA] .
- Khostovan et al. [2019] A. A. Khostovan, D. Sobral, B. Mobasher, J. Matthee, R. K. Cochrane, N. Chartab, M. Jafariyazani, A. Paulino-Afonso, S. Santos, and J. Calhau, The clustering of typical Ly emitters from z 2.5-6: host halo masses depend on Ly and UV luminosities, MNRAS 489, 555 (2019), arXiv:1811.00556 [astro-ph.GA] .
- Ramakrishnan et al. [2023] V. Ramakrishnan, B. Moon, S. H. Im, R. Farooq, K.-S. Lee, E. Gawiser, Y. Yang, C. Park, H. S. Hwang, F. Valdes, M. C. Artale, R. Ciardullo, A. Dey, C. Gronwall, L. Guaita, W.-S. Jeong, N. Padilla, A. Singh, and A. Zabludoff, ODIN: Where Do Ly Blobs Live? Contextualizing Blob Environments within Large-scale Structure, ApJ 951, 119 (2023), arXiv:2302.07860 [astro-ph.GA] .
- Lee et al. [2024] K.-S. Lee, E. Gawiser, C. Park, Y. Yang, F. Valdes, D. Lang, V. Ramakrishnan, B. Moon, N. Firestone, S. Appleby, M. C. Artale, M. Andrews, F. Bauer, B. Benda, A. Broussard, Y.-K. Chiang, R. Ciardullo, A. Dey, R. Farooq, C. Gronwall, L. Guaita, Y. Huang, H. S. Hwang, S. H. Im, W.-S. Jeong, S. Karthikeyan, H. Kim, S. Kim, A. Kumar, G. R. Nagaraj, J. Nantais, N. Padilla, J. Park, A. Pope, R. Popescu, D. Schlegel, E. Seo, A. Singh, H. Song, P. Troncoso, A. K. Vivas, A. Zabludoff, and A. Zenteno, The One-hundred-deg2 DECam Imaging in Narrowbands (ODIN): Survey Design and Science Goals, ApJ 962, 36 (2024), arXiv:2309.10191 [astro-ph.GA] .
- McQuinn et al. [2007] M. McQuinn, L. Hernquist, M. Zaldarriaga, and S. Dutta, Studying reionization with Ly emitters, MNRAS 381, 75 (2007), arXiv:0704.2239 [astro-ph] .
- Weinberger et al. [2018] L. H. Weinberger, G. Kulkarni, M. G. Haehnelt, T. R. Choudhury, and E. Puchwein, Lyman- emitters gone missing: the different evolution of the bright and faint populations, MNRAS 479, 2564 (2018), arXiv:1803.03789 [astro-ph.GA] .
- Weinberger et al. [2019] L. H. Weinberger, M. G. Haehnelt, and G. Kulkarni, Modelling the observed luminosity function and clustering evolution of Ly emitters: growing evidence for late reionization, MNRAS 485, 1350 (2019), arXiv:1902.05077 [astro-ph.GA] .
- Garel et al. [2015] T. Garel, J. Blaizot, B. Guiderdoni, L. Michel-Dansac, M. Hayes, and A. Verhamme, The UV, Lyman , and dark matter halo properties of high-redshift galaxies, MNRAS 450, 1279 (2015), arXiv:1503.06635 [astro-ph.GA] .
- Zheng et al. [2011] Z. Zheng, R. Cen, H. Trac, and J. Miralda-Escudé, Radiative Transfer Modeling of Ly Emitters. II. New Effects on Galaxy Clustering, ApJ 726, 38 (2011), arXiv:1003.4990 [astro-ph.CO] .
- Behrens et al. [2018] C. Behrens, C. Byrohl, S. Saito, and J. C. Niemeyer, The impact of Lyman- radiative transfer on large-scale clustering in the Illustris simulation, A&A 614, A31 (2018), arXiv:1710.06171 [astro-ph.GA] .
- Momose et al. [2021] R. Momose, K. Shimasaku, K. Nagamine, I. Shimizu, N. Kashikawa, M. Ando, and H. Kusakabe, Catch Me if You Can: Biased Distribution of Ly-emitting Galaxies according to the Viewing Direction, ApJ 912, L24 (2021), arXiv:2104.10580 [astro-ph.GA] .
- Ebina and White [2024] H. Ebina and M. White, Cosmology before noon with multiple galaxy populations, arXiv e-prints , arXiv:2401.13166 (2024), arXiv:2401.13166 [astro-ph.CO] .
- Zehavi et al. [2002b] I. Zehavi, M. R. Blanton, J. A. Frieman, D. H. Weinberg, H. J. Mo, M. A. Strauss, S. F. Anderson, J. Annis, N. A. Bahcall, M. Bernardi, J. W. Briggs, J. Brinkmann, S. Burles, L. Carey, F. J. Castander, A. J. Connolly, I. Csabai, J. J. Dalcanton, S. Dodelson, M. Doi, D. Eisenstein, M. L. Evans, D. P. Finkbeiner, S. Friedman, M. Fukugita, J. E. Gunn, G. S. Hennessy, R. B. Hindsley, Ž. Ivezić, S. Kent, G. R. Knapp, R. Kron, P. Kunszt, D. Q. Lamb, R. F. Leger, D. C. Long, J. Loveday, R. H. Lupton, T. McKay, A. Meiksin, A. Merrelli, J. A. Munn, V. Narayanan, M. Newcomb, R. C. Nichol, R. Owen, J. Peoples, A. Pope, C. M. Rockosi, D. Schlegel, D. P. Schneider, R. Scoccimarro, R. K. Sheth, W. Siegmund, S. Smee, Y. Snir, A. Stebbins, C. Stoughton, M. SubbaRao, A. S. Szalay, I. Szapudi, M. Tegmark, D. L. Tucker, A. Uomoto, D. Vanden Berk, M. S. Vogeley, P. Waddell, B. Yanny, and D. G. York, Galaxy Clustering in Early Sloan Digital Sky Survey Redshift Data, ApJ 571, 172 (2002b), arXiv:astro-ph/0106476 [astro-ph] .
- Baugh [2008] C. M. Baugh, Creating synthetic universes in a computer, Philosophical Transactions of the Royal Society of London Series A 366, 4381 (2008).
- Zheng [2005] Z. Zheng, Astrophys. J. 633, 38 (2005).
- Landy and Szalay [1993] M. Landy and A. Szalay, ApJ 412, 8 (1993).
- Dijkstra [2009] M. Dijkstra, Mon. Not. R. Astron. Soc 401, 6 (2009).
- Bryan and Norman [1998] G. Bryan and M. Norman, Astrophys. J. 495, 20 (1998).