Near-ground state cooling in electromechanics using measurement-based feedback and Josephson parametric amplifier
Abstract
Feedback-based control of nano- and micromechanical resonators can enable the study of macroscopic quantum phenomena and also sensitive force measurements. Here, we demonstrate the feedback cooling of a low-loss and high-stress macroscopic SiN membrane resonator close to its quantum ground state. We use the microwave optomechanical platform, where the resonator is coupled to a microwave cavity. The experiment utilizes a Josephson travelling wave parametric amplifier, which is nearly quantum-limited in added noise, and is important to mitigate resonator heating due to system noise in the feedback loop. We reach a thermal phonon number as low as 1.6, which is limited primarily by microwave-induced heating. We also discuss the sideband asymmetry observed when a weak microwave tone for independent readout is applied in addition to other tones used for the cooling. The asymmetry can be qualitatively attributed to the quantum-mechanical imbalance between emission and absorption. However, we find that the observed asymmetry is only partially due to this quantum effect. In specific situations, the asymmetry is fully dominated by a cavity Kerr effect under multitone irradiation.
I INTRODUCTION
Preparing and controlling mechanical oscillators in the quantum regime of their motion has been an active subject of research. This has provided a platform for observing macroscopic quantum phenomena Riedinger et al. (2018); Ockeloen-Korppi et al. (2018); Arrangoiz-Arriola et al. (2019); Kotler et al. (2021); Schrinski et al. (2023), and is showing promise for studying new physics Marin et al. (2013); Nimmrichter et al. (2014); Bahrami et al. (2014); Bawaj et al. (2015); Vinante et al. (2016); Carney et al. (2021); Manley et al. (2021), especially the connection between quantum mechanics and gravity Belenchia et al. (2016); Al Balushi et al. (2018); Liu et al. (2021); Westphal et al. (2021); Pedernales et al. (2022). A carefully engineered system of mechanical oscillators also has applications in other types of quantum sensing Aguiar (2011); Goryachev and Tobar (2014); Jacobs et al. (2017); Qvarfort et al. (2018). It is quite evident that for all these goals, it is beneficial, if not necessary, to cool the motion of the oscillator close to the quantum ground state. Any unnecessary thermal noise energy will add fluctuations, making it more difficult to observe or utilize quantum correlations. For purely sensing applications, thermal noise will mask the oscillator’s response to weak forces.
The frequencies of typical mechanical modes in somewhat massive systems are low compared to thermal energy scales, resulting in a thermally excited phonon number greater than one even at deep cryogenic temperatures Aspelmeyer et al. (2014). Therefore, there is a need to develop alternative ways to cool the system. Mechanical devices are most typically brought into the quantum domain by interfacing them with cavity optomechanics, in which the radiation pressure forces from the light field are coupled to the oscillator’s motion.
There are two main experimental approaches to cooling in cavity optomechanical systems that are effective. One of them is sideband cooling Metzger and Karrai (2004); Gigan et al. (2006); Rocheleau et al. (2010); Teufel et al. (2011); Chan et al. (2011), in which the radiation pressure force from the cavity field is used to autonomously dampen the mechanical motion. The second approach is measurement based feedback control of the oscillator Cohadon et al. (1999); Kleckner and Bouwmeester (2006); Poggio et al. (2007); Wilson et al. (2015); Rossi et al. (2018). It is based on measuring the position of the mechanical oscillator and applying a viscous feedback force through a time delayed loop in accordance with the measurement outcome. Roughly speaking, the sideband cooling scheme is more efficient in the resolved-sideband limit, i.e., when the cavity bandwidth is smaller than the mechanical frequency, which results in a time-delayed force from the slowly changing cavity. Feedback cooling is more suitable in the opposite situation, namely the unresolved-sideband limit, where a fast cavity can track the oscillator’s position at a high time resolution. The unresolved-sideband situation arises necessarily when resonators with low frequencies, such as 100 Hz … 10 kHz are used, because cavity linewidths smaller than this become experimentally unfeasible. Cooled resonators in this regime Abbott et al. (2009) are becoming more and more relevant in basic studies related to gravity Liu et al. (2021); Tobar et al. (2023).
The experimental challenge faced in feedback cooling an oscillator close to the quantum ground state is that the measurement must happen on a time scale faster than the coherence time of the oscillator. This leads, first of all, to the requirements of a relatively low starting temperature and a high quality factor of the oscillator. Second, the added noise in the measurement cannot be too far from a quantum-limited noise level. After the inception of the concept of feedback cooling in cavity optomechanics Mancini et al. (1998), it took a long time before the ground state was reached experimentally Rossi et al. (2018), as these requirements were difficult to meet. Typically the experiments utilized a cavity optomechanical system that works truly at optical wavelengths, where the system noise is naturally small, but the setup is not naturally compatible with operation in a dilution refrigerator, which would allow for a low thermal occupancy to begin with. Feedback cooling was recently demonstrated in an electrical realization of cavity optomechanics Wang et al. (2023), which works naturally at mK temperatures, but where a larger system noise typical of microwave setups did not allow for near-ground state cooling.
In this work, we combine to the electromechanical feedback setup the necessary prerequisites for ground-state cooling: a high level of mechanical coherence, and a low system noise. Different from earlier work, we introduce a Josephson travelling wave parametric amplifier (JTWPA) Macklin et al. (2015), which reduces the added noise in our system by a factor of five, enabling feedback cooling close to the ground state. As the mechanical device, we use a silicon nitride membrane, which offers one of the best quality factors in the microwave optomechanical setup at cryogenic temperatures Yuan et al. (2015a, b); Noguchi et al. (2016); Liu et al. (2022); Seis et al. (2022). Additionally, we directly measure the mechanical noise energy through sidebands of an auxiliary weak thermometry tone instead of inferring it from the in-loop noise spectrum as in our earlier work Wang et al. (2023).
Thermometry with a relatively weak tone, as in our current study, can be used to directly demonstrate quantum-mechanical behaviour in optomechanical systems. This derives from the fact that spectral densities of quantum systems are not symmetrical in frequency, which leads to substantial difference in emission and absorption in the quantum oscillator, and asymmetry in the emission spectrum which is not too difficult to observe using currently available techniques Safavi-Naeini et al. (2012); Weinstein et al. (2014); Underwood et al. (2015); Qiu et al. (2020); Cattiaux et al. (2021). It was recently pointed out Qiu et al. (2019), however, that such asymmetric emission can be an artefact arising as a combination of multi-tone irradiation and a nonlinear cavity in an optical-regime optomechanical system. We observe and analyze such an artificial sideband asymmetry, which is attributed to fast thermal modulation of the cavity frequency, similar to Ref. Qiu et al. (2019).
II Theoretical discussion
In this section, we first discuss the scheme of cavity optomechanical measurement, including some subtleties. Then we briefly review how feedback cooling is realized in optomechanics, and how the temperature of the cooled mechanical mode can be measured using an additional thermometry tone. We focus on discussing the thermometry, which becomes not straightforward under the application of multiple tones, which can lead to unwanted couplings between sideband processes.
II.1 Microwave optomechanical system
Cavity optomechanics describes the interaction of electromagnetic fields and mechanical motion inside a cavity resonator. Originally, the electromagnetic fields were treated as optical, but more recently, a large amount of research has utilized microwave-frequency fields. These experiments are well-suited operating in dilution refrigerators at temperatures down to 10 mK. We assume a standard cavity optomechanical device, where the electromagnetic cavity with frequency is coupled parametrically to a mechanical oscillator of frequency , such that the oscillator modulates the cavity frequency. The system is described by the Hamiltonian
| (1) |
Here, the cavity is described by the standard operators , , and the mechanical oscillator similarly by and . The single-photon radiation-pressure coupling is , which in our case is determined by the strength of the capacitive coupling between the oscillator and the microwave-frequency cavity.
As typical with mechanical oscillators operating in the high kHz or MHz frequency regime, the thermal phonon number even at mK temperatures. Although the cavity is in principle thermalized to zero thermal population in the refrigerator, it is often found that the strong driving fields heat up the cavity in microwave experiments, such that a non-zero and significant thermal photon population appears.
The energy losses in the system are described as follows: The mechanical oscillator has the intrinsic energy loss rate . For the cavity, we write the loss rate as , which consists of internal losses (), and external losses (), the latter describing coupling to the measurement apparatus.
In the basic optomechanics measurement, which also forms the starting point of feedback cooling, a single coherent tone of the frequency is applied to the device. The detuning from the cavity is . The pumping with the coherent drive induces a photon number , which results in the effective coupling , and the linearized interaction .
In the reflection measurement, the monitored signal is the electromagnetic field
| (2) |
leaking out from the cavity, which encodes the mechanical information in frequency sidebands of . Here, is the external input noise, which is assumed to be at the vacuum level. This signal is amplified with a linear amplifier, characterized by the added number of noise quanta . At this point, the signal can be steered to processing, for example towards generation of the feedback.
In a heterodyne readout, the spectral densities of the mechanical sidebands can be used as a primary thermometer due to the mentioned quantum asymmetry of the sideband weights. Typically, this measurement is carried out by driving the system sequentially at the red or blue sideband, and the relevant mechanical sideband appears at the cavity frequency in the output spectrum Safavi-Naeini et al. (2012). The off-resonant sideband is usually suppressed by the cavity susceptibility. With red-sideband driving, , the relevant sideband is the anti-Stokes process, where photons scatter upwards in frequency. In the blue-detuned case, , the Stokes-scattered sideband is relevant. The spectral weights of the sidebands are denoted by and for the Stokes and anti-Stokes processes, respectively. If the dynamical backaction can be neglected, the weights directly provide the phonon occupation number:
| (3) |
For example, at the ground state , the anti-Stokes sideband vanishes.
The result in Eq. (3) holds, too, if the system is driven at zero detuning , in which case both sidebands are simultaneously observable, moreover, any dynamical backaction does not compromise the interpretation of the sideband weights. We choose a situation close to this in our experiment.
There are several caveats to this basic picture of sideband asymmetry in optomechanics. The simplest deviation from the ideal case is if the detuning is neither at the red or blue sideband, nor equal to zero. In these cases, the cavity susceptibility distorts the sideband weights. This effect is small in our experiment, but nevertheless has to be considered in the analysis. Another, more delicate issue is that classical cavity noise adds on top of the zero-point noise in a manner that is qualitatively indistinguishable from the latter, by causing “noise squashing”, i.e., destructive interference for the anti-Stokes sideband Zhou et al. (2021); Golokolenov et al. (2021). The noise emission from the hot cavity, disregarding optomechanics, follows a Lorentzian profile
| (4) |
At a relatively small detuning , and operating in the resolved-sideband limit, the contribution of the cavity noise on the sideband asymmetry is negligible, however, with our current experimental parameters, we cannot neglect it.
II.2 Feedback cooling and detection
Feedback cooling, also known as cold damping, is a classic example of measurement based control of a system. There is extensive theoretical and experimental literature describing feedback cooling in the standard cavity optomechanical setup. For convenience, we repeat below the main results, which are here extended to cover non-negligible internal cavity losses, and a finite cavity thermal population , as these are relevant to describe the experiments below. We use the nomenclature introduced in Ref. Wang et al. (2023), which conveniently suits microwave setups where the noise level is described in units of added noise quanta, rather than photon collection efficiency in optics.
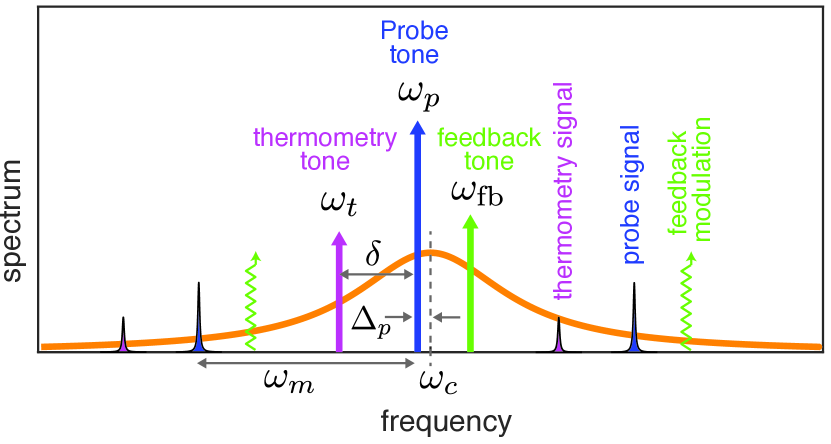
The system is measured by a strong probe tone at the frequency , typically at the cavity frequency (see Fig. 1). This tone is associated with the effective coupling . The feedback operation, based on the probe’s measurement results, amplifies the mechanical signal by a real-valued and positive amplitude gain , as well as applies a time delay such that a phase shift results at the mechanical frequency. By means of phase modulation to an additional feedback tone, the signal is then converted into the feedback force that drives the oscillator.
Depending on the phase shift, the feedback force either counteracts the oscillator’s random motion and thus cools it, or amplifies the motion. Immediately below, we assume that the detuning of the probe tone is zero: . This implies that the dynamical backaction, i.e., sideband cooling or amplification, is absent. The effective oscillator is characterized by the damping rate
| (5) |
where the maximum feedback-induced damping at an optimum phase is
| (6) |
Under optimum feedback conditions, the oscillator experiences cooling down to a thermal phonon number given by
| (7) |
Here, the thermal and quantum backaction contributions are, including cavity noise, respectively
| (8) | ||||
| (9) |
with the effective cooperativity
| (10) |
The cooling is typically limited by the system noise being injected back to the oscillator, causing heating given by
| (11) |
The last term in Eq. (9) in parentheses indicates that cavity noise contributes to the feedback heating by a large weight, because enters with a large prefactor.
In this work, we measure directly by an additional tone, called the thermometry tone, applied at a frequency , with the corresponding detuning , and the effective coupling . We also denote as the frequency spacing between the probe tone and the thermometry tone, i.e., . The thermometry tone drops sidebands at the frequencies , the energy of which, after calibration, gives . The frequency configuration of all the tones applied is shown in Fig. 1.
II.3 Cavity Kerr effect
If several coherent tones are applied to an ideal optomechanical system, the processes they induce can typically be treated as independent, if the corresponding spectra do not overlap. This allows, for example, to carry out independent readout of the mechanical mode in addition to specific operations, or to treat frequency components of the cavity as separate cavities Mercier de Lépinay et al. (2020).
However, the picture may break down if additional physics beyond the basic radiation-pressure interaction are active. Notably, a Kerr-type cavity which involves thermal modulation was shown in Ref. Qiu et al. (2019) to result in a coupling of the processes, and to qualitatively different outcomes regarding the weights of the up- and downconverted mechanical sidebands of a thermometry tone, which compromises the interpretation of the sideband asymmetry solely as a quantum effect.
Before going to the theoretical analysis, let us discuss the sources of nonlinearities in microwave resonators at mK temperatures, effects usually associated with coupling to microscopic two-level defects (TLS) in amorphous oxides typically residing on surfaces Martinis et al. (2005); Gao et al. (2008); Suh et al. (2013). The most pronounced observation is that the internal damping of the resonators can show a dependence on the applied microwave power. This power dependence is easily observable, and typically significant. Strong resonant irradiation saturates the TLS’s, which leads to enhancement of the quality factor, even by several orders of magnitude, at high input microwave powers. Temperature-dependent changes due to TLS’s also take place von Schickfus and Hunklinger (1976), especially of the resonant frequency, which red-shifts towards higher temperatures.
Another mechanism that contributes to cavity nonlinearity in microwave optomechanics is a change of the BCS superconductors’ surface impedance as a function of the applied power or increasing temperature, which increases the kinetic inductance of the superconducting microstrip, as a result red-shifting the cavity at high powers and elevated temperatures. In the presented experiment, we find that this latter effect becomes relevant.
We note that in our case, the microwave resonator is a 3-dimensional cavity, which is not superconducting, and thus a question arises if there can be effects due to TLS, or breakdown of superconductivity. However, a significant amount of the electromagnetic energy resides in the aluminium thin films on the chips inside the cavity that comprise our optomechanical system.
As a summary of the above discussion, we can expect changes to both the damping rate and the resonant frequency of the microwave resonance as a function of the electromagnetic energy, i.e., basically the Kerr effect. The system is thus modeled as . The most natural choice for the origin of the Kerr effect is the energy-dependent frequency shift of the cavity, i.e., with the Kerr constant .
For our experimental readout, we are interested in the sidebands dropped into the output spectrum by the thermometry tone (effective coupling ), under the influence of the much stronger probe tone (effective coupling ). We remind the frequency spacing of the two tones; .
We operate in the rotating frame of the probe tone, and write the cavity fields with the coherent driving fields of amplitude and for the probe and thermometry tone, respectively, and with the small fluctuation :
| (12) |
Hereafter, we rename .
After standard linearization of the model under the strong fields and , we obtain
| (13) |
with the thermometry part
| (14) |
The linearized Kerr Hamiltonian includes parametric modulation processes, and in particular a slow modulation of the cavity frequency. The latter is treated as dominant over the parametric terms, and we get
| (15) |
We further define the effective Kerr constant . More details are given in Appendix A. Based on the model in Eq. (13), we can obtain the full output spectrum, and in particular the mechanical sidebands due to the thermometry tone. In the calculation, we include the cavity internal losses and accompanying thermal cavity noise as these are significant in our experiment. In the experimentally relevant case involving also nonzero , arbitrary , and a sideband resolution which is neither in the resolved or unresolved limit, we calculate the output spectrum numerically to compare directly to the experiment. Generally, we find that the Kerr effect introduces an artificial sideband asymmetry Qiu et al. (2019), which when included allows us to reach a reasonable agreement with the measurements.
III Experimental setup
III.1 Device
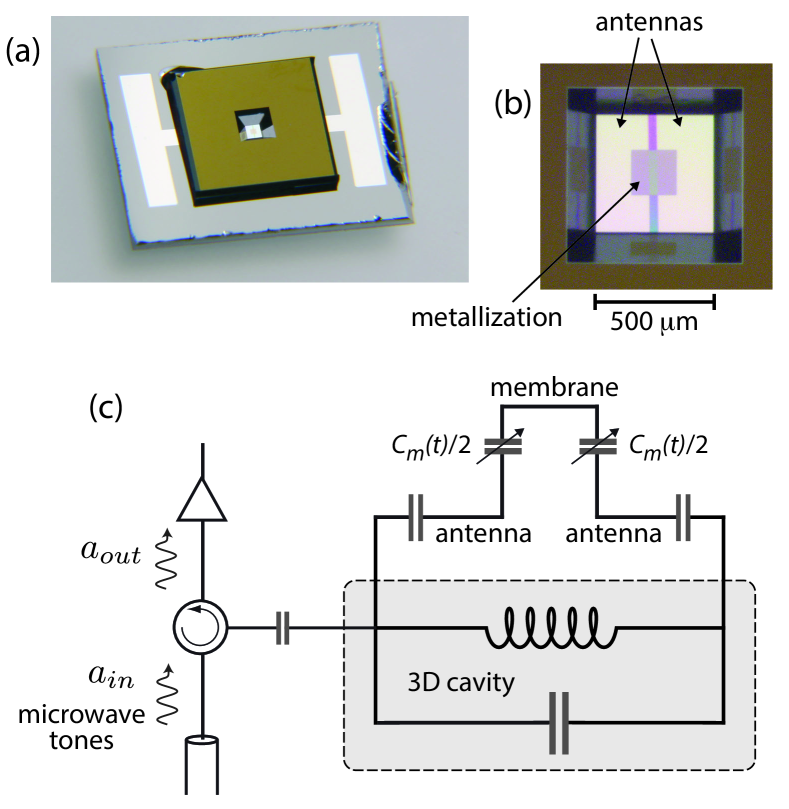
Our mechanical resonator is a 0.5 mm SiN membrane from Norcada with a thickness of 50 nm and a high tensile stress of GPa, sitting inside a 5 mm Si frame. The membrane is metallized with 50 nm of aluminium in the form of a 200 m square at its centre. The metallized membrane is flipped on top of a separate patterned Si chip where a 100 nm thick aluminium antenna has been fabricated Liu et al. (2022). Once flipped on top of the antenna, the membrane chip is glued from one of the corners using epoxy. The gap between the membrane chip and the aluminium antenna is crucial as a small gap yields a higher value of the vacuum optomechanical coupling strength . We estimated the gap in our device to be less than 500 nm. The chip assembly is then glued inside a 3D cavity made of annealed high-purity copper. The entire schematic is shown in Fig. 2.
The device is investigated in a dry dilution refrigerator whose base temperature is about 10 mK. Operating SiN resonators inside dry cryostats has turned out to be problematic due to large vibration noise from the pulse tube, which can strongly excite the mode to energies well above that at the thermal equilibrium at the cryostat temperature Yuan et al. (2015a). In comparison, aluminum drum resonators with frequencies in the 10 MHz range and lower quality factors do not suffer significantly from the pulse tube force noise Teufel et al. (2011); Ockeloen-Korppi et al. (2018). The SiN resonators, however, are susceptible to pulse tube noise because the much larger quality factors enhance the sensitivity to the force noise, which already is likely larger at the lower resonant frequencies. Here we find that directly attaching the cavity box to the cryostat does not allow the mode energy to thermalize below an unacceptably high temperature mK when the pulse tube is running. In order to mitigate the problem, we have implemented an acoustic filtering described in Ref. Liu et al. (2021), consisting of three 5 cm copper cubes cascaded via 3 cm diameter ring springs made of stainless steel. With the acoustic filtering, the mode energy thermalizes down to mK, and reaches the base temperature if the pulse tube is switched off.
The mechanical mode has a resonance frequency kHz and has an intrinsic damping rate mHz. The resonance frequency of the cavity, including the chip inside, is GHz. The internal and external damping rates of the cavity, and , respectively, are kHz and MHz. The cavity is thus largely overcoupled, but not in the limit of fully dominating external coupling. This introduces some signal loss inside the cavity, which limits the feedback cooling via Eq. (11), if .
III.2 Microwave scheme
As discussed above, the experimental setup utilizes separate tones for the purpose of probing, and for creating the feedback force, shown in Fig. 1. The probe tone is kept very close to the cavity resonance frequency, with the detuning (see below), the feedback tone is above the cavity frequency at kHz and the thermometry tone is at the red detuning kHz. There are several reasons behind the choice of such specific detunings. The three tones and their sideband processes are separated well enough () in frequency that they do not overlap each other and hence can be treated independently. On the other hand, all tones are close to the cavity frequency (all detunings ) such that their dynamical backaction remains as small as possible, and they all can be simultaneously notch-filtered to remove generator phase noise. Additionally, the opposite detunings of the thermometry and feedback tones helps to cancel their dynamical backaction.
The feedback setup at room temperature follows closely that presented in Ref. Wang et al. (2023). A homodyne detection is performed using the probe tone as the local oscillator. The demodulated signal is then filtered to remove unnecessary broadband noise before being sent to the FPGA. The FPGA is a 14 bit acquisition device whose function is custom signal processing in real time. It is programmed in such a way that it can reproduce the signal after application of band-pass filtering, time delaying, and amplification. The bandwidth of the digital filter, which has to be clearly larger than the maximum effective damping of the mechanics, is set at 1 kHz around the demodulated mechanical frequency. The output of the FPGA is then sent to a phase modulator, which is driven by the feedback tone. The modulated feedback tone consists of two sidebands (shown in green in Fig. 1). At the sample level, the sidebands mix with the tone itself to create a feedback force approximately proportional to the velocity of the mechanical oscillator. The probe, feedback and thermometry tones are combined at room temperature and notch filtered to remove generator noise before being injected into the refrigerator and sample.
The separate readout thermometry, an important part of our setup, is outside the feedback bandwidth, and is implemented out-of-loop owing to the large frequency separation between tones. Details of the thermometry calibration are given in Appendix B.
III.3 JTWPA characterization
An integral part of our experiment is a Josephson travelling wave parametric amplifier (JTWPA), described in Ref. Perelshtein et al. (2022). This device is operated in a three-wave mixing mode, which is enabled by flux-biasing the junction chain, thus creating asymmetric nonlinearity in the Josephson potential. The device is therefore pumped at approximately twice the intended amplification frequencies. Similar to the initial designs of four-wave mixing JTWPA Macklin et al. (2015), the device offers several GHz of instantaneous bandwidth, with the added noise possibly close to the quantum limit of half a photon. A benefit of this design is that the relatively strong JTWPA pump tone can be easily removed by low-pass filtering with a cutoff at the upper limit GHz of the natural bandwidth of the system.
Our JTWPA is pumped at approximately 11 GHz, and its pumping power and flux bias are optimized for a large enough gain and the lowest noise. At the chosen operation point, the gain is in the range of 20 dB. This gain is sufficient such that the effective noise of the next stage amplification, typically quanta in our setup, becomes negligible.
The added noise of cryogenic microwave amplifiers is typically determined using a known tunable noise source, such as a heated matched resistor as close as possible to the input of the amplifier. We use, instead, a known noise signal arising from the microwave optomechanics itself, namely the mechanical sideband in the output spectrum, and relying on the well-established theoretical model for it. Generally speaking, we use the signal-to-noise ratio of a sideband measured at known conditions, versus the background noise floor. The details of this procedure are given in Appendix B. We obtain the effective system added noise at the sample plane quanta. The noise of the JTWPA itself is smaller because of the inevitable, and somewhat significant losses between the sample and the amplifier. In our case, the losses are estimated to be in the range of dB, and thus the JTWPA noise is on the order 2 quanta, which is above the quantum limit because of internal losses in the device.
IV Results
IV.1 Dynamical backaction
In the ideal model case of measurement-based feedback cooling, the oscillator is damped only via the feedback. This case is satisfied with strictly zero probe detuning , and vanishing powers of the thermometry and feedback tones, because all three tones will in principle contribute dynamical backaction which will either cool or heat the oscillator on top of the feedback.
However, with the current parameters, in particular having a small intrinsic mechanical damping , a significant dynamical backaction will appear at nearly vanishing values of detuning of any of the tones, in particular of the strong probe tone. As an example, a mere Hz of probe detuning will contribute an optical damping equal to the intrinsic damping. Setting the detuning so accurately, in order to reach essentially , is not possible based on independent calibration of the cavity frequency via linear response measurement relying on the reflection. Moreover, the cavity frequency was found to slightly drift during the experimental runs.
We aim at setting the detuning of the probe tone such that the final cooling is fully dominated by the feedback cooling. Since the thermometry and feedback tones have opposite detunings and they are not too strong, the two optical spring effects will roughly cancel. With all three tones switched on, we adjust the probe detuning such that the effective damping without feedback becomes on the order a few hundred mHz. This corresponds to kHz. While adjusting towards a smaller absolute value results in a reduced effective damping approaching the intrinsic value, the mechanics was found to become unstable likely due to cavity drift and intermittent excursions into the blue-detuned region. We note, however, that the tones apply a significant quantum and thermal backaction heating to the oscillator, and in spite of effective damping more than an order of magnitude above the intrinsic damping, the oscillator is only cooled by % by the dynamical backaction associated to the three tones.
The noise background in the measurement is the sum of added noise and vacuum noise, i.e., quanta. Via Eq. (4), this information allows for determining the cavity heating taking place at strong microwave irradiation, appearing as a noise raise by a certain factor. We obtain at the probe tone powers discussed in this work. This noise becomes the major limiting factor in feedback cooling.
IV.2 Feedback cooling
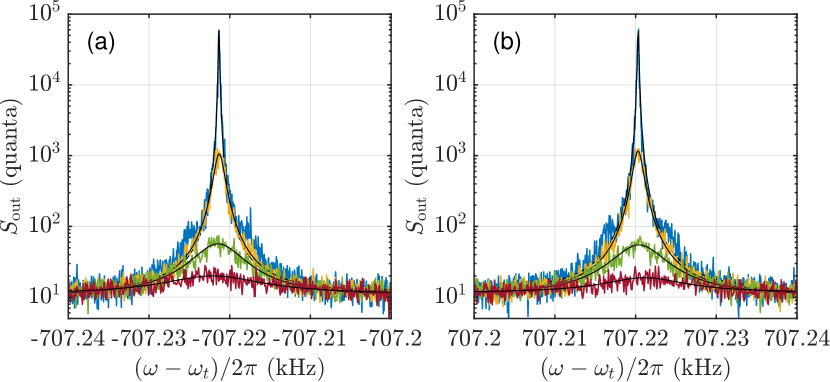
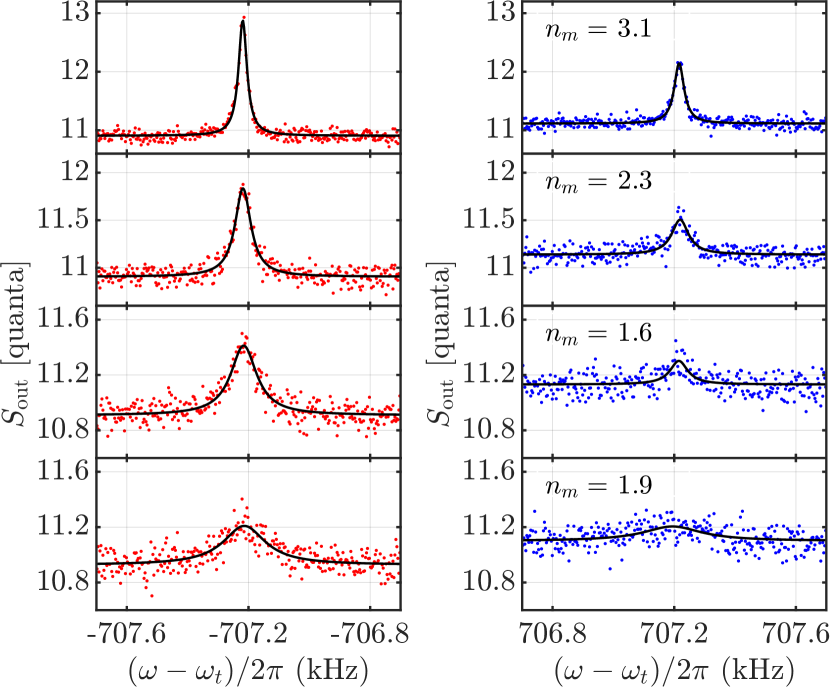
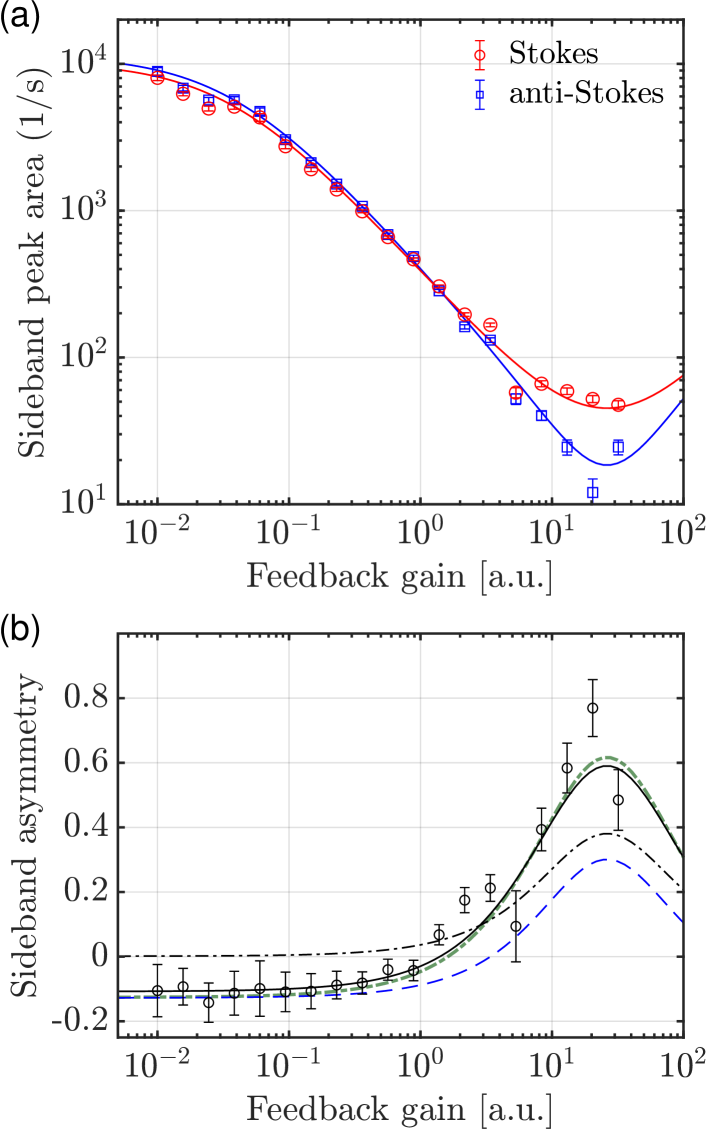
To proceed with the actual feedback measurements, we calibrate the effective coupling of the probe tone via changing its detuning, and studying the effective damping with the feedback not yet applied. This gives kHz for the main data which is discussed next. The phase of the feedback is optimized for minimal frequency shift and maximum damping. The two spectral peaks measured with the thermometry tone in heterodyne readout are shown in Fig. 3 at low feedback gain values. The peaks are seen to be nearly of equal height, but the right-hand-side (anti-Stokes) peak is slightly taller because of the negative detuning of the thermometry tone. At the highest feedback gains, shown in Fig. 4, the asymmetry becomes pronounced, and also swaps sign as compared to small cooling.
Notice that the noise floor in Figs. 3, 4 is approximately twice that expected from the system noise and cavity heating contribution. To reach the system noise floor in the heterodyne measurement associated to the thermometry tone, it is necessary to filter out the image frequency which introduces unnecessary noise. In the present case, the filtering was not possible due to the proximity of all the tones. Notice also that for the probe tone, the measurement is homodyne, and such a problem does not exist.
We now inspect in detail the sideband asymmetry defined in terms of the measured peak weights in the thermometry signal:
| (16) |
This is linked to the mechanical occupation via Eq. (3), but the important caveats discussed below Eq. (3) have to be considered. We show in Fig. 5 (a) the weights of the two sidebands of the out-of-loop thermometry tone processed from the peaks shown in Figs. 3, 4. At high gains above , the peak areas cease decreasing because the feedback cooling looses its efficiency. The asymmetry of these peak weights is further plotted in Fig. 5 (b). Both panels also show the theoretical expectations based on our model, evaluated numerically. The blue long-dashed line in Fig. 5 (b) shows the basic model of the asymmetry, which accounts for the finite thermometry tone detuning, but no cavity heating. In this case, the asymmetry at high gain (low mechanical occupation) values is primarily due to the quantum asymmetry. Notice that the measured asymmetry is clearly higher – due to the noise squashing by the extra cavity noise. The short-dashed green line shows the theoretical model including cavity noise. This already shows a good agreement with the measurement without any free parameters.
We now include the cavity Kerr effect in the theoretical model. The best fit is shown in Fig. 5 (b) as the solid black line. Although not very evident, this displays a better fit in the low-gain region. Without considering the cavity Kerr effect, we could not get rid of this small discrepancy even by letting the calibrated parameters float beyond their expected range. The best fit, focusing in the low-gain region where the data is less scattered, is reached at the Kerr coefficient kHz (see Eq. (15)) which indicates that the cavity frequency is slowly modulated by this amount. Although the value is small as compared to e.g. the cavity linewidth, this parameter plays a role since it is not negligible as compared to the tone detunings. The more fundamental Kerr constant is not currently accessible as we cannot calibrate the values of the driven cavity fields and well enough.
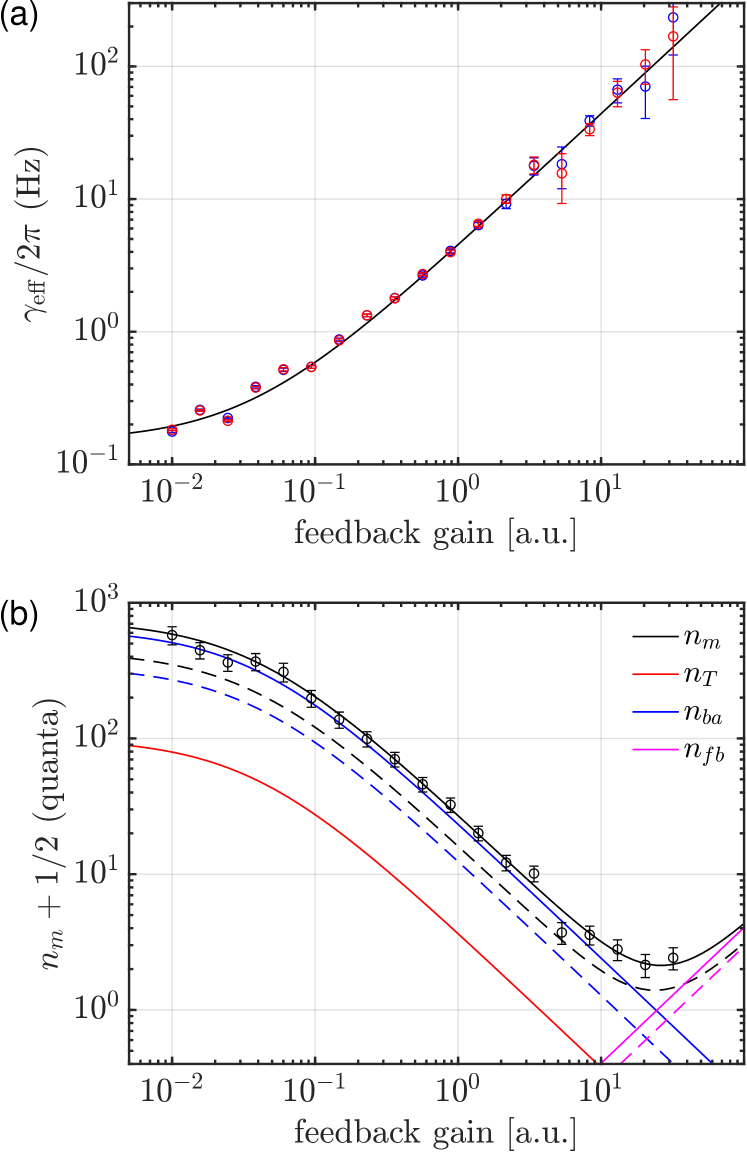
The main result of interest, describing the ultimate feedback cooling of the oscillator, is displayed in Fig. 6. We reach the thermal occupation of the oscillator . In the figure we also examine the limiting factors of the cooling. The dashed lines represent the expected case without cavity noise, for example, the blue dashed line is the pure quantum backaction due to the strong measurement. The thermal backaction is nearly double the quantum backaction at lower gains, and is the dominant limiting factor at the optimum gain around . The cavity heating puts less severe restriction on the noise injection heating because of the suppression by the cavity susceptibility (Eq. (11)). Disregarding the cavity heating, the case which is shown with the black dashed line, ground-state cooling () should be possible.
Based on our numerical model, we find that similar to Ref. Qiu et al. (2019), the transduction of the thermometry is insensitive to the Kerr effect, which primarily distributes the same energy between the two sidebands. Based on our model, the transduction, however, is affected on the order % by the noise squashing by cavity heating. We thus correct the thermometry signal from the measured peak areas by the expected transduction efficiency affected both by the Kerr effect and noise squashing. The corrections are also taken into account in the theoretical predictions plotted in Figs. 5, 6.
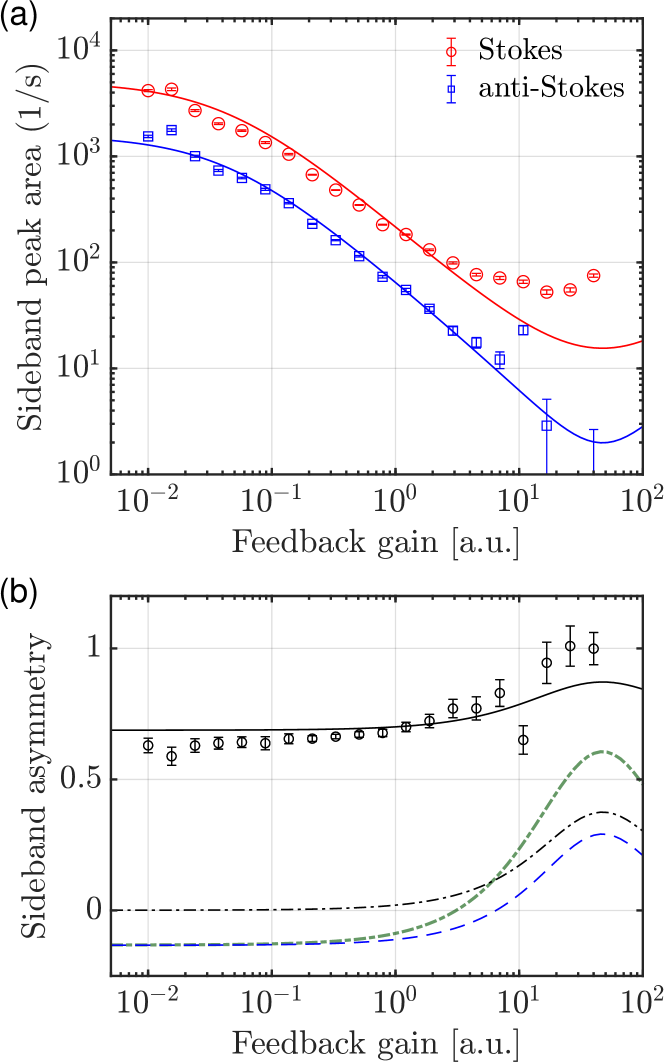
Finally, the situation with sideband asymmetry is markedly different if we increase the probe effective coupling by 5 dB, up to kHz. This is seen in Fig. 7, which is the same as Fig. 5 that was measured at lower probe power. Even in the absence of any feedback cooling the Stokes sideband is more than three times larger than the anti-Stokes sideband. This massive sideband imbalance obviously cannot be associated to the asymmetry due to the oscillator being cooled close to the ground state.
The extracted asymmetry is displayed in Fig. 7 (b). It becomes reasonably well explained by the cavity Kerr effect, using the effective Kerr constant as an adjustable parameter, as shown by the solid black line in the figure. The best fit is obtained with kHz, a much larger value than above with the smaller probe power. In addition to the larger Kerr constant, the asymmetry in this case is also enhanced through the dynamics with the more unequal values of the couplings and .
We also notice in Fig. 7 (a) that the overall sideband peak area remains significantly high even at large gains . The feedback cooling in this case is possible only down to quanta. We assume the inhibited cooling and discrepancy to the cooling model is caused by the Floquet dynamics also affecting the feedback cooling dynamics, not only the thermometry. This, however, is beyond our theoretical model.
V Discussion
The largely different effective Kerr constants between the two discussed probe effective couplings, which differ by nearly two orders of magnitude, cannot be explained based on Eq. (15) at a fixed value of the original constant , but the value has to be power-dependent. This is explained as a departure from BCS superconductivity via temperature-dependent kinetic inductance of the aluminum film. The kinetic inductance affects the resonance frequency of the cavity, which becomes dependent on the instantaneous temperature determined by the slow modulation of cavity energy. In our devices, cavity frequency becomes sharply temperature dependent above mK. Such very nonlinear temperature dependence is the likely reason for the strongly power-dependent . Based on this, the largest probe power modulates the cavity temperature up to mK, while the temperature modulation depth at the smaller discussed power is too small to be determined.
VI Conclusions
We have shown that a feedback-controlled microwave optomechanical device involving a membrane oscillator with a high quality factor can be cooled close to the ground state. In order to substantially cut the noise being injected back to the device, we used a Josephson Travelling Wave Parametric Amplifier (JTWPA), which exhibits down to 2 quanta of added noise at 4.5 GHz. Technical heating of the cavity becomes a limiting factor for the feedback cooling, which enhances the measurement backaction to values clearly larger than the fundamental quantum backaction. Future improvements include reducing cavity internal losses which will likely help with cavity heating, and optimizing the JTWPA for even smaller noise. This will open the door for more sophisticated measurement-based control of mechanical motion Clerk et al. (2008); Hofer et al. (2011); Woolley and Clerk (2013), which include quantum backaction evading measurements, or mechanical teleportation.
Acknowledgements.
We would like to thank Laure Mercier de Lépinay for useful discussions and Robab Najafi Jabdaraghi for parametric amplifier fabrication. We acknowledge the facilities and technical support of Otaniemi research infrastructure for Micro and Nanotechnologies (OtaNano). This work was supported by the Academy of Finland (contract 352189), and by the European Research Council (contract 101019712). The work was performed as part of the Academy of Finland Centre of Excellence program (contracts 352932, and 336810). We acknowledge funding from the European Union’s Horizon 2020 research and innovation program under grant agreement 824109, the European Microkelvin Platform (EMP), and QuantERA II Programme (contract 13352189). The work at VTT was supported in part by the Research Council of Finland through Grant 321700 and through its Centres of Excellence program under Grants 352934 and 336819, in part by the EU Flagship on Quantum Technology H2020-FETFLAG-2018-03 Project under Grant 820363 OpenSuperQ, and in part by HORIZON-CL4-2022-QUANTUM-01-SGA Project under Grant 101113946 OpenSuperQPlus100.References
- Riedinger et al. (2018) Ralf Riedinger, Andreas Wallucks, Igor Marinković, Clemens Löschnauer, Markus Aspelmeyer, Sungkun Hong, and Simon Gröblacher, “Remote quantum entanglement between two micromechanical oscillators,” Nature 556, 473–477 (2018).
- Ockeloen-Korppi et al. (2018) C. F. Ockeloen-Korppi, E. Damskägg, J. M. Pirkkalainen, M. Asjad, A. A. Clerk, F. Massel, M. J. Woolley, and M. A. Sillanpää, “Stabilized entanglement of massive mechanical oscillators,” Nature 556, 478–482 (2018).
- Arrangoiz-Arriola et al. (2019) Patricio Arrangoiz-Arriola, E. Alex Wollack, Zhaoyou Wang, Marek Pechal, Wentao Jiang, Timothy P. McKenna, Jeremy D. Witmer, Raphaël Van Laer, and Amir H. Safavi-Naeini, “Resolving the energy levels of a nanomechanical oscillator,” Nature 571, 537–540 (2019).
- Kotler et al. (2021) Shlomi Kotler, Gabriel A. Peterson, Ezad Shojaee, Florent Lecocq, Katarina Cicak, Alex Kwiatkowski, Shawn Geller, Scott Glancy, Emanuel Knill, Raymond W. Simmonds, José Aumentado, and John D. Teufel, “Direct observation of deterministic macroscopic entanglement,” Science 372, 622–625 (2021).
- Schrinski et al. (2023) Björn Schrinski, Yu Yang, Uwe von Lüpke, Marius Bild, Yiwen Chu, Klaus Hornberger, Stefan Nimmrichter, and Matteo Fadel, “Macroscopic quantum test with bulk acoustic wave resonators,” Phys. Rev. Lett. 130, 133604 (2023).
- Marin et al. (2013) Francesco Marin, Francesco Marino, Michele Bonaldi, Massimo Cerdonio, Livia Conti, Paolo Falferi, Renato Mezzena, Antonello Ortolan, Giovanni A. Prodi, Luca Taffarello, Gabriele Vedovato, Andrea Vinante, and Jean-Pierre Zendri, “Gravitational bar detectors set limits to Planck-scale physics on macroscopic variables,” Nature Physics 9, 71–73 (2013).
- Nimmrichter et al. (2014) Stefan Nimmrichter, Klaus Hornberger, and Klemens Hammerer, “Optomechanical sensing of spontaneous wave-function collapse,” Phys. Rev. Lett. 113, 020405 (2014).
- Bahrami et al. (2014) M. Bahrami, M. Paternostro, A. Bassi, and H. Ulbricht, “Proposal for a noninterferometric test of collapse models in optomechanical systems,” Phys. Rev. Lett. 112, 210404 (2014).
- Bawaj et al. (2015) Mateusz Bawaj, Ciro Biancofiore, Michele Bonaldi, Federica Bonfigli, Antonio Borrielli, Giovanni Di Giuseppe, Lorenzo Marconi, Francesco Marino, Riccardo Natali, Antonio Pontin, Giovanni A. Prodi, Enrico Serra, David Vitali, and Francesco Marin, “Probing deformed commutators with macroscopic harmonic oscillators,” Nature Communications 6, 7503 (2015).
- Vinante et al. (2016) A. Vinante, M. Bahrami, A. Bassi, O. Usenko, G. Wijts, and T. H. Oosterkamp, “Upper bounds on spontaneous wave-function collapse models using millikelvin-cooled nanocantilevers,” Phys. Rev. Lett. 116, 090402 (2016).
- Carney et al. (2021) Daniel Carney, Anson Hook, Zhen Liu, Jacob M Taylor, and Yue Zhao, “Ultralight dark matter detection with mechanical quantum sensors,” New Journal of Physics 23, 023041 (2021).
- Manley et al. (2021) Jack Manley, Mitul Dey Chowdhury, Daniel Grin, Swati Singh, and Dalziel J. Wilson, “Searching for vector dark matter with an optomechanical accelerometer,” Phys. Rev. Lett. 126, 061301 (2021).
- Belenchia et al. (2016) Alessio Belenchia, Dionigi M. T. Benincasa, Stefano Liberati, Francesco Marin, Francesco Marino, and Antonello Ortolan, “Testing quantum gravity induced nonlocality via optomechanical quantum oscillators,” Phys. Rev. Lett. 116, 161303 (2016).
- Al Balushi et al. (2018) Abdulrahim Al Balushi, Wan Cong, and Robert B. Mann, “Optomechanical quantum Cavendish experiment,” Phys. Rev. A 98, 043811 (2018).
- Liu et al. (2021) Yulong Liu, Jay Mummery, Jingwei Zhou, and Mika A. Sillanpää, “Gravitational forces between nonclassical mechanical oscillators,” Phys. Rev. Applied 15, 034004 (2021).
- Westphal et al. (2021) Tobias Westphal, Hans Hepach, Jeremias Pfaff, and Markus Aspelmeyer, “Measurement of gravitational coupling between millimetre-sized masses,” Nature 591, 225–228 (2021).
- Pedernales et al. (2022) Julen S. Pedernales, Kirill Streltsov, and Martin B. Plenio, “Enhancing gravitational interaction between quantum systems by a massive mediator,” Phys. Rev. Lett. 128, 110401 (2022).
- Aguiar (2011) Odylio Denys Aguiar, “Past, present and future of the resonant-mass gravitational wave detectors,” Research in Astronomy and Astrophysics 11, 1 (2011).
- Goryachev and Tobar (2014) Maxim Goryachev and Michael E. Tobar, “Gravitational wave detection with high frequency phonon trapping acoustic cavities,” Phys. Rev. D 90, 102005 (2014).
- Jacobs et al. (2017) Kurt Jacobs, Radhakrishnan Balu, and John D. Teufel, “Quantum-enhanced accelerometry with a nonlinear electromechanical circuit,” Phys. Rev. A 96, 023858 (2017).
- Qvarfort et al. (2018) Sofia Qvarfort, Alessio Serafini, P. F. Barker, and Sougato Bose, “Gravimetry through non-linear optomechanics,” Nature Communications 9, 3690 (2018).
- Aspelmeyer et al. (2014) Markus Aspelmeyer, Tobias J. Kippenberg, and Florian Marquardt, “Cavity optomechanics,” Rev. Mod. Phys. 86, 1391–1452 (2014).
- Metzger and Karrai (2004) C H Metzger and K Karrai, “Cavity cooling of a microlever,” Nature 432, 1002–1005 (2004).
- Gigan et al. (2006) S. Gigan, H. R. Böhm, M. Paternostro, F. Blaser, G. Langer, J. B. Hertzberg, K. C. Schwab, D. Bäuerle, M. Aspelmeyer, and A. Zeilinger, “Self-cooling of a micromirror by radiation pressure,” Nature 444, 67–70 (2006).
- Rocheleau et al. (2010) T Rocheleau, T Ndukum, C Macklin, J B Hertzberg, A A Clerk, and K C Schwab, “Preparation and detection of a mechanical resonator near the ground state of motion,” Nature 463, 72–75 (2010).
- Teufel et al. (2011) J. D. Teufel, T. Donner, Dale Li, J. W. Harlow, M. S. Allman, K. Cicak, A. J. Sirois, J. D. Whittaker, K. W. Lehnert, and R. W. Simmonds, “Sideband cooling of micromechanical motion to the quantum ground state,” Nature 475, 359–363 (2011).
- Chan et al. (2011) Jasper Chan, Thiago Alegre, Amir Safavi-Naeini, Jeff Hill, Alexander Krause, Simon Groeblacher, Markus Aspelmeyer, and Oskar Painter, “Laser cooling of a nanomechanical oscillator into its quantum ground state,” Nature 478, 89–92 (2011).
- Cohadon et al. (1999) P. F. Cohadon, A. Heidmann, and M. Pinard, “Cooling of a mirror by radiation pressure,” Phys. Rev. Lett. 83, 3174–3177 (1999).
- Kleckner and Bouwmeester (2006) Dustin Kleckner and Dirk Bouwmeester, “Sub-kelvin optical cooling of a micromechanical resonator,” Nature 444, 75–8 (2006).
- Poggio et al. (2007) M. Poggio, C. L. Degen, H. J. Mamin, and D. Rugar, “Feedback cooling of a cantilever’s fundamental mode below 5 mK,” Phys. Rev. Lett. 99, 017201 (2007).
- Wilson et al. (2015) D. J. Wilson, V. Sudhir, N. Piro, R. Schilling, A. Ghadimi, and T. J. Kippenberg, “Measurement-based control of a mechanical oscillator at its thermal decoherence rate,” Nature 524, 325–329 (2015).
- Rossi et al. (2018) Massimiliano Rossi, David Mason, Junxin Chen, Yeghishe Tsaturyan, and Albert Schliesser, “Measurement-based quantum control of mechanical motion,” Nature 563, 53–58 (2018).
- Abbott et al. (2009) B Abbott, R Abbott, R Adhikari, and P Ajith, “Observation of a kilogram-scale oscillator near its quantum ground state,” New Journal of Physics 11, 073032 (2009).
- Tobar et al. (2023) Germain Tobar, Sreenath K. Manikandan, Thomas Beitel, and Igor Pikovski, “Detecting single gravitons with quantum sensing,” (2023), arXiv:2308.15440 .
- Mancini et al. (1998) Stefano Mancini, David Vitali, and Paolo Tombesi, “Optomechanical cooling of a macroscopic oscillator by homodyne feedback,” Phys. Rev. Lett. 80, 688–691 (1998).
- Wang et al. (2023) Cheng Wang, Louise Banniard, Laure Mercier de Lépinay, and Mika A. Sillanpää, “Fast feedback control of mechanical motion using circuit optomechanics,” Phys. Rev. Appl. 19, 054091 (2023).
- Macklin et al. (2015) C. Macklin, K. O’Brien, D. Hover, M. E. Schwartz, V. Bolkhovsky, X. Zhang, W. D. Oliver, and I. Siddiqi, “A near-quantum-limited Josephson traveling-wave parametric amplifier,” Science 350, 307–310 (2015).
- Yuan et al. (2015a) Mingyun Yuan, Vibhor Singh, Yaroslav M. Blanter, and Gary A. Steele, “Large cooperativity and microkelvin cooling with a three-dimensional optomechanical cavity,” Nat. Commun. 6, 8491 (2015a).
- Yuan et al. (2015b) Mingyun Yuan, Martijn A. Cohen, and Gary A. Steele, “Silicon nitride membrane resonators at millikelvin temperatures with quality factors exceeding ,” Applied Physics Letters 107, 263501 (2015b).
- Noguchi et al. (2016) Atsushi Noguchi, Rekishu Yamazaki, Manabu Ataka, Hiroyuki Fujita, Yutaka Tabuchi, Toyofumi Ishikawa, Koji Usami, and Yasunobu Nakamura, “Ground state cooling of a quantum electromechanical system with a silicon nitride membrane in a 3D loop-gap cavity,” New Journal of Physics 18, 103036 (2016).
- Liu et al. (2022) Yulong Liu, Jingwei Zhou, Laure Mercier de Lépinay, and Mika A Sillanpää, “Quantum backaction evading measurements of a silicon nitride membrane resonator,” New Journal of Physics 24, 083043 (2022).
- Seis et al. (2022) Yannick Seis, Thibault Capelle, Eric Langman, Sampo Saarinen, Eric Planz, and Albert Schliesser, “Ground state cooling of an ultracoherent electromechanical system,” Nature Communications 13, 1507 (2022).
- Safavi-Naeini et al. (2012) Amir H. Safavi-Naeini, Jasper Chan, Jeff T. Hill, Thiago P. Mayer Alegre, Alex Krause, and Oskar Painter, “Observation of quantum motion of a nanomechanical resonator,” Phys. Rev. Lett. 108, 033602 (2012).
- Weinstein et al. (2014) A. J. Weinstein, C. U. Lei, E. E. Wollman, J. Suh, A. Metelmann, A. A. Clerk, and K. C. Schwab, “Observation and interpretation of motional sideband asymmetry in a quantum electromechanical device,” Phys. Rev. X 4, 041003 (2014).
- Underwood et al. (2015) M. Underwood, D. Mason, D. Lee, H. Xu, L. Jiang, A. B. Shkarin, K. Børkje, S. M. Girvin, and J. G. E. Harris, “Measurement of the motional sidebands of a nanogram-scale oscillator in the quantum regime,” Phys. Rev. A 92, 061801(R) (2015).
- Qiu et al. (2020) Liu Qiu, Itay Shomroni, Paul Seidler, and Tobias J. Kippenberg, “Laser cooling of a nanomechanical oscillator to its zero-point energy,” Phys. Rev. Lett. 124, 173601 (2020).
- Cattiaux et al. (2021) D. Cattiaux, I. Golokolenov, S. Kumar, M. Sillanpää, L. Mercier de Lépinay, R. R. Gazizulin, X. Zhou, A. D. Armour, O. Bourgeois, A. Fefferman, and E. Collin, “A macroscopic object passively cooled into its quantum ground state of motion beyond single-mode cooling,” Nature Communications 12, 6182 (2021).
- Qiu et al. (2019) Liu Qiu, Itay Shomroni, Marie A. Ioannou, Nicolas Piro, Daniel Malz, Andreas Nunnenkamp, and Tobias J. Kippenberg, “Floquet dynamics in the quantum measurement of mechanical motion,” Phys. Rev. A 100, 053852 (2019).
- Zhou et al. (2021) Xin Zhou, Dylan Cattiaux, Didier Theron, and Eddy Collin, “Electric circuit model of microwave optomechanics,” Journal of Applied Physics 129, 114502 (2021).
- Golokolenov et al. (2021) Ilya Golokolenov, Dylan Cattiaux, Sumit Kumar, Mika Sillanpää, Laure Mercier de Lépinay, Andrew Fefferman, and Eddy Collin, “Microwave single-tone optomechanics in the classical regime,” New Journal of Physics 23, 053008 (2021).
- Mercier de Lépinay et al. (2020) Laure Mercier de Lépinay, Caspar F. Ockeloen-Korppi, Daniel Malz, and Mika A. Sillanpää, “Nonreciprocal transport based on cavity Floquet modes in optomechanics,” Phys. Rev. Lett. 125, 023603 (2020).
- Martinis et al. (2005) J. M. Martinis, K. B. Cooper, R. McDermott, M. Steffen, M. Ansmann, K. D. Osborn, K. Cicak, S. Oh, D. P. Pappas, R. W. Simmonds, and C. C. Yu, “Decoherence in Josephson qubits from dielectric loss,” Phys. Rev. Lett. 95, 210503 (2005).
- Gao et al. (2008) Jiansong Gao, Miguel Daal, John M. Martinis, Anastasios Vayonakis, Jonas Zmuidzinas, Bernard Sadoulet, Benjamin A. Mazin, Peter K. Day, and Henry G. Leduc, “A semiempirical model for two-level system noise in superconducting microresonators,” Applied Physics Letters 92, 212504 (2008).
- Suh et al. (2013) J. Suh, A. J. Weinstein, and K. C. Schwab, “Optomechanical effects of two-level systems in a back-action evading measurement of micro-mechanical motion,” Applied Physics Letters 103, 052604 (2013).
- von Schickfus and Hunklinger (1976) M von Schickfus and S Hunklinger, “The dielectric coupling of low-energy excitations in vitreous silica to electromagnetic waves,” Journal of Physics C: Solid State Physics 9, L439 (1976).
- Perelshtein et al. (2022) M.R. Perelshtein, K.V. Petrovnin, V. Vesterinen, S. Hamedani Raja, I. Lilja, M. Will, A. Savin, S. Simbierowicz, R.N. Jabdaraghi, J.S. Lehtinen, L. Grönberg, J. Hassel, M.P. Prunnila, J. Govenius, G.S. Paraoanu, and P.J. Hakonen, “Broadband Continuous-Variable Entanglement Generation Using a Kerr-Free Josephson Metamaterial,” Phys. Rev. Appl. 18, 024063 (2022).
- Clerk et al. (2008) A. A. Clerk, F. Marquardt, and K. Jacobs, “Back-action evasion and squeezing of a mechanical resonator using a cavity detector,” New Journal of Physics 10, 095010 (2008).
- Hofer et al. (2011) Sebastian G. Hofer, Witlef Wieczorek, Markus Aspelmeyer, and Klemens Hammerer, “Quantum entanglement and teleportation in pulsed cavity optomechanics,” Phys. Rev. A 84, 052327 (2011).
- Woolley and Clerk (2013) M. J. Woolley and A. A. Clerk, “Two-mode back-action-evading measurements in cavity optomechanics,” Phys. Rev. A 87, 063846 (2013).
- Malz and Nunnenkamp (2016) Daniel Malz and Andreas Nunnenkamp, “Floquet approach to bichromatically driven cavity-optomechanical systems,” Phys. Rev. A 94, 023803 (2016).
Appendix A Floquet formalism for sideband mixing
The equations of motion based on the linearized Hamiltonian in Eq. (13) are:
| (17) |
Here, the input noise to the cavity arises from the external coupling (), as well as from internal losses () which also describes technical heating of the cavity.
In Eq. (17) we cannot ignore off-resonant processes due to a low sideband resolution .
We start solving the system Eq. (17) by introducing the Floquet ansatz Malz and Nunnenkamp (2016); Qiu et al. (2019); Mercier de Lépinay et al. (2020)
| (18) |
where the index will be truncated over the dominant frequency components. In the end, the relevant Floquet components will be , and their Hermitian conjugates. The equations of motions for these components become
| (19) |
The quantity of interest, namely the thermometry signal occurring at , is written as a function of the input field as
| (20) |
The coefficients pertaining to the specific input fields are solved from Eq. (19), allowing for writing the output field of this component using standard procedure as
| (21) |
with the corresponding spectrum which is the final measured quantity.
Appendix B Data analysis
B.1 System added noise
The noise of the Josephson Travelling Wave Parametric Amplifier (JTWPA), more precisely, the effective system noise, was characterized using the mechanical signal as a known noise source. For driving, we used the probe tone, but for this purpose, we have to switch to a heterodyne measurement. Before mixing with a separate local oscillator, the image frequency at was filtered away in order not to introduce doubled noise.
We illustrate the method with the theoretical result for sideband cooling in the full resolved-sideband case. Disregarding cavity noise, the output spectrum around the anti-Stokes peak at the cavity frequency writes
| (22) |
The peak profile Eq. (22) is not accurate in our intermediate-sideband case, and in our actual analysis, we resort to numerical calculations. The device parameters, and the optical damping at a given generator power are easy to calibrate, and the mechanical thermal population is obtained from a standard thermal calibration. Thus, comparing the height of the Lorentzian in Eq. (22) to the noise floor, can be determined.
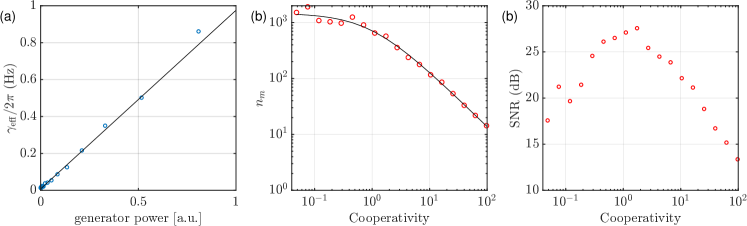
However, a problem exists, which may lead to significantly under-estimating the added noise. Usually in microwave optomechanics, the mechanics suffers from “technical heating” which raises the bath temperature (and also introduces cavity noise) towards large microwave powers for reasons not fully understood. Thus, the measurement should be performed at “low” power, but it is unclear how low is needed, morever, the peak becomes possibly too weak. This issue is circumvented by utilizing the entire family of peak+background traces obtained at different powers (the usual sideband cooling experiment), and making a collective fit by using the calibrated effective coupling as a shared fit parameter. The result of this exercise is summarized in Fig. 8, where in panels (a), (b) we display the basic characterization of the sideband cooling. In panel (c), we show the signal-to-noise ratio of each peak. Although the latter does not immediately yield the added noise, the low system noise is visible as the peaks are nearly 30 dB above the noise floor. The value of added noise comes from the fit as a determined parameter.
B.2 Thermometry
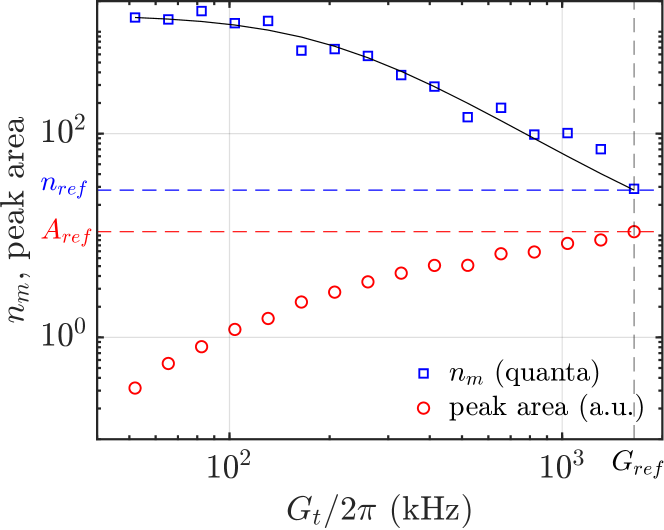
The thermometry with the separate thermometry tone allows in principle independent measurement of the mechanical energy and occupation number . However, like we discussed above, performance of the thermometry may be compromised by the coupling of the sidebands of the pump and thermometry tones due to the cavity Kerr effect. We will take this possible complication into account in detail in the analysis. To eliminate this problem being present at the starting point, we calibrate the thermometry with only the thermometry tone present, using regular sideband cooling.
For the thermometry calibration, we set the temperature of the refrigerator at a slightly elevated value of 50 mK to ensure the mechanical mode is reliably equilibrated at this temperature. The thermometry tone is set at the detuning kHz, which is the same value used in the feedback measurements. Although such a small detuning is clearly sub-optimal for sideband cooling, the resulting damping, nonetheless, reaches values up to times the intrinsic damping and allows for calibrating over a large dynamic range as shown in Fig. 9. We use a rather large kHz in order to recover a strong enough signal. At this value of effective coupling, we then link the phonon number to the peak area in the output spectrum as displayed in Fig. 9.