A Predictive Model for Catalytic Methane Pyrolysis
Abstract
Methane pyrolysis provides a scalable alternative to conventional hydrogen production methods, avoiding greenhouse gas emissions. However, high operating temperatures limit economic feasibility on an industrial scale. A major scientific goal is, therefore, to find a catalyst material that lowers operating temperatures, making methane pyrolysis economically viable. In this work, we derive a model that provides a qualitative comparison of possible catalyst materials. The model is based on calculations of adsorption energies using density functional theory. Thirty different elements were considered. Adsorption energies of intermediate molecules in the methane pyrolysis reaction correlate linearly with the adsorption energy of carbon. Moreover, the adsorption energy increases in magnitude with decreasing group number in the -block of the periodic table. For a temperature range between 600 and 1200 K and a normalized partial pressure range for between and , a total of nineteen different materials were found to be optimal catalysts at least once. This indicates that catalyst selection and reactor operating conditions should be well-matched. The present work establishes the foundation for future large-scale studies of surfaces, alloy compositions, and material classes using machine learning algorithms.
keywords:
American Chemical Society, LaTeXDepartment of Chemistry, University of Hamburg, Luruper Chaussee 149, 22761 Hamburg, Germany \abbreviationsIR,NMR,UV
1 Introduction
Hydrogen is an important energy carrier and chemical feedstock and has the potential to replace fossil hydrocarbons in industry and transportation. However, hydrogen production based on fossil fuels accounted for almost the entire production in 2021, with associated emissions of over 900 Mt of \ceCO_2. Although emission-free hydrogen production from water electrolysis has accelerated over the past few years, it covers only 0.1% of global demand 1. Thus, an economically and ecologically feasible bridging technology for hydrogen production is needed.
As suggested by Sánchez-Bastardo et al., a promising option is methane pyrolysis, i.e., thermal decomposition of methane in the absence of oxygen to form solid carbon and hydrogen 2.
| (1) |
While methane pyrolysis still relies on the extraction of natural gas, the process is \ceCO_2 emission-free. From an energetic point of view, only 37.5 kJ of energy is necessary to produce 1 mol of \ceH_2 via methane pyrolysis, compared to 286 kJ required for water electrolysis 3. Even though a significant reaction yield can be achieved only above 1200 °C 4, this figure can be substantially reduced by using a catalyst. There is a multitude of research efforts to develop an efficient and cost-effective catalyst 5, including metal- and carbon-based solids 6, 7, 8, molten salts 9, 10 as well as molten metals 11 and alloys 12, 13, 14, 15, 16.
Ab initio methods provide a useful tool for high-throughput screening of material choices. In this work, a straightforward and flexible model for qualitative comparison of possible catalysts is derived. The reaction will be divided into its elementary steps, and a combination of the microkinetic model and Sabatier analysis will be used to describe the reaction rate as a single function of temperature , pressure and adsorption energy of carbon which is applied to thirty different elements.
2 Model
2.1 Methane pyrolysis
The methane pyrolysis reaction and its individual reaction steps have been widely studied in the past 4, 17. A catalytic decomposition process follows seven different elementary reaction steps, shown below, with the last step occurring twice per molecule. The sign ‘∗’ denotes a catalyst surface site, e.g., is a methane molecule adsorbed on a catalyst. Methane chemisorbs on the catalyst surface.
| (2) |
Chemisorbed methane dissociates into a methyl radical () and a hydrogen atom.
| (3) |
The methyl radical dissociates further into a methylene (), and then into a methine () radical, followed by the last dissociation step to form adsorbed elemental carbon and hydrogen.
| (4) |
| (5) |
| (6) |
While carbon desorbs to form solid carbon, the hydrogen atoms recombine to produce hydrogen gas.
| (7) |
| (8) |
While this reaction path is generally accepted, it is still disputed which reaction step is the slowest and, therefore, rate-determining for the overall reaction. In the 1960s, Kozlov and Knorre concluded that Eq. (4) is the rate-limiting step 18, whereas in 1972, Baker considered it to be carbon diffusion 19. More recently, surface transport phenomena are also suggested 20. Computational studies using Density Functional Theory calculations found Eq. (6) to be rate-determining 21, which will be used in this work.
Two simplifications are introduced. Firstly, as shown by Fan et al., Eqs. (2) and (3) are combined since the energy barrier for initial adsorption of methane is negligibly small 21. Hence, the first reaction step is
| (9) |
reducing the number of steps to six. Secondly, the role of carbon desorption will be neglected. Carbon deposition on a catalyst surface is a complex phenomenon that can induce the formation of a wide variety of structures, such as carbon nanotubes, among many others 22, 23. Thus, for practical reasons, the role of carbon in this context is greatly simplified by omitting Eq. (7) and setting the activity of carbon to 1.
2.2 Sabatier analysis
From the Sabatier principle, it follows that stronger adsorption of a reactant, i.e., a higher magnitude of the negative adsorption energies , correlates with a higher reaction rate constant . This is valid up to a point where too strong adsorption inhibits product desorption, resulting in a lack of free surface sites 24. Together with the Brønsted relationship that links thermodynamics and kinetics of a reaction 25, both concurring mechanisms caused by adsorption are responsible for the characteristic volcano-shaped plots of catalytic reaction rates that were first reported in 1969 26. In addition, the findings of Abild-Pedersen et al. 27 showing that the adsorption energy of \ceCH_ () scales approximately with the adsorption energy of a C atom are applied to simplify the model, resulting in the reaction rate as a function of only the adsorption energy of carbon .
As a result, the system of elementary steps that was established above contains five reaction steps, with the fourth step (Eq. (6)) being rate-determining based on findings by Fan et al. 21. Four equilibrium constants can be derived:
| (10) |
| (11) |
| (12) |
| (13) |
where is the equilibrium constant of reaction , is the surface coverage of species , and are partial pressures of and , respectively. Partial pressures are normalized with respect to the total system pressure. is missing because it is in a non-equilibrium state. Equilibrium constant and Gibbs free energy are connected via
| (14) |
For any intermediate steps where no gas-phase molecules are being adsorbed or desorbed, namely (11) and (12), the entropy contributions are ignored as the changes in entropy are negligible, i.e.,
| (15) |
Reaction steps (10) and (13) require a different approach. As shown by Norskov et al., to a good approximation, adsorbed molecules can be expected to lose all their entropy upon adsorption 28:
| (16) |
Consequently, the same must apply in reverse for desorption.
For Eq. (10) to Eq. (13) there are now five unknown variables, i.e. all coverages , with only four equations. Rearranging the system of equations above yields four coverages, which are all functions of .
| (17) |
| (18) |
| (19) |
| (20) |
The site conservation rule yields a fifth equation with its general form of
| (21) |
where a fraction of -covered sites can be defined as . This leads to
| (22) |
and the coverage of free sites can then be expressed as
| (23) |
Inserting all terms from above yields the coverage of free surface sites for the system as
| (24) |
Now, the only non-equilibrated reaction step (Eq. (6)) is being considered. For this, a reaction rate expression can be set up as
| (25) |
with . It is not possible to define an equilibrium constant for Eq. (25). However, it is convenient to define an “approach to equilibrium” 28. This approach to equilibrium is a positive number that provides information about whether the reaction proceeds in a forward or backward direction.
Hence, the approach to equilibrium is defined as
| (26) |
leading to a simplified reaction rate of
| (27) |
with defined as
| (28) |
Having only one rate-determining reaction step allows for the important simplification of
| (29) |
where is the approach to equilibrium for the overall reaction rate, i.e.,
| (30) |
and and are normalized partial pressures of and respectively, the equilibrium constant and is the Gibbs free energy of the overall reaction. Using these simplifications in Eq. (27) leads to the reaction rate as
| (31) |
with and as the reaction entropy and energy of non-equilibrated reaction step 4. While follows the transition-state scaling relation that is derived from adsorption energy trends 27, is neglected for step 4 (Eq. (6)), i.e. because reactants and products stay in an adsorbed state. This leads to the final reaction rate equation
| (32) |
Impressively, this model describes the reaction rate as a combination of microscopic quantities, such as adsorption and activation energy, and macroscopic properties, such as temperature and pressure. Importantly, the microscopic quantities can be obtained using ab initio calculations. From , the volcano-shaped curve is obtained, the maximum position of which corresponds to adsorption energy, which in turn is characteristic of a particular ideal catalyst material.
3 Methodology
Adsorption, reaction, and activation energies for catalytic methane pyrolysis were calculated using density functional theory (DFT) calculations 29. Values for standard enthalpy and entropy of the total reaction were taken from the National Institute of Standards and Technology (NIST) 30. The Vienna Ab initio Simulation Package (VASP) was used for all DFT calculations in this work 31. Exchange-correlation functional parametrized by Perdew, Burke, and Ernzerhof (PBE-GGA) 32 and revised by Hammer et al.33 to improve chemisorption energetics of atoms and molecules on transition-metal surfaces was employed. A projector augmented wave (PAW) method was used for electron-ion interactions 34. Magnetic moments for ferro- or paramagnetic substrates were taken from the Materials Project (www.materialsproject.org), an open dataset for properties of inorganic materials 35. A supercell of () primitive cells was used to generate the cubic (hexagonal) slabs for the surface calculations, thus leading to (111), (110), and (0001) surfaces for fcc, bcc, and hcp metals, respectively. These represent the closely packed plane for the considered crystal systems. The additional vacuum of more than 20 Å was inserted to separate the periodic images of the free surfaces. -centered -mesh of was chosen. Default plane wave cutoff energy from the PAW pseudopotentials36 was used. More detailed information on the calculations carried out can be found in the supporting material.
4 Results
4.1 Adsorption energies
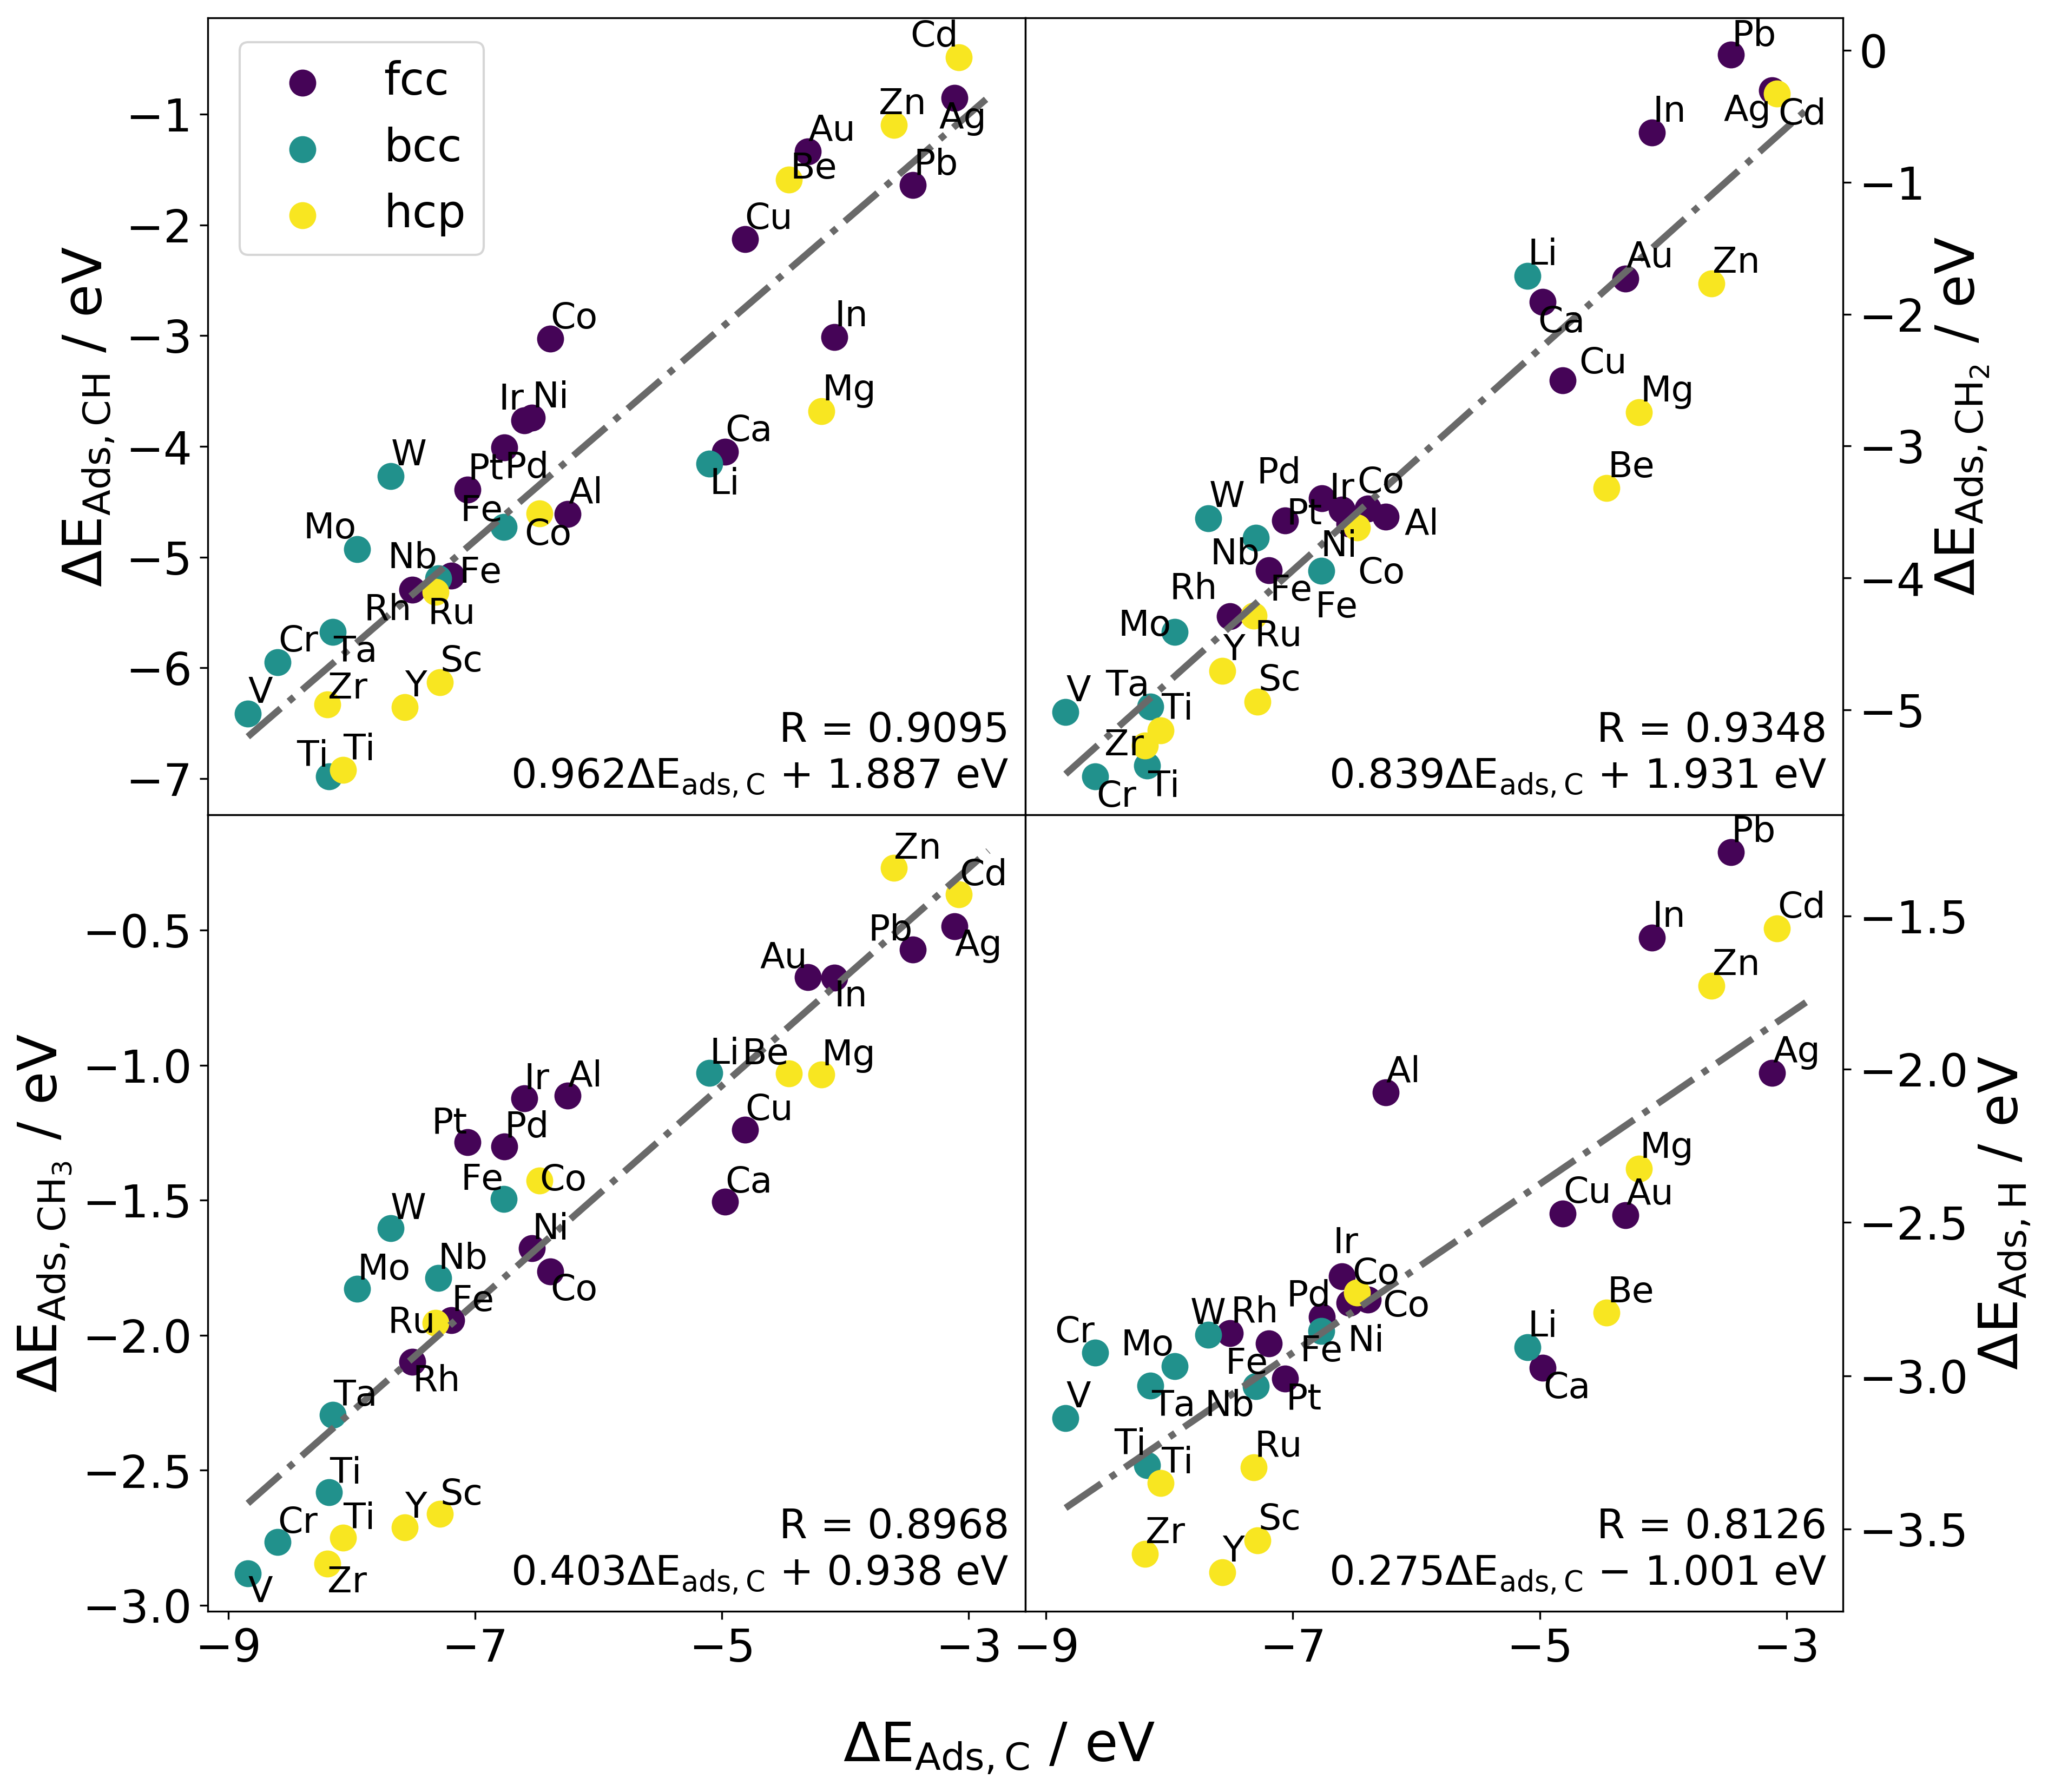
Calculated adsorption energies are presented below. Fig. 1 depicts adsorption energies of CH, \ceCH2, \ceCH3, and H, respectively, as a function of carbon adsorption energy for a given substrate element. In the lower right corners of each graph, the Pearson correlation coefficient and the linear fit function, which will be used for the Sabatier model later, are shown. The three crystal structures considered, face-centered cubic (fcc), body-centered cubic (bcc), and hexagonal close-packed (hcp), have all close-packed surface structures, i.e., (111) for fcc, (110) for bcc and (0001) for hcp. The results do not show any clear difference between the behavior depending on the crystallography of the substrate: the adsorption energies are evenly spread across the whole energy range, with a possible exception of the bcc systems more accumulated in the low energy regions. The linear correlations are acceptable in all four cases, i.e., the dependence of the adsorption energy of CH, \ceCH2, \ceCH3, and H on the adsorption energy of C. The best linear correlation is obtained between and (), whereas the weakest correlation if obtained between and ().
 \captionsetup
width=.95justification=centering
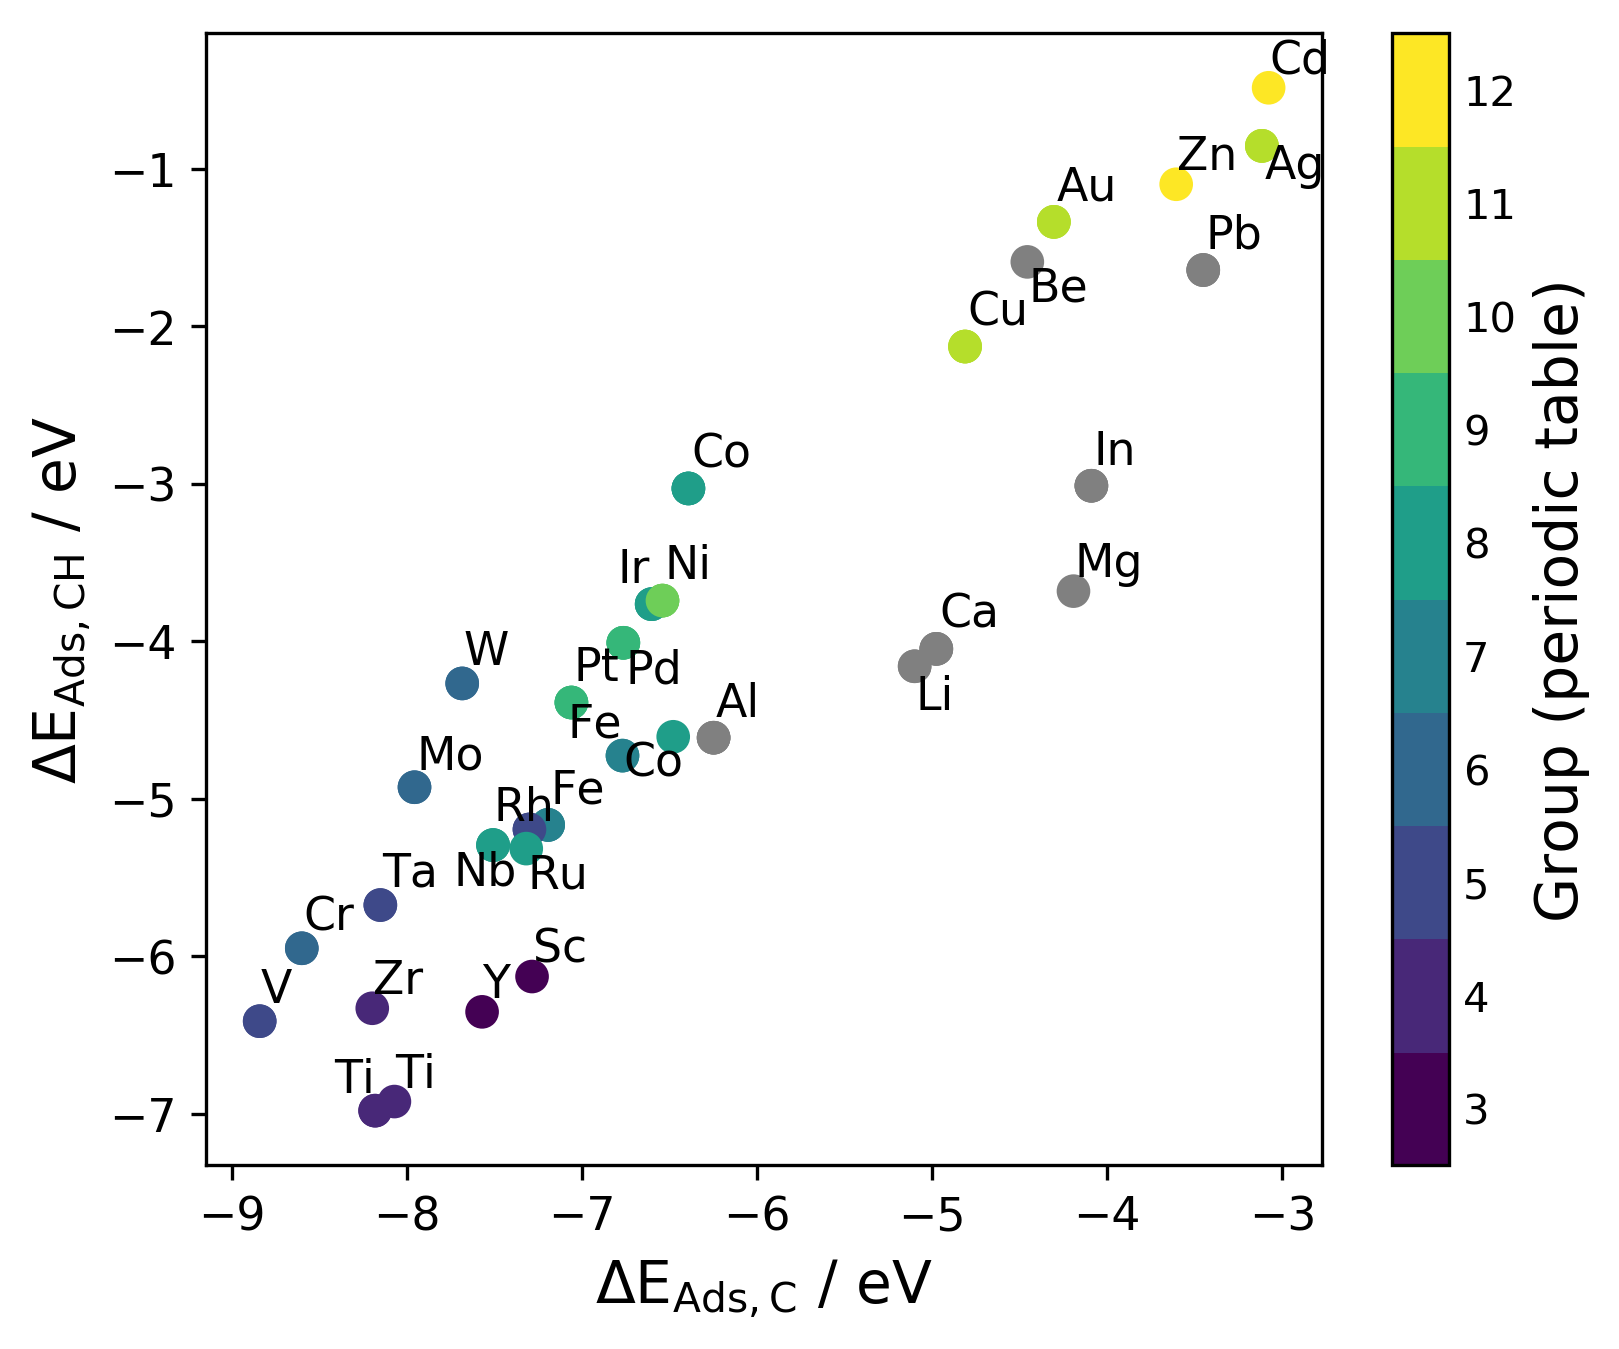
A striking correlation between adsorption energies and position in the -block of the periodic table can be seen in Fig. 2, where each element is color-coded according to its group on the example of the vs. presented in Fig. 1. Elements that are not included in the -block are grayed out. One explanation could be due to the fact that transition metals are mainly characterized by their partially filled -subshells. Due to the directional character of -orbitals, the nucleus is weakly shielded, interactions between -electrons are weak, and the nucleus does not only strongly attract - but also -electrons from the next higher -orbital. This results in relatively high but slowly increasing ionization energies over a given period 37, which in turn inhibits reactivity. This is evident when considering the enthalpy of hydration, which also decreases in magnitude with a higher group number 38.
 \captionsetup
width=.95justification=centering
4.2 Activation energies
Norskov et al.28 proposed that the adsorption and activation energies should be correlated since the same fundamental physics governs them. Abild-Pedersen et al.27 showed that in the case of methane, this correlation is exclusively related to the term. The activation energies are needed as inputs for evaluating the reaction rate (Eq. (32)). Namely, corresponding to the dissociation of the CH molecule, the rate-determining step, Eq. (6), is needed. The explicit activation energy calculations were carried out for a (111)-surface of fcc-Cu. Details can be found in the supporting material. The resulting relationship is
| (33) |
4.3 Reaction energies
The remaining ingredient in the free site coverage, , depends on the equilibrium constants K1, K2, K3, and K5. For their evaluation through Eq. (14), the Gibbs free energy of a reaction is needed. As discussed in Section “Sabatier analysis”, different treatment is applied depending on whether the reactions involve gas-phase molecules.
Similar to the activation energies, reaction energies can also be correlated with adsorption energies. The reaction calculations were again carried out for a (111) surface of fcc-Cu and are detailed in the supporting material. The resulting relationships (Eq. (15)) are
| (34) |
and
| (35) |
4.4 Reaction rate
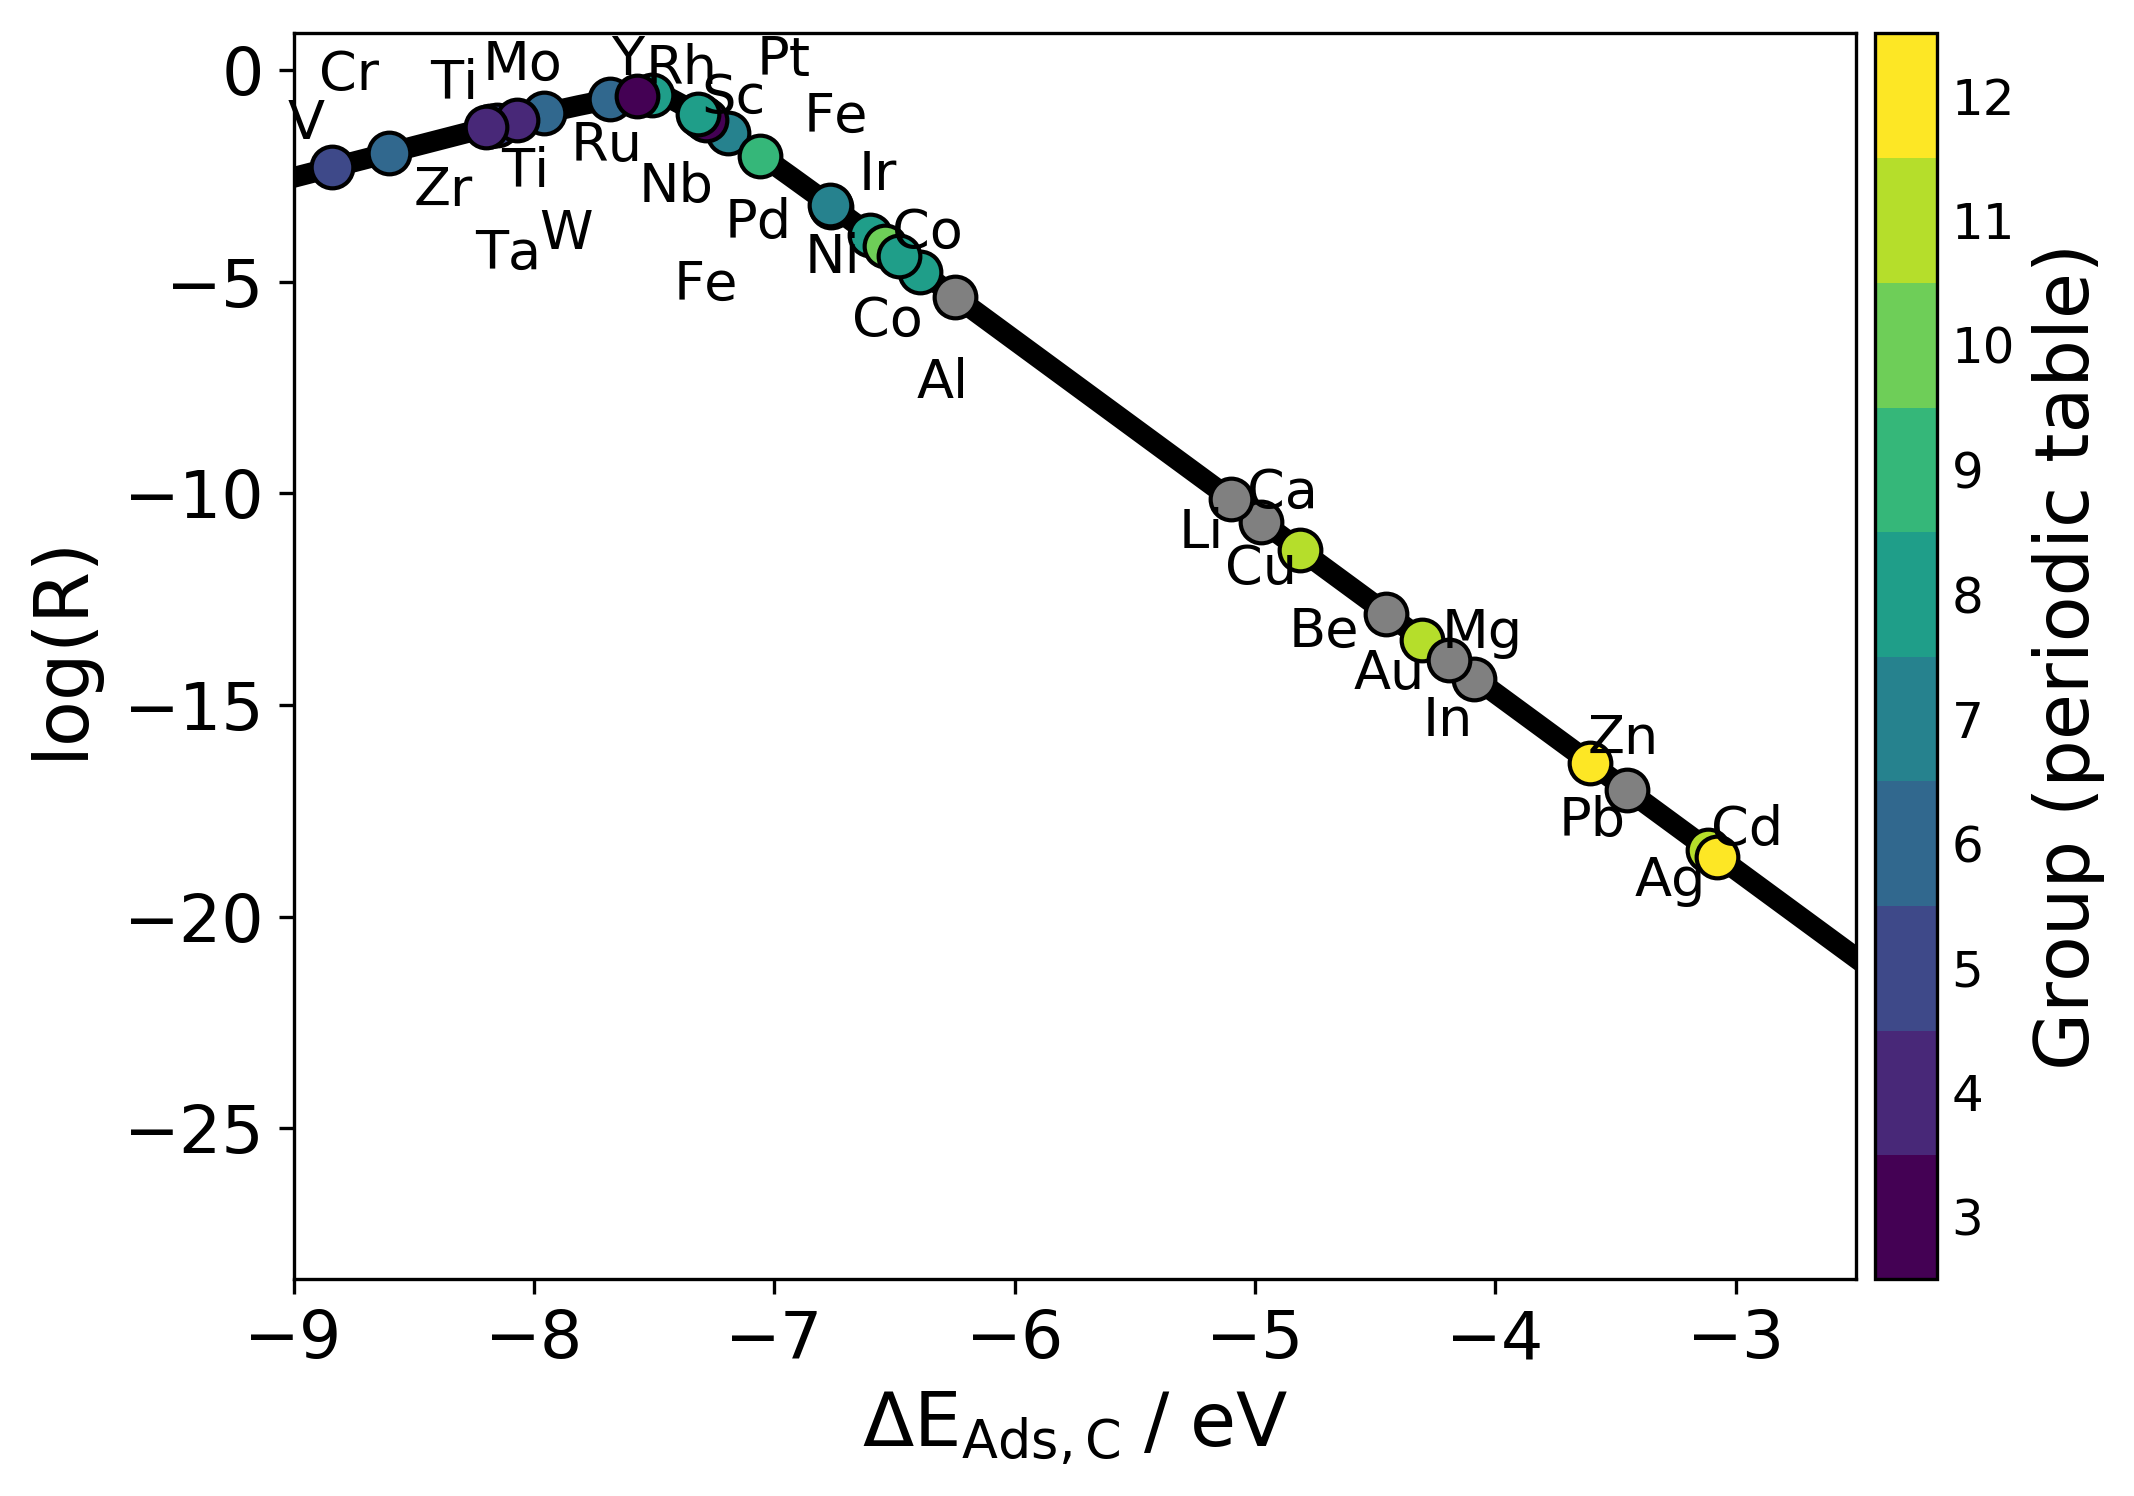
The reaction rate, , is now calculated from the adsorption energy trends, reaction, and activation energies. Since (cf. Eq. (32)), representative thermodynamic input parameters are chosen: K, , and . The resulting reaction rate is shown in Fig. 3 as a function of , which can be linked with various base metals via the data presented in Fig. 1.
 \captionsetup
width=.8justification=centering
The best-performing surfaces are Rh, along with Ru, Y, Sc, Nb, and W, which are also close to the maximum. Overall, the occurrence of materials around the maximum is very high, which implies a wide range of options for close-to-optimum performance under those conditions. Furthermore, the apparent “reaction gap” around eV may serve as a practical cutoff for material selection.
5 Discussion
width=.9justification=centering
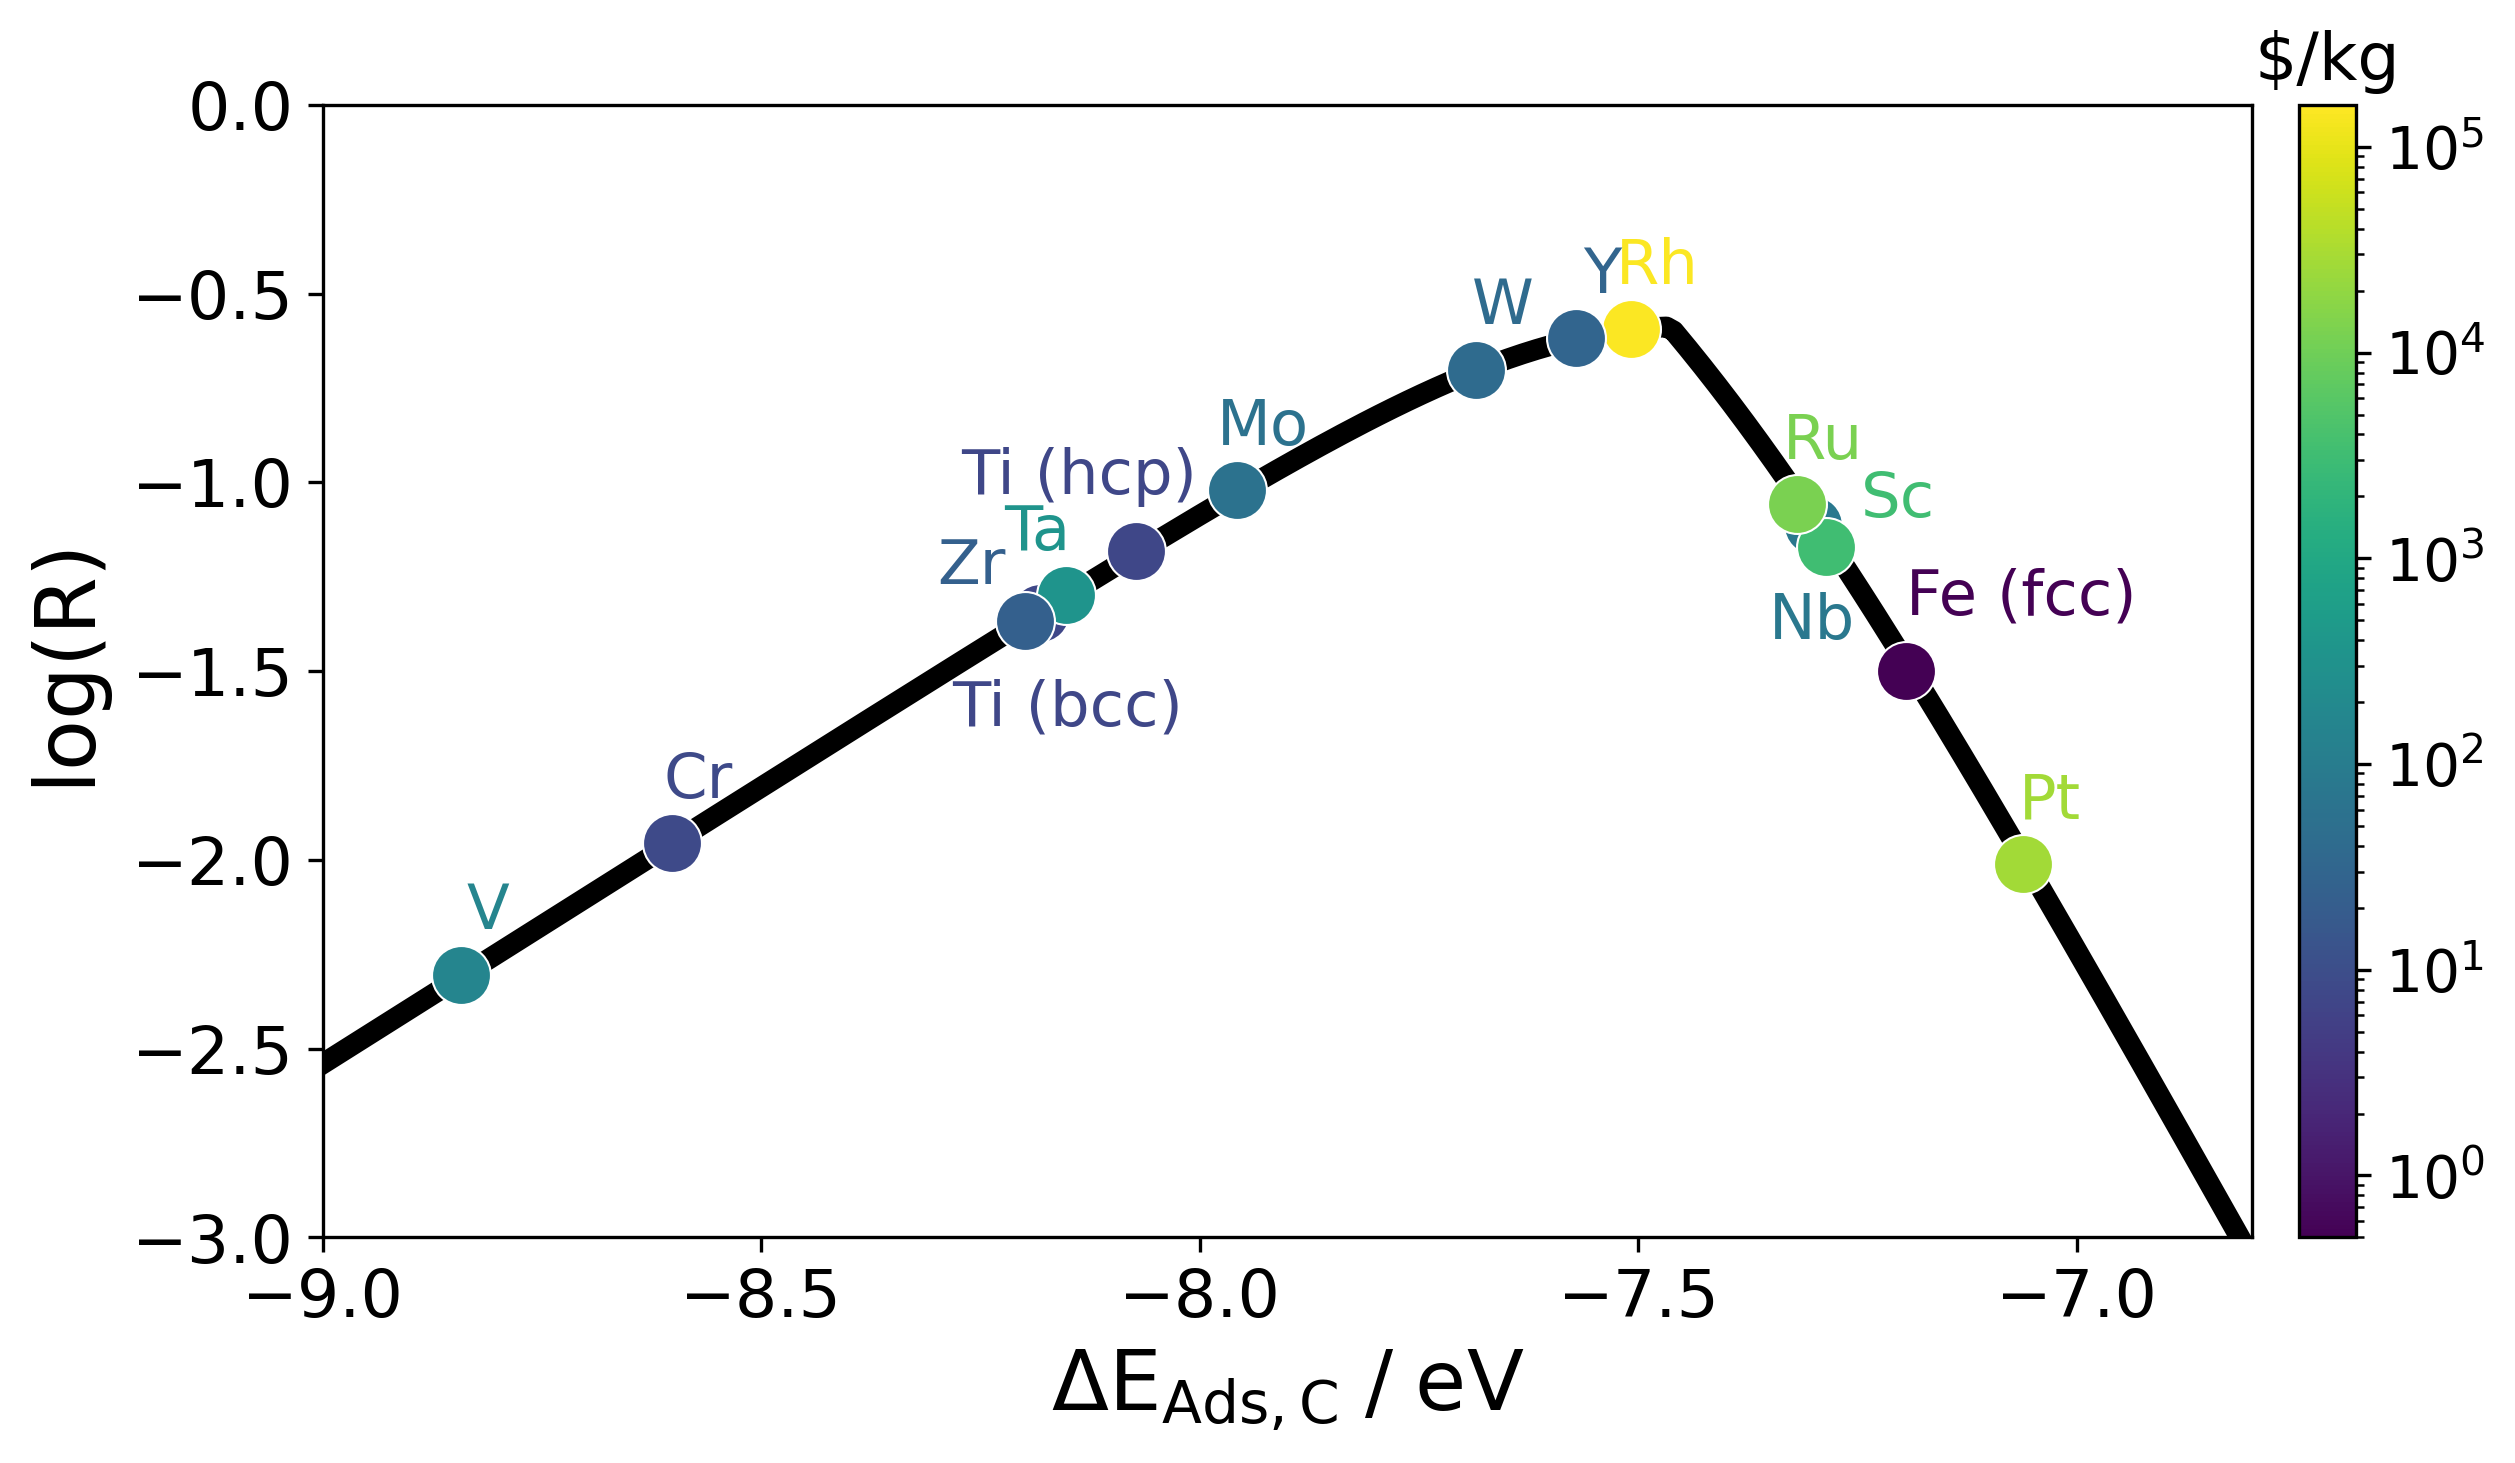
Figure 4 shows the elements exhibiting the highest reaction rate according to the Fig. 3 and color-coded according to their global market price as of February 2024 40 (in US Dollar ($) per kg). For economic upscaling of catalytic methane pyrolysis to industrial application, a price consideration will be of great importance. Hence, price-informed volcano plots offer a straightforward way to make strategic decisions for a given set of calculated catalyst surfaces with user-defined operating conditions.
Figure 5 shows as a function of different temperatures and pressures. The upper plot demonstrates that the slope of (as a function of ) decreases with increasing temperature while the maximum is shifted to lower magnitudes of adsorption energy. Overall, the rate increases with temperature for otherwise the same conditions, as intuitively expected. However, we note that increasing temperature to increase the yield has its practical and economical limits. The lower graph shows that the pressure also serves as a tool to tune the maximum reaction rate (optimal operating conditions) to other elements.
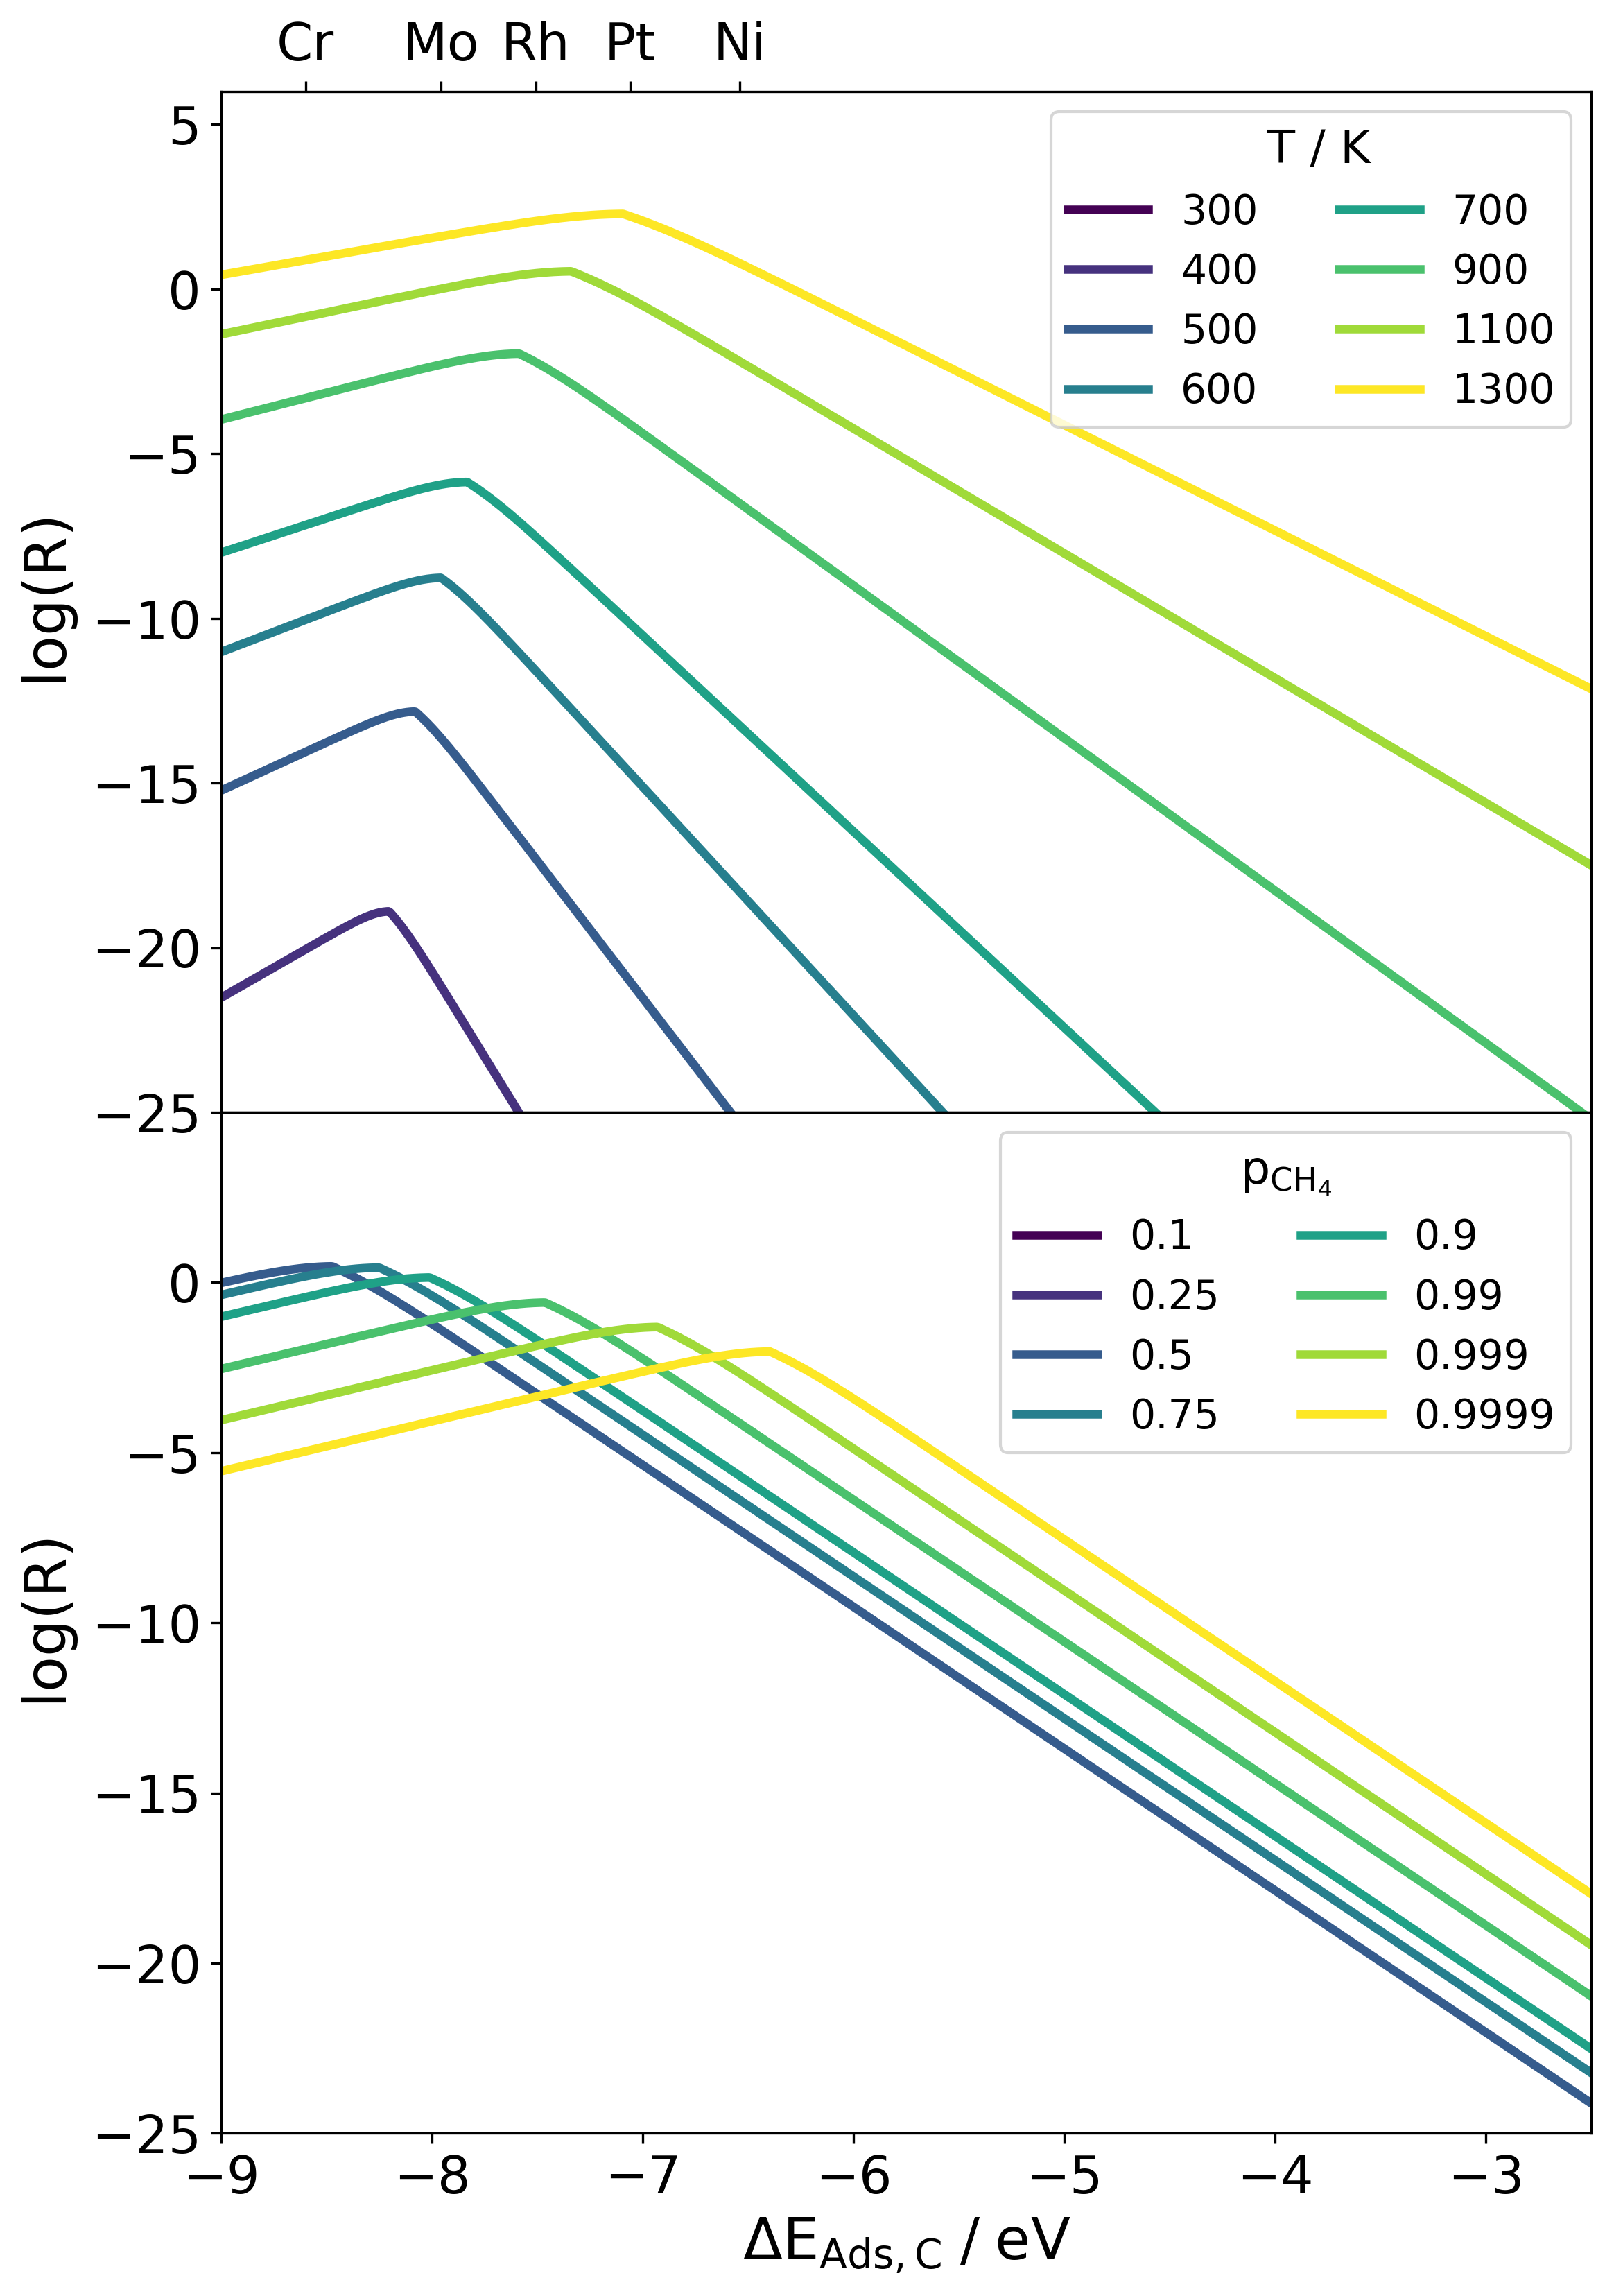 \captionsetup
width=.95justification=centering
In Fig. 6, the respective best-performing catalyst is represented in an Arrhenius diagram. The corresponding catalysts are listed at the edges of the diagram. It is clearly visible how the optimum moves towards lower magnitudes of adsorption energy with increasing temperature and partial pressure of \ceCH4, as already shown in Fig. 5. In total, 19 different elements are closest to the maximum of at least once for a temperature range between 600 and 1200 K and a partial pressure range of \ceH2 between and , suggesting that the optimal operating conditions and catalyst material are closely matched. Hence, such a diagram could be useful for practical designing the pyrolysis process.
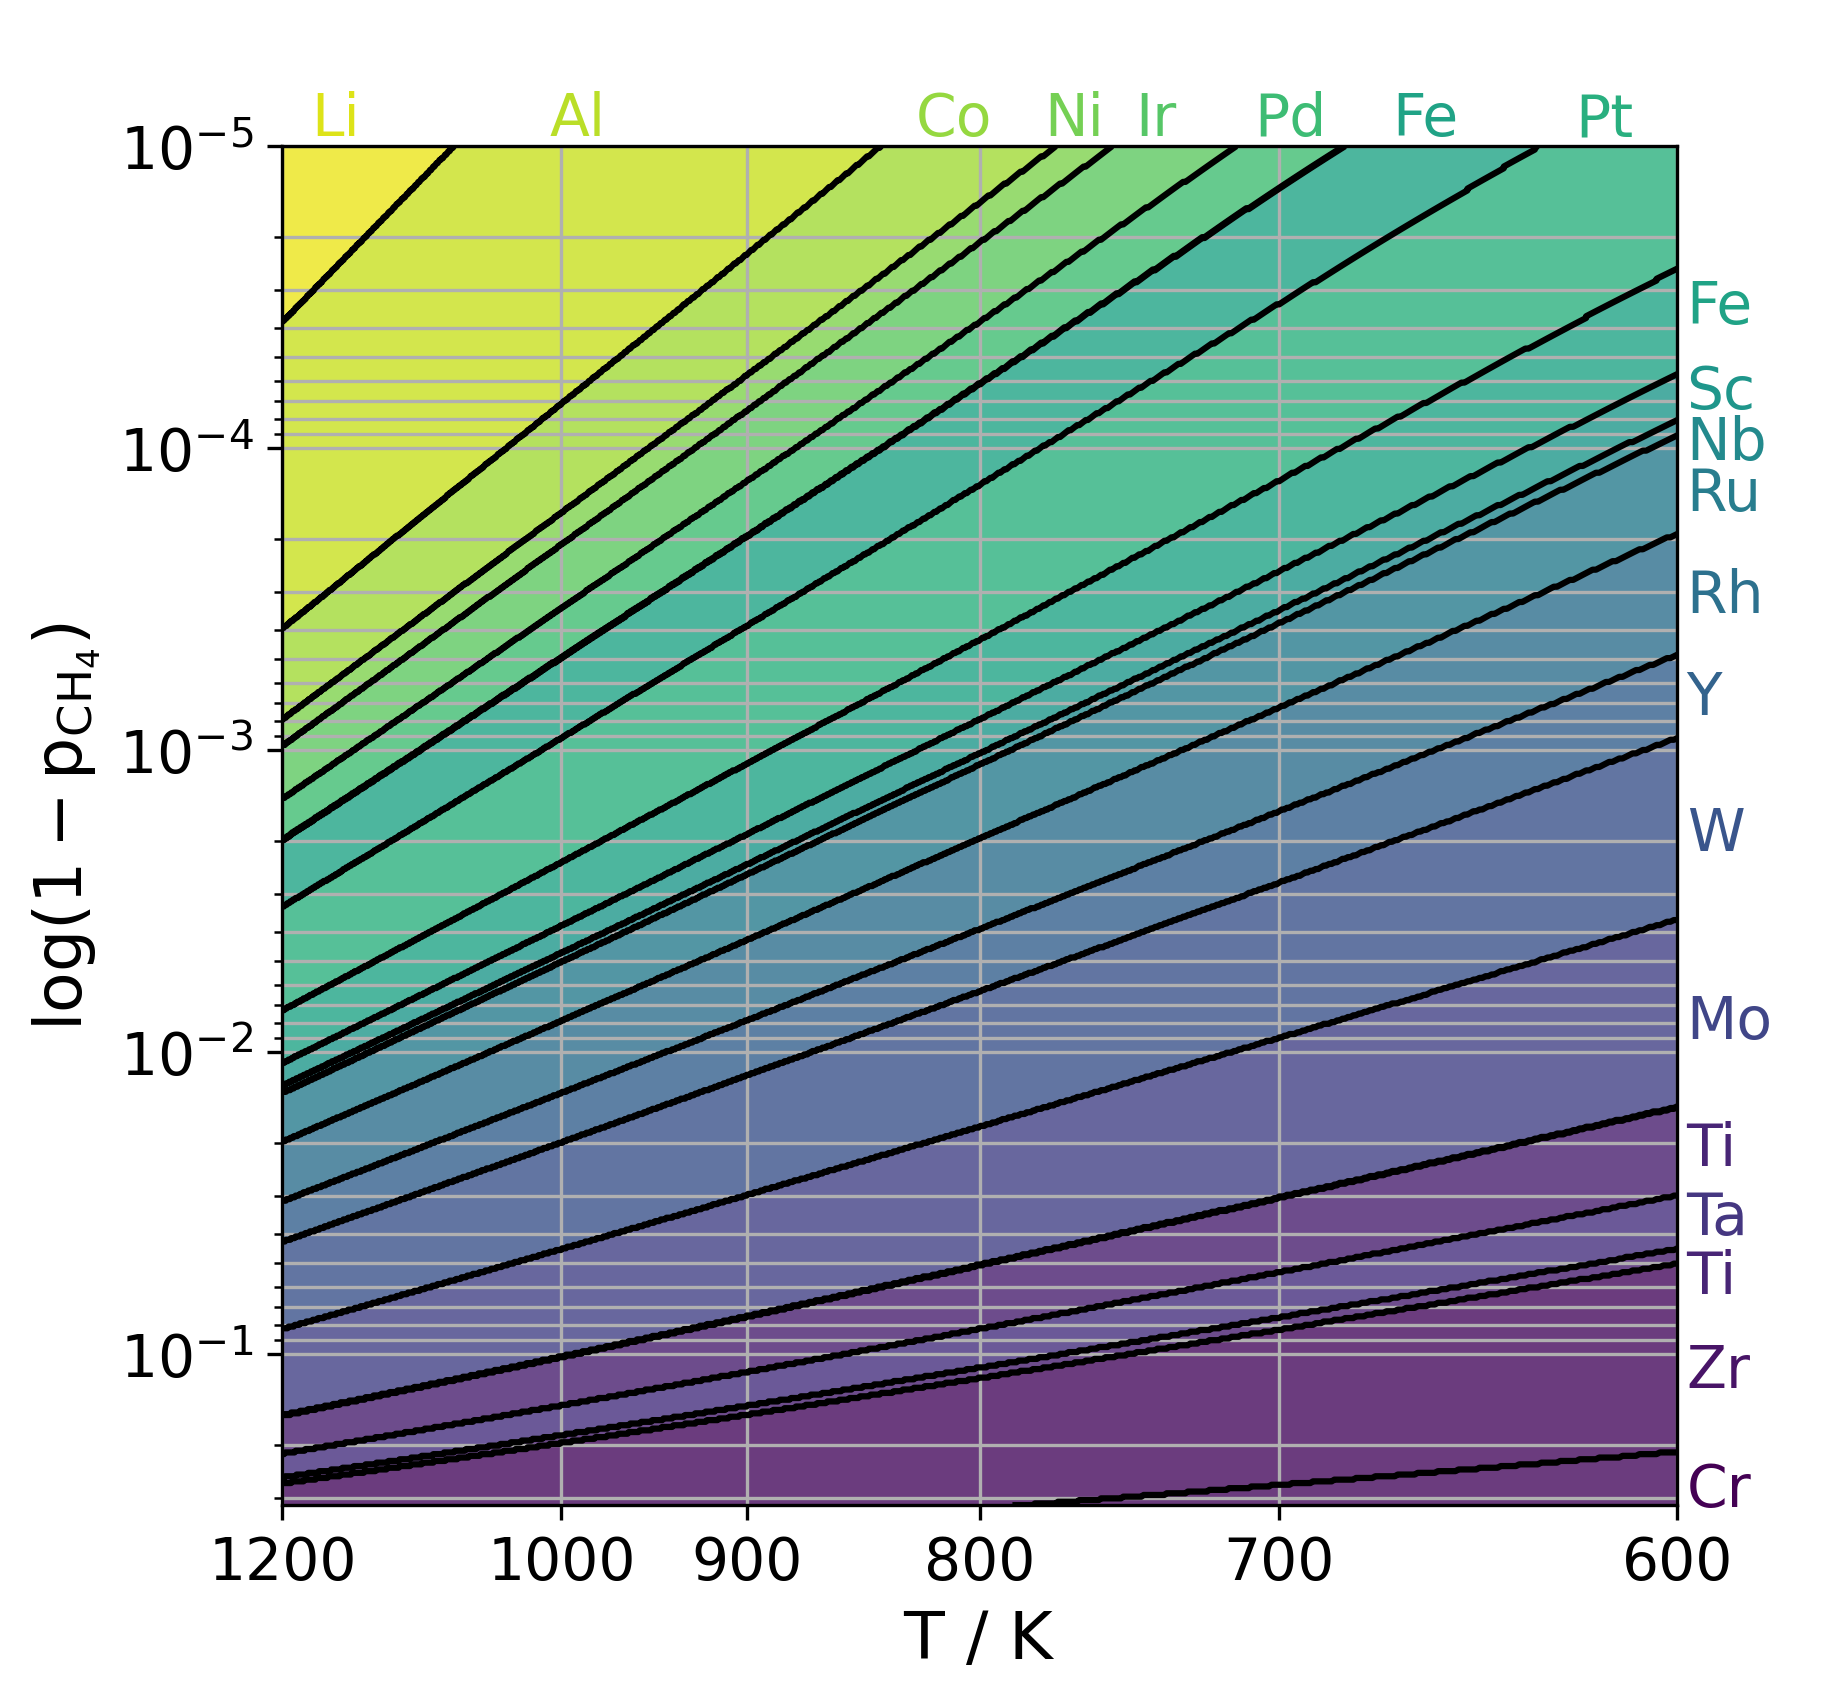
width=.9justification=centering
5.1 Limitations of the present model
The presented model efficiently trades off between computational effort and its predictive power. Due to the complex nature of a multi-step catalytic chemical reaction with a variety of possible side reactions, a complete mathematical description of the process is considered virtually impossible. The most important limitations are imposed by surface geometry and molecule orientation with respect to the surface, imperfect correlation coefficients, neglected consideration of reaction kinetics and carbon, the choice for the rate-determining step as well as computational accuracy. These factors should be considered in further studies. It is also envisioned that the inclusion of modern machine learning algorithms41 based on the scarce DFT data will provide more realistic and accurate scaling relationships of adsorption energies.
6 Conclusions
In this paper, a model for the quantifying catalyst materials for methane pyrolysis based on their reaction rate was derived and presented. The approach is based on several chemical models, such as the Sabatier, transition-state, and microkinetic model, which were modified for the specifics of the methane pyrolysis reaction. Required input energies were obtained from density functional theory (DFT) calculations. The resulting model computes a reaction rate that is solely a function of temperature , partial pressures of \ceCH4 and \ceH2 gasses, and adsorption energy scaling relations, which are functions of the adsorption energy of carbon . The model is considered to be valid for any catalyst material that follows linear adsorption energy scaling relationships and yields a qualitative comparison of the materials.
Furthermore, the model enables the investigation of the best-performing catalyst material in the – space for a given database of adsorption energies on a set of pure fcc, bcc and hcp metals. For a temperature range between 600 and 1200 K and a partial pressure range for \ceH2 between and , a total of 19 different metals were found to be optimal catalyst materials at least once.
Finally, we point out that our study demonstrates that the type of catalyst and specific reactor operating conditions should be matched.
The computational results were, in part, achieved by using the Vienna Scientific Cluster computing infrastructure.
Additional details on computational methods are available as a separate document (PDF).
References
- iea 2023 Global Hydrogen Review 2023; OECD, 2023
- Sánchez-Bastardo et al. 2021 Sánchez-Bastardo, N.; Schlögl, R.; Ruland, H. Methane Pyrolysis for Zero-Emission Hydrogen Production: A Potential Bridge Technology from Fossil Fuels to a Renewable and Sustainable Hydrogen Economy. Industrial Camp Engineering Chemistry Research 2021, 60, 11855–11881
- Blanksby and Ellison 2003 Blanksby, S. J.; Ellison, G. B. Bond Dissociation Energies of Organic Molecules. Accounts of Chemical Research 2003, 36, 255–263
- Ashik et al. 2015 Ashik, U.; Daud, W. W.; Abbas, H. F. Production of greenhouse gas free hydrogen by thermocatalytic decomposition of methane – A review. Renewable and Sustainable Energy Reviews 2015, 44, 221–256
- McConnachie et al. 2023 McConnachie, M.; Konarova, M.; Smart, S. Literature review of the catalytic pyrolysis of methane for hydrogen and carbon production. International Journal of Hydrogen Energy 2023, 48, 25660–25682
- Fan et al. 2021 Fan, Z.; Weng, W.; Zhou, J.; Gu, D.; Xiao, W. Catalytic decomposition of methane to produce hydrogen: A review. Journal of Energy Chemistry 2021, 58, 415–430
- Abbas and Daud 2010 Abbas, H. F.; Daud, W. W. Hydrogen production by methane decomposition: A review. International Journal of Hydrogen Energy 2010, 35, 1160–1190
- Suelves et al. 2008 Suelves, I.; Pinilla, J.; Lázaro, M.; Moliner, R. Carbonaceous materials as catalysts for decomposition of methane. Chemical Engineering Journal 2008, 140, 432–438
- Kang et al. 2020 Kang, D.; Palmer, C.; Mannini, D.; Rahimi, N.; Gordon, M. J.; Metiu, H.; McFarland, E. W. Catalytic Methane Pyrolysis in Molten Alkali Chloride Salts Containing Iron. ACS Catalysis 2020, 10, 7032–7042
- Parkinson et al. 2021 Parkinson, B.; Patzschke, C. F.; Nikolis, D.; Raman, S.; Dankworth, D. C.; Hellgardt, K. Methane pyrolysis in monovalent alkali halide salts: Kinetics and pyrolytic carbon properties. International Journal of Hydrogen Energy 2021, 46, 6225–6238
- Zeng et al. 2020 Zeng, J.; Tarazkar, M.; Pennebaker, T.; Gordon, M. J.; Metiu, H.; McFarland, E. W. Catalytic Methane Pyrolysis with Liquid and Vapor Phase Tellurium. ACS Catalysis 2020, 10, 8223–8230
- Upham et al. 2017 Upham, D. C.; Agarwal, V.; Khechfe, A.; Snodgrass, Z. R.; Gordon, M. J.; Metiu, H.; McFarland, E. W. Catalytic molten metals for the direct conversion of methane to hydrogen and separable carbon. Science 2017, 358, 917–921
- Palmer et al. 2019 Palmer, C.; Tarazkar, M.; Kristoffersen, H. H.; Gelinas, J.; Gordon, M. J.; McFarland, E. W.; Metiu, H. Methane Pyrolysis with a Molten Cu–Bi Alloy Catalyst. ACS Catalysis 2019, 9, 8337–8345
- Sorcar and Rosen 2023 Sorcar, S.; Rosen, B. A. Methane Pyrolysis Using a Multiphase Molten Metal Reactor. ACS Catalysis 2023, 13, 10161–10166
- Scheiblehner et al. 2023 Scheiblehner, D.; Neuschitzer, D.; Wibner, S.; Sprung, A.; Antrekowitsch, H. Hydrogen production by methane pyrolysis in molten binary copper alloys. International Journal of Hydrogen Energy 2023, 48, 6233–6243
- Scheiblehner et al. 2023 Scheiblehner, D.; Antrekowitsch, H.; Neuschitzer, D.; Wibner, S.; Sprung, A. Hydrogen Production by Methane Pyrolysis in Molten Cu-Ni-Sn Alloys. Metals 2023, 13, 1310
- Snoeck et al. 1997 Snoeck, J.-W.; Froment, G.; Fowles, M. Kinetic Study of the Carbon Filament Formation by Methane Cracking on a Nickel Catalyst. Journal of Catalysis 1997, 169, 250–262
- Kozlov and Knorre 1962 Kozlov, G.; Knorre, V. Single-pulse shock tube studies on the kinetics of the thermal decomposition of methane. Combustion and Flame 1962, 6, 253–263
- Baker 1972 Baker, R. Nucleation and growth of carbon deposits from the nickel catalyzed decomposition of acetylene. Journal of Catalysis 1972, 26, 51–62
- Hofmann et al. 2005 Hofmann, S.; Csányi, G.; Ferrari, A. C.; Payne, M. C.; Robertson, J. Surface Diffusion: The Low Activation Energy Path for Nanotube Growth. Physical Review Letters 2005, 95, 036101
- Fan et al. 2012 Fan, C.; Zhu, Y.-A.; Xu, Y.; Zhou, Y.; Zhou, X.-G.; Chen, D. Origin of synergistic effect over Ni-based bimetallic surfaces: A density functional theory study. The Journal of Chemical Physics 2012, 137, 014703
- Helveg et al. 2004 Helveg, S.; López-Cartes, C.; Sehested, J.; Hansen, P. L.; Clausen, B. S.; Rostrup-Nielsen, J. R.; Abild-Pedersen, F.; Nørskov, J. K. Atomic-scale imaging of carbon nanofibre growth. Nature 2004, 427, 426–429
- Chen et al. 2005 Chen, D.; Christensen, K.; Ochoa-Fernandez, E.; Yu, Z.; Totdal, B.; Latorre, N.; Monzon, A.; Holmen, A. Synthesis of carbon nanofibers: effects of Ni crystal size during methane decomposition. Journal of Catalysis 2005, 229, 82–96
- Knözinger and Kochloefl 2003 Knözinger, H.; Kochloefl, K. Heterogeneous Catalysis and Solid Catalysts. 2003; \urlhttps://doi.org/10.1002/14356007.a05_313
- Brönsted and Pedersen 1924 Brönsted, J. N.; Pedersen, K. Die katalytische Zersetzung des Nitramids und ihre physikalisch-chemische Bedeutung. Zeitschrift für Physikalische Chemie 1924, 108U, 185–235
- Balandin 1969 Balandin, A. Advances in Catalysis; Elsevier, 1969; pp 1–210
- Abild-Pedersen et al. 2007 Abild-Pedersen, F.; Greeley, J.; Studt, F.; Rossmeisl, J.; Munter, T. R.; Moses, P. G.; Skúlason, E.; Bligaard, T.; Nørskov, J. K. Scaling Properties of Adsorption Energies for Hydrogen-Containing Molecules on Transition-Metal Surfaces. Physical Review Letters 2007, 99, 016105
- Norskov et al. 2014 Norskov, J. K.; Studt, F.; Abild-Pedersen, F.; Bligaard, T. Fundamental concepts in heterogeneous catalysis; John Wiley & Sons: Nashville, TN, 2014
- Hohenberg and Kohn 1964 Hohenberg, P.; Kohn, W. Inhomogeneous Electron Gas. Phys. Rev. 1964, 136, B864–B871
- Linstrom 1997 Linstrom, P. NIST Chemistry WebBook, NIST Standard Reference Database 69. 1997; \urlhttp://webbook.nist.gov/chemistry/
- Kresse and Hafner 1993 Kresse, G.; Hafner, J. Ab initio molecular dynamics for open-shell transition metals. Phys. Rev. B Condens. Matter 1993, 48, 13115–13118
- Perdew et al. 1996 Perdew, J. P.; Burke, K.; Ernzerhof, M. Generalized Gradient Approximation Made Simple. Physical Review Letters 1996, 77, 3865–3868
- Hammer et al. 1999 Hammer, B.; Hansen, L. B.; Nørskov, J. K. Improved adsorption energetics within density-functional theory using revised Perdew-Burke-Ernzerhof functionals. Physical Review B 1999, 59, 7413–7421
- Blöchl 1994 Blöchl, P. E. Projector augmented-wave method. Physical Review B 1994, 50, 17953–17979
- Jain et al. 2013 Jain, A.; Ong, S. P.; Hautier, G.; Chen, W.; Richards, W. D.; Dacek, S.; Cholia, S.; Gunter, D.; Skinner, D.; Ceder, G.; Persson, K. A. Commentary: The Materials Project: A materials genome approach to accelerating materials innovation. APL Materials 2013, 1, 011002
- Kresse and Joubert 1999 Kresse, G.; Joubert, D. From ultrasoft pseudopotentials to the projector augmented-wave method. Phys. Rev. B Condens. Matter 1999, 59, 1758–1775
- Siekierski and Burgess 2002 Siekierski, S.; Burgess, J. Concise Chemistry of the Elements; Elsevier, 2002; pp 131–154
- Deeth 2010 Deeth, R. J. Advances in Inorganic Chemistry; Elsevier, 2010; pp 1–39
- Lide 2004 Lide, D. R. In CRC Handbook of Chemistry and Physics, 85th Edition; Lide, D. R., Ed.; CRC Press, 2004; p 2712
- Met 2024 Shanghai Metals Market (SMM). 2024; \urlhttps://www.metal.com/
- Ulissi et al. 2017 Ulissi, Z. W.; Tang, M. T.; Xiao, J.; Liu, X.; Torelli, D. A.; Karamad, M.; Cummins, K.; Hahn, C.; Lewis, N. S.; Jaramillo, T. F.; Chan, K.; Nørskov, J. K. Machine-Learning Methods Enable Exhaustive Searches for Active Bimetallic Facets and Reveal Active Site Motifs for CO2 Reduction. ACS Catalysis 2017, 7, 6600–6608