Peak Effect and Dynamics of Stripe and Pattern Forming Systems on a Periodic One Dimensional Substrate
Abstract
We examine the ordering, pinning, and dynamics of two-dimensional pattern forming systems interacting with a periodic one-dimensional substrate. In the absence of the substrate, particles with competing long-range repulsion and short-range attraction form anisotropic crystal, stripe, and bubble states. When the system is tuned across the stripe transition in the presence of a substrate, we find that there is a peak effect in the critical depinning force when the stripes align and become commensurate with the substrate. Under an applied drive, the anisotropic crystal and stripe states can exhibit soliton depinning and plastic flow. When the stripes depin plastically, they dynamically reorder into a moving stripe state that is perpendicular to the substrate trough direction. We also find that when the substrate spacing is smaller than the widths of the bubbles or stripes, the system forms pinned stripe states that are perpendicular to the substrate trough direction. The system exhibits multiple reentrant pinning effects as a function of increasing attraction, with the anisotropic crystal and large bubble states experiencing weak pinning but the stripe and smaller bubble states showing stronger pinning. We map out the different dynamic phases as a function of filling, the strength of the attractive interaction term, the substrate strength, and the drive, and demonstrate that the different phases produce identifiable features in the transport curves and particle orderings.
I Introduction
Particle systems with competing long-range repulsive and short-range attractive interactions form a variety of patterned states, including crystals, stripes, bubbles, and void lattices Seul and Andelman (1995); Stoycheva and Singer (2000); Reichhardt et al. (2003a, 2004); Mossa et al. (2004); Sciortino et al. (2004); Nelissen et al. (2005); Liu et al. (2008); Olson Reichhardt et al. (2010); McDermott et al. (2016); Liu and Xi (2019); Xu et al. (2021). For a fixed repulsion strength but increasing attraction strength, these systems form a crystal, then an anisotropic crystal, and finally stripe and bubble phases Olson Reichhardt et al. (2010). For fixed interaction strength but increasing particle densities, first bubbles, then stripes, then void lattices, and then a uniform crystal appear Olson Reichhardt et al. (2010). Similar patterns can arise even for systems with purely repulsive interactions if the interaction potential involves multiple length scales Jagla (1998); Malescio and Pellicane (2003); Glaser et al. (2007). Pattern formation can occur in soft matter systems such as colloidal assemblies, emulsions, and binary fluids Malescio and Pellicane (2003); Glaser et al. (2007); Costa Campos et al. (2013), and in hard condensed matter systems that include electron liquid crystals Fogler et al. (1996); Moessner and Chalker (1996); Cooper et al. (1999); Pan et al. (1999); Fradkin and Kivelson (1999); Göres et al. (2007); Zhu et al. (2009); Friess et al. (2018), composite fermion states Shingla et al. (2023), multiple component superconducting vortex systems Xu et al. (2011); Komendová et al. (2013); Varney et al. (2013); Sellin and Babaev (2013); Brems et al. (2022), skyrmion systems Reichhardt et al. (2022), and various types of charge ordered states Tranquada et al. (1995); Olson Reichhardt et al. (2004); Mertelj et al. (2005); Baity et al. (2018); Mahmoudian et al. (2015). When pattern forming systems couple to quenched disorder, they can exhibit pinned phases as well as depinning transitions and sliding phases under an applied drive Cooper et al. (1999); Reichhardt et al. (2003a, b); Göres et al. (2007); Zhu et al. (2009); Zhao et al. (2013); Reichhardt and Reichhardt (2017); Bennaceur et al. (2018); Friess et al. (2018); Brems et al. (2022); Sun et al. (2022). If the quenched disorder is strong, a glassy or structurally disordered state forms that depins plastically, and for high drives the system can dynamically reorder into patterned states such as moving stripes or moving bubbles Reichhardt et al. (2003a, b); Göres et al. (2007); Sun et al. (2022). The different dynamic states and transitions between them are associated with multiple steps in the transport curves Cooper et al. (1999); Reichhardt et al. (2003a, b); Göres et al. (2007); Reichhardt and Reichhardt (2017), changes in the noise fluctuations Reichhardt et al. (2003b); Qian et al. (2017); Bennaceur et al. (2018); Sun et al. (2022); Madathil et al. (2023), and modifications of the structure factors Reichhardt et al. (2003b); Brems et al. (2022).
There have been extensive studies of systems of purely repulsive particles that form crystalline lattices under coupling to one- or two-dimensional periodic substrates Chowdhury et al. (1985); Chakrabarti et al. (1995); Harada et al. (1996); Frey et al. (1999); Wei et al. (1998); Bechinger et al. (2001); Reichhardt and Olson (2002); Brunner and Bechinger (2002); Reichhardt and Reichhardt (2017). Far less is known about how a pattern-forming system with competing interactions would behave when coupled to a periodic substrate. For particle systems with purely repulsive interactions, such as certain types of colloidal particles Chowdhury et al. (1985); Bechinger et al. (2001); Brunner and Bechinger (2002) and superconducting vortices Martinoli (1978); Harada et al. (1996); Reichhardt et al. (1997); Le Thien et al. (2016); Berdiyorov et al. (2006), the relevant length scales are the average spacing between the particles and the periodicity of the substrate. In contrast, for stripe or bubble forming systems, additional length scales arise including the spacing between adjacent stripes or bubbles as well as the average spacing between the particles that compose each stripe or bubble, so a richer variety of commensuration effects are possible. Additionally, the mesoscale morphology in pattern-forming systems permits the appearance of matching or pinning effects that are not possible for repulsive point particles. For example, a stripe might show strong commensuration effects when interacting with a periodic one-dimensional (1D) substrate since the stripe can easily match the substrate shape. In general, if the attraction or repulsion strength or the filling fraction of the system is varied, morphologies can emerge that are more strongly pinned due to better matching with the substrate length scales or shape, while for other morphologies, the patterns do not match, leading to changes in the pinning configurations, sliding, and transport.
Previous work on the static configurations of pattern forming systems on a periodic 1D substrate identified several new types of patterns, such as modulated stripes and anisotropic bubbles McDermott et al. (2014). Recently, we studied the depinning of bubbles on periodic 1D substrates under a dc drive applied parallel to the substrate periodicity direction, and found that the bubbles can depin either elastically or plastically depending on the substrate strength Reichhardt and Reichhardt (2024). In addition, as the strength of the attractive interaction term increased, the bubbles became smaller and better pinned since they could fit within the substrate minima better than larger bubbles. When the bubbles depin elastically, there is a single peak in the differential velocity-force curves, while for plastic depinning, multiple peaks appear when the bubbles break up and move in various modes, such as via individual particles hopping from bubble to bubble or via a moving bubble shedding individual particles. At higher drives, the system can dynamically reorder back into a moving bubble lattice through a transition similar to the dynamic ordering found for superconducting vortices, colloidal particles, Wigner crystals, and skyrmions moving over random substrates Bhattacharya and Higgins (1993); Moon et al. (1996); Balents et al. (1998); Olson et al. (1998); Pardo et al. (1998); Reichhardt et al. (2015); Reichhardt and Reichhardt (2017).
In this work, we consider the pinning and dynamics of a pattern forming system with competing long-range repulsion and short-range attraction interacting with a 1D periodic substrate as we sweep through parameters where crystal, stripe, and bubble states appear in a clean system. We find that the depinning threshold shows a peak or maximum in the stripe regime when the stripes form a commensurate state that aligns with the substrate troughs. When the substrate is strong, the stripes first depin plastically via the formation of running kinks or solitons, followed by the emergence of a disordered flowing state, while at high drives, there is a dynamical transition into a moving stripe phase where the stripes are wider and rotate with respect to the pinned configuration so that they are aligned with the driving direction. The anisotropic crystal state can also exhibit soliton depinning, disordered motion, and dynamical reordering into an anisotropic crystal at high drives. The drive needed to induce the reordering transition diverges near the boundary between the stripe and anisotropic crystal states. When the substrate lattice constant is decreased, the stripe and anisotropic crystal states remain strongly pinned, but the bubble phases show a pronounced depinning threshold decrease. For constant drives that are well above the depinning threshold, the average velocity passes through a dip in the stripe phase. When the substrate lattice constant is considerably smaller than the width of the stripes or bubbles, the system forms a pinned stripe or modulated stripe aligned perpendicular to the substrate trough direction that can depin into moving stripes or moving bubbles. When the particle-particle interaction strengths are held fixed while the filling fraction of the system is changed, we find that all three phases show step-like features in the depinning threshold that correlate with commensuration effects in which an integer number of rows of particles can fit inside an individual substrate trough. At high filling fractions, the stripes depin into a modulated solid that remains aligned with the substrate trough direction even at high drives. We also find that as the substrate strength increases, there is a sharp increase in the depinning threshold at the crossover from elastic to plastic depinning. For strong pinning at a fixed drive, the velocity is a non-monotonic function of the magnitude of the attractive interaction term. The velocities are highest at zero attraction, pass through a minimum or reentrant pinning region in the stripe state, increase again for large bubbles, and then decrease until a second reentrant pinning regime for small bubbles emerges.
II Simulation
We consider a two-dimensional (2D) system with periodic boundary conditions in the and -directions. The sample contains particles that have pairwise interactions composed of a long-range repulsive term, which favors formation of a uniform triangular lattice, and a competing short-range attractive term, which favors clump or bubble formation. In our system the repulsion dominates at very short distances, which prevents complete collapse of the particles to a point even for strong attractive interactions. The system is of size with and the particle density is . The dynamics of particle obey the following overdamped equation of motion:
| (1) |
where the damping term is set to . The first term on the right hand side describes the particle-particle interactions, where
| (2) |
Here , and the location of particle is . For computational efficiency, we treat the long range repulsive Coulomb interaction using a real space Lekner summation technique as in previous work Reichhardt et al. (2003a); McDermott et al. (2014). The short range attraction term falls off exponentially with distance. The interaction potential of Eq. (2) produces crystal, stripe, bubble, or void lattice states depending on the values of , the attractive force strength , and the inverse screening length Reichhardt et al. (2003a, b, 2004); Olson Reichhardt et al. (2010); McDermott et al. (2014). In this work we fix . We focus on a particle density of , but also consider a range of densities from to . For in the absence of substrate, the system forms a crystal for , a stripe state for , and bubbles for .
The second term on the right hand side of Eq. (2) represents the interaction with a 1D substrate that is sinusoidal in form with minima and a lattice constant of . Here
| (3) |
where is the position of particle . We focus on substrates with , but also consider , 17, and . The particles are subjected to a uniform driving force .
The initial particle configuration is obtained through simulated annealing by placing the particles in a lattice configuration, subjecting them to a high temperature, and then slowly cooling the system. The thermal forces are represented by Langevin kicks, and after the simulated annealing is complete, the temperature is set to zero. After initialization, we apply a driving force to all of the particles. We typically wait or more simulation time steps after changing the driving force to avoid any transient effects, and then we measure the time-averaged particle velocity in the driving direction, . From this measure we can construct a velocity-force curve.
III Results
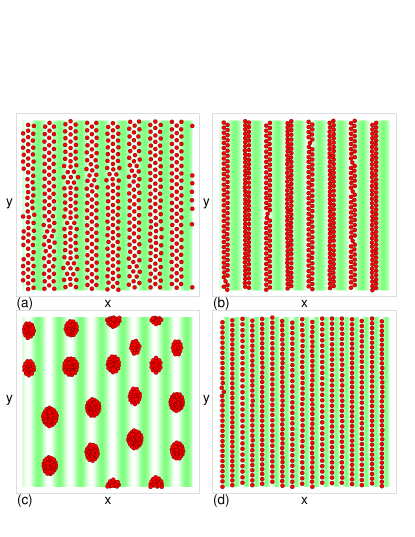
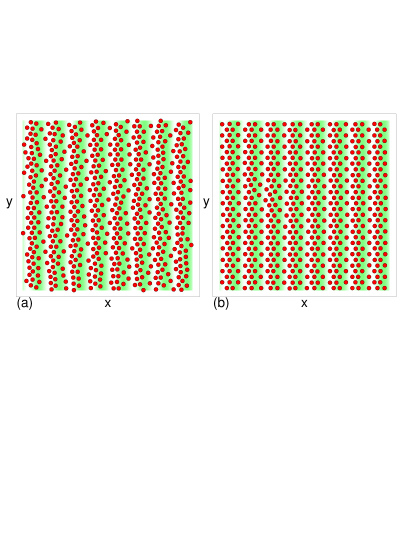
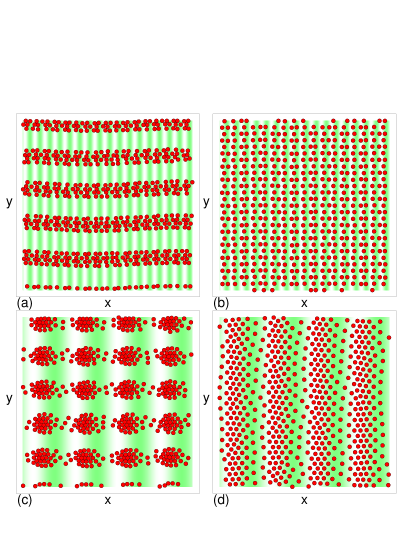
In Fig. 1, we show the pinned particle configurations at for a system with , , and . At , in the absence of a substrate a uniform crystal would form, but as illustrated in Fig. 1(a), the presence of a substrate produces an anisotropic crystal that has small density modulations induced by the substrate potential. Figure 1(b) shows a stripe phase at , where the stripes are aligned with the substrate troughs and each trough contains two rows of particles. At , the bubble phase shown in Fig. 1(c) forms. In Fig. 1(d), the stripe state with from Fig. 1(b) is placed on a substrate with , which reduces the substrate lattice constant. Here, each substrate trough captures a single row of particles.
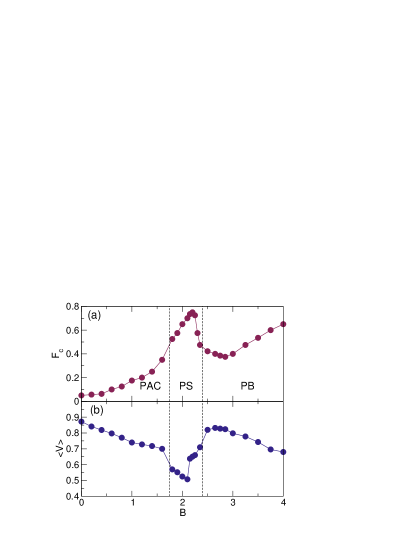
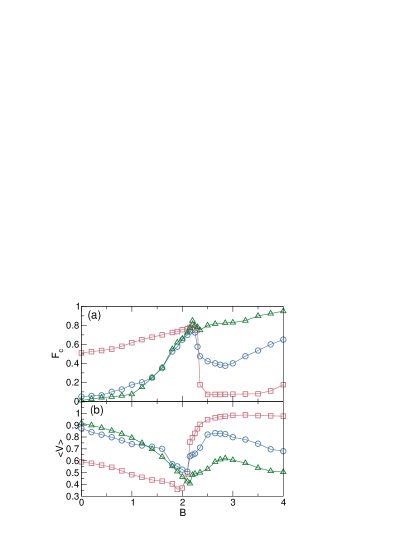
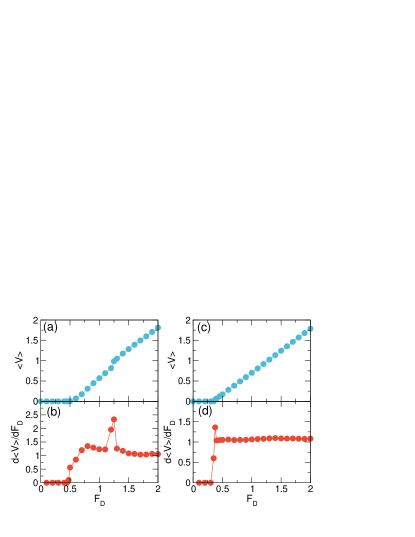
We next examine the driving force at which the system depins as a function of for the system in Fig. 1(a-c) with , , and by performing a series of simulations and constructing velocity-force curves. In Fig. 2(a), we plot for a range of values that span a pinned isotropic crystal (PAC) state, a pinned stripe (PS) state, and a pinned bubble (PB) state. For small , the depinning threshold has a low value of , indicating that the anisotropic crystal phases are weakly pinned. As increases, increases and reaches a peak value of in the stripe phase, showing that the stripes are strongly pinned. For values above the peak in , the depinning threshold decreases with increasing and the system enters the bubble phase, where a local minimum of appears at . As increases further, the bubbles shrink in size and the depinning threshold increases again since the smaller bubbles fit better into the pinning troughs, as shown in a previous study Reichhardt and Reichhardt (2024). In Fig. 2(b) we plot the average velocity versus at a constant drive of . In the absence of a substrate, for this value of . In the presence of the substrate, decreases with increasing until it reaches a local minimum in the stripe phase. The velocity then increases with increasing up to a local maximum value that appears early in the bubble phase, and finally decreases again with increasing for large . If the same measurement is performed at larger values of , we find that the dip in in the stripe phase persists but becomes flatter with increasing . This dip is a signature of the peak in the the critical depinning force that appears when the system has formed an anisotropic stripe state.

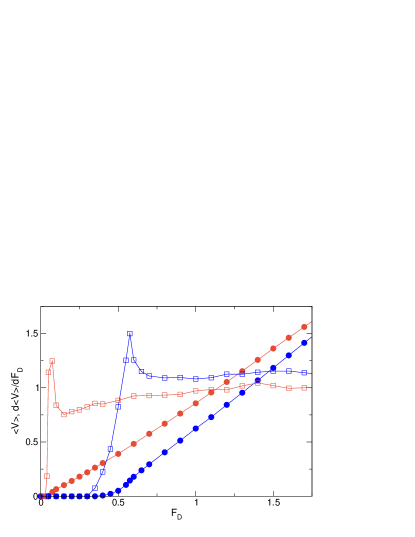
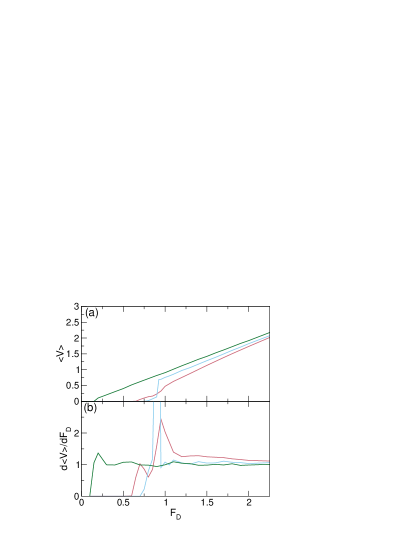
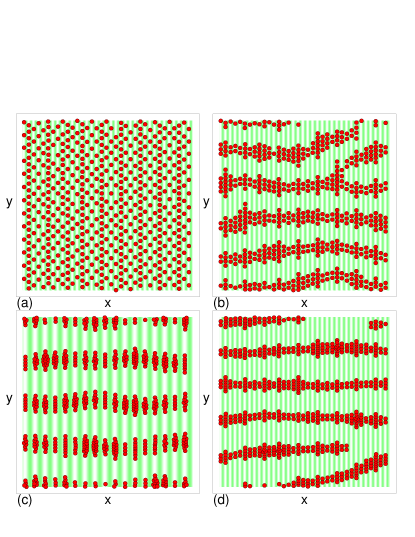
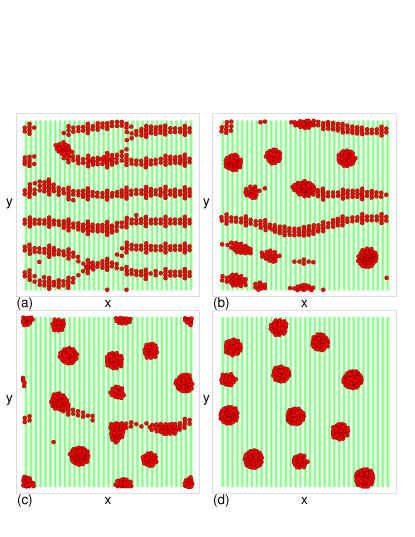
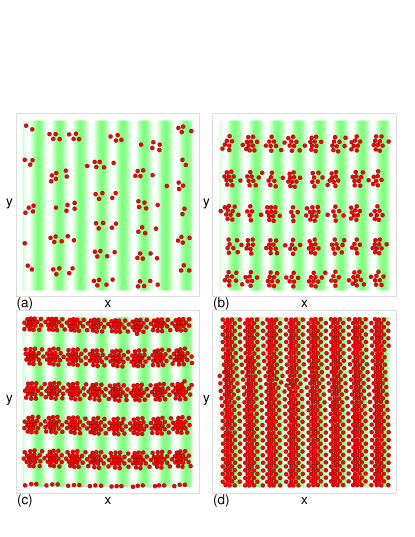
In Fig. 3 we plot the velocity-force curves along with the corresponding differential velocity curves versus for the system in Fig. 2 with , , and at in the bubble phase and in the stripe phase. For , the depinning threshold is low, there is a single peak in , and the differential velocity approaches just above this peak. Here, the bubbles depin elastically and pass directly from a pinned bubble state to a moving bubble phase. At , the stripes depin plastically, and there is a double peak in the differential conductivity, with the initial depinning producing a peak near followed by a second peak in near . The differential velocity does not approach until . The initial depinning of the stripe state occurs via the sliding of kinks or solitons, where individual particles hop out of one well and displace a particle in the adjacent well. This is illustrated in Fig. 4(a) where we highlight the particle trajectories from the stripe state in Fig. 3 at , just above . For drives of , the stripe system forms the moving disordered structure shown in Fig. 4(b) at , while at , a moving stripe structure that is aligned with the driving direction and not the substrate trough direction appears, as illustrated in Fig. 4(c). Since the number of stripes in the moving stripe structure is smaller than , each stripe has a width of four particles. There is also a periodic density modulation along the length of the stripe. The moving bubble state that appears above depinning for the system in Fig. 3 is illustrated in Fig. 4(d) at , where the bubbles have developed a slight anisotropy favoring the driving direction.
In Fig. 5, we show the and versus curves for the system from Fig. 2 in the anisotropic crystal state at and . When , the particles undergo weak plastic depinning from the anisotropic pinned crystal to a flowing disordered state, and then transition near into a dynamically reordered moving crystal. The corresponding curve contains only a single peak at the depinning transition. At , the depinning is strongly plastic, and soliton-like flow occurs, corresponding to the nonlinear segment of the versus curve appearing below . As the drive increases, a disordered flow regime appears, followed by dynamical ordering into a moving crystal for . In Fig. 6(a) we show the particle positions in the disordered flowing state at and , and in Fig. 6(b) we illustrate the dynamically reordered moving anisotropic lattice at . The lattice displays a small density modulation from the substrate.
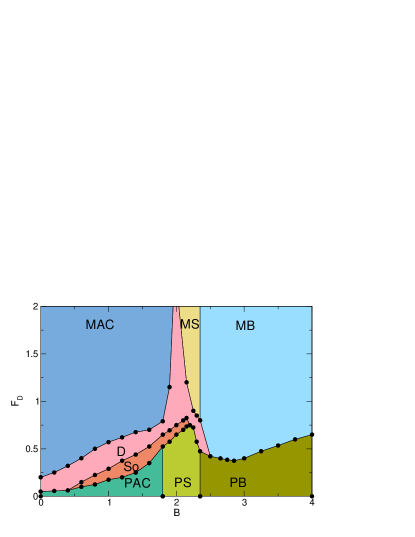
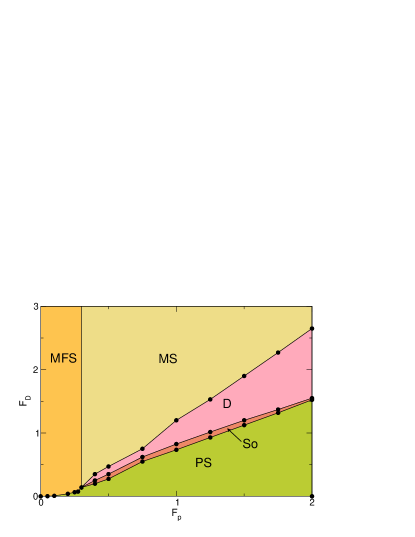
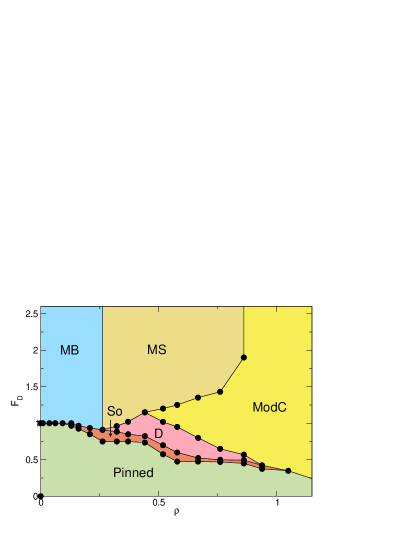
From the features in the transport curves and the particle arrangements, we can construct a dynamic phase diagram of the different phases as a function of versus for the sample with , , and , as shown in Fig. 7. The pinned states consist of the pinned anisotropic crystal (PAC), pinned stripe (PS), and pinned bubble (PB) phases. The PS can depin into either a moving soliton (So) phase or a disordered (D) plastic flow phase, and it dynamically reorders into a moving stripe (MS) at high drives. The PB phase shows a region of plastic depinning near , but for larger it elastically depins directly into the moving bubble (MB) phase. The PAC depins into the So phase and then transitions into the D phase before undergoing dynamic reordering into a moving anisotropic crystal (MAC). At small , there is no soliton depinning and the PAC depins directly into D flow. An interesting feature is that the drive needed to transition to the moving stripe phase diverges near the MAC-MS boundary. It is likely that the energy difference between the moving anisotropic crystal and the moving stripe state is small near this boundary, so the competition between the two phases causes a disordered flow to emerge. Only at very high drives is it possible to resolve the energy difference between the MAC and MS state, and escape from the disordered flow at the MAC-MS boundary.
IV Changing the Substrate Periodicity
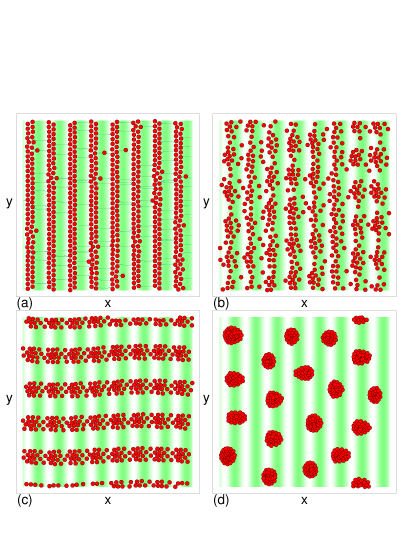
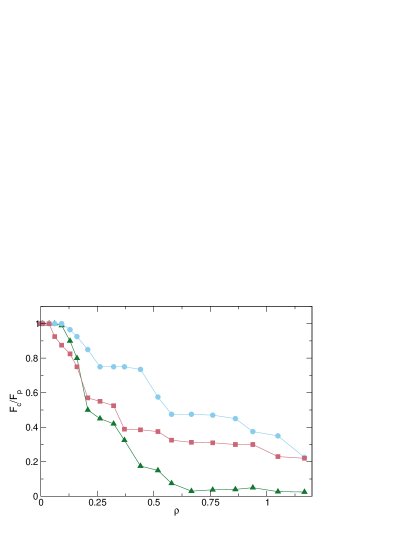
We next fix the particle density while changing the number of substrate minima, which alters the substrate lattice constant . In Fig. 8(a) we plot versus in samples with and at (), (), and (). The curve was already highlighted in Fig. 2. For , the anisotropic crystal phase becomes even more weakly pinned since the particles are able to fill all of the space; however, the bubble phase is now strongly pinned since the bubbles can easily fit within the substrate troughs. A small peak in appears near the stripe phase. When , the anisotropic crystal is strongly pinned, and the pinned stripe configuration at , illustrated in Fig. 1(d), consists of rows that are a single particle wide. The bubble phase for is weakly pinned because an individual bubble has a radius that is much larger than the pinning period of . Figure 8(b) shows the corresponding versus curves at , where a local minimum in appears in the stripe phase. For , the bubbles at higher values of slide at nearly the expected free flow velocity of .

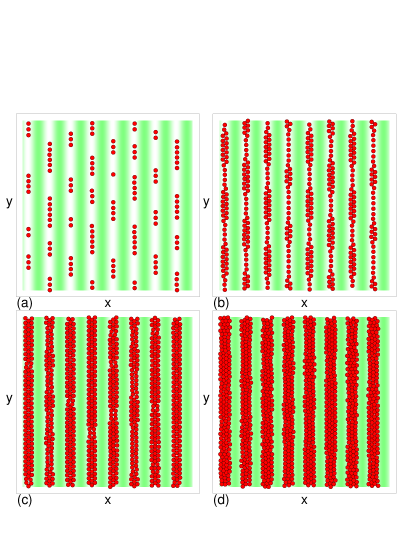
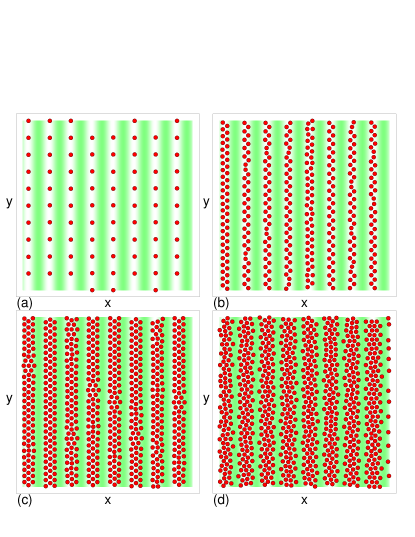
In Fig. 9(a), we show the pinned particle configuration for the bubble phase from Fig. 8 at and . The bubble radius is twice as large as the substrate spacing, so the bubbles can slide easily over the substrate. Figure 9(b) shows the same system at , where the bubbles easily fit within the substrate troughs and are strongly pinned. At and in Fig. 9(c), the system forms a density modulated crystal that is weakly pinned since some of the particles are located near maxima of the substrate potential. In Fig. 9(d), the particle configuration at and adopts a stripe-like pattern that is almost the same as the configuration found in Fig. 2 for and the same substrate spacing. Fig. 8(a) shows that the depinning threshold remains nearly constant for the anisotropic crystal and stripe states over the range , and only drops in the bubble phase when .
For , we observe dynamical phases similar to those described above for the system. There are, however, some differences in the transport curves, as shown in Fig. 10(a) where we plot versus at , 2.15, and 2.75. When , there is a two-step depinning process from a soliton like flow to a moving stripe state. The second depinning transition is more discontinuous than the first, resulting in the appearance in Fig. 10(b) of a strong peak in versus at the onset of the stripe phase. For , there is also a two-step depinning process that produces a double peak in , but neither of the peaks are as sharp as the peak found in the sample. At , there is a single peak in , and the pinned bubble phase depins elastically to a moving bubble phase. Another interesting feature is that even though the depinning threshold is largest for , the and velocity-force curves cross at higher drives so that, within the moving stripe regime, the velocity is higher for than for , indicating that for this value of the stripes can flow with less resistance than the moving anisotropic crystal. In Fig. 11(a), we illustrate the moving stripe state for the system from Fig. 10 with at and , where the stripes are aligned with the driving direction and are four particles wide. Figure 11(b) shows the moving crystal phase at and . When , a similar set of phases occurs but the features in the transport curves are not as sharp. In Fig. 11(c) we show the stripe phase at and , where the stripes are more bubble-like. Figure 11(d) shows the modulated moving solid at and in the system.
V Effect of Substrate Strength
In general, changing the substrate strength does not modify which dynamic phases are present, but it shifts the boundaries between the phases. As a function of increasing pinning strength, for the bubble phases we find a transition from elastic to plastic depinning at a critical pinning force that is accompanied by a noticeable increase in Reichhardt and Reichhardt (2024). For the anisotropic crystal, we observe a similar step up in at an elastic to plastic depinning transition, but it is not as pronounced as in the bubble phases. In Fig. 12 we plot a dynamic phase diagram as a function of versus for the stripe state at , , and . For , the stripes depin elastically and do not rotate to align with the driving direction but instead enter what we term a moving floating solid (MFS) state. For , the system depins plastically. There is a small jump up in the depinning threshold at the elastic-to-plastic depinning transition, and increases linearly with increasing in the plastic depinning regime. As the drive increases above the plastic depinning transition, the system first passes through a soliton flow phase and then into a disordered flow state before reaching a moving stripe state in which the stripes are aligned with the driving direction.
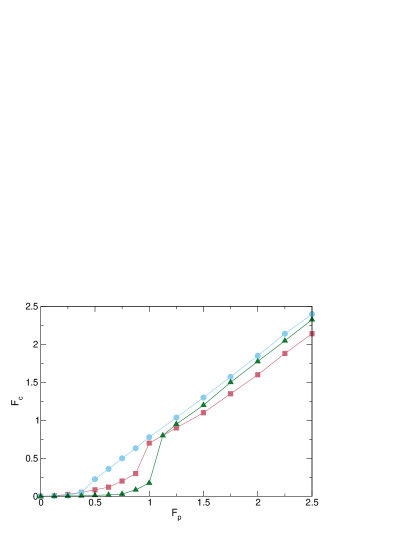
When , the transition from elastic to plastic depinning as a function of increasing is much sharper than in the system. In Fig. 13 we plot versus for a system with and at in the anisotropic crystal state, in the stripe state, and in the bubble state. The depinning threshold is largest for the stripe system at all , and the stripe state undergoes an elastic to plastic depinning transition near . For , the bubbles depin elastically up to , and then a large increase in the depinning threshold occurs at the transition to plastic depinning. For , the transition from elastic to plastic depinning appears at and is accompanied by a large increase in . Within the plastic depinning regime, the depinning threshold increases linearly with increasing as found for other interacting particle systems Reichhardt and Reichhardt (2017), while in the elastic depinning regime, is a nonlinear function of . Our results are not accurate enough to give the exact fitting function, but systems that depin elastically often have a depinning threshold that increases quadratically with increasing pinning force Reichhardt and Reichhardt (2017).
When , another effect we observe is that for stronger substrates and higher , the system forms pinned stripes or modulated stripes that are perpendicular to the substrate troughs. In Fig. 14(a), we illustrate the pinned configuration for a system with , , and , where a distorted crystal state appears. Figure 14(b) shows the same system at , where a pinned stripe appears that is aligned in the direction, perpendicular to the substrate troughs. At , , and in Fig. 14(c), we find a more discontinuous modulated stripe-like pattern aligned with the direction, while a stripe-like pinned pattern appears for , , and in Fig. 14(d). For either value of , when , the system can still depin plastically via solitons that run along the stripe, but as the drive increases, the entire stripe structure depins and remains aligned in the direction of the drive. For , the moving state forms bubbles, and depinning occurs via the formation of a bubble along the modulated stripe that picks up particles as it travels along the stripe as if the stripe is providing a track for motion. In Fig. 15 we illustrate the time evolution of the depinning of the stripe state into a moving bubble state for a sample with , , , , and . At early times in Fig. 15(a), the depinning occurs via the formation of bubbles that move along the stripe structures. The number of bubbles grows at later times, as shown in Fig. 15(b,c), and at long times all of the particles are contained by moving bubbles as in Fig. 15(d).
VI Varied Filling
We next consider the effect of holding , the substrate strength, and the substrate lattice constant fixed while varying the particle density . In Fig. 16, we plot versus for samples with and at in the stripe state, in the bubble state, and in the anisotropic crystal state. The stripe state has the highest depinning threshold across the entire range of , and shows some plateaus with for , for , for , and a decrease in at higher values of . These plateaus correspond to stripes that are composed of different numbers of particles per row. In Fig. 17(a) we plot the pinned particle configurations for at , where . Here, the system forms a stripelike bubble state where each bubble is only a single particle wide and the disordered bubbles are arranged in a rough lattice configuration. Figure 17(b) shows the pinned configuration at on the second plateau in , where a continuous stripe structure appears in which some regions of the stripe are two particles wide. It is the regions of greater width that depin first. In general, the second plateau in for the system corresponds to values of for which portions of the stripe are two particles wide. On the third plateau in , as shown in Fig. 17(c) at , portions of the stripes are three particles wide. Figure 17(d) shows the pinned stripe configuration at , where the stripes now have a width of four particles. In general, we expect that there should be a series of plateaus whenever rows of particles can fit inside one of the substrate troughs.
In Fig. 18(a), we show the pinned particle configurations for the system from Fig. 16 in the anisotropic crystal state at , where the particles form a rectangular array. Here, triangular ordering is suppressed by the attractive interaction term; if the particle interactions were purely repulsive, the particles would try to move as far away from each other as possible and would adopt a triangular configuration, but the attractive term causes square or rectangular configurations to be favored. Figure 18(b) shows the same system at , where stripes containing two rows of particles have formed. The pattern is more zig-zag in nature compared to the system, and there are no regions where the stripes are strictly 1D-like. At in Fig. 18(c), there are now three rows of particles in each substrate minimum. For the even higher density of , there is not enough space in the substrate minima to accommodate all of the particles, so the system becomes partially disordered and the depinning threshold drops considerably.
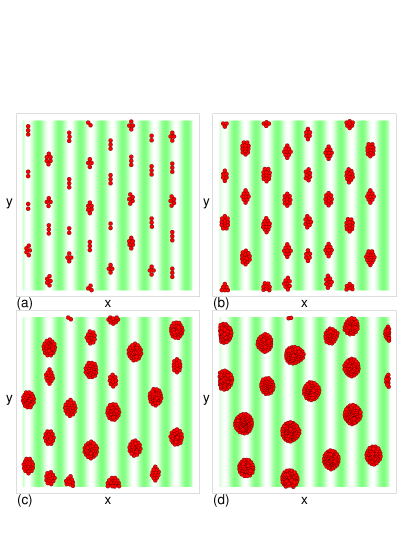
Figure 19(a) shows the particle configurations in the pinned bubble state for the system from Fig. 16 at and , where a series of small bubbles appear. For this filling, the depinning threshold is smaller than in the stripe and anisotropic crystal states, where the particle arrangements were strictly 1D. At in Fig. 19(b), the depinning threshold has dropped onto the next plateau, and the bubbles have a width of three particles. On the next plateau of the depinning threshold, illustrated in Fig. 19(c) at , the bubbles are much larger. Finally, for in Fig. 19(d), there are even larger bubbles.

In Fig. 20(a,b) we plot and versus for the stripe system from Fig. 16 at and . The depinning has the character of a single-particle process, and the system transitions from a pinned 1D bubble state to a moving dilute bubble phase. Here the depinning threshold falls slightly below . At these low densities, there are not enough particles present to permit a stripe phase to form, but there are still some bubble-like features in the moving state. Fig. 21(a) illustrates the moving clump phase for the system in Fig. 20(a) at . The plots of and versus in Fig. 20(b,c) for a sample with and indicate that there is a two-step depinning process accompanied by a double peak feature in the differential velocity-force curve. The system first depins into a soliton motion state in which the solitons translate through the regions containing two rows of particles. At higher drives, all of the particles depin and the system forms a moving stripe phase, as shown in Fig. 21(b) at .
In Fig. 22(a,b) we plot and versus for the system from Fig. 20 with at . Here we observe a soliton depinning process, a second depinning transition into a disordered flow state, and a dynamical reordering transition into a moving stripe state, visible as a peak in the differential mobility near . Figure 21(c) shows the particle configuration in the moving stripe state at for , where each stripe has a width of five particles. The plots of and in Fig. 22(c,d) for the same sample at exhibit a single peak in the differential mobility produced when the system depins elastically from a modulated solid to a moving modulated solid. Here the stripes do not reorient into the direction of driving and remain parallel to the substrate troughs. Figure 21(d) illustrates the moving modulated solid state for at .
From the features in the transport curves and the particle configurations, in Fig. 23 we construct a dynamic phase diagram as a function of vs for the system with , , and where we highlight the pinned regime, moving soliton (So) state, disordered motion (D) phase, moving stripe (MS) state, moving bubble (MB) phase, and moving modulated crystal (ModC). The system cannot form a moving stripe when and instead enters the moving bubble phase. The moving stripe phase occurs in a window of density ranging from . In a portion of this density window, we find that the system first passes through a moving modulated solid state before transitioning to the moving stripe configuration.
VII Reentrant Pinning Phases
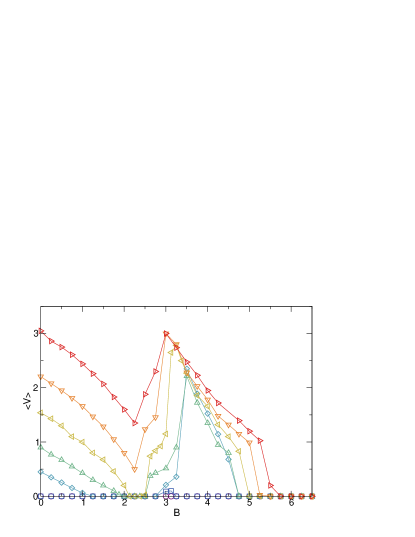
We have demonstrated above that the stripe state is the most strongly pinned phase; however, for large the smaller bubbles are also very strongly pinned, suggesting that it should be possible to observe multiple reentrant pinning effects under the right conditions. We consider a sample with and strong pinning of under a constant driving force of . In Fig. 24, we plot versus for this system at , 0.208, 0.262, 0.322, 0.44, 0.67, and . For , the system is pinned for all values of , while for and , the system is initially flowing at very small , enters a pinned stripe state near , and develops a finite velocity again in the bubble phase for . There is a local maximum in the velocity near ; however, as increases further, the bubbles shrink in size and become pinned again for sufficiently large , reaching a second reentrant pinned state. For , there is a dip in near in the stripe phase but the system does not become reentrantly pinned; this is followed by a local maximum in in the large bubble phase and a reentrant pinning of the small bubble state for large . Going to large values of has an effect on the transport that is similar to going to low particle density, since the increase of causes the average spacing between adjacent bubbles to get larger as the bubble radius becomes smaller. In particular, the depinning threshold approaches for both large and small . In Fig. 24, we have fixed , so once exceeds this value either by decreasing or increasing in the small bubble phase, the velocity drops to zero and a pinned state emerges.
VIII Discussion
Pattern forming systems on a 1D substrate exhibit a variety of additional effects that would be interesting to explore in future studies, such as thermal or creep effects, where it would be possible to compare stripe creep to bubble or anisotropic crystal creep, as well as differences between creep in the elastic depinning regime and creep in the plastic depinning regime. Several previous studies of particles with purely repulsive interactions coupled to a 1D periodic substrate demonstrated reentrant melting or smectic phases as a function of increasing substrate strength or filling Chowdhury et al. (1985); Chakrabarti et al. (1995); Frey et al. (1999); Radzihovsky et al. (2001). In this work we considered purely dc driving, but if ac driving were applied, we would expect to observe Shapiro step phenomena Reichhardt and Reichhardt (2017), and it would be possible to explore whether the Shapiro steps are enhanced in the stripe phase compared to the bubble phase. Another direction would be to consider a 2D substrate that could break apart the stripes or lock the flow of the stripe phase into particular directions. Other interesting effects to explore include the effect of adding a small amount of random point disorder or a random shift to the substrate. Our results should be general to the broader class of stripe or bubble-forming systems, including those that have different kinds of interactions, such as a purely repulsive interaction potential with two length scales.
IX Summary
We have numerically investigated the pinning and dynamics of a two-dimensional pattern-forming system consisting of particles with long-range repulsion and short-range attraction interacting with a periodic one-dimensional substrate. In the absence of a substrate, this system forms a crystal for very low attraction strength, an anisotropic crystal at weak attraction strength, a stripe lattice for intermediate attraction strength, and a bubble lattice for strong attraction. When a one-dimensional substrate is added to the sample, we find that the stripe state is the most strongly pinned overall, and is particularly strongly pinned whenever the stripes are commensurate with the substrate spacing and can align with the substrate minima. In the bubble phase, when the bubbles are large they do not fit into a single substrate minimum and are weakly pinned; however, small bubbles that can fit inside the substrate minima are strongly pinned. The anisotropic crystal and stripe states can depin plastically either via the motion of solitons or directly into a disordered flow phase, and at higher drives, the system can dynamically order into a moving crystal state or moving stripes that have rotated with respect to the pinned state and are aligned with the driving direction. We show that this system exhibits a wide variety of dynamical phases, and that transitions between the different phases are observable as multiple steps or peaks in the velocity-force curves and differential velocity curves. For small substrate lattice constants, the stripe and bubble phases are replaced by pinned modulated stripe phases with stripes that are perpendicular to the substrate troughs, in contrast to the case of large substrate spacing where the stripes are aligned with the substrate troughs. We map out the dynamic phases as a function of substrate strength, attraction strength, density, and driving force. At high densities, the stripes remain oriented with the substrate trough direction and not with the driving direction even in the moving state. Our results are relevant for a wide variety of similar pattern-forming systems in both soft and hard matter systems that are coupled to a periodic one-dimensional substrate.
Acknowledgements.
We gratefully acknowledge the support of the U.S. Department of Energy through the LANL/LDRD program for this work. This work was supported by the US Department of Energy through the Los Alamos National Laboratory. Los Alamos National Laboratory is operated by Triad National Security, LLC, for the National Nuclear Security Administration of the U. S. Department of Energy (Contract No. 892333218NCA000001).References
- Seul and Andelman (1995) M. Seul and D. Andelman, “Domain shapes and patterns - the phenomenology of modulated phases,” Science 267, 476–483 (1995).
- Stoycheva and Singer (2000) A. D. Stoycheva and S. J. Singer, “Stripe melting in a two-dimensional system with competing interactions,” Phys. Rev. Lett. 84, 4657–4660 (2000).
- Reichhardt et al. (2003a) C. Reichhardt, C. J. Olson, I. Martin, and A. R. Bishop, “Depinning and dynamics of systems with competing interactions in quenched disorder,” Europhys. Lett. 61, 221–227 (2003a).
- Reichhardt et al. (2004) C. J. O. Reichhardt, C. Reichhardt, I. Martin, and A. R. Bishop, “Dynamics and melting of stripes, crystals, and bubbles with quenched disorder,” Physica D 193, 303–309 (2004).
- Mossa et al. (2004) S. Mossa, F. Sciortino, P. Tartaglia, and E. Zaccarelli, “Ground-state clusters for short-range attractive and long-range repulsive potentials,” Langmuir 20, 10756–010763 (2004).
- Sciortino et al. (2004) F. Sciortino, S. Mossa, E. Zaccarelli, and P. Tartaglia, “Equilibrium cluster phases and low-density arrested disordered states: The role of short-range attraction and long-range repulsion,” Phys. Rev. Lett. 93, 055701 (2004).
- Nelissen et al. (2005) K. Nelissen, B. Partoens, and F. M. Peeters, “Bubble, stripe, and ring phases in a two-dimensional cluster with competing interactions,” Phys. Rev. E 71, 066204 (2005).
- Liu et al. (2008) Y. H. Liu, L. Y. Chew, and M. Y. Yu, “Self-assembly of complex structures in a two-dimensional system with competing interaction forces,” Phys. Rev. E 78, 066405 (2008).
- Olson Reichhardt et al. (2010) C. J. Olson Reichhardt, C. Reichhardt, and A. R. Bishop, “Structural transitions, melting, and intermediate phases for stripe- and clump-forming systems,” Phys. Rev. E 82, 041502 (2010).
- McDermott et al. (2016) D. McDermott, C. J. Olson Reichhardt, and C. Reichhardt, “Structural transitions and hysteresis in clump- and stripe-forming systems under dynamic compression,” Soft Matter 12, 9549–9560 (2016).
- Liu and Xi (2019) Y. Liu and Y. Xi, “Colloidal systems with a short-range attraction and long-range repulsion: phase diagrams, structures, and dynamics,” Curr. Opin. Colloid Interf. Sci. 19, 123–136 (2019).
- Xu et al. (2021) X. B. Xu, T. Tang, Z. H. Wang, X. N. Xu, G. Y. Fang, and M. Gu, “Nonequilibrium pattern formation in circularly confined two-dimensional systems with competing interactions,” Phys. Rev. E 103, 012604 (2021).
- Jagla (1998) E. A. Jagla, “Phase behavior of a system of particles with core collapse,” Phys. Rev. E 58, 1478–1486 (1998).
- Malescio and Pellicane (2003) G. Malescio and G. Pellicane, “Stripe phases from isotropic repulsive interactions,” Nature Mater. 2, 97–100 (2003).
- Glaser et al. (2007) M. A. Glaser, G. M. Grason, R. D. Kamien, A. Kosmrlj, C. D. Santangelo, and P. Ziherl, “Soft spheres make more mesophases,” EPL 78, 46004 (2007).
- Costa Campos et al. (2013) L. Q. Costa Campos, S. W. S. Apolinario, and H. Löwen, “Structural ordering of trapped colloids with competing interactions,” Phys. Rev. E 88, 042313 (2013).
- Fogler et al. (1996) M. M. Fogler, A. A. Koulakov, and B. I. Shklovskii, “Ground state of a two-dimensional electron liquid in a weak magnetic field,” Phys. Rev. B 54, 1853–1871 (1996).
- Moessner and Chalker (1996) R. Moessner and J. T. Chalker, “Exact results for interacting electrons in high Landau levels,” Phys. Rev. B 54, 5006–5015 (1996).
- Cooper et al. (1999) K. B. Cooper, M. P. Lilly, J. P. Eisenstein, L. N. Pfeiffer, and K. W. West, “Insulating phases of two-dimensional electrons in high Landau levels: Observation of sharp thresholds to conduction,” Phys. Rev. B 60, R11285–R11288 (1999).
- Pan et al. (1999) W. Pan, R. R. Du, H. L. Stormer, D. C. Tsui, L. N. Pfeiffer, K. W. Baldwin, and K. W. West, “Strongly anisotropic electronic transport at landau level filling factor and under a tilted magnetic field,” Phys. Rev. Lett. 83, 820–823 (1999).
- Fradkin and Kivelson (1999) E. Fradkin and S. A. Kivelson, “Liquid-crystal phases of quantum Hall systems,” Phys. Rev. B 59, 8065–8072 (1999).
- Göres et al. (2007) J. Göres, G. Gamez, J. H. Smet, L. Pfeiffer, K. West, A. Yacoby, V. Umansky, and K. von Klitzing, “Current-induced anisotropy and reordering of the electron liquid-crystal phases in a two-dimensional electron system,” Phys. Rev. Lett. 99, 246402 (2007).
- Zhu et al. (2009) H. Zhu, G. Sambandamurthy, L. W. Engel, D. C. Tsui, L. N. Pfeiffer, and K. W. West, “Pinning mode resonances of 2D electron stripe phases: Effect of an in-plane magnetic field,” Phys. Rev. Lett. 102, 136804 (2009).
- Friess et al. (2018) B. Friess, V. Umansky, K. von Klitzing, and J. H. Smet, “Current flow in the bubble and stripe phases,” Phys. Rev. Lett. 120, 137603 (2018).
- Shingla et al. (2023) V. Shingla, H. Huang, A. Kumar, L. N. Pfeiffer, K. W. West, K. W. Baldwin, and G. A. Csáthy, “A highly correlated topological bubble phase of composite fermions,” Nature Phys. 19, 689–693 (2023).
- Xu et al. (2011) X. B. Xu, H. Fangohr, S. Y. Ding, F. Zhou, X. N. Xu, Z. H. Wang, M. Gu, D. Q. Shi, and S. X. Dou, “Phase diagram of vortex matter of type-II superconductors,” Phys. Rev. B 83, 014501 (2011).
- Komendová et al. (2013) L. Komendová, M. V. Milošević, and F. M. Peeters, “Soft vortex matter in a type-I/type-II superconducting bilayer,” Phys. Rev. B 88, 094515 (2013).
- Varney et al. (2013) C. N. Varney, K. A. H. Sellin, Q.-Z. Wang, H. Fangohr, and E. Babaev, “Hierarchical structure foramtion in layered superconducting systems with multi-scale inter-vortex interactions,” J. Phys.: Condens. Matter 25, 415702 (2013).
- Sellin and Babaev (2013) K. A. H. Sellin and E. Babaev, “Stripe, gossamer, and glassy phases in systems with strong nonpairwise interactions,” Phys. Rev. E 88, 042305 (2013).
- Brems et al. (2022) X. S. Brems, S. Mühlbauer, W. Y. Córdoba-Camacho, A. A. Shanenko, A. Vagov, J. A. Aguiar, and R. Cubitt, “Current-induced self-organisation of mixed superconducting states,” Supercond. Sci. Technol. 35, 035003 (2022).
- Reichhardt et al. (2022) C. Reichhardt, C. J. O. Reichhardt, and M. Milošević, “Statics and dynamics of skyrmions interacting with disorder and nanostructures,” Rev. Mod. Phys. 94, 035005 (2022).
- Tranquada et al. (1995) J. M. Tranquada, B. J. Sterlieb, J. D. Axe, Y. Nakamura, and S. Uchida, “Evidence for stripe correlations of spins and holes in copper-oxide superconductors,” Nature (London) 375, 561–563 (1995).
- Olson Reichhardt et al. (2004) C. J. Olson Reichhardt, C. Reichhardt, and A. R. Bishop, “Fibrillar templates and soft phases in systems with short-range dipolar and long-range interactions,” Phys. Rev. Lett. 92, 016801 (2004).
- Mertelj et al. (2005) T. Mertelj, V. V. Kabanov, and D. Mihailovic, “Charged particles on a two-dimensional lattice subject to anisotropic Jahn-Teller interactions,” Phys. Rev. Lett. 94, 147003 (2005).
- Baity et al. (2018) P. G. Baity, T. Sasagawa, and D. Popović, “Collective dynamics and strong pinning near the onset of charge order in La1.48Nd0.4Sr0.12CuO4,” Phys. Rev. Lett. 120, 156602 (2018).
- Mahmoudian et al. (2015) S. Mahmoudian, L. Rademaker, A. Ralko, S. Fratini, and V. Dobrosavljević, “Glassy dynamics in geometrically frustrated Coulomb liquids without disorder,” Phys. Rev. Lett. 115, 025701 (2015).
- Reichhardt et al. (2003b) C. Reichhardt, C. J. Olson Reichhardt, I. Martin, and A. R. Bishop, “Dynamical ordering of driven stripe phases in quenched disorder,” Phys. Rev. Lett. 90, 026401 (2003b).
- Zhao et al. (2013) H. J. Zhao, V. R. Misko, and F. M. Peeters, “Dynamics of self-organized driven particles with competing range interaction,” Phys. Rev. E 88, 022914 (2013).
- Reichhardt and Reichhardt (2017) C. Reichhardt and C. J. Olson Reichhardt, “Depinning and nonequilibrium dynamic phases of particle assemblies driven over random and ordered substrates: a review,” Rep. Prog. Phys. 80, 026501 (2017).
- Bennaceur et al. (2018) K. Bennaceur, C. Lupien, B. Reulet, G. Gervais, L. N. Pfeiffer, and K. W. West, “Competing charge density waves probed by nonlinear transport and noise in the second and third Landau levels,” Phys. Rev. Lett. 120, 136801 (2018).
- Sun et al. (2022) J. Sun, J. Niu, Y. Li, Y. Liu, L. N. Pfeiffer, K. W. West, P. Wang, and X. Lin, “Dynamic ordering transitions in charged solid,” Fund. Res. 2, 178–183 (2022).
- Qian et al. (2017) Q. Qian, J. Nakamura, S. Fallahi, G. C. Gardner, and M. J. Manfra, “Possible nematic to smectic phase transition in a two-dimensional electron gas at half-filling,” Nature Commun. 8, 1536 (2017).
- Madathil et al. (2023) P. T. Madathil, K. A. Villegas Rosales, Y. J. Chung, K. W. West, K. W. Baldwin, L. N. Pfeiffer, L. W. Engel, and M. Shayegan, “Moving crystal phases of a quantum Wigner solid in an ultra-high-quality 2D electron system,” Phys. Rev. Lett. 131, 236501 (2023).
- Chowdhury et al. (1985) A. Chowdhury, B. J. Ackerson, and N. A. Clark, “Laser-induced freezing,” Phys. Rev. Lett. 55, 833–836 (1985).
- Chakrabarti et al. (1995) J. Chakrabarti, H. R. Krishnamurthy, A. K. Sood, and S. Sengupta, “Reentrant melting in laser field modulated colloidal suspensions,” Phys. Rev. Lett. 75, 2232–2235 (1995).
- Harada et al. (1996) K. Harada, O. Kamimura, H. Kasai, T. Matsuda, A. Tonomura, and V. V. Moshchalkov, “Direct observation of vortex dynamics in superconducting films with regular arrays of defects,” Science 274, 1167–1170 (1996).
- Frey et al. (1999) E. Frey, D. R. Nelson, and L. Radzihovsky, “Light-induced melting of colloidal crystals in two dimensions,” Phys. Rev. Lett. 83, 2977–2980 (1999).
- Wei et al. (1998) Q.-H. Wei, C. Bechinger, D. Rudhardt, and P. Leiderer, “Experimental study of laser-induced melting in two-dimensional colloids,” Phys. Rev. Lett. 81, 2606–2609 (1998).
- Bechinger et al. (2001) C. Bechinger, M. Brunner, and P. Leiderer, “Phase behavior of two-dimensional colloidal systems in the presence of periodic light fields,” Phys. Rev. Lett. 86, 930–933 (2001).
- Reichhardt and Olson (2002) C. Reichhardt and C. J. Olson, “Novel colloidal crystalline states on two-dimensional periodic substrates,” Phys. Rev. Lett. 88, 248301 (2002).
- Brunner and Bechinger (2002) M. Brunner and C. Bechinger, “Phase behavior of colloidal molecular crystals on triangular light lattices,” Phys. Rev. Lett. 88, 248302 (2002).
- Martinoli (1978) P. Martinoli, “Static and dynamic interaction of superconducting vortices with a periodic pinning potential,” Phys. Rev. B 17, 1175–1194 (1978).
- Reichhardt et al. (1997) C. Reichhardt, C. J. Olson, and F. Nori, “Dynamic phases of vortices in superconductors with periodic pinning,” Phys. Rev. Lett. 78, 2648–2651 (1997).
- Le Thien et al. (2016) Q. Le Thien, D. McDermott, C. J. Olson Reichhardt, and C. Reichhardt, “Orientational ordering, buckling, and dynamic transitions for vortices interacting with a periodic quasi-one-dimensional substrate,” Phys. Rev. B 93, 014504 (2016).
- Berdiyorov et al. (2006) G. R. Berdiyorov, M. V. Milošević, and F. M. Peeters, “Novel commensurability effects in superconducting films with antidot arrays,” Phys. Rev. Lett. 96, 207001 (2006).
- McDermott et al. (2014) D. McDermott, C. J. Olson Reichhardt, and C. Reichhardt, “Stripe systems with competing interactions on quasi-one dimensional periodic substrates,” Soft Matter 10, 6332–6338 (2014).
- Reichhardt and Reichhardt (2024) C. Reichhardt and C. J. O. Reichhardt, “Sliding dynamics for bubble phases on periodic modulated substrates,” (2024), arXiv:2401.13841 .
- Bhattacharya and Higgins (1993) S. Bhattacharya and M. J. Higgins, “Dynamics of a disordered flux line lattice,” Phys. Rev. Lett. 70, 2617–2620 (1993).
- Moon et al. (1996) K. Moon, R. T. Scalettar, and G. T. Zimányi, “Dynamical phases of driven vortex systems,” Phys. Rev. Lett. 77, 2778–2781 (1996).
- Balents et al. (1998) L. Balents, M. C. Marchetti, and L. Radzihovsky, “Nonequilibrium steady states of driven periodic media,” Phys. Rev. B 57, 7705–7739 (1998).
- Olson et al. (1998) C. J. Olson, C. Reichhardt, and F. Nori, “Nonequilibrium dynamic phase diagram for vortex lattices,” Phys. Rev. Lett. 81, 3757–3760 (1998).
- Pardo et al. (1998) F. Pardo, F. de la Cruz, P. L. Gammel, E. Bucher, and D. J. Bishop, “Observation of smectic and moving-Bragg-glass phases in flowing vortex lattices,” Nature (London) 396, 348–350 (1998).
- Reichhardt et al. (2015) C. Reichhardt, D. Ray, and C. J. Olson Reichhardt, “Collective transport properties of driven skyrmions with random disorder,” Phys. Rev. Lett. 114, 217202 (2015).
- Radzihovsky et al. (2001) L. Radzihovsky, E. Frey, and D. R. Nelson, “Novel phases and reentrant melting of two-dimensional colloidal crystals,” Phys. Rev. E 63, 031503 (2001).