Dynamic Explanation Selection Towards Successful User-Decision Support with Explainable AI
Abstract.
This paper addresses the problem of how to select explanations for XAI (Explainable AI)-based Intelligent Decision Support Systems (IDSSs). IDSSs have shown promise in improving user decisions through XAI-generated explanations along with AI predictions. As the development of XAI made various explanations available, we believe that IDSSs can be greatly improved if they can strategically select explanations that guide users to better decisions. This paper proposes X-Selector, a method for dynamically selecting explanations. X-Selector aims to guide users to better decisions by predicting the impact of different combinations of explanations on user decisions. We compared X-Selector’s performance with two naive strategies (all possible explanations and explanations only for the most likely prediction) and two baselines (no explanation and no AI support). The results suggest the potential of X-Selector to guide users to recommended decisions and improve the performance when AI accuracy is high and a challenge when it is low.
1. Introduction
Intelligent Decision Support Systems (IDSSs) (Phillips-Wren, 2013; Cherrington et al., 2020), empowered by Artificial Intelligence (AI), have the potential to help users make better decisions by introducing explainability into their support. An increasing number of methods have been proposed for achieving explainable AIs (XAIs) (Adadi and Berrada, 2018; Zhang and Zhu, 2018; Alsallakh et al., 2014; Samek et al., 2016), and the development of large language models (LLMs) has also made it possible to generate various post-hoc explanations that justify AI predictions. Previous studies have integrated such XAI methods into IDSSs and shown their effectiveness in presenting explanations along with AI predictions in diverse applications (Lee and Chew, 2023; Panagoulias et al., 2023; Das et al., 2023).
Now that IDSSs can have a variety of explanation candidates, a new question arises as to which explanations an IDSS should provide in dynamic interaction. Explanation is a complex cognitive process (Miller, 2019). Although XAI explanations can potentially guide users to make better decisions, there is also a risk of having negative effects on explainees’ decisions. Various causes including explanation uninterpretability (Maehigashi et al., 2023c, a, b), information overload (Ferguson et al., 2022; Herm, 2023), and contextual inaccuracy (Ehsan et al., 2019) can affect users and thus the performance of decision-making. A subtle difference in the nuance of a linguistic explanation can also have a different impact and sometimes mislead user decisions when influenced by the context, the status of the task, and the cognitive and psychological status of the users. Conversely, we can expect that XAI-based IDSSs can be greatly enhanced if they can strategically select explanations that are likely to lead users to better decisions while taking the situation into account.
To investigate the question of how IDSSs can select explanations to improve user decisions, this paper proposes X-Selector, a method for dynamically selecting which explanations to provide along with an AI prediction. The notable characteristic of X-Selector is that it predicts how explanations affect user decision-making for each trial and attempts to guide users to a recommended decision referring to the prediction results. This paper also reports two user experiments that simulated stock trading with an XAI-based IDSS. In a preliminary experiment, we compared two naive but common strategies—ALL (providing all possible explanations) and ARGMAX (providing only explanations for the AI’s most probable prediction)—against baseline scenarios providing no explanations or no decision support. The results suggest that the ARGMAX strategy works better with high AI accuracy, and ALL is more effective when AI accuracy is lower. In the second experiment, we compared the results of explanations selected by X-Selector with ARGMAX and ALL. The results indicate the potential of X-Selector’s selective explanations to more strongly lead users to recommended decisions and to outperform ARGMAX when AI accuracy is high, but also a challenge with the method when AI accuracy is low.
2. Background
2.1. XAIs for deep learning models
While various methods such as Fuzzy Logic and Evolutionary Computing have been introduced to IDSSs, this paper targets IDSSs with Deep Learning (DL) models. IDSSs driven by DL models are capable of dealing with high-dimensional data such as visual images and are actively studied in diverse fields (finance (Kraus and Feuerriegel, 2017), automation (Chernov et al., 2020), health care (Hung et al., 2019)). Due to their blackbox nature, explainability for DL models is also an area of active research (Kanamori et al., 2020; Confalonieri et al., 2021), and this can potentially offer benefits for IDSSs.
There are various forms of explanations depending on the nature of the target AI. Common explanations for visual information processing AIs include presenting saliency maps (Samek et al., 2016) and bounding boxes (Alsallakh et al., 2014; Zhang and Zhu, 2018). The class activation map (CAM) is a widely used method for visualizing a saliency map of convolutional neural network (CNN) layers (Zhou et al., 2016). It identifies the regions of an input image that contribute the most for a model to classify the image into a particular class. Updated CAM methods are proposed by subsequent studies (Selvaraju et al., 2017; Chattopadhay et al., 2018; Jiang et al., 2021).
Language is also a common modality of XAIs, and free-text explanation is becoming rapidly available thanks to the advance of LLMs (Wiegreffe et al., 2022). LLMs can generate post-hoc explanations for AI predictions. Here, post-hoc means that the explanations are generated after the AI’s decision-making process has occurred, as opposed to intrinsic methods that generate explanations in an integral part of that process (Adadi and Berrada, 2018). Though post-hoc methods are not guaranteed to explain the actual decision-making of an AI model, they have an advantage in that the performance is not affected because they do not regulate the architecture of the explained model.
2.2. Human-XAI interaction
The theme of this study involves how to facilitate appropriate use of AI by users. Avoiding human over/under-reliance on an AI is a fundamental problem of human-AI interaction (Hoff and Bashir, 2015; Parasuraman and Riley, 1997). Here, over-reliance is a state in which a human overestimates the capability of an AI and blindly follows its decision, whereas under-reliance is a state in which a human misuses an AI even though it can perform well.
Although explanation is believed to generally help people appropriately use AI by providing transparency in AI predictions, previous studies suggest that XAI explanations do not always work positively depending on the content of the explanations and the context. Maehigashi et al. demonstrated that presenting AI saliency maps has different effects on user trust in an AI depending on the task difficulty and the interpretability of the saliency map (Maehigashi et al., 2023c). Herm revealed that the type of XAI explanation strongly influences users’ cognitive load, task performance, and task time (Herm, 2023). Panigutti et al. conducted a user study with an ontology-based clinical IDSS, and they found that the users were influenced by the explanations despite the low perceived explanation quality (Panigutti et al., 2022). These results suggest potential risks of triggering under-reliance with explanations or, conversely, leading to users blindly following explanations from an IDSS even if the conclusion drawn from the explanations is incorrect.
This study aims to computationally predict how explanations affect user decisions in order to avoid misleading users and encourage them to make better decisions by selecting explanations. Work by Wiegreffe et al. (Wiegreffe et al., 2022) shares a similar concept with this study. They propose a method of evaluating explanations generated by LLMs by predicting human ratings of their acceptability. This approach is pivotal in understanding how users perceive AI-generated explanations. However, our study diverges by focusing on the behavioral impacts of these explanations on human decision-making. We are particularly interested in how these explanations can alter the decisions made by users getting an IDSS’s support, rather than just their perceptions of the explanations. Another relevant study, Pred-RC (Fukuchi and Yamada, 2023c, a, b), aims to predict the effect of explanations of AI performance so that users can avoid over/under-reliance. It dynamically predicts a user’s binary judgment of whether s/he assigns a task to the AI and selects explanations that guide him/her to better assignment. X-Selector aims to take a further step to predict concrete decisions taking the effects of explanations into account and proactively influences them to improve the performance of each decision-making.
3. X-Selector
3.1. Overview
To investigate the question of how an IDSS can select explanations to improve user decisions, this paper proposes X-Selector, a method for dynamically selecting explanations for AI predictions from a set of candidates. The idea of X-Selector is simple: it predicts user decisions under possible combinations of explanations and chooses the best one that is predicted to minimize the distance between the decisions that the user is likely to make and the ones recommended by the AI.
3.2. Algorithm
The main components of X-Selector are UserModel and . UserModel is a model of a user who makes decision . X-Selector uses it for user decision prediction:
| (1) |
The output of UserModel is represented as a probaility distribution of conditioned by and , where is a combination of explanations to be presented to the user, and represents all the other contextual information including AI predictions, task status, and user status.
In addition, X-Selector has a policy , which considers a decision based on . This inference is done in parallel with user decision-making:
| (2) |
X-Selector aims to minimize the distance between the probability distributions of and by comparing the effect of each on . The selected combination is calculated as:
| (3) |
3.3. Implementation
3.3.1. Task
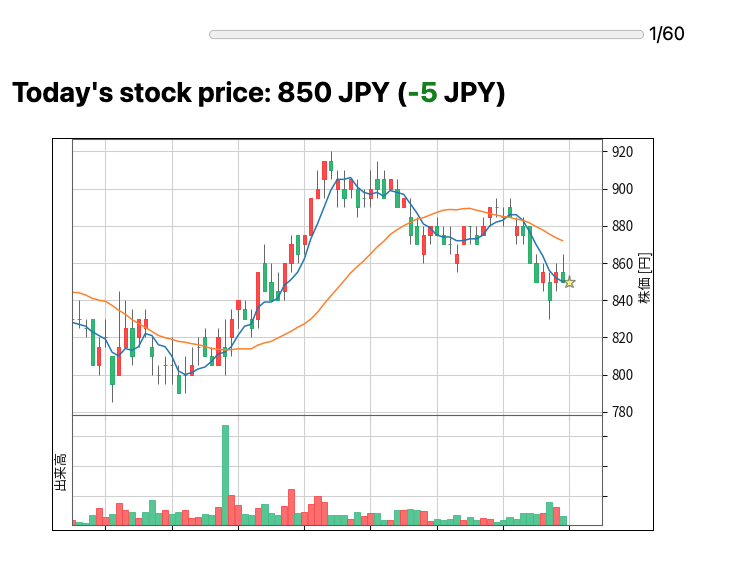
We implemented X-Selector in a stock trading simulator in which users get support from an XAI-based IDSS. Figure 1 shows screenshots of the simulator. The simulation was conducted on a website. Participants were virtually given three million JPY and traded stocks for 60 days with a stock price chart (Fig. 1), AI prediction of the future stock price, and explanations for the prediction (Fig. 1).
In the simulation, participants checked the opening price and a price chart for each day and decided whether to buy stocks with the funds they had, sell stocks they had, or hold their position. In accordance with Japan’s general stock trading system, participants could trade stocks in units of 100 shares. Participants were asked to show their decision twice a day to clarify the influence of the explanations. They were first asked to decide an initial order , that is, the amount of trade only with chart information and without the support of the IDSS. Then, the IDSS showed a bar graph that indicated the output of a stock price prediction model and its explanations. We did not explicitly show to enhance the autonomy of users’ decision-making, but we can easily extend X-Selector to a setting in which is given to users by including it with (when you always show ) or (when you want to selectively show ). Finally, they input their final order . After this, the simulator immediately transited to the next day. The positions carried over from the final day were converted into cash on the basis of the average stock price over the next five days to calculate the participants’ total performance.
3.3.2. StockAI
In the task, an IDSS provides a prediction of a stock price prediction model (StockAI) as user support. StockAI is a machine-learning model that is designed to predict the average stock price in the next five business days, and we used its prediction as the target of the explanation provided to users.
StockAI predicts future stock prices on the basis of an image of a candlestick chart. Although using a candlestick chart as an input does not necessarily lead to better performance than modern approaches proposed in the latest studies (Chen et al., 2016), we chose this because of the better understandability of saliency maps generated with the model as an explanation of AI predictions. Note that the aim of this research is not building a high-performance prediction model but investigating the interaction between a human and an AI whose performance is not necessarily perfect.
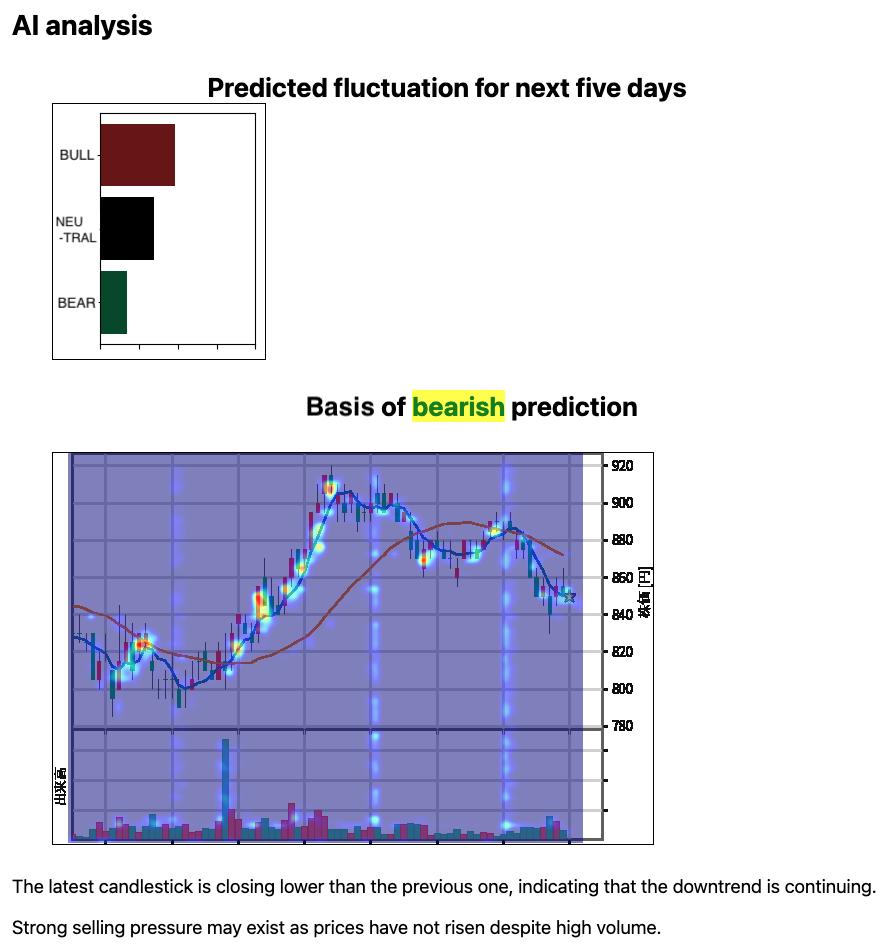
For the implementation of StockAI, we adopted ResNet-18 (He et al., 2016), a deep-learning visual information processing model, using the PyTorch library (Paszke et al., 2019). The StockAI is trained in a supervised manner; it classifies the ratio of the future stock price to the opening price of the day into three classes: BULL (over +2%), NEUTRAL (from -2 to +2%), and BEAR (under -2%). The prediction results are presented as a bar graph of the probability distribution for each class, which hereafter denoted as . For the training, we collected the historical stock data (from 2018/5/18 to 2023/5/16) of companies that are included in the Japanese stock index Nikkei225. We split the data by stock code, with three-quarters of the data as the training dataset and the remainder as the test. The accuracy with which the model was able to predict the correct class among the three classes was 0.474, and the accuracy for binary classification, or the matching rate of the sign of the expected value of the model’s prediction and that of actual fluctuations, was 0.63 for the test dataset.
3.3.3. Explanations
We prepared two types of explanations: saliency maps and free-texts. We applied CAM-based methods available in the pytorch-grad-cam package (Gildenblat and contributors, 2021) to StockAI and adopted Score-CAM (Wang et al., 2020) because it most clearly visualizes saliency maps of StockAI. Because CAM-based methods can generate a saliency map for each prediction class, three maps were acquired for each prediction.
In addition, we created a set of free-text explanations based on the GPT-4V model in the Open-AI API (OpenAI, 2023), which allows images as input. We input a chart with a prompt that asked GPT-4V to generate two explanation sentences that justify each prediction class (BULL, NEUTRAL, and BEAR). Therefore, we acquired six sentences in total for each chart.
As a result, three saliency maps and six free-text explanations were available for each trading day, and X-Selector considered combinations of the selected explanations ().
3.3.4. Models
We implemented UserModel with a deep learning model. The input of UserModel is a tuple . includes four variables: date , StockAI’s prediction , total rate , and initial order . is a categorical variable that embeds the context of the day such as the stock price. is a three-dimensional vector that corresponds to the values in the bar graph (Fig. 1). is the percentage increase or decrease of the user’s total asset from the initial amount. These variables are encoded in 2048-dimensional vectors .
Let us denote as a set , where is the raw data of an explanation, , and . if is to be presented, and when hidden. Saliency maps and free-text explanations are also encoded in 2048-dimensional vectors :
| (4) | |||||
| (5) |
where if and only if . denotes an element-wise product. is a three-layer CNN model. For , we used the E5 (embeddings from bidirectional encoder representations) model (Wang et al., 2022) with pretrained parameters111https://huggingface.co/intfloat/multilingual-e5-large.
All embedding vectors () are concatenated and input to a three-layer linear model. To extract the influence of explanations, the model was trained to predict not but the difference .
was acquired with the deep deterministic policy gradient, a deep reinforcement learning method (Gu et al., 2016). We simply trained to decide to maximize assets on the basis of for the training dataset. The reward for the policy is calculated as the difference in total assets between the current day and the previous day.
4. Experiments
4.1. Preliminary experiment
4.1.1. Procedure
We conducted a preliminary experiment to investigate the performance of users who were provided explanations with two naive selection strategies (ALL and ARGMAX). ALL shows all the nine explanations available for each day, and ARGMAX selects explanations for StockAI’s most probable prediction. To discuss the result, we also prepared two baselines: ONLY_PRED shows but does not provide any explanations. In the PLAIN condition, participants received no support from the IDSS and acted on their own.
For the experiment, we chose a Japanese general trading company (code: 2768) from the test dataset on the basis of the common stock price range (1,000 - 3,000 JPY) and its high volatility compared with the other Nikkei225 companies.
Because we had anticipated that the accuracy of StockAI would affect the result, we prepared two scenarios: high-accuracy and low-accuracy. We calculated the moving average of the accuracy of StockAI with a window size of 60 and chose two sections for them. The accuracy of StockAI for high-accuracy was 0.750, which was the highest, and that for low-accuracy was 0.333, the chance level of three-class classification.
We recruited participants to join the simulation with compensation of 220 JPY through Lancers222https://lancers.jp/, a Japanese crowdsourcing platform, and got 336 participants. The participants were first provided pertinent information, and 325 consented to the participation. We gave them instructions on the task and gave basic explanations about stock charts and the price prediction AI. We instructed the participants to increase the given three million JPY as much as possible by trading with the IDSS’s support. To motivate them, we also told them that additional rewards would be given to the top performers. We did not notify them of the amount of the additional rewards and the number of participants who got them. We asked six questions to check their comprehension of the task. 34 participants who failed to answer correctly were excluded from the task. After familiarization with the user interface of the simulator, the participants traded for 60 virtual days successively. 242 participants completed the task (152 males, 88 females, and 2 did not answer; aged 14-77, ). Table 1 gives details on the sample sizes.
| ALL | ARGMAX | ONLY_PRED | PLAIN | |
|---|---|---|---|---|
| High-accuracy | 39 | 40 | 34 | 41 |
| Low-accuracy | 31 | 34 | 34 | 38 |
4.1.2. Result
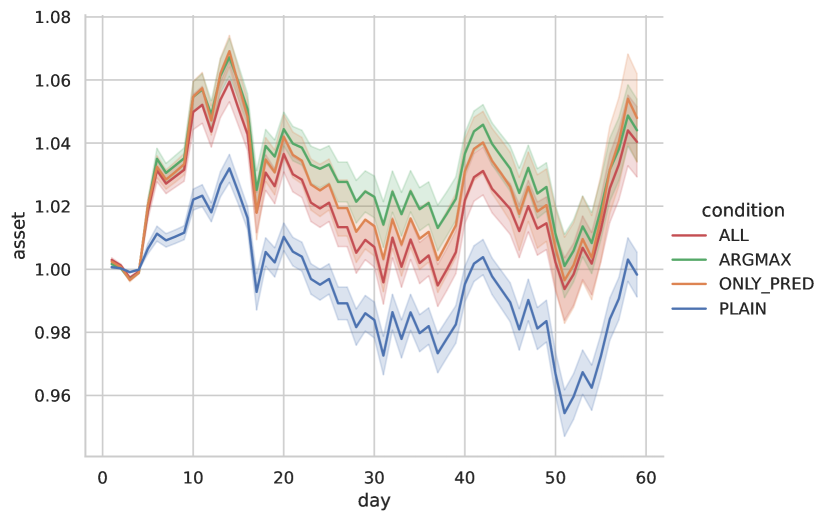
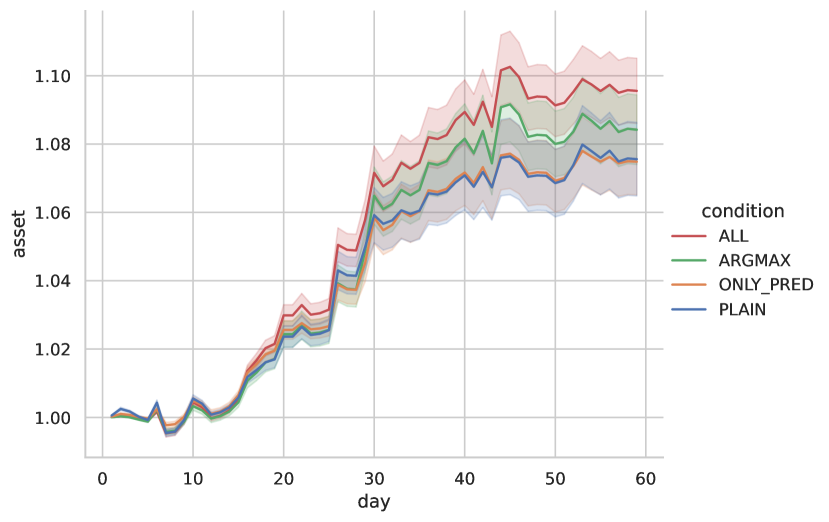
Figure 2 shows the changes in the participants’ performance. A conspicuous result is the underperformance of PLAIN, particularly in the high-accuracy scenario. ONLY_PRED performed well for high-accuracy, but could not outperform PLAIN for low-accuracy. This suggests that presenting alone contributes to improving performance only when it has enough accuracy.
ALL and ARGMAX showed different results between the scenarios. For high-accuracy, ARGMAX outperformed ALL. ALL slightly underperformed the ONLY_PRED baseline as well. This suggests that ARGMAX explanations successfully guided users to follow the prediction of StockAI while ALL toned down the guidance, which worked negatively in this scenario. On the other hand, ALL outperformed ARGMAX and the baselines for low-accuracy. Interestingly, ARGMAX also outperformed the baselines, which suggests that explanations successfully provide users with insights into situations and AI accuracy and can contribute to better decision-making. ALL positively worked for low-accuracy by providing multiple perspectives.
4.2. Experiment with X-Selector
4.2.1. Procedure
To evaluate X-Selector, we conducted a simulation with its selected explanations. To train UserModel, we used the data of the preliminary experiment and additional data acquired in another experiment in which explanations were randomly selected. We added the data to broaden the variety of explanation combinations in the dataset. The numbers of the additional participants were 54 and 45 for high- and low-accuracy, respectively. We conducted a 4-fold cross validation for UserModel, and the correlation coefficient between the model’s predictions and the ground truths was 0.429 on average (). We obtained a participation of 97 participants. Finally, 39 and 35 participants completed the task for high-accuracy and low-accuracy, respectively (46 males, 26 females and 2 did not answer; aged 23-64, ).
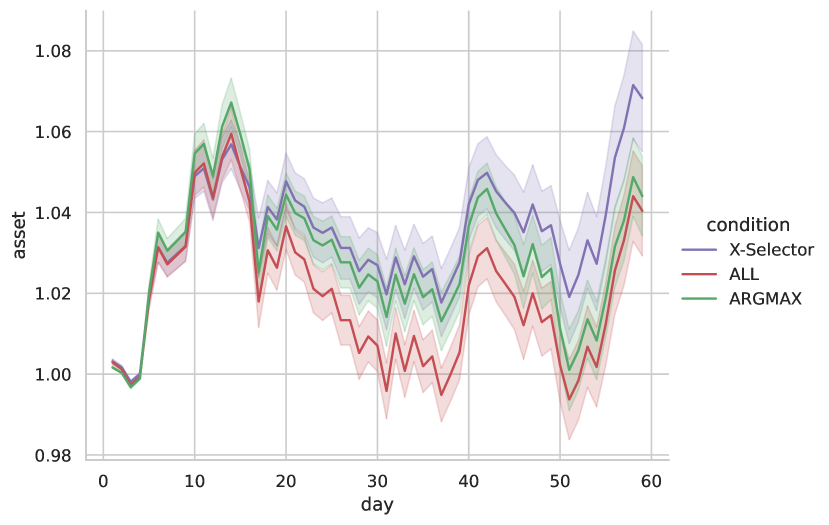
4.2.2. Result
Figure 3 illustrates the result of X-Selector and those of ALL and ARGMAX for comparison. For high-accuracy, X-Selector generally outperformed ALL and ARGMAX. In more detail, X-Selector first underperformed ARGMAX, but the score reversed on day 16. The gap once narrowed near day 39, but it broadened again until the final day.
A possible reason for X-Selector’s successful result is that it can predict which combination of explanations guides participants to sell or buy shares more. For example, the stock price around day 16 dropped steeply, so the IDSS needed to guide participants to reverse their position. Here, whereas ARGMAX showed explanations for BEAR, X-Selector showed explanations for NEUTRAL as well as BEAR, which may have helped users sell their shares more. Similarly, X-Selector also attempted to guide users to buy a moderate amount when was positive but not high by, for example, showing only a saliency map for BULL and no text explanations. Another reason is that X-Selector can overcome the ambiguity in the interpretation of . reflects a momentum of stock price in the high-accuracy scenario and must provide some insight for trading, but it was up to the participants how to use this to actually decide their order. sometimes suggested that they buy shares even though NEUTRAL or BEAR was the most likely in . Thus, we can say that was poorly calibrated, but by referring to , X-Selector can avoid misleading participants and instead lead them to more promising decisions.
On the other hand, X-Selector underperformed ARGMAX until day 16. The stock price was in an uptrend until day 14, and ARGMAX continuously presented explanations for BULL for 12 days in a row, which may have strongly guided participants to buy stocks and lead to large benefits. In our implementation, UserModel considers only the explanations of the day and does not consider the history of what explanations were previously provided, which can be a next target for future work.
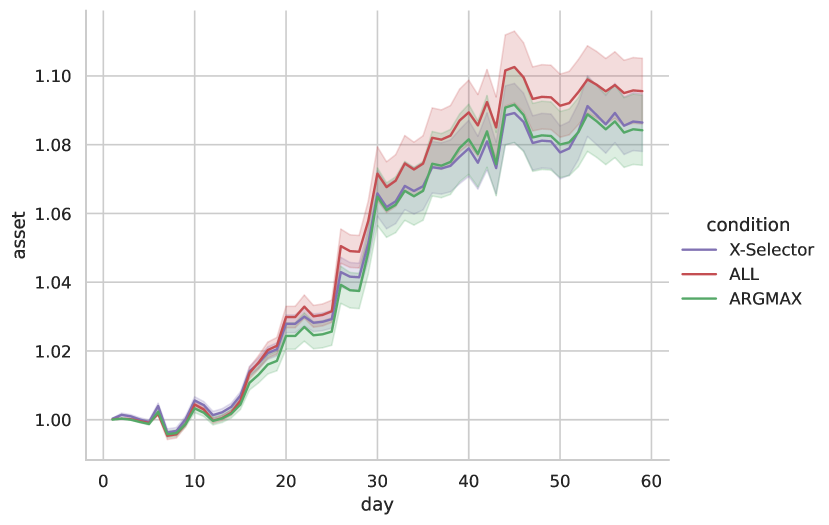
X-Selector could not perform well in the low-accuracy scenario. Overall, the score was similar to ARGMAX and underperformed ALL. A main reason for this result is that the poor performance of StockAI negatively affected the performance of . Because the guidance of X-Selector is based on , this results in misleading users, though it was better than the baselines. A future direction of X-Selector is adjusting the strength of guiding users on the basis of AI performance rather than just aiming to lead users to .
5. Conclusion
This paper focused on the question of how IDSSs can select explanations to improve user decisions, and we proposed X-Selector, which is a method for dynamically selecting which explanations to provide along with an AI prediction. In X-Selector, UserModel predicts the effect of presenting explanations on a user decision for each possible combination to show. Then, X-Selector selects the best combination that minimizes the difference between the predicted user decision and the system’s recommendation. We applied X-Selector to a stock trading simulation with the support of an XAI-based IDSS. The result indicated that X-Selector can select explanations that guide users to recommended decisions effectively and improve the performance when the accuracy of the AI is high, but also it suggested the necessity of adjusting the strength of the guidance for low-accuracy cases.
Acknowledgements.
Anonymized.References
- (1)
- Adadi and Berrada (2018) Amina Adadi and Mohammed Berrada. 2018. Peeking Inside the Black-Box: A Survey on Explainable Artificial Intelligence (XAI). IEEE Access 6 (2018), 52138–52160. https://doi.org/10.1109/ACCESS.2018.2870052
- Alsallakh et al. (2014) Bilal Alsallakh, Allan Hanbury, Helwig Hauser, Silvia Miksch, and Andreas Rauber. 2014. Visual Methods for Analyzing Probabilistic Classification Data. IEEE TVCG 20, 12 (2014), 1703–1712. https://doi.org/10.1109/TVCG.2014.2346660
- Chattopadhay et al. (2018) Aditya Chattopadhay, Anirban Sarkar, Prantik Howlader, and Vineeth N Balasubramanian. 2018. Grad-CAM++: Generalized Gradient-Based Visual Explanations for Deep Convolutional Networks. In 2018 IEEE Winter Conference on Applications of Computer Vision (WACV). 839–847. https://doi.org/10.1109/WACV.2018.00097
- Chen et al. (2016) Jou-Fan Chen, Wei-Lun Chen, Chun-Ping Huang, Szu-Hao Huang, and An-Pin Chen. 2016. Financial Time-Series Data Analysis Using Deep Convolutional Neural Networks. In 2016 7th International Conference on Cloud Computing and Big Data (CCBD). 87–92. https://doi.org/10.1109/CCBD.2016.027
- Chernov et al. (2020) Andrey Chernov, Maria Butakova, and Aleksandr Kostyukov. 2020. Intelligent Decision Support for Power Grids Using Deep Learning on Small Datasets. In 2020 2nd International Conference on Control Systems, Mathematical Modeling, Automation and Energy Efficiency (SUMMA). 958–962. https://doi.org/10.1109/SUMMA50634.2020.9280654
- Cherrington et al. (2020) Marianne Cherrington, Zhongyu (Joan) Lu, Qiang Xu, David Airehrour, Samaneh Madanian, and Andrea Dyrkacz. 2020. Deep Learning Decision Support for Sustainable Asset Management. In Advances in Asset Management and Condition Monitoring, Andrew Ball, Len Gelman, and B. K. N. Rao (Eds.). Springer International Publishing, Cham, 537–547.
- Confalonieri et al. (2021) Roberto Confalonieri, Tillman Weyde, Tarek R. Besold, and Fermín Moscoso del Prado Martín. 2021. Using ontologies to enhance human understandability of global post-hoc explanations of black-box models. Artificial Intelligence 296 (2021), 103471. https://doi.org/10.1016/j.artint.2021.103471
- Das et al. (2023) Devleena Das, Been Kim, and Sonia Chernova. 2023. Subgoal-Based Explanations for Unreliable Intelligent Decision Support Systems. In Proceedings of the 28th International Conference on Intelligent User Interfaces (Sydney, NSW, Australia) (IUI ’23). Association for Computing Machinery, New York, NY, USA, 240–250. https://doi.org/10.1145/3581641.3584055
- Ehsan et al. (2019) Upol Ehsan, Pradyumna Tambwekar, Larry Chan, Brent Harrison, and Mark O. Riedl. 2019. Automated Rationale Generation: A Technique for Explainable AI and Its Effects on Human Perceptions. In Proc. 24th Int. Conf. IUI (Marina del Ray, California). 263–274. https://doi.org/10.1145/3301275.3302316
- Ferguson et al. (2022) Aidah Nakakande Ferguson, Matija Franklin, and David Lagnado. 2022. Explanations that backfire: Explainable artificial intelligence can cause information overload. In Proceedings of the Annual Meeting of the Cognitive Science Society, Vol. 44.
- Fukuchi and Yamada (2023a) Yosuke Fukuchi and Seiji Yamada. 2023a. Dynamic Selection of Reliance Calibration Cues With AI Reliance Model. IEEE Access 11 (2023), 138870–138881. https://doi.org/10.1109/ACCESS.2023.3339548
- Fukuchi and Yamada (2023b) Yosuke Fukuchi and Seiji Yamada. 2023b. Selective Presentation of AI Object Detection Results While Maintaining Human Reliance. In 2023 IEEE/RSJ International Conference on Intelligent Robots and Systems (IROS). IEEE, 3527–3532. https://doi.org/10.1109/IROS55552.2023.10341684
- Fukuchi and Yamada (2023c) Yosuke Fukuchi and Seiji Yamada. 2023c. Selectively Providing Reliance Calibration Cues With Reliance Prediction. In Proceedings of the Annual Meeting of the Cognitive Science Society, Vol. 45. 1579–1586. https://escholarship.org/uc/item/8zp6g0mj
- Gildenblat and contributors (2021) Jacob Gildenblat and contributors. 2021. PyTorch library for CAM methods. https://github.com/jacobgil/pytorch-grad-cam.
- Gu et al. (2016) Shixiang Gu, Timothy Lillicrap, Ilya Sutskever, and Sergey Levine. 2016. Continuous Deep Q-Learning with Model-based Acceleration. In Proceedings of The 33rd International Conference on Machine Learning (Proceedings of Machine Learning Research, Vol. 48), Maria Florina Balcan and Kilian Q. Weinberger (Eds.). PMLR, New York, New York, USA, 2829–2838. https://proceedings.mlr.press/v48/gu16.html
- He et al. (2016) Kaiming He, Xiangyu Zhang, Shaoqing Ren, and Jian Sun. 2016. Deep residual learning for image recognition. In Proceedings of the IEEE conference on computer vision and pattern recognition. 770–778.
- Herm (2023) Lukas-Valentin Herm. 2023. Impact Of Explainable AI On Cognitive Load: Insights From An Empirical Study. In The 31st European Conference on Information Systems. 269.
- Hoff and Bashir (2015) Kevin Anthony Hoff and Masooda Bashir. 2015. Trust in automation: Integrating empirical evidence on factors that influence trust. Human Factors 57, 3 (23 May 2015), 407–434. https://doi.org/10.1177/0018720814547570
- Hung et al. (2019) Chen-Ying Hung, Ching-Heng Lin, Tsuo-Hung Lan, Giia-Sheun Peng, and Chi-Chun Lee. 2019. Development of an intelligent decision support system for ischemic stroke risk assessment in a population-based electronic health record database. PLOS ONE 14, 3 (03 2019), 1–16. https://doi.org/10.1371/journal.pone.0213007
- Jiang et al. (2021) Peng-Tao Jiang, Chang-Bin Zhang, Qibin Hou, Ming-Ming Cheng, and Yunchao Wei. 2021. LayerCAM: Exploring Hierarchical Class Activation Maps For Localization. IEEE Transactions on Image Processing (2021).
- Kanamori et al. (2020) Kentaro Kanamori, Takuya Takagi, Ken Kobayashi, and Hiroki Arimura. 2020. DACE: Distribution-Aware Counterfactual Explanation by Mixed-Integer Linear Optimization. In Proceedings of the Twenty-Ninth International Joint Conference on Artificial Intelligence, IJCAI-20, Christian Bessiere (Ed.). International Joint Conferences on Artificial Intelligence Organization, 2855–2862. https://doi.org/10.24963/ijcai.2020/395 Main track.
- Kraus and Feuerriegel (2017) Mathias Kraus and Stefan Feuerriegel. 2017. Decision support from financial disclosures with deep neural networks and transfer learning. Decision Support Systems 104 (2017), 38–48. https://doi.org/10.1016/j.dss.2017.10.001
- Lee and Chew (2023) Min Hun Lee and Chong Jun Chew. 2023. Understanding the Effect of Counterfactual Explanations on Trust and Reliance on AI for Human-AI Collaborative Clinical Decision Making. Proc. ACM Hum.-Comput. Interact. 7, CSCW2, Article 369 (oct 2023), 22 pages. https://doi.org/10.1145/3610218
- Maehigashi et al. (2023a) Akihiro Maehigashi, Yosuke Fukuchi, and Seiji Yamada. 2023a. Empirical investigation of how robot’s pointing gesture influences trust in and acceptance of heatmap-based XAI. In 2023 32nd IEEE International Conference on Robot and Human Interactive Communication (RO-MAN). 2134–2139. https://doi.org/10.1109/RO-MAN57019.2023.10309507
- Maehigashi et al. (2023b) Akihiro Maehigashi, Yosuke Fukuchi, and Seiji Yamada. 2023b. Experimental Investigation of Human Acceptance of AI Suggestions with Heatmap and Pointing-based XAI. In Proceedings of the 11th International Conference on Human-Agent Interaction (Gothenburg, Sweden) (HAI ’23). Association for Computing Machinery, New York, NY, USA, 291–298. https://doi.org/10.1145/3623809.3623834
- Maehigashi et al. (2023c) Akihiro Maehigashi, Yosuke Fukuchi, and Seiji Yamada. 2023c. Modeling Reliance on XAI Indicating Its Purpose and Attention. In Proceedings of the Annual Meeting of the Cognitive Science Society, Vol. 45. 1929–1936. https://escholarship.org/uc/item/1fx742xm
- Miller (2019) Tim Miller. 2019. Explanation in artificial intelligence: Insights from the social sciences. Artificial Intelligence 267 (2019), 1–38. https://doi.org/10.1016/j.artint.2018.07.007
- OpenAI (2023) OpenAI. 2023. GPT-4 Technical Report. arXiv:2303.08774 [cs.CL]
- Panagoulias et al. (2023) Dimitrios P. Panagoulias, Elissaios Sarmas, Vangelis Marinakis, Maria Virvou, George A. Tsihrintzis, and Haris Doukas. 2023. Intelligent Decision Support for Energy Management: A Methodology for Tailored Explainability of Artificial Intelligence Analytics. Electronics 12, 21 (2023). https://doi.org/10.3390/electronics12214430
- Panigutti et al. (2022) Cecilia Panigutti, Andrea Beretta, Fosca Giannotti, and Dino Pedreschi. 2022. Understanding the Impact of Explanations on Advice-Taking: A User Study for AI-Based Clinical Decision Support Systems. In Proceedings of the 2022 CHI Conference on Human Factors in Computing Systems (New Orleans, LA, USA) (CHI ’22). Association for Computing Machinery, New York, NY, USA, Article 568, 9 pages. https://doi.org/10.1145/3491102.3502104
- Parasuraman and Riley (1997) Raja Parasuraman and Victor Riley. 1997. Humans and Automation: Use, Misuse, Disuse, Abuse. Human Factors 39, 2 (1997), 230–253. https://doi.org/10.1518/001872097778543886 arXiv:https://doi.org/10.1518/001872097778543886
- Paszke et al. (2019) Adam Paszke, Sam Gross, Francisco Massa, Adam Lerer, James Bradbury, Gregory Chanan, Trevor Killeen, Zeming Lin, Natalia Gimelshein, Luca Antiga, Alban Desmaison, Andreas Kopf, Edward Yang, Zachary DeVito, Martin Raison, Alykhan Tejani, Sasank Chilamkurthy, Benoit Steiner, Lu Fang, Junjie Bai, and Soumith Chintala. 2019. PyTorch: An Imperative Style, High-Performance Deep Learning Library. In Advances in Neural Information Processing Systems 32. Curran Associates, Inc., 8024–8035. http://papers.neurips.cc/paper/9015-pytorch-an-imperative-style-high-performance-deep-learning-library.pdf
- Phillips-Wren (2013) Gloria Phillips-Wren. 2013. Intelligent Decision Support Systems. 25–44. https://doi.org/10.1002/9781118522516.ch2
- Samek et al. (2016) Wojciech Samek, Alexander Binder, Grégoire Montavon, Sebastian Lapuschkin, and Klaus-Robert Müller. 2016. Evaluating the visualization of what a deep neural network has learned. IEEE TNLS 28, 11 (2016), 2660–2673.
- Selvaraju et al. (2017) Ramprasaath R. Selvaraju, Michael Cogswell, Abhishek Das, Ramakrishna Vedantam, Devi Parikh, and Dhruv Batra. 2017. Grad-CAM: Visual Explanations from Deep Networks via Gradient-Based Localization. In 2017 IEEE International Conference on Computer Vision (ICCV). 618–626. https://doi.org/10.1109/ICCV.2017.74
- Wang et al. (2020) Haofan Wang, Zifan Wang, Mengnan Du, Fan Yang, Zijian Zhang, Sirui Ding, Piotr Mardziel, and Xia Hu. 2020. Score-CAM: Score-Weighted Visual Explanations for Convolutional Neural Networks. In Proceedings of the IEEE/CVF Conference on Computer Vision and Pattern Recognition (CVPR) Workshops.
- Wang et al. (2022) Liang Wang, Nan Yang, Xiaolong Huang, Binxing Jiao, Linjun Yang, Daxin Jiang, Rangan Majumder, and Furu Wei. 2022. Text Embeddings by Weakly-Supervised Contrastive Pre-training. arXiv:2212.03533 [cs.CL]
- Wiegreffe et al. (2022) Sarah Wiegreffe, Jack Hessel, Swabha Swayamdipta, Mark Riedl, and Yejin Choi. 2022. Reframing Human-AI Collaboration for Generating Free-Text Explanations. In Proceedings of the 2022 Conference of the North American Chapter of the Association for Computational Linguistics: Human Language Technologies, Marine Carpuat, Marie-Catherine de Marneffe, and Ivan Vladimir Meza Ruiz (Eds.). Association for Computational Linguistics, Seattle, United States, 632–658. https://doi.org/10.18653/v1/2022.naacl-main.47
- Zhang and Zhu (2018) Quan-shi Zhang and Song-Chun Zhu. 2018. Visual interpretability for deep learning: a survey. Frontiers of Information Technology & Electronic Engineering 19, 1 (2018), 27–39.
- Zhou et al. (2016) Bolei Zhou, Aditya Khosla, Agata Lapedriza, Aude Oliva, and Antonio Torralba. 2016. Learning Deep Features for Discriminative Localization. In Proceedings of the IEEE Conference on Computer Vision and Pattern Recognition (CVPR).