Extracting Lexical Features from Dialects via
Interpretable Dialect Classifiers
Abstract
Identifying linguistic differences between dialects of a language often requires expert knowledge and meticulous human analysis. This is largely due to the complexity and nuance involved in studying various dialects. ††* Work done at George Mason University. We present a novel approach to extract distinguishing lexical features of dialects by utilizing interpretable dialect classifiers, even in the absence of human experts. We explore both post-hoc and intrinsic approaches to interpretability, conduct experiments on Mandarin, Italian, and Low Saxon, and experimentally demonstrate that our method successfully identifies key language-specific lexical features that contribute to dialectal variations.111Data and code are available: https://github.com/ruoyuxie/interpretable_dialect_classifier
Extracting Lexical Features from Dialects via
Interpretable Dialect Classifiers
Roy Xie♣∗ Orevaoghene Ahia♠ Yulia Tsvetkov♠ Antonios Anastasopoulos ♣ Duke University ♠ Paul G. Allen School of Computer Science & Engineering, University of Washington Department of Computer Science, George Mason University ruoyu.xie@duke.edu {oahia, yuliats}@cs.washington.edu antonis@gmu.edu
1 Introduction
Dialects and closely related languages exhibit subtle but significant variations, reflecting regional, social, and cultural differences Chambers and Trudgill (1998). Identifying and distinguishing differences between these dialects is of great importance in linguistics, language preservation, and natural language processing (NLP) research (Salameh et al., 2018; Goswami et al., 2020). Traditionally, identifying the specific linguistic features that distinguish dialects of a language has relied on manual analysis and expert knowledge (Cotterell and Callison-Burch, 2014), as the differences between between these dialects could be subtle and hard to detect without linguistic expertise (Zaidan and Callison-Burch, 2011). This process is also time-consuming and is usually language-specific due to the peculiarities that different languages exhibit.
In this work, we focus on extracting word-level distinguishing and salient features in dialects, also called ‘shibboleths’ Prokić et al. (2012). Our contribution is an automated workflow that could potentially assist humans in their analysis of dialectal variations. To achieve this, we rely on strong neural classifiers of dialects (Aepli et al., 2023; Scherrer et al., 2023, 2022) and pair them with model interpretability techniques to extract these features.
We hypothesize that there are certain distinguishing features in dialects that the models learn during training, which enables them to make accurate predictions at test time. We utilize post-hoc (Simonyan et al., 2014; Ribeiro et al., 2016) and intrinsic (Alvarez-Melis and Jaakkola, 2018; Arik and Pfister, 2020) feature attribution explanation methods to extract these features from model interpretations, in the form of local explanations from dialect classifiers.
Our experiments focus on three language groups: Mandarin, Italian, Low Saxon, and their respective dialects. We demonstrate the effectiveness of our approach through human evaluation and extensive analysis, using known lexical features of some of the dialects we consider, and show the viability of using explanation methods to extract unique dialectal features.
2 Background and Related Work
The importance of interpreting model decisions has increasingly been recognized in recent years (Belinkov et al., 2020; Koh and Liang, 2017; Mosca et al., 2022; Rajagopal et al., 2021), primarily due to its role in deciphering the inner workings of modern black-box models. Two main approaches include: (i) post-hoc methods Lundberg and Lee (2017); Ribeiro et al. (2016); Jin et al. (2019) which provide insights into the predictions of pre-existing models based on model internals; (ii) intrinsic methods Rajagopal et al. (2021); Alvarez-Melis and Jaakkola (2018); Rigotti et al. (2021) where interpretability is an integral feature that is optimized concurrently with the model’s primary task during training. Dialect classification is also an active research area (Aepli et al., 2023; Scherrer et al., 2023, 2022; Jauhiainen et al., 2019).
While dialect classification requires an exploration beyond just lexical features, diving into other linguistic elements, such as grammatical and syntactical features, demands substantial expert knowledge about the specific dialect (Masmoudi et al., 2019). For instance, even basic tasks like identifying verbs and nouns within a dialect can be challenging, given that syntactic parsing is primarily efficient for well-resourced languages Hellwig et al. (2023); Hou et al. (2022). Given these complexities, we focus on extracting lexical differences between dialects, as they provide show potential in distinguishing dialectal variations. The idea of automatically extracting linguistic features is not new (Brill, 1991; Demszky et al., 2021). However, we focus on identifying these features through the lens of model explanations by using feature-attribution methods. To the best of our knowledge, this is the first study to undertake such an endeavor.
3 Method
We present a simple yet effective method to extract lexical differences that distinguish dialects using explanations obtain from interpretable dialect classifiers as shown in Figure 1.
3.1 Explanation Methods
We start with a dialect classifier trained to take an input sentence and predict its corresponding dialect label . Let be the final layer representation of the “[CLS]” token for input , which is the sentence representation typically used to make a prediction.
Post-hoc Approach
During inference, LOO estimates the attribution score of each token in input in relation to model’s prediction . To do so, is passed through ReLU, affine, and softmax layers to yield a probability distribution over outputs. For each feature , LOO calculates the change in probability when is removed from . Let denote input without feature and the final layer representation of the “[CLS]” token for . We term this the relevance score and expect that influential features/explanations in the input will have higher scores.
| (1) |
Intrinsic Approach
For our intrinsic approach using SelfExplain (Rajagopal et al., 2021), we augment the dialect classifier with a Local Interpretability Layer (LIL) during training. This layer quantifies the relevance of each feature in input to the final label distribution via activation difference (Shrikumar et al., 2017), and is trained jointly with the final classifier layer. Taking in Equation 1, the loss is the negative log probability, summed over all training instances:
where is the correct label for instance . To obtain the attribution score of each feature in input , we first estimate the output label distribution without by transforming the difference between and , where is the MLM representation of feature :
The relevance of each feature can be defined as the change in probability of the correct label when is included vs. excluded:
where higher signifies more relevant features to the prediction, serving as better explanations.
3.2 Interpretable Dialect Classifier
Our interpretable dialect classifier, built on top of transformer-based models, is designed to work with both post-hoc and intrinsic interpretable methods. For the scope of this work we focus on Leave-One-Out (LOO), a popular model-agnostic feature-attribution method, and SelfExplain (Rajagopal et al., 2021), an intrinsic interpretable method that learns to attribute text classification decisions to relevant parts in the input text. For the intrinsic approach, we incorporate the model encoder into the SelfExplain framework, exclusively extracting only local explanations. For the post-hoc approach, we train a separate classifier to calculate the LOO interpretations. The details of both explanation methods can be found in Appendix 3.1.
Mapping Explanations to Lexical Features
We extract explanations from the classifiers outlined above. Note, however, that these explanations are at the sentence level, but one ideally would need features that in general identify/describe one dialect in contrast to another at the language level, i.e., at the corpus level. To achieve this, we devise a corpus-level feature extraction method that takes sentence-level explanations as input and produces “global” features.222In this study, we focus on extracting distinguishing lexemes (words) through unigrams. Nonetheless, our approach can be readily adapted to phrase-level analysis using ngrams, though such an extension falls beyond the purview of this work.
Given a set of sentence-level explanations from a classifier, we first filter out explanations from incorrect predictions or are not unique to a specific language variety. Let represent the filtered set of explanations:
| (2) |
Next, we apply Term Frequency-Inverse Document Frequency (TF-IDF) to to extract the most salient global features. Let be the final set of extracted features. The TF-IDF score for a term in a document in a corpus is given by:
| (3) |
We can then define the feature extraction as:
| (4) |
4 Languages and Datasets
4.1 Languages
We discuss below each of the language continua, which have multiple dialects that vary distinctly across different regions.
Mandarin Dialects
Mandarin, also known as Standard Chinese or Putonghua, is part of the Sinitic language family and one of the most widely spoken languages worldwide. We focus on two variations of Mandarin: Mainland Mandarin (CN) and Taiwan Mandarin (TW). The two varieties are closely related and they share a core vocabulary, but there are variations in the usage of certain words and phrases. In writing, Mainland Mandarin also has adopted simplified Chinese characters, while Taiwan uses traditional characters.
Italian Varieties
Italian, a Romance language, consists of a diverse range of dialects across different regions of Italy. While these dialects have evolved from Latin and share many common words, they exhibit variations in phonetics, vocabulary, and grammar. For example, Sicilian, spoken in Sicily and the southern regions of Italy, presents distinct phonological features and a rich vocabulary influenced by Arabic and other languages, and as a result it has its own grammar, vocabulary, and pronunciation rules, to the point that it can be difficult for Italian speakers to understand. We note that a lot of the Italian vernaculars are categorized as distinct languages with their own ISO codes (e.g. Venetian, Neapolitan, Sicilian, to name a few). But nevertheless it is undeniable that all of them fall within the same branch of Italic languages and in practice for a diverse language continuum.
Low-Saxon Dialects
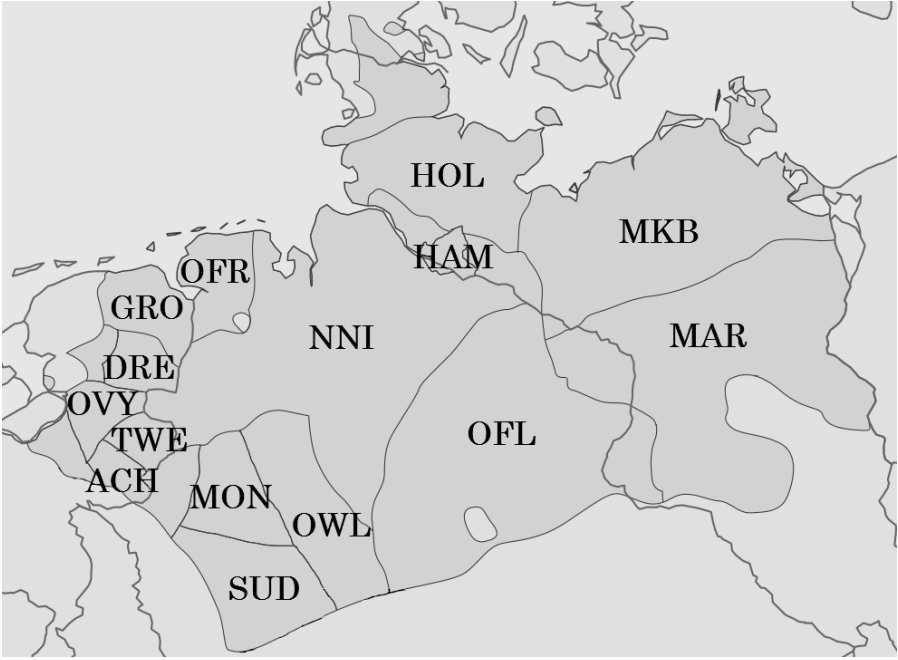
Low-Saxon is a West Germanic language that encompasses a range of dialects spoken in the northern regions of the Netherlands and Germany. There are multiple dialects that vary distinctly across different regions. For example, the dialects spoken in the Netherlands, such as Gronings and Twents, have distinct vowel sounds and consonant variations compared to the German dialects, such as Plattdeutsch.
4.2 Datasets
For Mandarin dialects, we use FRMT dataset Riley et al. (2022), which provides both sentence- and word-level translations of English Wikipedia text into Mainland and Taiwan Mandarin. For Italian dialects, we combine data from the Identification of Languages and Dialects of Italy (ITDI) shared task Aepli et al. (2022a) and Europarl v8 corpus Koehn (2005). ITDI provides 11 Italian dialects (Figure 2) obtained from crawling Wikipedia, and we use them to mix with the same amount of data from standard Italian in Europarl. For Low Saxon dialects, we use LSDC dataset Siewert et al. (2020), which consists of 16 West-Germanic Low Saxon dialects (Figure 3) from Germany and the Netherlands. We present the statistics for all datasets in Appendix D. To focus on extracting lexical features, we remove all punctuations and lowercase all (Latin) characters.
5 Experiments
In this section, we present multiple experiments and demonstrate that our method results in distinguishing and meaningful feature extraction. A total of four annotators are involved in the evaluation process. For most experiments, we focus on Mandarin (CN-TW) and Sicilian-Italian (SCN-IT).333All annotators are proficient in the annotated language pairs. Three annotators work on CN-TW, and one for SCN-IT, as it is difficult to find annotators who are proficient in multiple dialects.
5.1 Experimental Setup
We study three distinct language continua and their respective dialects: Mandarin, Italian, and Low-Saxon (Dutch and German). Our selection is largely influenced by cultural and typological diversity concerns, but also by the dearth of dialectal data for other languages. We use XLM-RoBERTa Conneau et al. (2020) as our base model. We maintain the hyperparameters and weights from the pre-training of the encoders and train models for 5 epochs with a batch size 16. All experiments are done on an NVIDIA A100 GPU.
5.2 TF-IDF Baseline
As a baseline, we use TF-IDF to evaluate how effectively it extracts meaningful lexical features from CN-TW languague pair (Table 1). We present annotators with the extracted lexical features using TF-IDF, asking them to determine whether these features are salient and unique to the language.444The annotators are given options to select if a feature is likely to belong to one, both, or neither of the dialects.
| Lang. unique (%) | CN | TW | Both | None |
|---|---|---|---|---|
| CN | 70.0 | 0.0 | 30.0 | 0.0 |
| TW | 0.0 | 60.0 | 40.0 | 0.0 |
5.3 Explanation Evaluation
We hypothesize that good explanations from highly performing dialect classifiers should be subsets of the input that represent distinctive features of the respective dialect in which the input is written. We first evaluate the general robustness of explanations using Sufficiency (Jacovi et al., 2018; Yu et al., 2019) (Do explanations adequately represent the model predictions?) and Plausibility Ehsan et al. (2019) (Do explanations seem credible and comprehensible to humans?)
Sufficiency
We train a separate classifier to perform the dialect classification task with only the explanations as input, and the predicted labels as target. Higher accuracy indicates that the explanations are more reflective of the model predictions. We train these models with the top ranking explanations of each sentence as input, and present the results in Table 2 for both explanation methods. Both methods achieve over 90% accuracy when k 3, which sets a reliable baseline for further evaluation. CN-TW and SCN-IT have an average sentence length of 18.8 and 16.2, respectively, which implies that our sufficiency scores are trustworthy, as we obtain them with less than 20-30% of an average sentence.
| Methods | Dialects | |||
|---|---|---|---|---|
| SelfExp | CN-TW | 76.5 | 96.7 | 97.8 |
| SCN-IT | 87.8 | 95.8 | 97.9 | |
| LOO | CN-TW | 81.3 | 93.2 | 97.2 |
| SCN-IT | 87.4 | 95.4 | 96.6 |
Plausibility
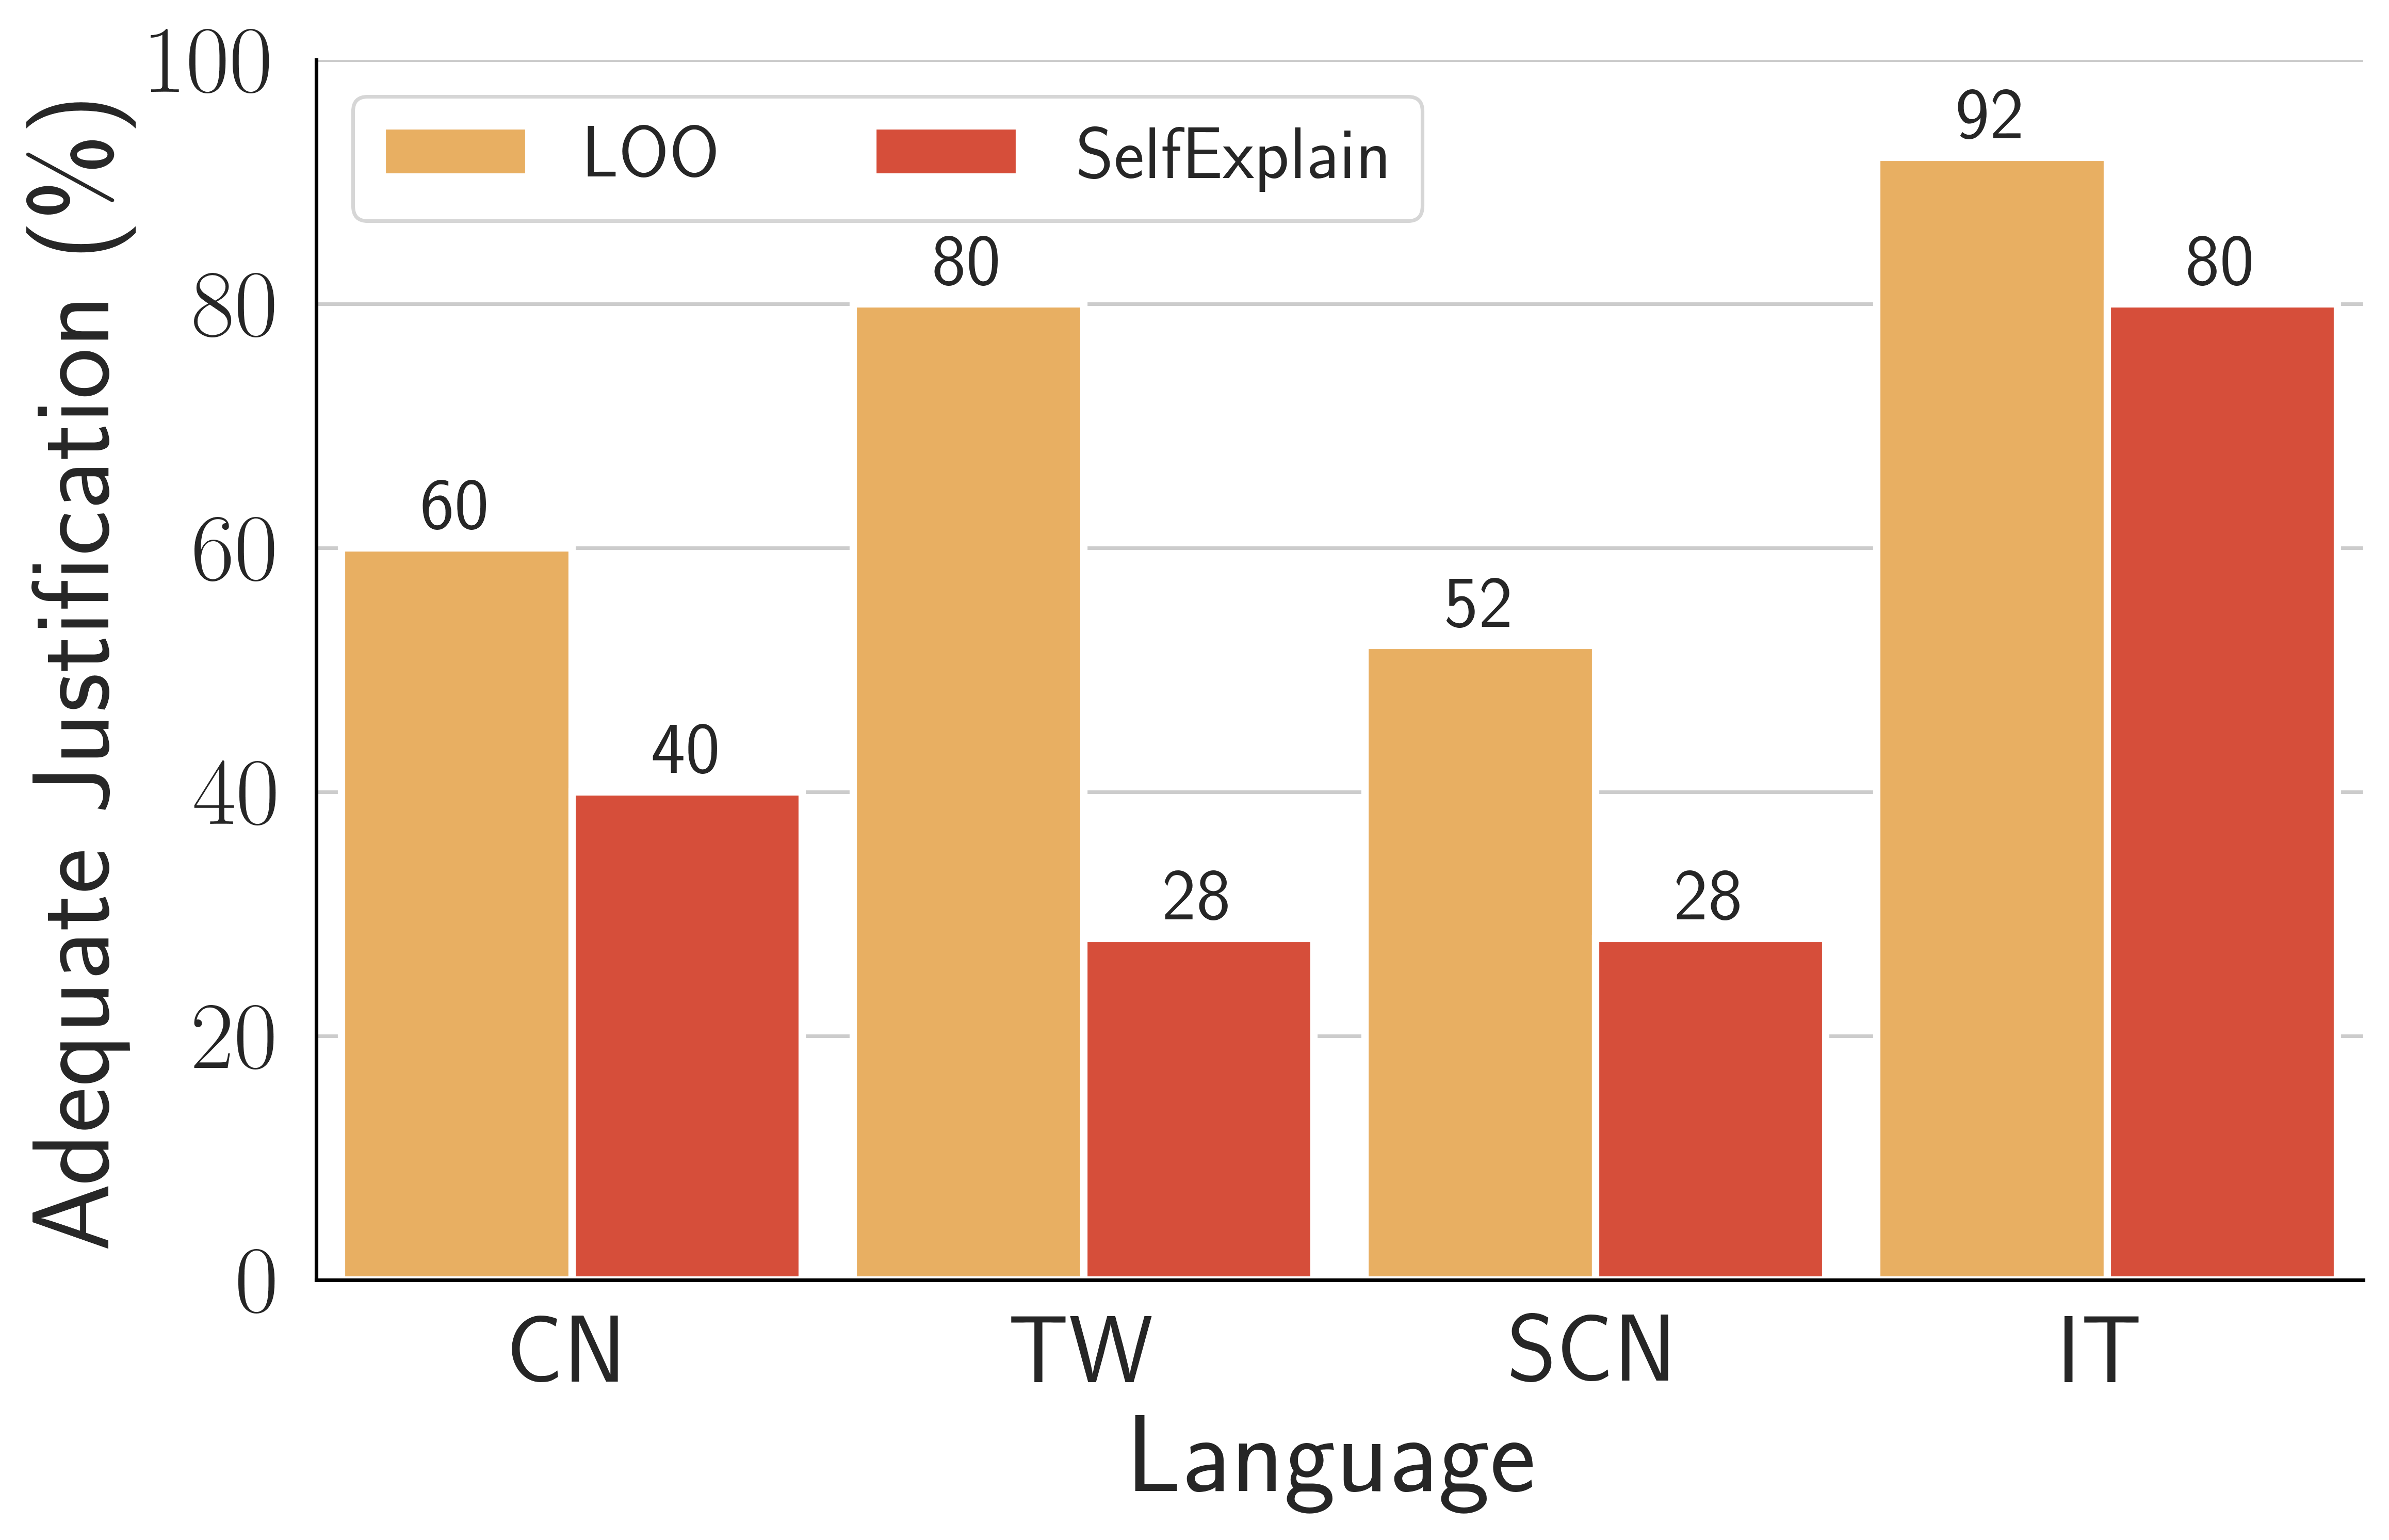
We give each annotator 25 sentences with the model’s predictions and the top three explanations from LOO and SelfExplain. We randomly shuffle and anonymize the explanation methods and ask annotators (i) Should the model classify a given sentence in certain dialects based on the explanations? (ii) If the explanations do not adequately justify the model’s prediction, what should the model’s prediction be based on? The annotators are given options to select one, both, or neither explanation method. We present the percentage of instances that are adequately justified according to the annotators on Figure 4. Overall, LOO achieves a higher percentage of perceived adequate justification, compared to SelfExplain. Therefore, we will use LOO as the main explanation method for the rest of the studies in this work.
5.4 Can we extract lexical features by interpreting dialect classifiers?
Automatic Evaluation
As a sanity check, we propose a simple automatic evaluation metric, pick-up rate (PR), to evaluate the ability of explanation methods on capturing language-unique features. Based on comparative dialectology and other linguistic literature, we identify a small set of distinctive features for the languages we work with.555After reviewing the literature, we identified features that can be easily measured, which allows us to potentially show that the features that humans described align with the outputs generated by the model. We define PR as the likelihood of language-unique features being captured in the input sample. The higher the PR is, the better the explanation method aligns with (some) ground truth features. Given as the number of times that a language-unique feature is used as an explanation and as the number of times that appears in a corpus , .
We evaluated PR on a Low Saxon dialect, Eastphalian (OFL), versus non-OFL dialects based on OFL distinguishing first and second singular pronouns (‘mik/dik’) from non-OFL (‘mi/di’) Siewert et al. (2020). For both explanation methods, these language-unique lexical features tend to appear only in their corresponding classes with reasonable PRs. We conducted similar experiments in Appendix A.1 on another Low Saxon dialect and another language pair, CN-TW, in Appendix A.2. All experiments showed similar patterns, indicating that language-unique lexical features can indeed be retrieved from the explanations. Further discussion about PR can be found in Appendix B.1 and B.2.
| OFL | Non-OFL | |||
| Count | mik | dik | mi | di |
| OFL Exp. | 17 | 9 | 0 | 0 |
| Non-OFL Exp. | 1 | 1 | 156 | 57 |
| Text | 34 | 19 | 577 | 155 |
| OFL PR (%) | 50.0 | 47.4 | 0.0 | 0.0 |
| Non-OFL PR (%) | 2.9 | 5.3 | 27.0 | 38.0 |
Human Evaluation
Simliar to §5.2, we select the top 20 features extracted using our extraction method as described in §3.2. The inter-annotator agreement statistics can be found on Appendix F. We calculate the percentage of choices made in the each option relative to the total choices the and present the results in Table 4.
| Option(%) | CN | TW | Option(%) | SCN | IT |
|---|---|---|---|---|---|
| CN | 88.9 | 10.5 | SCN | 45.0 | 0.0 |
| TW | 0.0 | 89.5 | IT | 15.0 | 63.2 |
| Both | 11.1 | 0.0 | Both | 40.0 | 36.8 |
| None | 0.0 | 0.0 | None | 0.0 | 0.0 |
We observe that for CN-TW, our method captures 88.9% and 89.5% of CN and TW features, respectively. Compare to the baseline in §5.2 (70% and 60%), our method is 27% and 49% higher for both languages. The numbers for SCN and IT are slightly lower (45% for SCN and 63.2% for IT) but it is important to note that the two languages do share a large percentage of their vocabulary, so we believe that these scores are indeed encouraging. The reason is that the method is confirmed to be rather precise: None of the suggested features for Italian would be appropriate for Sicilian, and only 15% of the suggested SCN features would not be appropriate for it.
5.5 Classification Accuracy
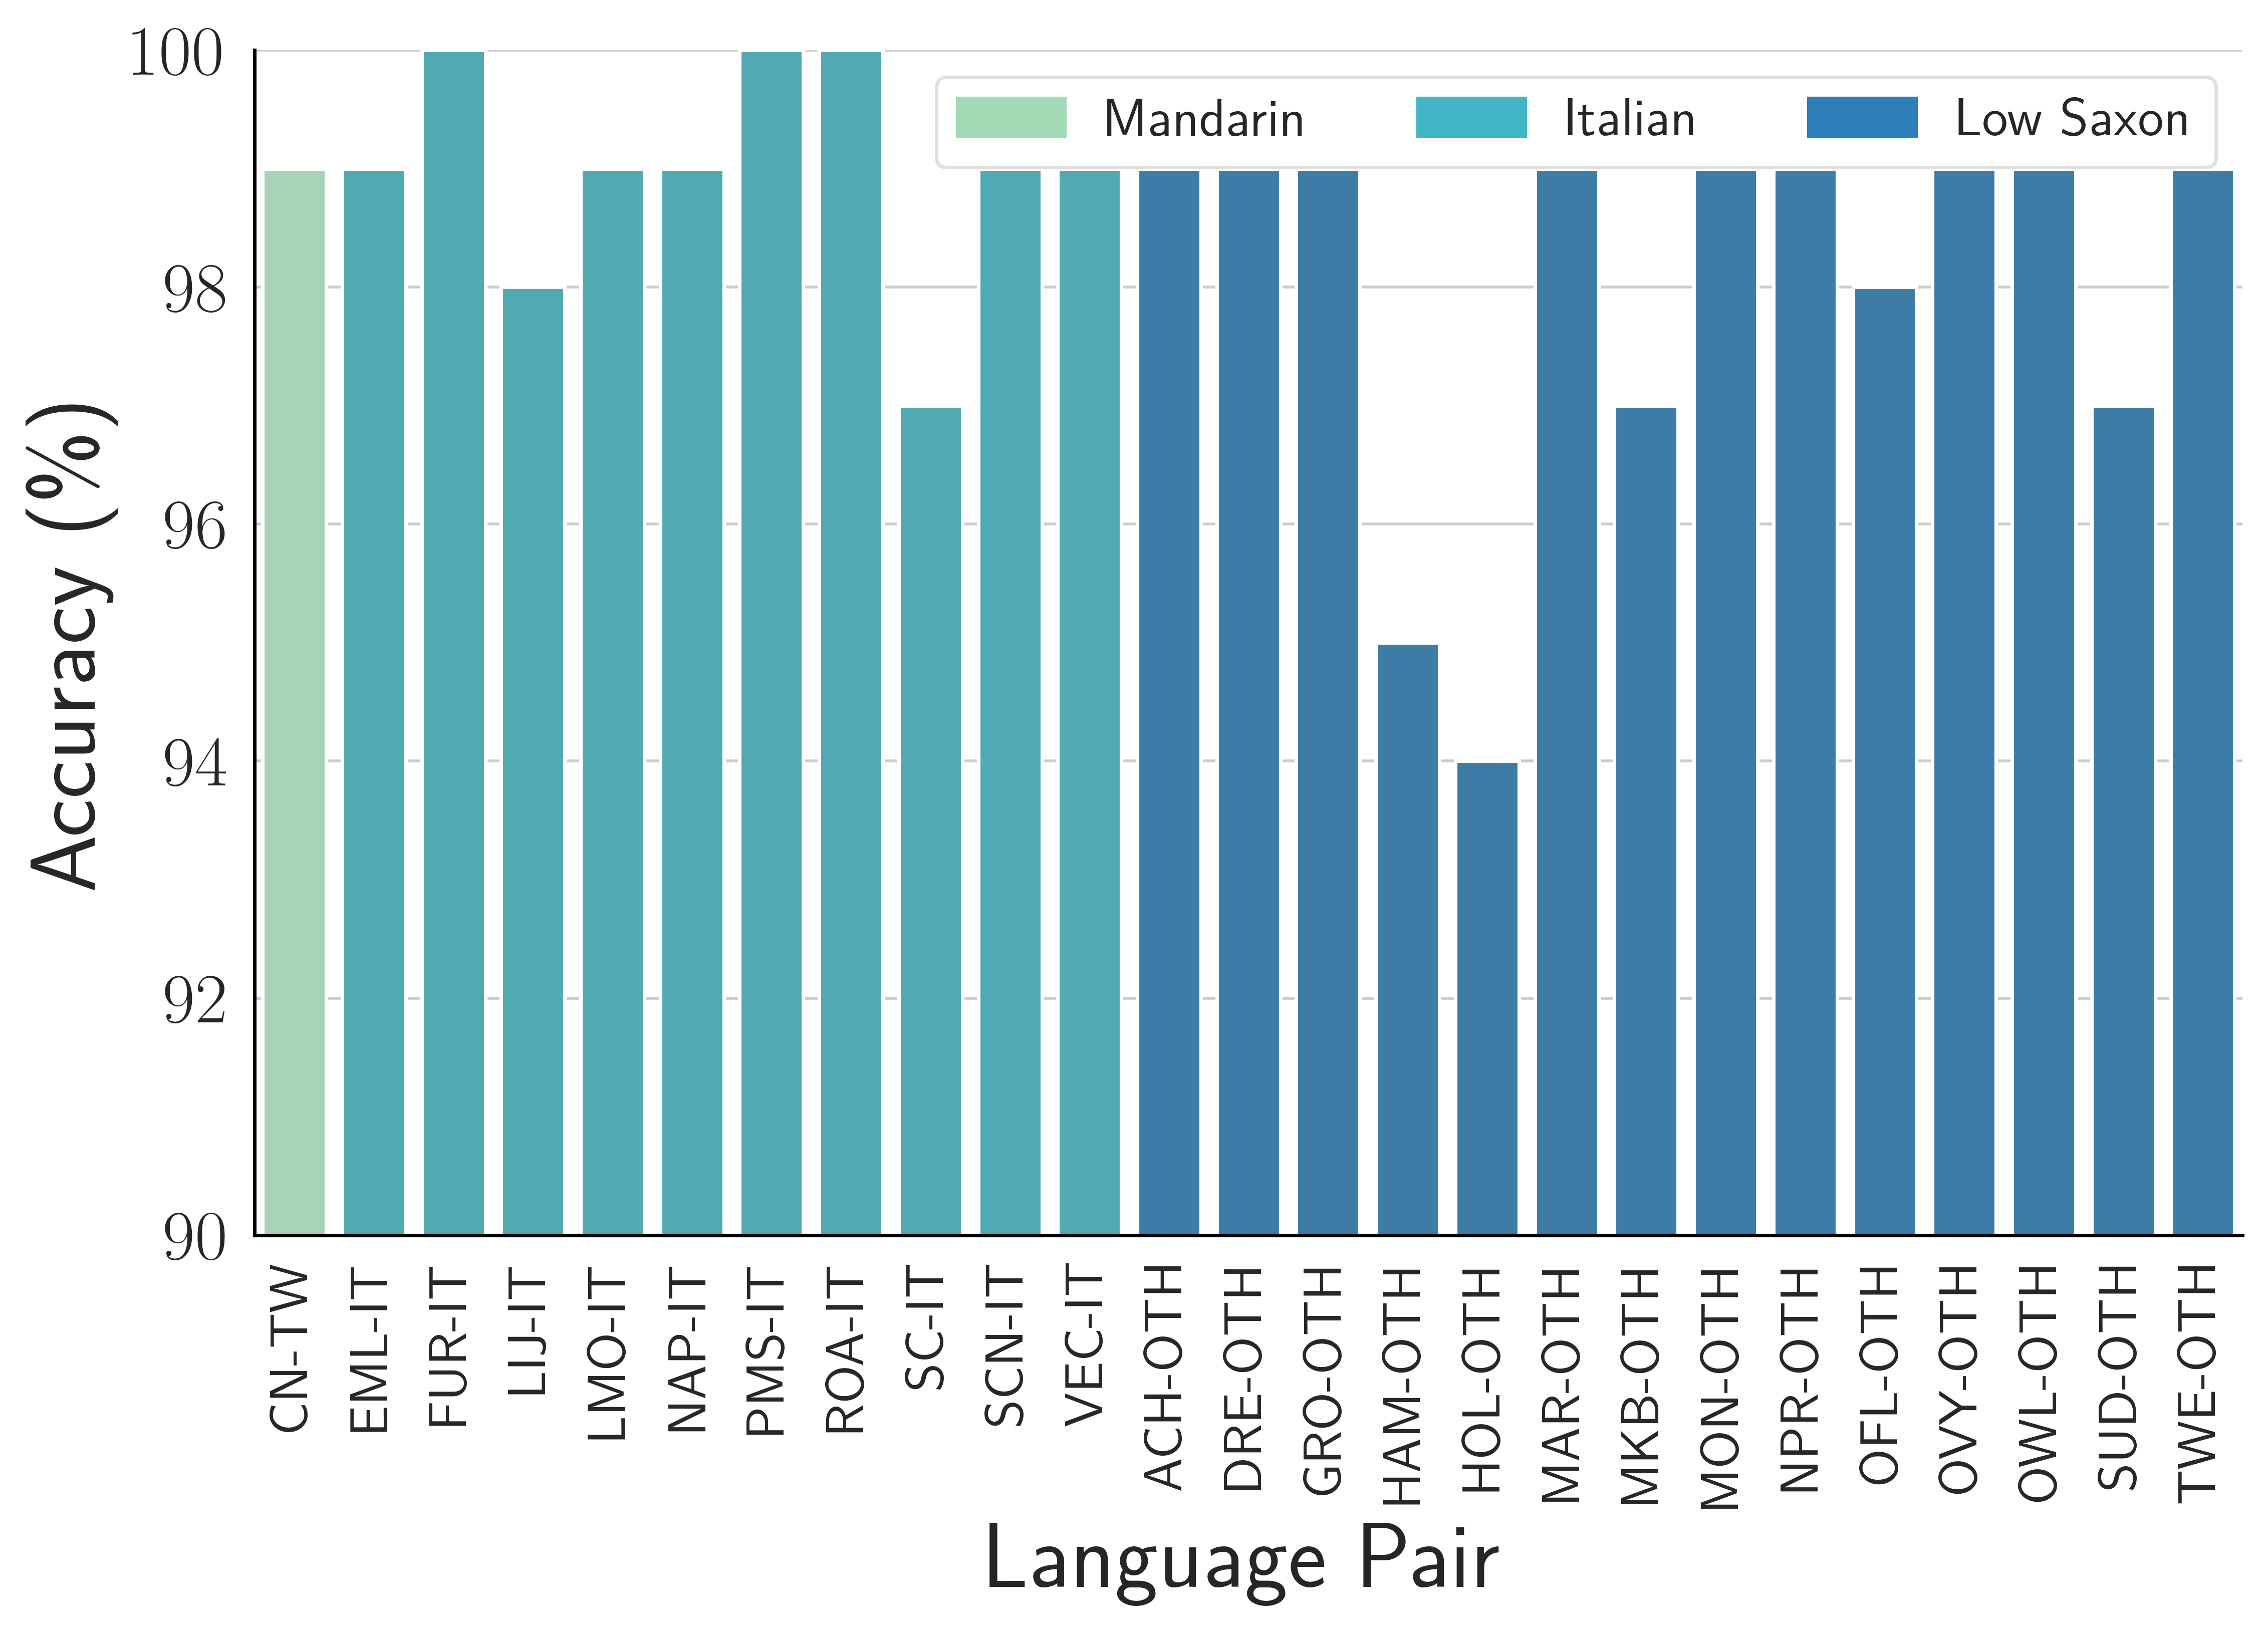
While our primary goal is to extract lexical features, ensuring high classification accuracy is also crucial as incorrect predictions could undermine explanations. We present the classification results for all dialects on Appendix C and observe high accuracy across all language pairs, with an average accuracy of 98.7% for a total of 21 language pairs. This high accuracy ensures that the features extracted by the model are supported by reliable predictions, thereby enhancing the value and reliability of the explanations it provides.
6 Conclusion
In this work, we introduce a novel approach for capturing language-unique lexical features from dialects through interpretable dialect classifiers. We utilize both post-hoc and intrinsic explanation methods and experiment on three language groups - Mandarin, Italian, and Low Saxon, and their respective dialects, conducting extensive evaluation and analysis to showcase the effectiveness of our method. In the future, we plan to broaden this approach to address additional linguistic aspect beyond the lexical level (Appendix B.3).
More broadly, our paper takes a first step to assess how interpretability techniques can be used to unearth lexical and, potentially, other linguistic features. By doing so, we hope to provide a framework that future studies can build upon.
7 Ethics Statement
As most languages worldwide are under-resourced (Joshi et al., 2020), we envision a future where researchers, regardless of their expertise in a particular language or dialect, can leverage our method to gain insights of dialectal variations and facilitate the development of language technologies in under-represented languages. While our primary intention is to promote dialectal inclusivity, we realize that, like any tool, it could be misused in ways that might lead to division or stereotyping. As dialects can be associated with specific ethnic groups or nationalities, the technology might be misused for profiling purposes. It might introduce misleading correlations and negatively impact certain groups.
8 Limitations
A limitation to our work is that we are working with data that we a priori know to belong to a certain language variety, to provide a proof-of-concept. If one was applying this work in the real world, e.g. on data collected from multiple locations within a language’s geographical area, we could substitute our classification scheme to now predict the location of the data collection. We leave such a study for the future.
While our emphasis is on these lexical aspects, it is crucial to acknowledge the broad spectrum of other linguistic elements that contribute to the richness and complexity of dialects, such as syntactic, phonetic, and semantic features. While our method demonstrates excellent performance in lexical feature extraction, it may not yet adeptly identify and analyze these additional facets of linguistic variation. In the future, we plan to extend our method to integrate modules that will focus specifically on these diverse linguistic features, making it a more comprehensive tool for dialect analysis.
9 Acknowledgements
The authors are thankful for the anonymous reviewers for their feedback. This work was generously supported by NSF Award IIS-2125466 as well as through a GMU OSCAR award for undergraduate research. This research is supported in part by the Office of the Director of National Intelligence (ODNI), Intelligence Advanced Research Projects Activity (IARPA), via the HIATUS Program contract #2022-22072200004. This material is also funded by the DARPA Grant under Contract No. HR001120C0124. We also gratefully acknowledge support from NSF CAREER Grant No. IIS2142739, NSF Grants No. IIS2125201, IIS2203097, and the Alfred P. Sloan Foundation Fellowship. The views and conclusions contained herein are those of the authors and should not be interpreted as necessarily representing the official policies, either expressed or implied, of ODNI, IARPA, or the U.S. Government. The U.S. Government is authorized to reproduce and distribute reprints for governmental purposes notwithstanding any copyright annotation therein.
References
- Aepli et al. (2022a) Noëmi Aepli, Antonios Anastasopoulos, Adrian Chifu, William Domingues, Fahim Faisal, Mihaela Găman, Radu Tudor Ionescu, and Yves Scherrer. 2022a. Findings of the VarDial evaluation campaign 2022. In Proceedings of the Ninth Workshop on NLP for Similar Languages, Varieties and Dialects, Gyeongju, Republic of Korea. International Committee on Computational Linguistics (ICCL).
- Aepli et al. (2022b) Noëmi Aepli, Antonios Anastasopoulos, Adrian-Gabriel Chifu, William Domingues, Fahim Faisal, Mihaela Gaman, Radu Tudor Ionescu, and Yves Scherrer. 2022b. Findings of the VarDial evaluation campaign 2022. In Proceedings of the Ninth Workshop on NLP for Similar Languages, Varieties and Dialects, pages 1–13, Gyeongju, Republic of Korea. Association for Computational Linguistics.
- Aepli et al. (2023) Noëmi Aepli, Çağrı Çöltekin, Rob Van Der Goot, Tommi Jauhiainen, Mourhaf Kazzaz, Nikola Ljubešić, Kai North, Barbara Plank, Yves Scherrer, and Marcos Zampieri. 2023. Findings of the VarDial evaluation campaign 2023. In Tenth Workshop on NLP for Similar Languages, Varieties and Dialects (VarDial 2023), pages 251–261, Dubrovnik, Croatia. Association for Computational Linguistics.
- Alvarez-Melis and Jaakkola (2018) David Alvarez-Melis and Tommi S. Jaakkola. 2018. Towards robust interpretability with self-explaining neural networks. In Proceedings of the 32nd International Conference on Neural Information Processing Systems, NIPS’18, page 7786–7795, Red Hook, NY, USA. Curran Associates Inc.
- Arik and Pfister (2020) Sercan Ömer Arik and Tomas Pfister. 2020. Protoattend: Attention-based prototypical learning. J. Mach. Learn. Res., 21:210:1–210:35.
- Belinkov et al. (2020) Yonatan Belinkov, Sebastian Gehrmann, and Ellie Pavlick. 2020. Interpretability and analysis in neural NLP. In Proceedings of the 58th Annual Meeting of the Association for Computational Linguistics: Tutorial Abstracts, pages 1–5, Online. Association for Computational Linguistics.
- Brill (1991) Eric Brill. 1991. Discovering the lexical features of a language. In 29th Annual Meeting of the Association for Computational Linguistics, pages 339–340.
- Chambers and Trudgill (1998) Jack K Chambers and Peter Trudgill. 1998. Dialectology. Cambridge University Press.
- Conneau et al. (2020) Alexis Conneau, Kartikay Khandelwal, Naman Goyal, Vishrav Chaudhary, Guillaume Wenzek, Francisco Guzmán, Edouard Grave, Myle Ott, Luke Zettlemoyer, and Veselin Stoyanov. 2020. Unsupervised cross-lingual representation learning at scale. In Proceedings of the 58th Annual Meeting of the Association for Computational Linguistics, pages 8440–8451, Online. Association for Computational Linguistics.
- Cotterell and Callison-Burch (2014) Ryan Cotterell and Chris Callison-Burch. 2014. A multi-dialect, multi-genre corpus of informal written Arabic. In Proceedings of the Ninth International Conference on Language Resources and Evaluation (LREC’14), pages 241–245, Reykjavik, Iceland. European Language Resources Association (ELRA).
- Demszky et al. (2021) Dorottya Demszky, Devyani Sharma, Jonathan Clark, Vinodkumar Prabhakaran, and Jacob Eisenstein. 2021. Learning to recognize dialect features. In Proceedings of the 2021 Conference of the North American Chapter of the Association for Computational Linguistics: Human Language Technologies, pages 2315–2338, Online. Association for Computational Linguistics.
- Ehsan et al. (2019) Upol Ehsan, Pradyumna Tambwekar, Larry Chan, Brent Harrison, and Mark O Riedl. 2019. Automated rationale generation: a technique for explainable ai and its effects on human perceptions. In Proceedings of the 24th International Conference on Intelligent User Interfaces, pages 263–274.
- Goswami et al. (2020) Koustava Goswami, Rajdeep Sarkar, Bharathi Raja Chakravarthi, Theodorus Fransen, and John P. McCrae. 2020. Unsupervised deep language and dialect identification for short texts. In Proceedings of the 28th International Conference on Computational Linguistics, pages 1606–1617, Barcelona, Spain (Online). International Committee on Computational Linguistics.
- Hellwig et al. (2023) Oliver Hellwig, Sebastian Nehrdich, and Sven Sellmer. 2023. Data-driven dependency parsing of vedic sanskrit. Language Resources and Evaluation, pages 1–34.
- Hou et al. (2022) Shengyuan Hou, Jushi Kai, Haotian Xue, Bingyu Zhu, Bo Yuan, Longtao Huang, Xinbing Wang, and Zhouhan Lin. 2022. Syntax-guided localized self-attention by constituency syntactic distance. arXiv preprint arXiv:2210.11759.
- Jacovi et al. (2018) Alon Jacovi, Oren Sar Shalom, and Yoav Goldberg. 2018. Understanding convolutional neural networks for text classification. In Proceedings of the 2018 EMNLP Workshop BlackboxNLP: Analyzing and Interpreting Neural Networks for NLP, pages 56–65, Brussels, Belgium. Association for Computational Linguistics.
- Jauhiainen et al. (2019) Tommi Jauhiainen, Marco Lui, Marcos Zampieri, Timothy Baldwin, and Krister Lindén. 2019. Automatic language identification in texts: A survey. Journal of Artificial Intelligence Research, 65:675–782.
- Jin et al. (2019) Xisen Jin, Junyi Du, Zhongyu Wei, Xiangyang Xue, and Xiang Ren. 2019. Towards hierarchical importance attribution: Explaining compositional semantics for neural sequence models. CoRR, abs/1911.06194.
- Joshi et al. (2020) Pratik Joshi, Sebastin Santy, Amar Budhiraja, Kalika Bali, and Monojit Choudhury. 2020. The state and fate of linguistic diversity and inclusion in the NLP world. In Proceedings of the 58th Annual Meeting of the Association for Computational Linguistics, pages 6282–6293, Online. Association for Computational Linguistics.
- Koehn (2005) Philipp Koehn. 2005. Europarl: A parallel corpus for statistical machine translation. In Proceedings of Machine Translation Summit X: Papers, pages 79–86, Phuket, Thailand.
- Koh and Liang (2017) Pang Wei Koh and Percy Liang. 2017. Understanding black-box predictions via influence functions. In Proceedings of the 34th International Conference on Machine Learning, ICML 2017, Sydney, NSW, Australia, 6-11 August 2017, volume 70 of Proceedings of Machine Learning Research, pages 1885–1894. PMLR.
- Lundberg and Lee (2017) Scott M. Lundberg and Su-In Lee. 2017. A unified approach to interpreting model predictions. In Advances in Neural Information Processing Systems 30: Annual Conference on Neural Information Processing Systems 2017, December 4-9, 2017, Long Beach, CA, USA, pages 4765–4774.
- Masmoudi et al. (2019) Abir Masmoudi, Salima Mdhaffar, Rahma Sellami, and Lamia Hadrich Belguith. 2019. Automatic diacritics restoration for tunisian dialect. ACM Trans. Asian Low-Resour. Lang. Inf. Process., 18(3).
- Mosca et al. (2022) Edoardo Mosca, Ferenc Szigeti, Stella Tragianni, Daniel Gallagher, and Georg Groh. 2022. SHAP-based explanation methods: A review for NLP interpretability. In Proceedings of the 29th International Conference on Computational Linguistics, pages 4593–4603, Gyeongju, Republic of Korea. International Committee on Computational Linguistics.
- Prokić et al. (2012) Jelena Prokić, Çağrı Çöltekin, and John Nerbonne. 2012. Detecting shibboleths. In Proceedings of the EACL 2012 Joint Workshop of LINGVIS & UNCLH, pages 72–80.
- Rajagopal et al. (2021) Dheeraj Rajagopal, Vidhisha Balachandran, Eduard H Hovy, and Yulia Tsvetkov. 2021. SELFEXPLAIN: A self-explaining architecture for neural text classifiers. In Proceedings of the 2021 Conference on Empirical Methods in Natural Language Processing, pages 836–850, Online and Punta Cana, Dominican Republic. Association for Computational Linguistics.
- Ribeiro et al. (2016) Marco Túlio Ribeiro, Sameer Singh, and Carlos Guestrin. 2016. "why should I trust you?": Explaining the predictions of any classifier. CoRR, abs/1602.04938.
- Rigotti et al. (2021) Mattia Rigotti, Christoph Miksovic, Ioana Giurgiu, Thomas Gschwind, and Paolo Scotton. 2021. Attention-based interpretability with concept transformers. In International Conference on Learning Representations.
- Riley et al. (2022) Parker Riley, Timothy Dozat, Jan A. Botha, Xavier Garcia, Dan Garrette, Jason Riesa, Orhan Firat, and Noah Constant. 2022. FRMT: A benchmark for few-shot region-aware machine translation. CoRR, abs/2210.00193.
- Salameh et al. (2018) Mohammad Salameh, Houda Bouamor, and Nizar Habash. 2018. Fine-grained Arabic dialect identification. In Proceedings of the 27th International Conference on Computational Linguistics, pages 1332–1344, Santa Fe, New Mexico, USA. Association for Computational Linguistics.
- Scherrer et al. (2022) Yves Scherrer, Tommi Jauhiainen, Nikola Ljubešić, Preslav Nakov, Jörg Tiedemann, and Marcos Zampieri. 2022. Proceedings of the ninth workshop on nlp for similar languages, varieties and dialects. In Proceedings of the Ninth Workshop on NLP for Similar Languages, Varieties and Dialects.
- Scherrer et al. (2023) Yves Scherrer, Tommi Jauhiainen, Nikola Ljubešić, Preslav Nakov, Jörg Tiedemann, and Marcos Zampieri. 2023. Tenth workshop on nlp for similar languages, varieties and dialects (vardial 2023). In Tenth Workshop on NLP for Similar Languages, Varieties and Dialects (VarDial 2023).
- Shrikumar et al. (2017) Avanti Shrikumar, Peyton Greenside, and Anshul Kundaje. 2017. Learning important features through propagating activation differences. In Proceedings of the 34th International Conference on Machine Learning - Volume 70, ICML’17, page 3145–3153. JMLR.org.
- Siewert et al. (2020) Janine Siewert, Yves Scherrer, Martijn Wieling, and Jörg Tiedemann. 2020. LSDC - a comprehensive dataset for low Saxon dialect classification. In Proceedings of the 7th Workshop on NLP for Similar Languages, Varieties and Dialects, pages 25–35, Barcelona, Spain (Online). International Committee on Computational Linguistics (ICCL).
- Simonyan et al. (2014) Karen Simonyan, Andrea Vedaldi, and Andrew Zisserman. 2014. Deep inside convolutional networks: Visualising image classification models and saliency maps. CoRR, abs/1312.6034.
- Yu et al. (2019) Mo Yu, Shiyu Chang, Yang Zhang, and Tommi Jaakkola. 2019. Rethinking cooperative rationalization: Introspective extraction and complement control. In Proceedings of the 2019 Conference on Empirical Methods in Natural Language Processing and the 9th International Joint Conference on Natural Language Processing (EMNLP-IJCNLP), pages 4094–4103, Hong Kong, China. Association for Computational Linguistics.
- Zaidan and Callison-Burch (2011) Omar F. Zaidan and Chris Callison-Burch. 2011. The Arabic online commentary dataset: an annotated dataset of informal Arabic with high dialectal content. In Proceedings of the 49th Annual Meeting of the Association for Computational Linguistics: Human Language Technologies, pages 37–41, Portland, Oregon, USA. Association for Computational Linguistics.
Appendix A Additional Results
A.1 DE vs NL
| DE Feature | NL Feature | |||
| Count | Huus | för | hoes | veur |
| DE Exp. | 17 | 42 | 0 | 0 |
| NL Exp. | 0 | 0 | 0 | 23 |
| Text | 42 | 175 | 0 | 63 |
| DE PR (%) | 40.5 | 24 | 0 | 0 |
| NL PR (%) | 0 | 0 | 0 | 36.5 |
| DE Feature | NL Feature | |||
| Count | Huus | för | hoes | veur |
| DE Exp. | 101 | 388 | 3 | 0 |
| NL Exp. | 2 | 0 | 0 | 182 |
| Text | 327 | 1492 | 5 | 559 |
| DE PR (%) | 30.1 | 26 | 6 | 0 |
| NL PR (%) | 0.6 | 0 | 0 | 33 |
A.2 PR on CN-TW
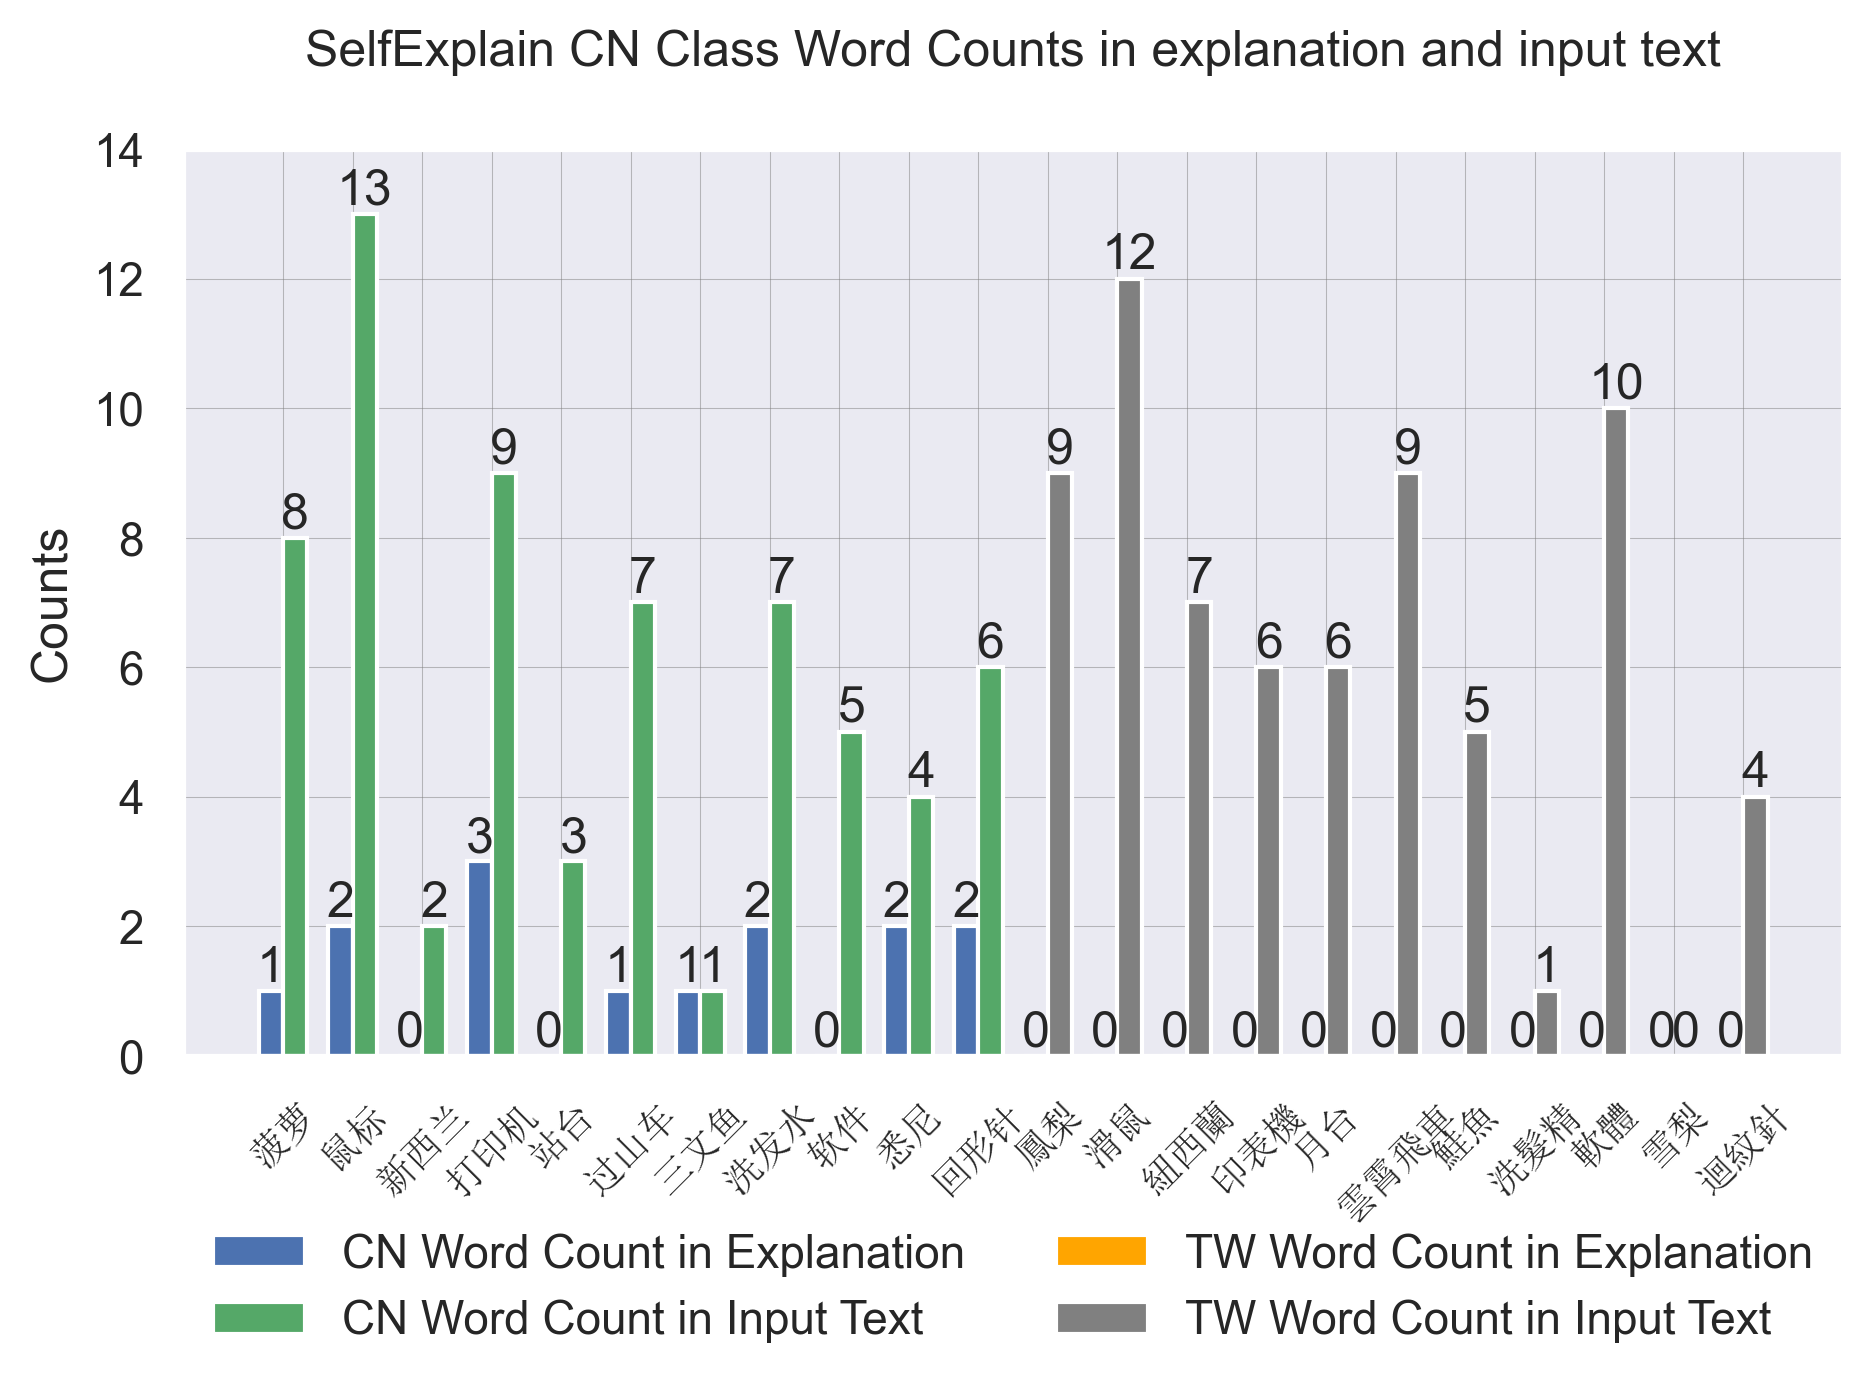
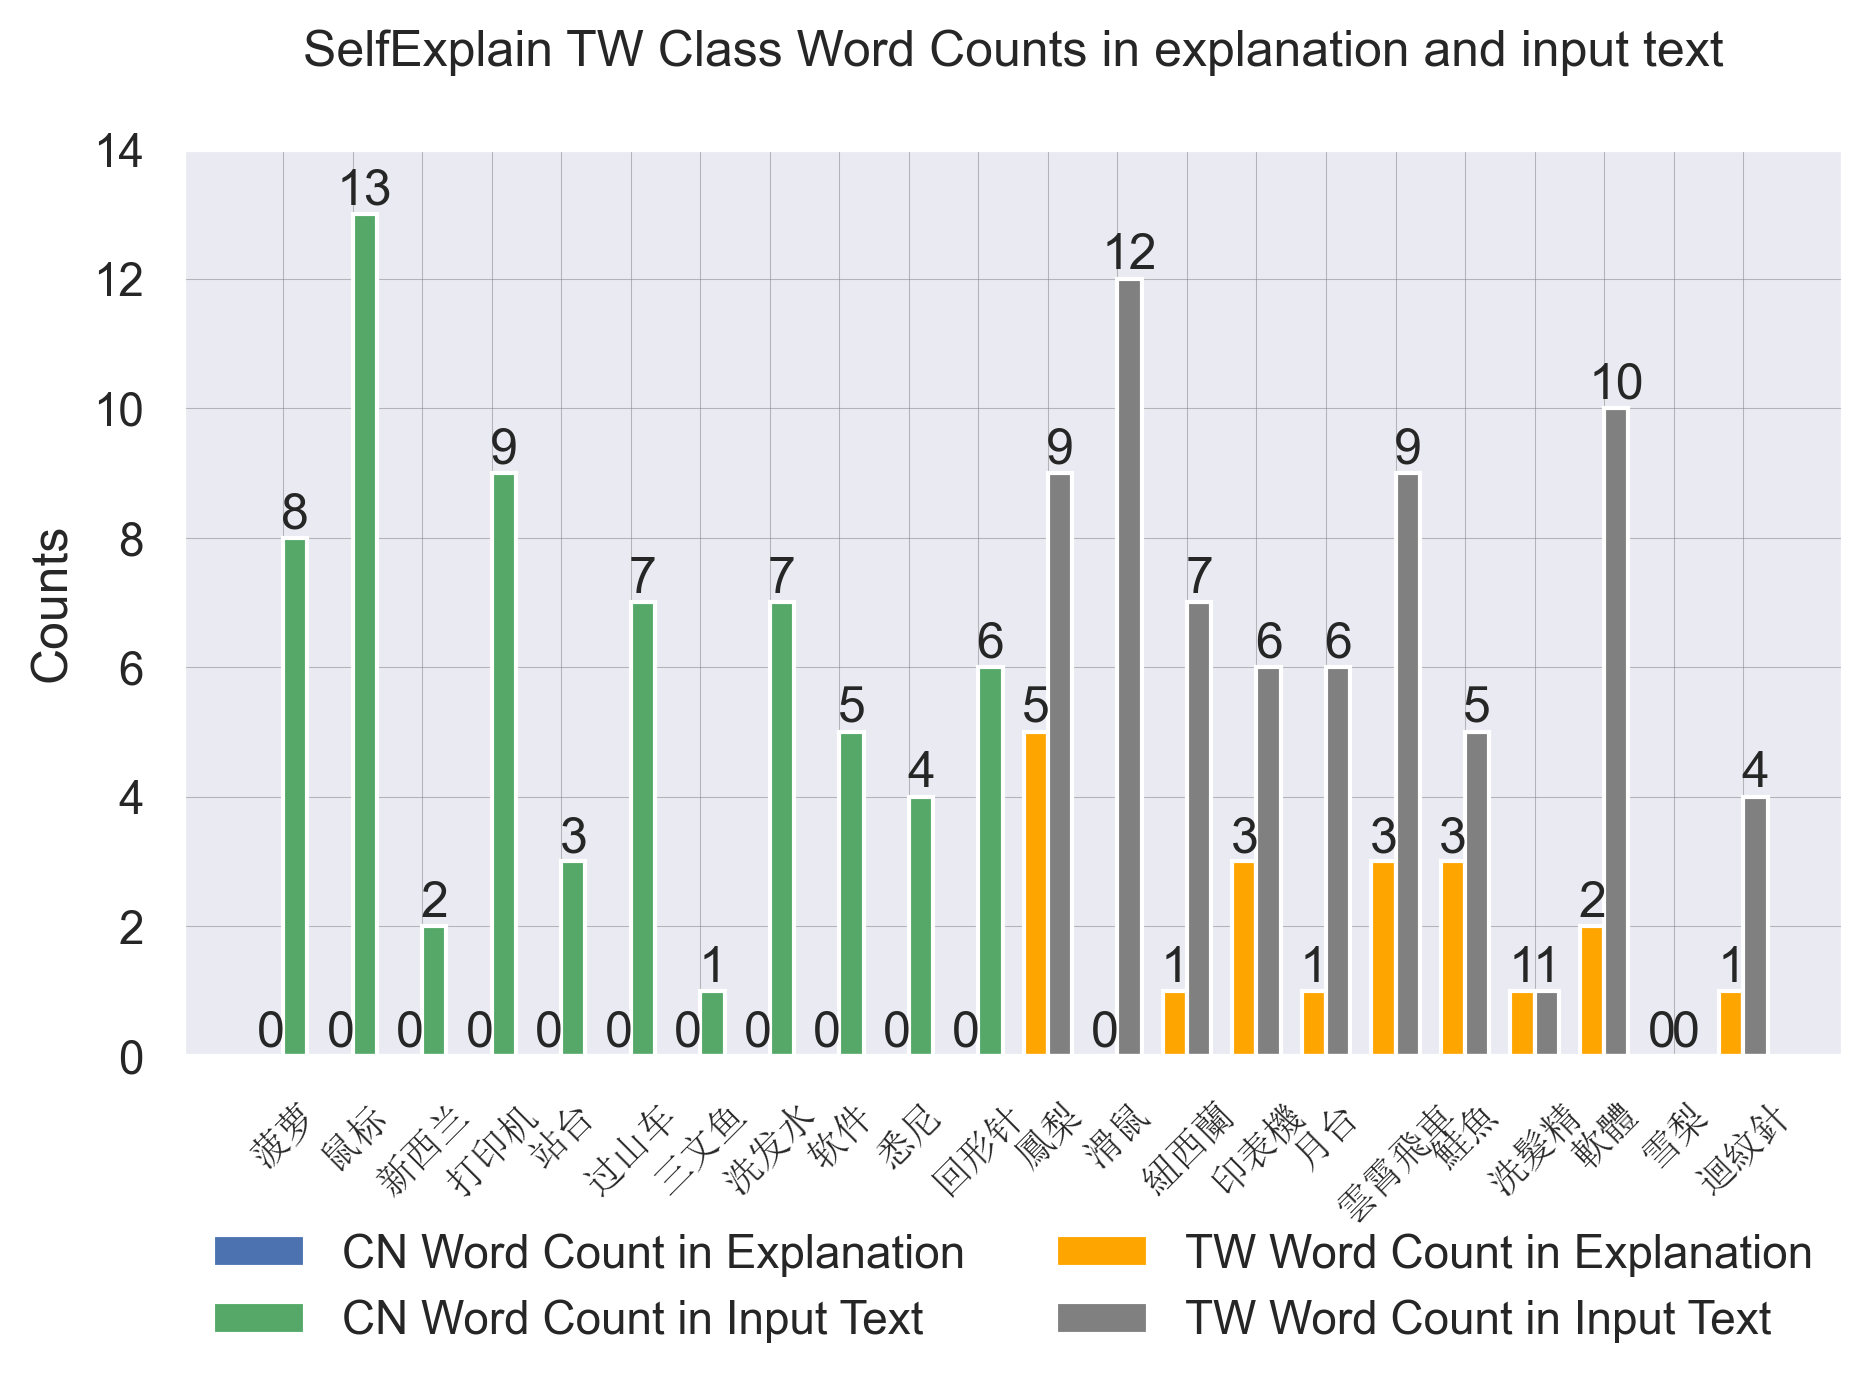
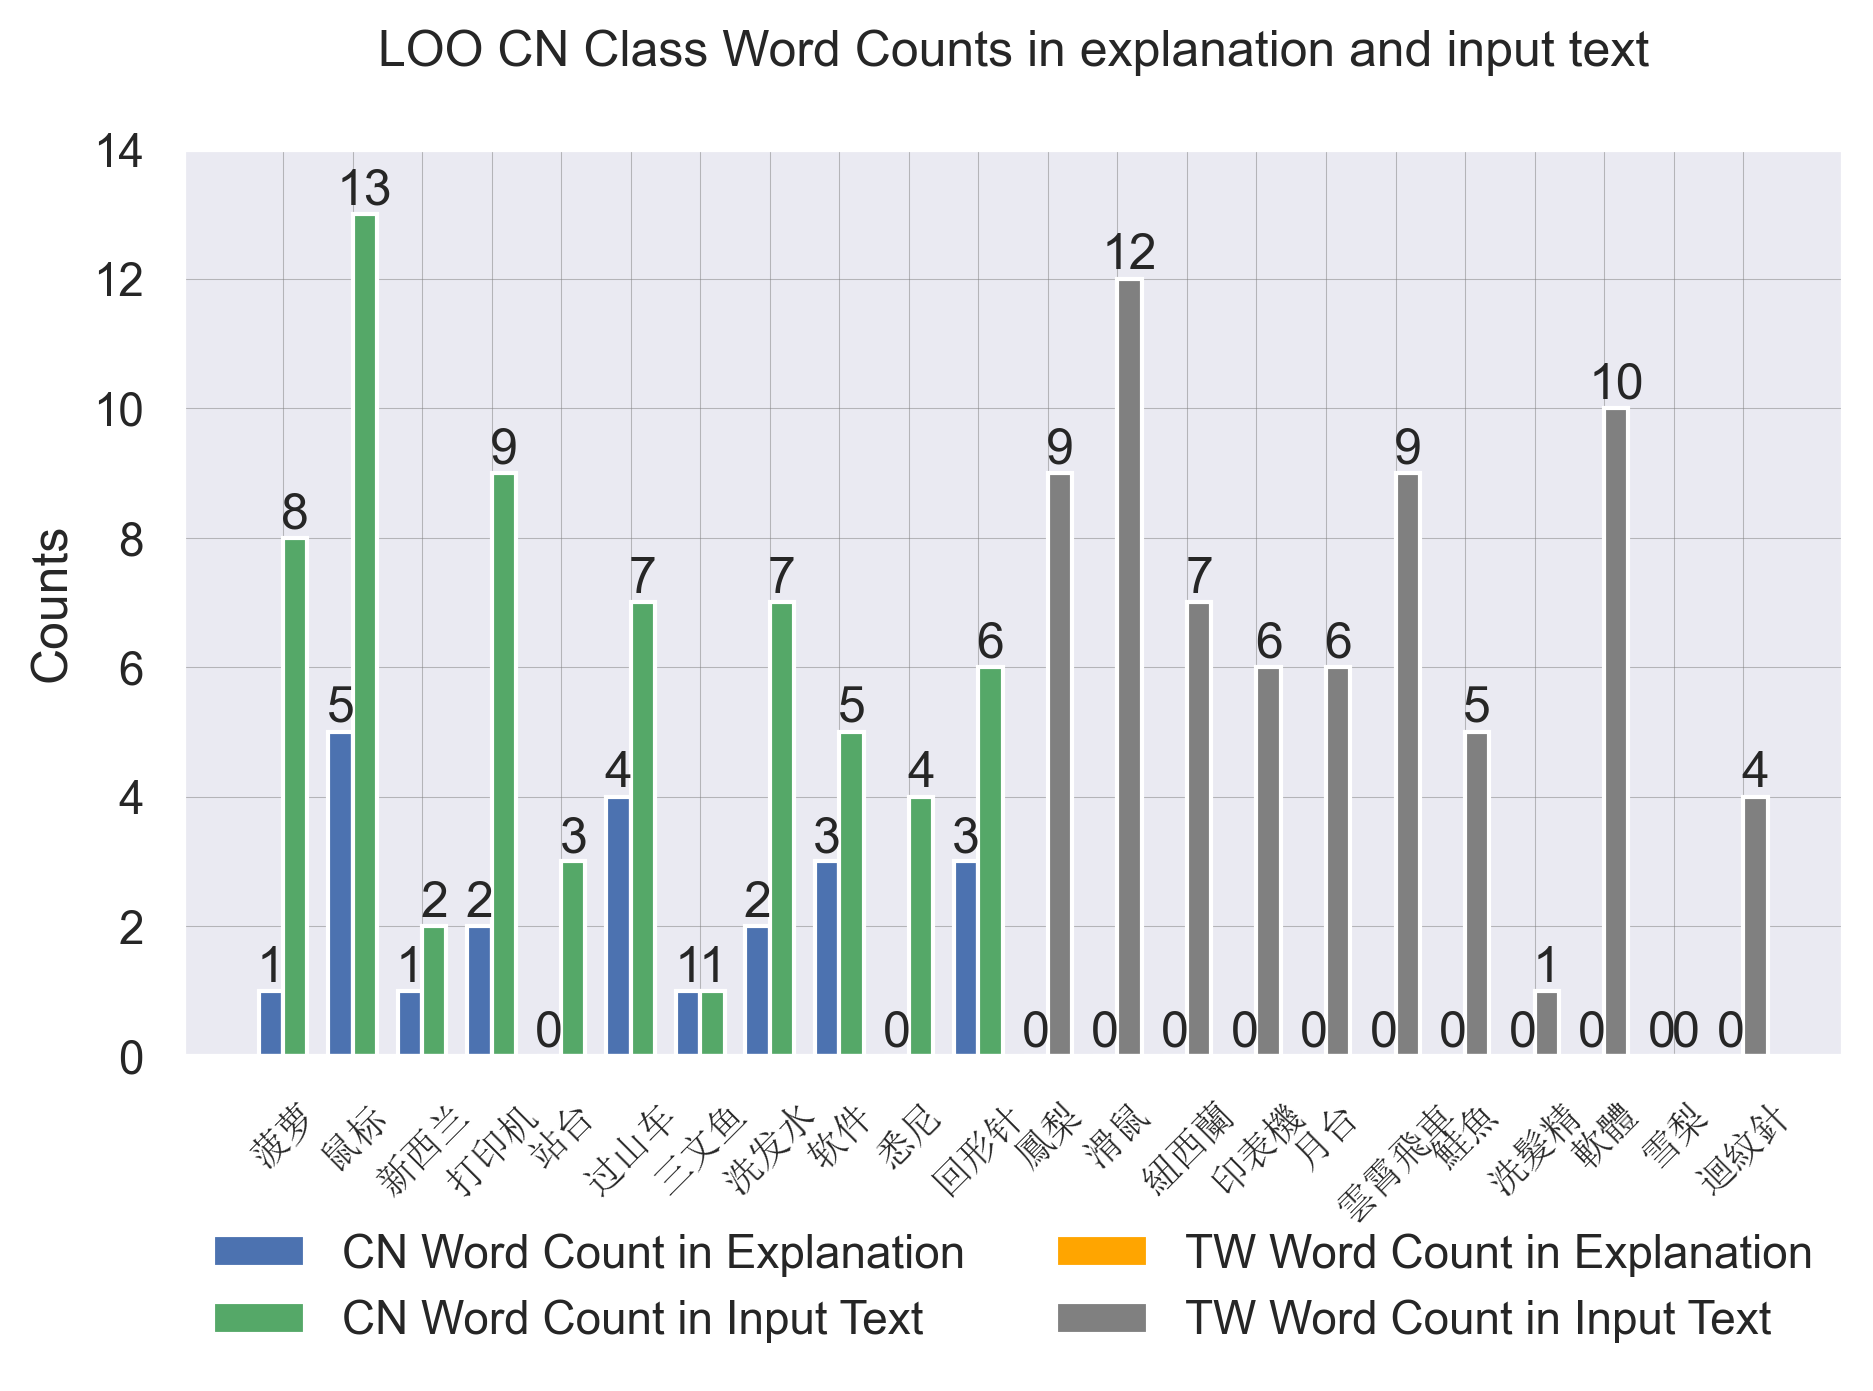
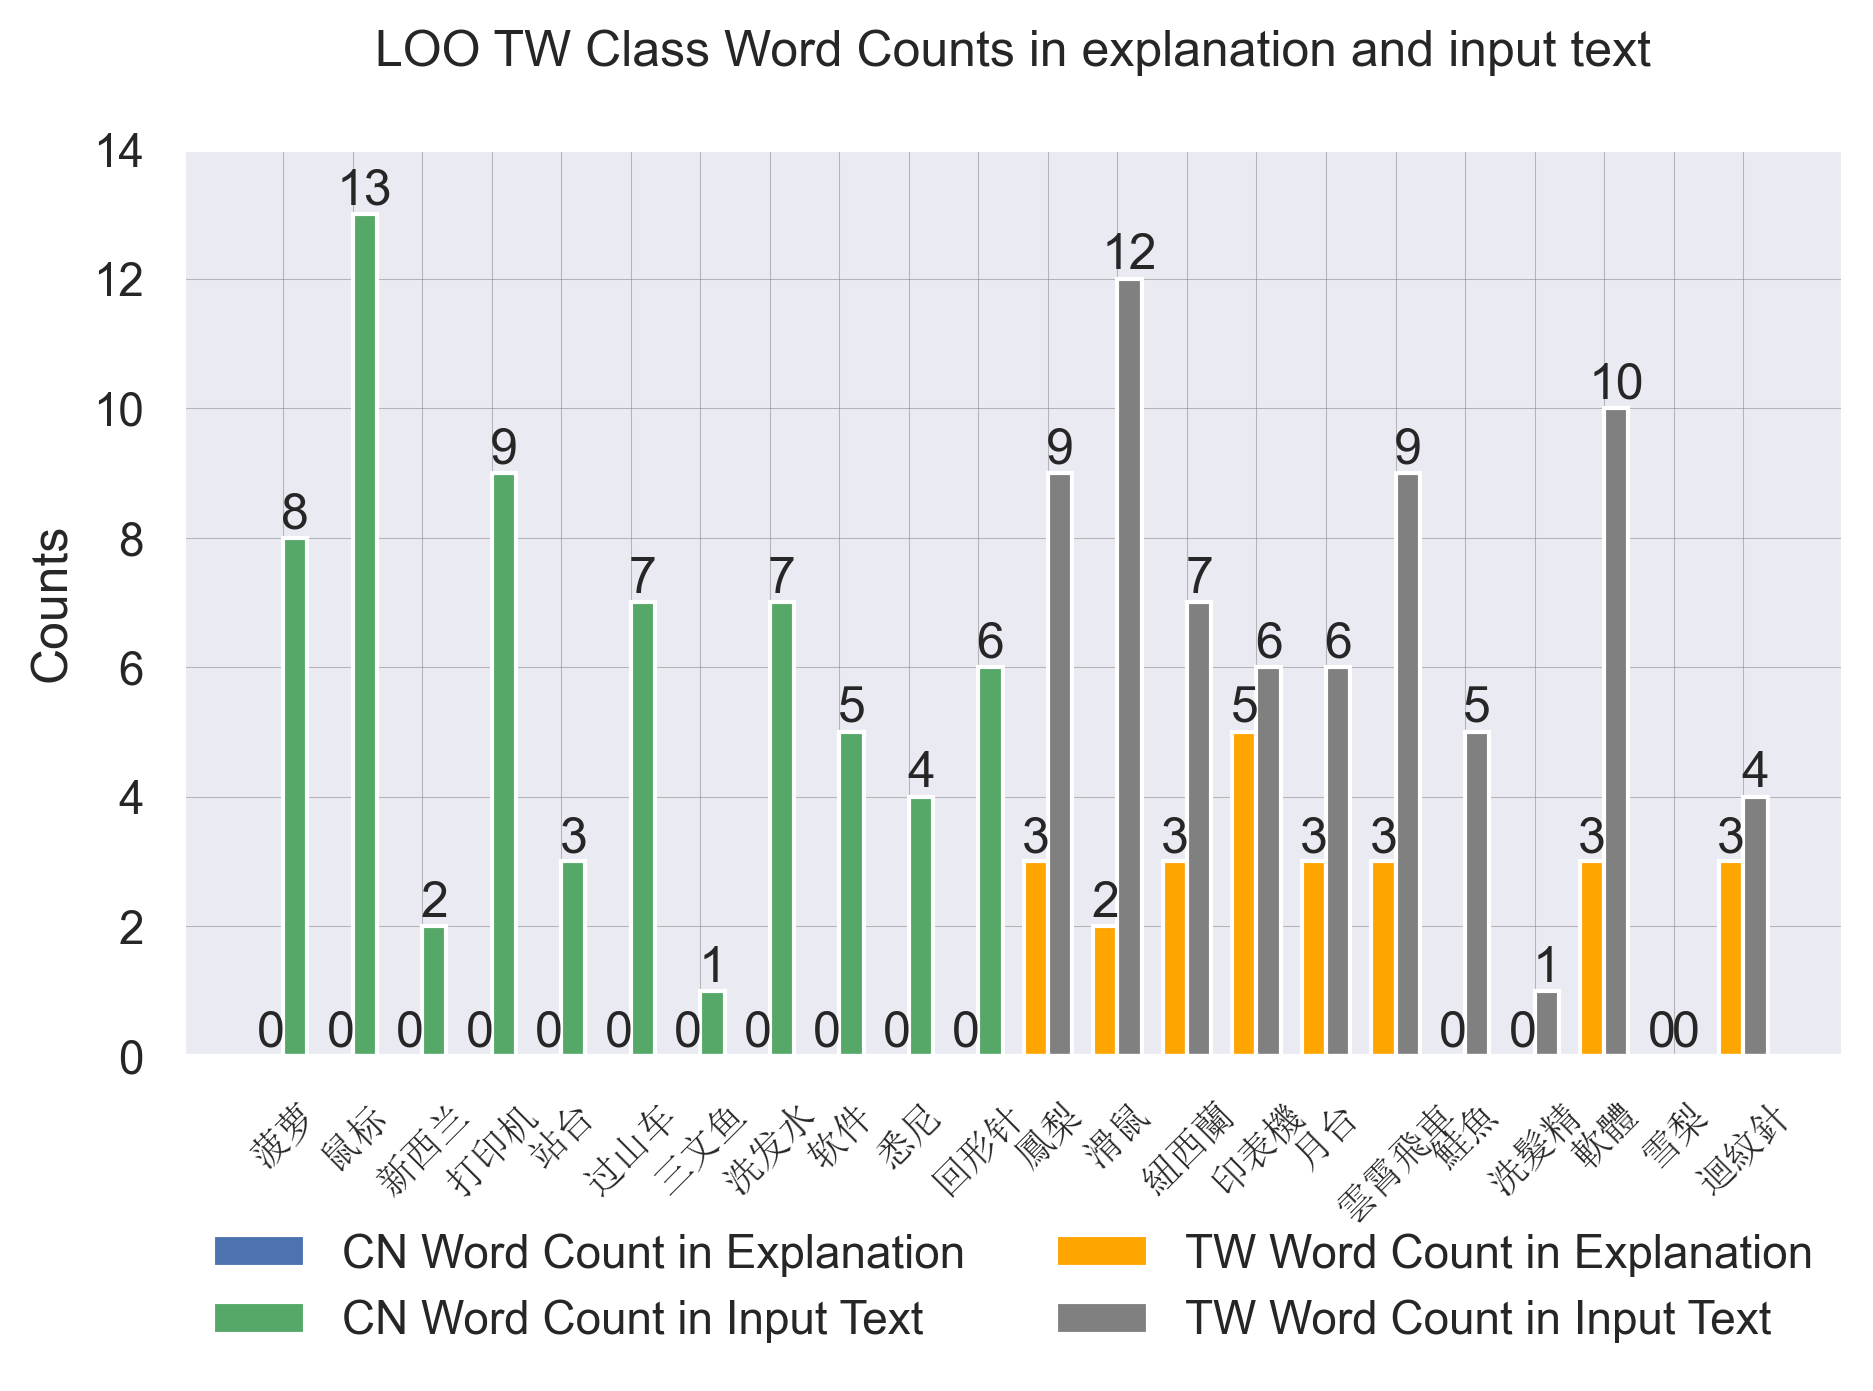
Riley et al. (2022) provide a set of translations between CN and TW. The PR for these specific features is calculated in Table 8. For both explanation methods, these language-unique lexical features tend to only appear in their corresponding classes with reasonable PRs.666The feature counts are available in Appendix E. It is worth noting that the script differences between CN and TW make its fairly easy for the classifiers to correctly classify them, so this part functions as a simple sanity check for our method.
Appendix B Additional Discussion
B.1 Why is Pick-Up Rate Low?
In the CN-TW experiments, the language-unique lexical features (see Table 8) are always correctly identified, which means that our method has high precision. The fairly low pick-up rates, though, imply that our method has somewhat low recall. To test if this is indeed the case, we explore whether there exist other lexical features that may also be language-unique but who are not part of our original feature list. To do so, we find all features that co-occur with the features in our list for both varieties, and rank them based on their counts. We then present this updated list of possible language-unique features to our annotators (in a manner similar to §5.4). We find that the majority of them are indeed good candidates for language-unique features as well. In particular, 74.2% of the ones selected for CN and 68.3% of the ones for TW are indeed unique to the respective language. This implies that the apparent low recall of our method is simply due to the presence of many good options in the data – and the feature lists in Table 8 contain only a subset of the possible explanations.
B.2 Explanations from the Training Sets
We explore how expanding the scale of data points influences the explanation methods’ ability to capture features. Therefore, we run the classifier on the training set rather than the test set, to collect more explanations. We conduct experiments on LSDC dataset, similar to §5.4. Comparing the results, presented in Table 7 with the original test set results in Table 3, we find a substantial increase in the number of data points along with noticeable fluctuations in PRs. Despite these variations, the language-specific features continue to mainly appear within their respective predicted classes. More results can be found in Appendix A.1. This observation reaffirms our findings that the language-unique lexical features can indeed be captured with high precision by explanations.
B.3 Other Features
While our primary focus is extracting lexical features from dialects, we also explore extracting sub-word features. We conducted a study using the LSDC dataset Siewert et al. (2020), which contains examples where the plural suffix of verbs in the present tense differs among dialects. In dialects MKB, MAR, NPR, OFR, and GRO (class 1), the plural suffix is -(e)n, while in the rest of the dialects in the dataset (class 0), it is -(e)t. We counted the occurrences of these two suffixes in the text and used PR to evaluate whether explanation models can recognize these subtle, language-specific features. Table 9 illustrates the results. For class 1 the models do indeed return features with its unique feature -(e)n with a relatively high PR (20%) and it (correctly) does not return features for class 0 (only 1% PR).
The other type of ending (-(e)t), on the other hand, is not returned as part of the model explanations for class 0. We hypothesize that this discrepancy is due to feature overload: several other words in these dialects, which are not present-tense verbs, have the same ending. To accurately capture these sub-word features, further investigation is necessary, along with the development of morphological and morphosyntactic analysis tools for these dialects, which extends beyond the scope of our current work.
| OFL | Non-OFL | |||
| Count | mik | dik | mi | di |
| OFL Exp. | 92 | 44 | 0 | 0 |
| Non-OFL Exp. | 2 | 9 | 1422 | 493 |
| Text | 263 | 150 | 4895 | 1310 |
| OFL PR (%) | 35 | 29.3 | 0 | 0 |
| Non-OFL PR (%) | 0.76 | 6 | 29 | 38 |
| LOO | SelfExp. | ||||
| Label | Feature | CN PR | TW PR | CN PR | TW PR |
| CN | gbsn菠萝 | 12.5 | 0 | 12.5 | 0 |
| gbsn鼠标 | 38.5 | 0 | 15.4 | 0 | |
| gbsn新西兰 | 50 | 0 | 66.7 | 0 | |
| gbsn打印机 | 33.3 | 0 | 33.3 | 0 | |
| gbsn站台 | 0 | 0 | 0 | 0 | |
| gbsn过山车 | 57.1 | 0 | 14.3 | 0 | |
| gbsn三文鱼 | 100 | 0 | 100 | 0 | |
| gbsn洗发水 | 28.6 | 0 | 28.6 | 0 | |
| gbsn软件 | 60 | 0 | 0 | 0 | |
| gbsn悉尼 | 0 | 0 | 50 | 0 | |
| gbsn回形针 | 50 | 0 | 33.3 | 0 | |
| Avg. PR | 39.1 | 0 | 35 | 0 | |
| TW | bsmi鳳梨 | 0 | 33.3 | 0 | 55.6 |
| bsmi滑鼠 | 0 | 16.7 | 0 | 0 | |
| bsmi紐西蘭 | 0 | 42.9 | 0 | 14.3 | |
| bsmi印表機 | 0 | 83.3 | 0 | 50 | |
| bsmi月台 | 0 | 50 | 0 | 16.7 | |
| bsmi雲霄飛車 | 0 | 33.3 | 0 | 33.3 | |
| bsmi鮭魚 | 0 | 0 | 0 | 60 | |
| bsmi洗髮精 | 0 | 0 | 0 | 100 | |
| bsmi軟體 | 0 | 30 | 0 | 20 | |
| bsmi雪梨 | 0 | 0 | 0 | 0 | |
| bsmi迴紋針 | 0 | 75 | 0 | 25 | |
| Avg. PR | 0 | 33.1 | 0 | 34.1 | |
| Count | -et (C.0) | -en (C.1) |
|---|---|---|
| C.0 Exp. | 39 | 209 |
| C.1 Exp. | 904 | 4046 |
| Text | 3772 | 21112 |
| C.0 PR (%) | 1 | 1 |
| C.1 PR (%) | 24 | 19.2 |
Appendix C Classification Results
C.1 Classification Accuracy
C.2 Classification Accuracy with Baseline
| Dialect | Accuracy | ||
| Italian | Baseline | Ours | |
| EML | 98.3 | 99.1 | |
| FUR | 99.7 | 99.8 | |
| LIJ | 99.7 | 100.0 | |
| LMO | 99.7 | 99.3 | |
| NAP | 100.0 | 99.2 | |
| PMS | 100.0 | 99.7 | |
| ROA | 100.0 | 100.0 | |
| SC | 98.5 | 97.4 | |
| SCN | 99.7 | 99.2 | |
| VEC | 99.7 | 99.4 | |
| Low-Saxon | ACH | 93.64 | 99.1 |
| DRE | 97.7 | 98.6 | |
| HAM | 94.1 | 95.0 | |
| HOL | 96.0 | 93.8 | |
| MAR | 83.3 | 99.8 | |
| MKB | 96.5 | 96.8 | |
| MON | 85.7 | 99.1 | |
| NNI | - | - | |
| NPR | 87.0 | 99.6 | |
| OFL | 97.7 | 98.3 | |
| OFR | - | - | |
| OVY | 87.0 | 99.5 | |
| Mandarin | TW | 99.3 | 99.4 |
Appendix D Dataset Statistics
| Language | Dialect Region | Train | Test |
| Mandarin | Mainland (CN) | 3802 | 467 |
| Taiwan (TW) | 3807 | 488 | |
| Italian | Piemonte (PMS) | 3305 | 414 |
| Veneto (VEC) | 11249 | 1447 | |
| Sicilia (SCN) | 3250 | 399 | |
| Campania (NAP) | 2012 | 254 | |
| Emilia Romagna (EML) | 1648 | 222 | |
| Taranto (ROA TARA) | 716 | 90 | |
| Sardegna (SC) | 810 | 99 | |
| Liguria (LIJ) | 4575 | 558 | |
| Friuli (FUR) | 2990 | 368 | |
| Veneto (LID) | - | - | |
| Lombardia (LMO) | 5846 | 733 | |
| Low Saxon | Achterhoek (ACH) | 791 | 106 |
| Drenthe (DRE) | 5322 | 634 | |
| Groningen (GRO) | 27 | 2 | |
| Hamburg (HAM) | 5559 | 705 | |
| Holstein (HOL) | 10381 | 1293 | |
| Mark-Brandenburg (MAR) | 177 | 20 | |
| Mecklenburg-Vorpommern (MKB) | 15654 | 1913 | |
| Munsterland (MON) | 589 | 86 | |
| Northern Lower Saxony (NNI) | 649 | 80 | |
| Lower Prussia (NPR) | 298 | 33 | |
| Eastphalia (OFL) | 7512 | 952 | |
| East Frisia (OFR) | 197 | 25 | |
| Overijssel (OVY) | 1063 | 113 | |
| Eastern Westphalia (OWL) | 11480 | 1396 | |
| Sauerland (SUD) | 13747 | 7425 | |
| Twente (TWE) | 547 | 59 |
Appendix E Feature Counts for CN-TW PR
Appendix F Inter-annotator Agreement Statistics
To minimize potential biases, we mixed the features between both classes.