single \DeclareAcronymDeFi short = DeFi, long = Decentralized Finance, \DeclareAcronymPoW short = PoW, long = Proof-of-Work, \DeclareAcronymPoS short = PoS, long = Proof-of-Stake, \DeclareAcronymLTVV short = LTV, long = Loan-to-Value, \DeclareAcronymHF short = HF, long = Health Factor, \DeclareAcronymAPR short = APR, long = Annual Percentage Rate, \DeclareAcronymROI short = ROI, long = Return On Investment, \DeclareAcronymNRF short = NRF, long = Nearly Risk-Free, \DeclareAcronymIL short = IL, long = Impermanent Loss, \DeclareAcronymRL short = RL, long = Realized Loss, \DeclareAcronymPNL short = PNL, long = Profit and Loss, \DeclareAcronymJIT short = JIT, long = Just-in-Time, \DeclareAcronymLP short = LP, long = Liquidity Provider, \DeclareAcronymLT short = LT, long = Liquidity Taker, \DeclareAcronymNO short = NO, long = Node Operator, \DeclareAcronymLSD short = LSD, long = Liquid Staking Derivative, \DeclareAcronymLST short = LST, long = Liquid Staking Tokens, \DeclareAcronymDEX short = DEX, long = Decentralized Exchange, \DeclareAcronymCEX short = CEX, long = Centralized Exchange, \DeclareAcronymEOA short = EOA, long = Externally-Owned Account, \DeclareAcronymNFT short = NFT, long = Non-fungible Token, \DeclareAcronymP2P short = P2P, long = Peer-to-Peer, \DeclareAcronymTVL short = TVL, long = Total Value Locked, \DeclareAcronymCFMM short = CFMM, long = Constant Function Market Maker, \DeclareAcronymCPMM short = CPMM, long = Constant Product Market Maker, \DeclareAcronymDApp short = DApp, long = Decentralized Application, \DeclareAcronymDAO short = DAO, long = Decentralized Autonomous Organisation, \DeclareAcronymCeFi short = CeFi, long = Centralized Finance, \DeclareAcronymMEV short = MEV, long = Miner Extractable Value, \DeclareAcronymEV short = EV, long = Extractable Value, \DeclareAcronymBEV short = BEV, long = Blockchain Extractable Value, \DeclareAcronymAMM short = AMM, long = Automated Market Maker, \DeclareAcronymFaaS short = FaaS, long = Front-running as a Service, \DeclareAcronymSaaS short = SaaS, long = Staking as a Service, \DeclareAcronymHFT short = HFT, long = High-frequency Trading, \DeclareAcronymPGA short = PGA, long = Priority Gas Auction, \DeclareAcronymBRF short = BRF, long = Back-run Flodding, \DeclareAcronymPRG short = PRG, long = Priority Gas Auction, \DeclareAcronymAE short = AE, long = Atomic Execution, \DeclareAcronymBEET short = BEET, long = Break-even Extraction Threshold, \DeclareAcronymBAD short = BAD, long = Breaking Atomicity and Determinism, \DeclareAcronymaamm short = A2MM, long = Automated Arbitrage Market Maker, \DeclareAcronymdfmm short = DFMM, long = Dynamic Fee Market Maker, \DeclareAcronymdfaamm short = AMM, long = Automated Arbitrage and Fee Market Maker, \DeclareAcronymMVI short = MVI, long = Minimum Victim Input, \DeclareAcronymBSC short = BSC, long = Binance Smart Chain, \DeclareAcronymKS short = KS, long = Kolmogorov-Smirnov,
Exploring the Market Dynamics of
Liquid Staking Derivatives (LSDs)
Abstract
Staking has emerged as a crucial concept following Ethereum’s transition to Proof-of-Stake consensus. The introduction of Liquid Staking Derivatives (LSDs) has effectively addressed the illiquidity issue associated with solo staking, gaining significant market attention. This paper analyzes the LSD market dynamics from the perspectives of both liquidity takers (LTs) and liquidity providers (LPs). We first quantify the price discrepancy between the LSD primary and secondary markets. Then we investigate and empirically measure how LTs can leverage such discrepancy to exploit arbitrage opportunities, unveiling the potential barriers to LSD arbitrages. In addition, we evaluate the financial profit and losses experienced by LPs who supply LSDs for liquidity provision. Our findings reveal that LSD liquidity provision positions yield an Annual Percentage Rate (APR) lower than simply holding the corresponding LSDs.
I Introduction
Bitcoin uses the \acPoW consensus (also referred to as Nakamoto consensus [1]) to achieve agreement among nodes in a decentralized setting. This consensus model was also adopted by smart contract-enabled blockchains such as Ethereum [2]. While successfully maintaining network security, \acPoW raised environmental concerns due to its substantial energy consumption. Consequently, the Ethereum community has been actively striving to propose more sustainable alternatives. Among these, \acPoS [3, 4, 5, 6] has risen as one of the most preferred options. Ethereum initiated its transition to a \acPoS consensus on December st, , with the introduction of Beacon Chain. On September th, , the Merge completes Ethereum’s transition to \acPoS consensus.
Subsequently, \acPoS staking [7] replaces \acPoW mining on the Ethereum blockchain. Instead of relying on the computational power of \acPoW mining to secure the network, \acPoS depends on validators chosen to create new blocks based on the amount of ETH they are willing to stake as collateral. Specifically, participants can lock up ETH into the designated deposit contract to become validators. However, solo staking requires substantial capital commitment and technical expertise to maintain the validator node. Moreover, the staked ETH becomes illiquid during the lock-up period, thus restricting users from capitalizing on broader market opportunities.
To address these challenges, the concept of \acLSD emerged [8, 9, 10]. Liquid staking providers enable retail users, particularly those with limited capital and technical expertise, to collectively engage in the network’s validation process and earn staking rewards. Various \acpLSD adopt diverse token mechanisms to distribute staking rewards. For example, rebasing \acpLSD adjust token supply to distribute staking rewards, whereas reward-bearing \acpLSD increase token values to represent accumulated staking rewards. These token mechanisms not only determine reward distribution but also hold the potential to impact the dynamics of the \acLSD market.
In the \acLSD primary market, users can stake any desired amount of ETH on liquid staking platforms to receive the corresponding \acLSD, which represents both the underlying ETH and the staking reward. Following this, users can utilize their \acpLSD to integrate with existing \acDeFi protocols in the secondary market. For instance, they can leverage \acpLSD as collateral on lending platforms to borrow assets, contribute both ETH and \acpLSD to add liquidity to \acDEX pools, and engage in asset trading by swapping \acpLSD for other assets through \acDEX pools.
Despite the considerable attention that LSDs have attracted, their market dynamics remain underexplored in existing literature. This paper aims to analyze \acLSD market dynamics, focusing on the perspectives of both \acpLT and \acpLP. Our objectives are twofold. Firstly, we seek to investigate the price discrepancy between the \acLSD primary and secondary market and understand how \acpLT leverage this discrepancy for arbitrage opportunities. Secondly, we aim to evaluate the financial profit and losses experienced by \acpLP who engage in supplying \acpLSD for liquidity provision. We outline the main contribution of this paper as follows.
-
Token Mechanisms Systematization. We systematically categorize the token mechanisms implemented by \acLSD protocols, including the rebasing, reward-bearing, and dual-token models. We further formalize token mechanisms specific to rebasing \acLSD (e.g., stETH) and reward-bearing \acLSD (e.g., rETH), illustrating their functionality in the distribution of staking rewards.
-
Price Discrepancy and Arbitrage Analysis. For rebasing and reward-bearing \acpLSD, we quantify their price discrepancies between primary and secondary markets. Furthermore, we identify k ETH (m USD) arbitrage amount caused by such price discrepancies since the inception of \acpLSD. We provide empirical insights into the strategies adopted by arbitrageurs, revealing potential entry barriers in the context of arbitrages with \acpLSD.
-
\acp
LSD Liquidity Provision Measurement. We empirically measure and compare the \acAPR experienced by \acpLP supplying \acpLSD (e.g., stETH and rETH) to \acDEX liquidity pools such as Curve, Uniswap V3, and Balancer. We find that of \acLSD liquidity provision positions yield a net \acAPR lower than the \acAPR of simply holding the corresponding \acpLSD.
II Backgroud
II-A Blockchain and DeFi
Permissionless blockchains are decentralized distributed ledgers overlaying a global peer-to-peer network infrastructure, allowing any entity to join and participate freely. Within this context, especially in systems such as Ethereum [2], participants can create many decentralized applications using smart contracts. Built upon permissionless blockchains, \acDeFi [11, 12] empowers users to participate in decentralized financial activities such as lending, borrowing, and trading.
II-B From Pow Mining to PoS Staking
PoW consensus has also been adopted by Ethereum since its inception. Nevertheless, a notable drawback of \acPoW lies in its substantial computational demands and energy consumption. Motivated by the need for a more sustainable consensus mechanism, Ethereum embarked on a transition from \acPoW [2] to \acPoS [13, 14, 15, 16, 17]. This transition started in December by introducing the Beacon Chain system with a “staking” mechanism. Participants can deposit ETH into the designated contract, thereby taking on the validator role for block proposal, block attestation, and synchronizing committee [13]. On September th, , the Ethereum “Merge” formally adopted the Beacon Chain as the new consensus layer to the original Mainnet execution layer. After the Merge, staking on the \acPoS system replaces \acPoW mining, reducing energy consumption by an estimated [18]. On April th, , Ethereum underwent the “Shapella upgrade”, facilitating the withdrawal of the staked ETH for validators [19].
II-C Staking Options on Ethereum
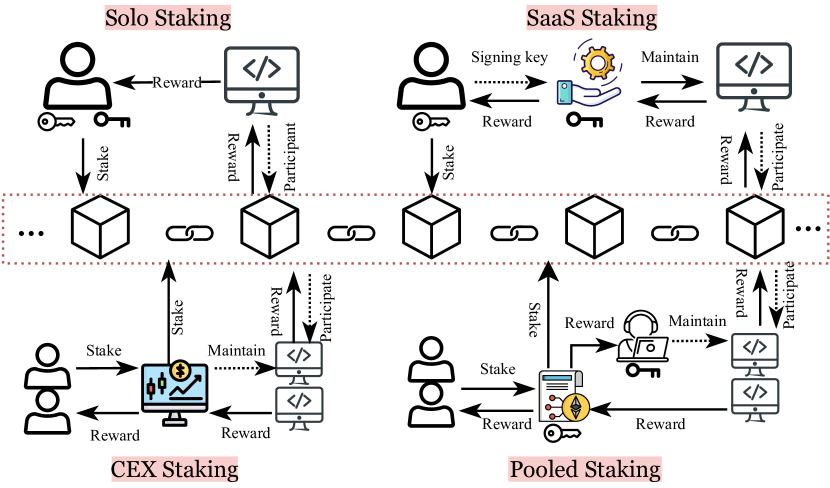
Ethereum participants are presented with four staking options: solo staking, \acSaaS, \acCEX staking, and pooled staking (cf. Fig. 19).
In solo staking, participants manage their validator nodes by staking at least ETH, ensuring complete control over staking rewards. This staking strategy can enhance blockchain security. However, it requires technical expertise in operating a validator node and a significant capital commitment of a full ETH, presenting a significant barrier to user participation.
Compared with solo staking, \acSaaS staking substantially reduces the operational burden for users who possess ETH but lack technical expertise. The \acSaaS provider manages the validator node on behalf of the user, receiving operational fees proportional to the amount of staked ETH and staking rewards.
Users with holdings below ETH can choose Pooled staking, a system where multiple participants combine (or “pool”) their ETH to participate in the staking process collectively without necessitating individual full-node commitments. As such, all rewards and penalties accrued by the pool’s validators are shared among stakers. Typically, staking pools charge fees as a fixed amount or a percentage of the staking rewards.
In \acCEX staking, providers such as Binance and Coinbase offer users centralized and custodial staking services. Staking through \acpCEX offers users the simplicity and convenience akin to pooled staking, eliminating the need for technical requirements and full-node commitments. ==
III Liquid Staking Derivatives
Staking ETH on Ethereum helps enhance network security and generates staking rewards. However, it restricts liquidity during the staking period, limiting users’ ability to capitalize on market opportunities. In addressing this challenge, the concept of \acLSD emerged, which serves as a tradable representation encompassing the underlying staked ETH, its associated staking rewards and potential penalties (e.g., slashing [20]). Users can acquire \acpLSD by participating in pooled staking (e.g., Lido) or \acCEX staking (e.g., Coinbase). These \acpLSD can be traded instantly in the secondary market. As of the latest update, liquid staking protocols on Ethereum have accumulated a total value exceeding b USD 111https://defillama.com/protocols/liquid%20staking/Ethereum, access on October th, , securing a leading position across various \acDeFi sectors.
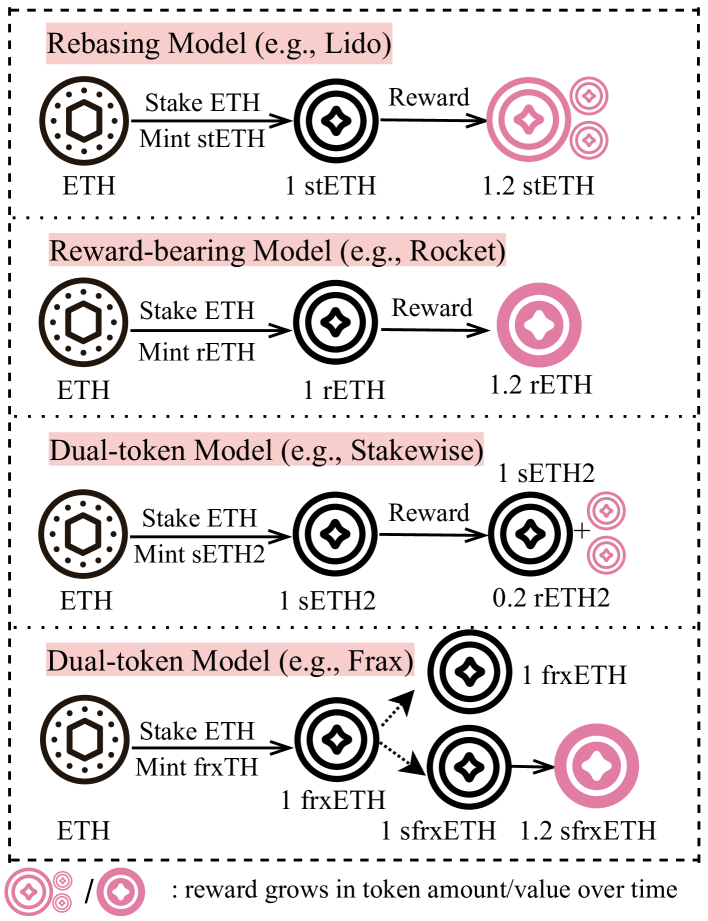
LSD token mechanisms can be broadly classified into the following categories: (i) rebasing model, (ii) reward-bearing model, and (iii) dual-token model (cf. Fig. 1).
III-A Rebasing Model
Tokens with a rebasing mechanism feature an elastic total supply that can increase or decrease, with the change in supply distributed proportionally among token holders. Stakers’ stETH balances get adjusted daily to reflect the accumulated rewards. The rebase can be positive or negative, depending on the validators’ performance. The rebasing model mitigates the expense associated with reward distribution. Distributing staking rewards among all stETH holders using direct transfer calls necessitates an unbounded loop. With rebasing, the stETH smart contract can automatically update all the addresses holding stETH in a single transaction. However, a rebasing token is difficult to integrate into existing \acDeFi protocols, as the token’s supply changes on a regular basis.
For instance, users who stake ETH on Lido can obtain stETH. Note that stETH rebases via the “share” concept. Given the share price at time , a rebase event at time changes the share price to , consequently adjusting users’ stETH balances from to .
| (1) |
III-B Reward-Bearing Model
Reward-bearing \acpLSD increase in their values to reflect the accumulated rewards. In contrast to rebasing \acpLSD, reward-bearing \acpLSD adopt an alternative design to simplify liquid staking while upholding stakers’ seamless access to \acDeFi opportunities, thus striking a balance between accessibility and functionality. Their supply remains stable, offering a more consistent valuation trajectory. For instance, Rocket Pool offers rETH, which represents the tokenized staking assets and the rewards it gains over time. Notably, as staking rewards are earned, the value of rETH appreciates, manifesting through changes in the rETH/ETH ratio at time (cf. Eq. 2), while the holder’s rETH balance remains unchanged.
| (2) |
III-C Dual-token Model
The dual-token model entails two variations of \acpLSD: (i) a base token representing the underlying ETH token on a 1:1 basis; and (ii) a reward-bearing token that progressively accrues yield, or a reward token held separately by stakers to reflect the net reward. For instance, Frax implements the dual-token model with its frxETH and sfrxETH tokens, where frxETH maintains parity with ETH and sfrxETH accrues the staking reward. Stakers can choose between holding frxETH to yield from liquidity provision in Curve’s frxETH–ETH liquidity pool, or exchange frxETH for sfrxETH to earn the staking reward. In contrast, Stakewise implements a different design, where the balance of ETH deposits and rewards is reflected in sETH2 (staking ETH) and rETH2 (reward ETH) minted to stakers in a 1:1 ratio. This design avoids rebasing or reward-bearing dynamics, thereby mitigating the potential for impermanent loss when providing liquidity in \acpDEX.
IV LSD Price Discrepancy and Arbitrages
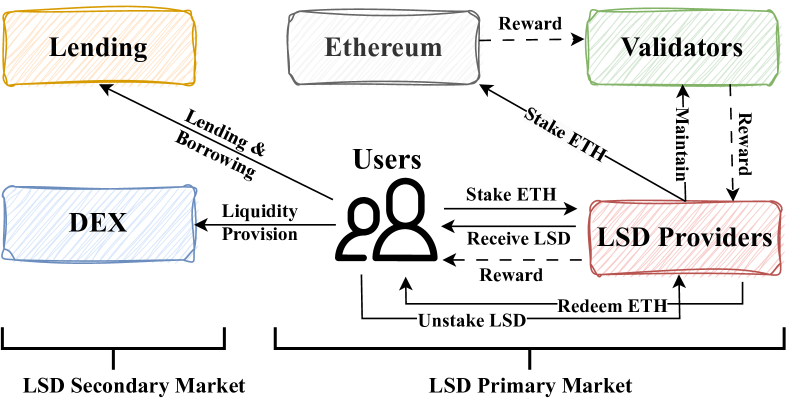
Users can stake ETH on liquid staking platforms to acquire \acpLSD in the primary market. These \acpLSD can be utilized to integrate with existing \acDeFi protocols in the secondary market, including participating in liquidity provision within \acDEX pools and providing assets on lending platforms (cf. Fig. 2).
In this section, we first investigate the price discrepancy existing between the \acLSD primary and secondary markets, which raises arbitrage opportunities with \acpLSD. Then we bring empirical insights into these arbitrage behaviors, shedding light on the potential entry barriers of \acLSD arbitrages.
IV-A LSD Price Discrepancy
LSD with different token mechanisms exhibit distinct price dynamics. In the subsequent sections, we do not discuss dual-token \acpLSD due to their relatively low market share.
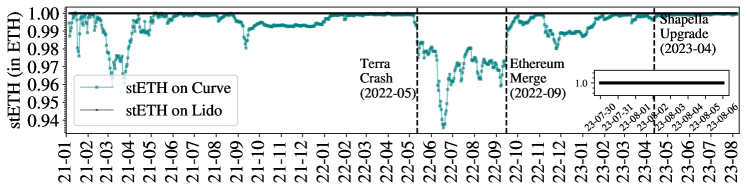
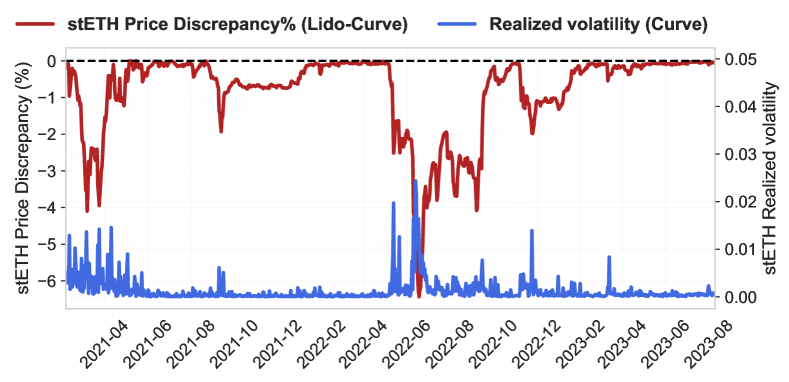
Rebasing \acpLSD adjust their token supply for reward distribution. Taking stETH as an example, when users stake ETH on Lido, they receive an equivalent 1:1 amount of stETH. This indicates that the stETH to ETH price is fixed as in the primary market. After obtaining stETH, users can trade them in the secondary market through \acpDEX such as Curve. While ideally, the secondary market price () should align with , in reality, a clear deviation between the two exists (cf. Fig. 3). To quantify such deviation, we crawl -minute tick-level data of and from Lido and Curve respectively. We calculate the Realized Volatility (RV) [21, 22] of on day using Eq. 6. We observe an average of and the maximum recorded of . We further calculate the price discrepancy between and (cf. Eq. 7). We discover that on average, is lower than . Moreover, we find that deviates significantly from from May th to May th, due to the crash of UST/LUNA on the Terra network [23, 9]. During this period, the price discrepancy widened to 6.9%, reaching its all-time maximum (cf. Fig. 6).
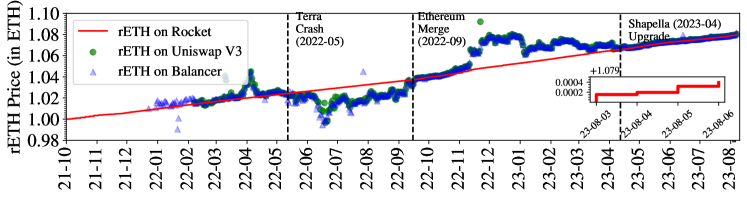
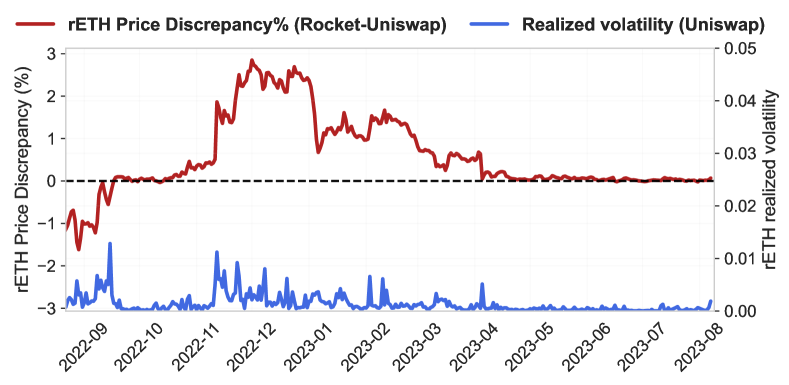
Reward-bearing \acpLSD, such as rETH, accumulate rewards by adjusting their token value, leading to an increase in the rETH price in the primary market () over time. Consequently, the rETH price in the secondary market () is anticipated to align with . To analyze the price behavior of rETH, we gather -minutes tick-level by querying the Rocket protocol contract. We also collect by querying Uniswap V3 and Balancer pool contracts respectively. We discover that deviates from by an average of . Furthermore, our data indicates that is less volatile than (cf. Fig. 4). This may be attributed to the fact that as a reward-bearing token, rETH can be more seamlessly integrated into \acDEX designs, given that the supply of rETH remains constant over time. Similar to stETH, rETH has also witnessed substantial volatility following the Terra crash, reaching a peak realized volatility of (cf. Fig. 6). Interestingly, experienced a gradual rebound post-Merge and a notable upward trend subsequent to MakerDAO’s introduction of the rETH token in November 2022, suggesting a burgeoning rise in investor confidence.
IV-B LSD Arbitrages
The price discrepancy between the \acLSD primary and secondary markets creates arbitrage opportunities. Capitalizing on these opportunities not only enables users to generate profits but also helps restore price equilibrium in different markets.
In the traditional financial market, arbitrage [24] exploits price discrepancies in various markets to secure profits without assuming any risk. Traders capitalize on temporary price differences, buying the asset at a lower price and selling it where it is higher. This approach is also applicable to \acLSD arbitrage. For example, when , users can first stake ETH on Lido to receive stETH and sell ETH immediately in the Curve pool to secure profits. However, in the context of \acLSD arbitrage, this approach is not entirely risk-free due to (i) the uncertainty to withdraw ETH before Shapella, and (ii) the potential slippage when trading on \acpDEX.
Note that users can also implement the arbitrage strategy when (cf. Eq. 3). In this scenario, users can initially exchange ETH in the Curve pool for stETH and subsequently redeem stETH on Lido for ETH. It is important to note that the arbitrage in this direction is only viable after the Shapella upgrade, as stakers are not allowed to redeem stETH for ETH before Shapella.
| (3) |
IV-C Arbitrage Measurement
IV-C1 Arbitrages of Rebasing \acpLSD
The price discrepancy, as illustrated in Fig. 3, between a rebased-based \acLSD in the primary market and the secondary market creates opportunities for arbitrage. To systematically capture historical arbitrage events for stETH-ETH across Lido and Curve, we propose the following heuristics:
-
•
Arbitrage with Staking (when ): We crawl transactions where a user initially stakes ETH on Lido to receive stETH, followed by a subsequent swap of stETH to ETH on Curve. Notably, both the staking and swap events occur within the same transaction.
-
•
Arbitrage with Unstaking (when ): We crawl the swap events where a user exchanges ETH for stETH on Curve after the Shapella upgrade. Subsequently, in separate transactions, the user unstakes stETH on Lido to obtain ETH.
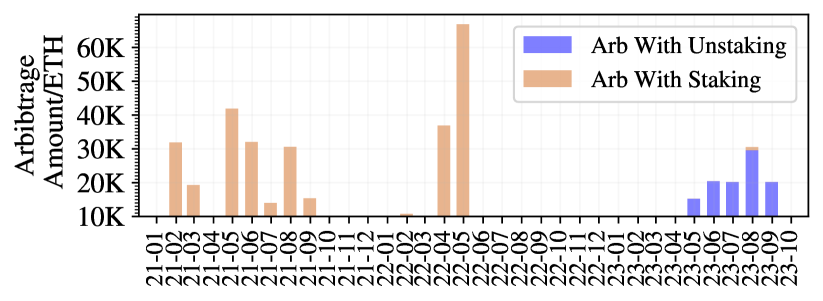
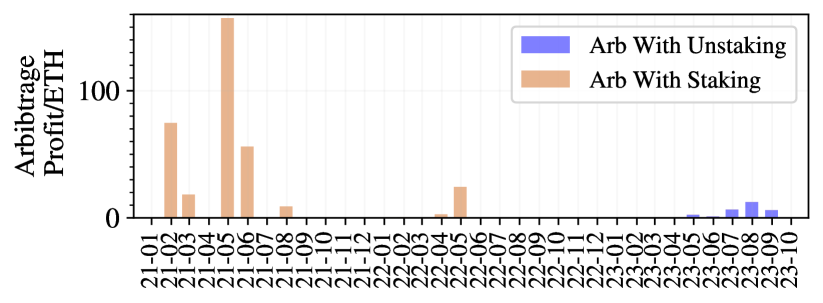
Arbitrage Amount and Profit. We apply our heuristics to analyze stETH-ETH arbitrages across Lido and Curve spanning Ethereum blocks (December th, ) to (August th, ). The results, depicted in Fig. 8 and Fig. 8, reveal that addresses performed transactions for arbitrage with staking. These arbitrages accumulated a total of ETH with an overall profit of ETH. It’s noteworthy that over of arbitrages with staking took place prior to June , a period when the price of stETH on Curve occasionally exceeded .
As for arbitrages in the reverse direction (e.g., with unstaking on Lido), we identify addresses participating in ETH worth of stETH-ETH swaps after April , resulting in a total profit of ETH. In this case, following the swap of ETH to stETH on Curve, where the price is stETH = ETH (with ), arbitrageurs have the flexibility to execute the unstaking transaction at any time. This is due to the constant price of stETH on Lido, always fixed at , ensuring that arbitrageurs can secure a revenue of ETH after the unstaking process.
IV-C2 Arbitrages of Reward-bearing \acpLSD
The price of a reward-bearing LSD experiences periodic increments to reflect the accumulative staking reward within the network. As shown in Fig. 4, the price of rETH on Rocket Pool witnesses a daily increase whenever the oracle updates the beacon’s reward allocations garnered by the validators. Nonetheless, the secondary market price does not consistently align with the primary market price. Such price discrepancies across different platforms can create opportunities for arbitrage.
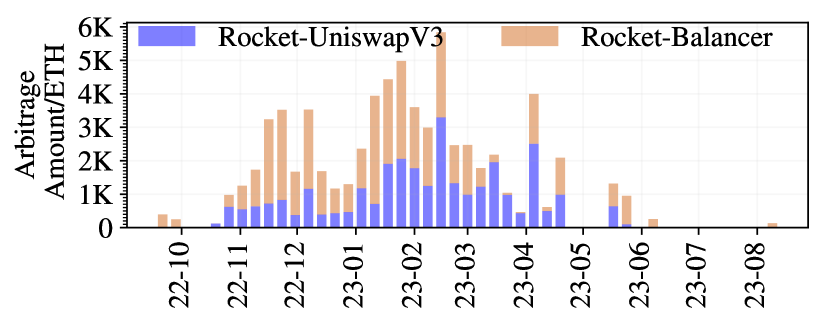
Arbitrage Amount and Profit. We investigate the arbitrage opportunities involving rETH on Rocket-Balancer and Rocket-Uniswap V3 from September th, , to August th, . Our analysis reveals that addresses executed arbitrage transactions during this period, resulting in a cumulative exchange of ETH and an overall profit of ETH. The distributions of rETH-ETH arbitrage amounts and profits over time are shown in Fig. 10 and 10 respectively. Interestingly, over of the arbitrages occurred prior to May , aligning with the historical price volatility of rETH. This pattern is evident in Fig. 4, which illustrates the nearly identical price trajectories of rETH on Uniswap V3, Balancer, and the Rocket protocol after May .
Arbitrage Strategies Analysis. Interestingly, we observe that the arbitrage transactions were executed by interacting with distinct contract addresses (cf. Table I in Appendix Supplementary Information). Out of these, arbitrage contract addresses, also known as arbitrage bots, were invoked by multiple arbitrageurs. For instance, the address 0x1f7…571 was utilized by arbitrageurs to initiate arbitrage transactions from November th, to March th, , generating a cumulative profit of ETH.
After manually assessing these contract addresses, we discover that of them feature publicly accessible code, with written in Vyper and in Solidity. After a thorough analysis of their transactions and code, we compile their arbitrage strategy particulars, which can be grouped into two categories:
-
•
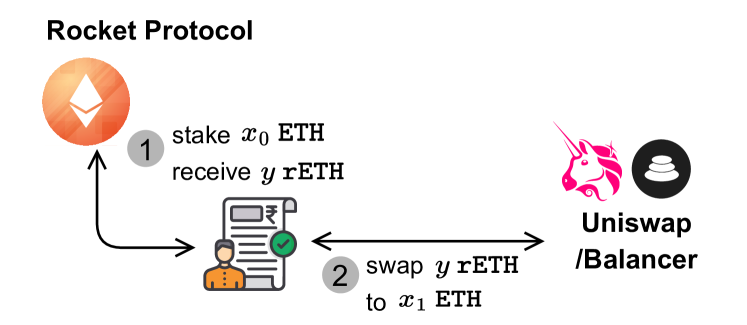
Arbitrage without flash loan (cf. Fig. 12): Upon observing the price disparities ( <) of rETH-ETH token pair on Rocket protocol () and \acpDEX (), an arbitrageur performs the following process: (i) stakes ETH on Rocket protocol to receive rETH; (ii) swaps rETH to ETH on \acpDEX. All these steps occur on a single transaction . The final profit is , where the transaction cost includes the gas fees and the fee used to bribe validators.
-
•
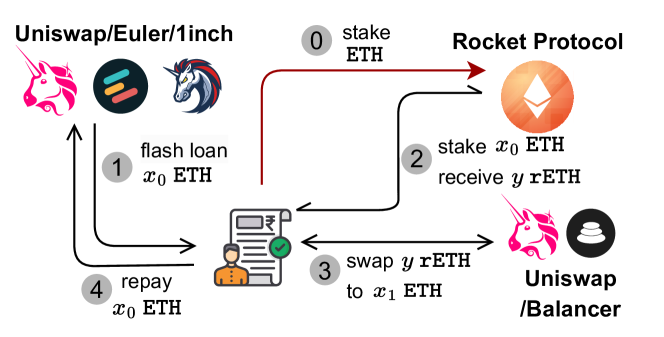
Arbitrage with flash loan (cf. Fig. 12): Upon observing the price disparities of rETH-ETH token pair, an arbitrageur performs the following process: (i) borrows ETH from the DeFi platforms supporting flash loans [25] (e.g., Uniswap, Euler, 1inch); (ii) stakes ETH on Rocket protocol to receive rETH; (iii) swaps rETH to ETH on \acpDEX; (iii) repays the ETH flash loans. All these steps occur on a single transaction . The final profit of the arbitrage is .
Is there a barrier to engaging in rETH-ETH arbitrage with flash loan? We identify four rETH-ETH arbitrage bots whose code is publicly accessible. Interestingly, due to the code transparency, any user who witnesses a profitable on-chain arbitrage transaction can replicate the corresponding arbitrageur’s strategy. This involves creating a transaction with identical input data as that of to invoke the arbitrage bot. By leveraging flash loans, the user can execute this action without the necessity of transferring any ETH to the bots, merely incurring the transaction cost .
However, this seemingly straightforward “copy-paste” arbitrage approach does not yield practical results. This is because, in real-world scenarios, prior to executing an arbitrage transaction with flash loan, an arbitrageur needs to either stake ETH or await the staking of ETH by other users within the Rocket protocol (e.g., see the transactions with index and in block ). Such actions trigger changes in the Rocket protocol which enables further staking222https://github.com/rocket-pool/rocketpool/blob/master/contracts/
contract/deposit. Our findings reveal that at least successful flash loan-based rETH-ETH arbitrage transaction consistently occurs just after a staking transaction issued by the same arbitrageur. In other words, and are placed in the same block and possess consecutive transaction indexes. Our empirical findings indicate that arbitrageurs encounter a substantial entry barrier, necessitating an average stake of ETH as a prerequisite for participating in rETH arbitrage.
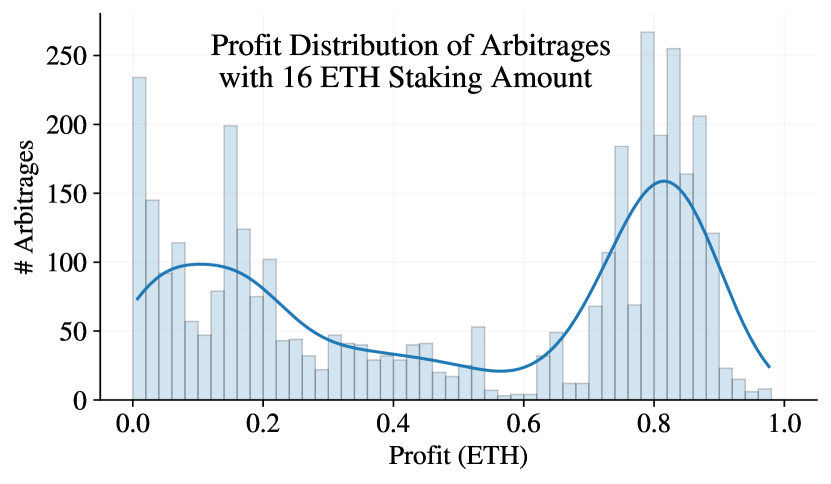
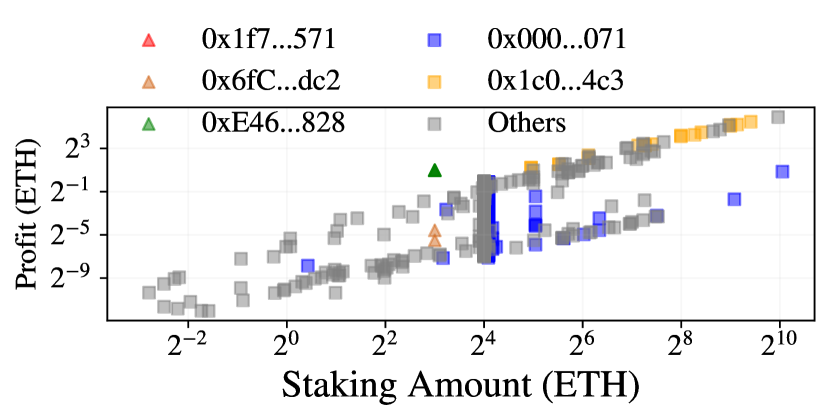
Fig. 13 illustrates the distribution of profits from rETH-ETH arbitrage in relation to the staked amount of ETH. Notably, upon excluding arbitrages involving a staking amount of 16 ETH, a clear linear increase in profits over the staked amount becomes evident, characterized by two distinct slopes. For instance, the arbitrage bot with the address 0x1c0…4c3 generated a total profit of ETH, staking a cumulative amount of ETH. We also analyze the distribution of arbitrages with a staking amount of ETH (cf. Fig. 18), and find that they yielded ETH on average.
V Liquidity Provision with \acpLSD
In this section, our focus shifts to analyzing \acLP’s financial incentives for engaging in liquidity provision with \acpLSD.
After acquiring \acpLSD in the primary market, users face two options. They can either opt to retain the \acpLSD until the Shapella upgrade, at which point they can unstake the \acpLSD to withdraw ETH and receive the associated staking rewards. Alternatively, users may leverage their \acpLSD to explore wider financial opportunities in the secondary market, such as participating in liquidity provision for \acDEX pools.
V-A PNL of LSD Liquidity Provision
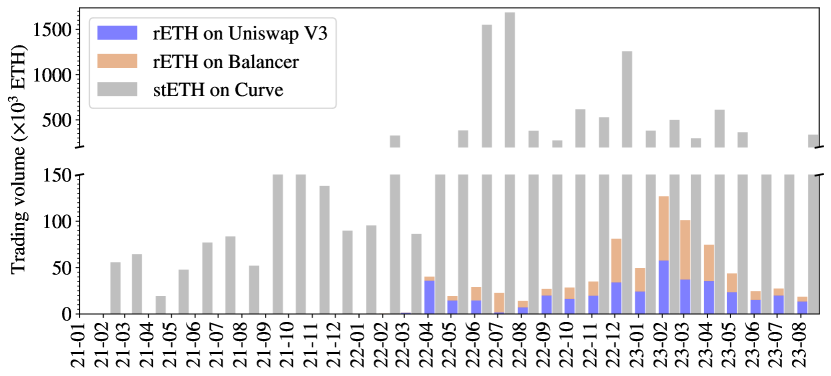
At the time of writing, Curve stands out as the dominant \acDEX for stETH, whereas Uniswap and Balancer take the lead as the most liquid \acpDEX for rETH. Fig. 18 shows the distribution of \acLSD trading volume on Curve, Uniswap V3 and Balancer over time. We find that the accumulated trading volume of stETH on Curve from February 2021 to August 2023 is m ETH, while the cumulative trading volume of rETH is k ETH since the inception of the rETH-ETH pools on Balancer and Uniswap V3 in December 2021 and February 2022. This result suggests that stETH experiences more active trading in the secondary market than rETH.
In light of the increasing trend of \acLSD liquidity provision, we aim to examine the \acPNL experienced by \acpLP and assess how these \acpPNL differ among \acpLSD with distinct token mechanisms. Consider a user intending to add an initial amount of \acLSD and ETH to a \acLSD-ETH liquidity pool at time . Given the spot price of , the initial portfolio value in ETH is . While users can gain financial benefits through liquidity provision, they may also encounter losses in their portfolio value due to price changes. In particular, the user’s \acPNL originates from four sources: (i) the swap fees earned through liquidity provision; (ii) the accumulated staking reward; (iii) the change in portfolio value due to price volatility; (iv) the transaction fees associated with adding and removing liquidity.
Suppose that at time , the \acLSD price changes to and the user can withdraw \acLSD and ETH. User’s portfolio value changes from to . Note that the earned swap fees and accumulated staking rewards are already reflected in when \acLP removes liquidity from the pool. Specifically, if the user supplies stETH for liquidity provision, the rewards will be manifested in the withdrawal amount of stETH (i.e., ). If the user provides rETH to the liquidity pool, the rewards will be expressed through changes in rETH price over time. Therefore, we can calculate the liquidity provision \acPNL using Eq. 4, where function converts the periodical rate of return to \acAPR.
| (4) |
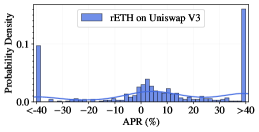
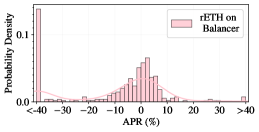
Empirical Analysis. To analyze the \acAPR obtained by users providing \acpLSD as liquidity in \acpDEX, we explore transactions that add and remove liquidity in \acpLSD on Curve, Uniswap V3, and Balancer up to block (August 7th, 2023). Our investigation identifies AddLiquidity and RemoveLiquidity events on the Curve stETH pool, Mint and collect events on the Uniswap V3 rETH pool, as well as PoolBalanceChanged events on the Balancer rETH pool. Within these events, we identify , , and liquidity positions in which users have withdrawn all of their \acpLSD from the Curve, Uniswap V3, and Balancer, respectively. We use Equation 4 to calculate the actual \acAPR of the liquidity provision positions.
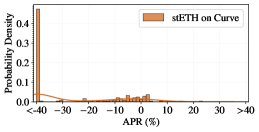
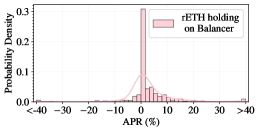
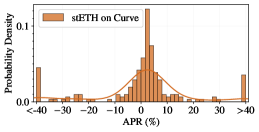
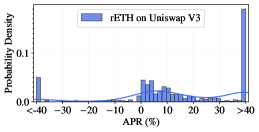
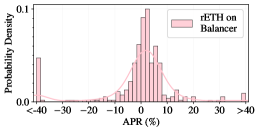
Figures 16 and 14 show the probability distribution of \acLSD liquidity provision \acAPR on the three \acpDEX, excluding and including transaction fees respectively. When making horizontal comparisons, we discover that the \acLSD liquidity provision \acAPR is likely to be influenced by the underlying token mechanism. Specifically, when transaction fees are not considered, we find that the \acpAPR for of the detected stETH liquidity provision positions are concentrated around , whereas only of rETH liquidity provision positions exhibit \acpAPR fall within the same range. In fact, of the rETH positions achieve an \acAPR greater than . When making a vertical comparison to consider transaction fees, the difference is more pronounced. Our results show that of stETH liquidity provision positions experience a negative \acAPR, whereas the majority () of rETH liquidity provision positions achieved a positive \acAPR.
We also note that the performance of liquidity provision for the same \acLSD varies among different \acDEX pools. When comparing rETH liquidity provision on Uniswap V3 and Balancer, we observe that users on Uniswap V3 are more likely to achieve higher \acpAPR. This difference may be attributed to the concentrated liquidity design of Uniswap V3 [26], allowing users to enhance capital efficiency through liquidity provision.
V-B \acLSD Liquidity Provision vs Holding Strategy
Users are incentivized to supply \acpLSD for liquidity provision instead of simply holding them due to the prospect of increased profitability. Consequently, we undertake an empirical study to analyze the \acpPNL associated with these two strategies.
| (5) |
The user has the opportunity to accumulate \acLSD staking rewards through both strategies, but it’s crucial to note that the staking reward for liquidity provision differs from that of holding \acpLSD, primarily due to the impact of swaps within the liquidity pool. Furthermore, \acpLSD with different token mechanisms implement varied approaches to distribute staking rewards. stETH adopts a rebasing model, while rETH utilizes a reward-bearing model, changing the price of rETH at time for reward distribution. Hence, the quantity of ETH remains unchanged at time , whereas the price and quantity of \acpLSD change based on the underlying token mechanisms. The \acPNL of the holding strategy can be derived using Eq. 5.
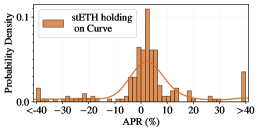
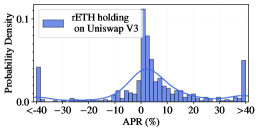
Empirical Analysis. For the identified liquidity positions, we simulate their portfolio value at as if users had chosen to hold the corresponding \acLSD. As rETH is based on a reward-bearing model (cf. Fig. 1), the holding amounts at and are the same, i.e., . For stETH, which is based on a rebasing model, we query the underlying Lido contracts to obtain the values of and at a given time and apply Eq. 1 to compute the newly holding amount of stETH at . We finally calculate the holding \acPNL and \acAPR by using Eq. 5.
In total, we find that identified liquidity positions can achieve a higher \acAPR by holding the \acpLSD than supplying it to \acpDEX. Specifically, as depicted in Fig. 15, the distribution of the holding \acAPR for both stETH and rETH closely approximates a normal distribution, with average values ranging between and . By comparing the net holding \acAPR in Fig. 15(a) and the net \acAPR of stETH liquidity provision on Curve in Fig. 14(a), it becomes apparent that users are likely to achieve a positive \acAPR if they opt to hold stETH or rETH in their wallets. This is primarily because they can avoid incurring transaction fees associated with adding and removing liquidity on Curve. Conversely, users who choose to provide rETH on Uniswap V3 may have a higher probability (see the bars of “” in Figures 14(b) and 15(b)) of attaining a substantial \acAPR compared to holding rETH, but they also face an increased risk of potential asset losses (see the bars of “” in Figures 14(b) and 15(b)).
VI Conclusion
This paper provides an empirical study on \acpLSD. We systematize the existing \acLSD token mechanisms and their functionality in the distribution of staking rewards. Subsequently, we quantify price discrepancies for stETH and rETH across primary and secondary markets. We identify the historical arbitrages associated with \acpLSD, analyze strategies adopted by arbitrageurs, and shed light on potential entry barriers within this domain. Moreover, we measure the \acAPR achieved by \acpLP who supply \acpLSD to \acpDEX. We hope that our study can inspire further research into the analysis and design of \acpLSD.
References
- [1] S. Nakamoto, “Bitcoin: A peer-to-peer electronic cash system,” 2008. Available at: https://bitcoin.org/bitcoin.pdf.
- [2] G. Wood, “Ethereum: A secure decentralised generalised transaction ledger,” Ethereum project yellow paper, vol. 151, pp. 1–32, 2014.
- [3] P. Daian, R. Pass, and E. Shi, “Snow white: Robustly reconfigurable consensus and applications to provably secure proof of stake,” in International Conference on Financial Cryptography and Data Security, pp. 23–41, Springer, 2019.
- [4] V. Buterin, D. Hernandez, T. Kamphefner, K. Pham, Z. Qiao, D. Ryan, J. Sin, Y. Wang, and Y. X. Zhang, “Combining ghost and casper,” arXiv preprint arXiv:2003.03052, 2020.
- [5] P. Gaži, A. Kiayias, and D. Zindros, “Proof-of-stake sidechains,” in 2019 IEEE Symposium on Security and Privacy (SP), pp. 139–156, IEEE, 2019.
- [6] A. Kiayias, A. Russell, B. David, and R. Oliynykov, “Ouroboros: A provably secure proof-of-stake blockchain protocol,” in Annual International Cryptology Conference, pp. 357–388, Springer, 2017.
- [7] Y. Zhang, Q. Wang, S. Chen, and C. Wang, “How to rationally select your delegatee in pos,” arXiv preprint arXiv:2310.08895, 2023.
- [8] S. Scharnowski and H. Jahanshahloo, “The economics of liquid staking derivatives: Basis determinants and price discovery,” Available at SSRN 4180341, 2023.
- [9] X. Xiong, Z. Wang, X. Chen, W. Knottenbelt, and M. Huth, “Leverage staking with liquid staking derivatives (lsds): Opportunities and risks.” Cryptology ePrint Archive, Paper 2023/1842, 2023. https://eprint.iacr.org/2023/1842.
- [10] A. Tzinas and D. Zindros, “The principal–agent problem in liquid staking,” Cryptology ePrint Archive, 2023.
- [11] S. Werner, D. Perez, L. Gudgeon, A. Klages-Mundt, D. Harz, and W. Knottenbelt, “Sok: Decentralized finance (defi),” in Proceedings of the 4th ACM Conference on Advances in Financial Technologies, pp. 30–46, 2022.
- [12] E. Jiang, B. Qin, Q. Wang, Z. Wang, Q. Wu, J. Weng, X. Li, C. Wang, Y. Ding, and Y. Zhang, “Decentralized finance (defi): A survey,” arXiv preprint arXiv:2308.05282, 2023.
- [13] D. Grandjean, L. Heimbach, and R. Wattenhofer, “Ethereum proof-of-stake consensus layer: Participation and decentralization,” arXiv preprint arXiv:2306.10777, 2023.
- [14] C. Schwarz-Schilling, J. Neu, B. Monnot, A. Asgaonkar, E. N. Tas, and D. Tse, “Three attacks on proof-of-stake ethereum,” in International Conference on Financial Cryptography and Data Security, pp. 560–576, Springer, 2022.
- [15] S. Agrawal, J. Neu, E. N. Tas, and D. Zindros, “Proofs of proof-of-stake with sublinear complexity,” arXiv preprint arXiv:2209.08673, 2022.
- [16] W. Tang and D. D. Yao, “Transaction fee mechanism for proof-of-stake protocol,” arXiv preprint arXiv:2308.13881, 2023.
- [17] E. Kapengut and B. Mizrach, “An event study of the ethereum transition to proof-of-stake,” Commodities, vol. 2, no. 2, pp. 96–110, 2023.
- [18] “The merge,” 2023. Available at: https://ethereum.org/en/roadmap/merge/.
- [19] “Eip-4895: Beacon chain push withdrawals as operations,” 2022. Available at: https://eips.ethereum.org/EIPS/eip-4895.
- [20] F. Cassez, J. Fuller, and A. Asgaonkar, “Formal verification of the ethereum 2.0 beacon chain,” in International Conference on Tools and Algorithms for the Construction and Analysis of Systems, pp. 167–182, Springer, 2022.
- [21] T. G. Andersen and T. Teräsvirta, “Realized volatility,” in Handbook of financial time series, pp. 555–575, Springer, 2009.
- [22] M. McAleer and M. C. Medeiros, “Realized volatility: A review,” Econometric reviews, vol. 27, no. 1-3, pp. 10–45, 2008.
- [23] A. Briola, D. Vidal-Tomás, Y. Wang, and T. Aste, “Anatomy of a stablecoin’s failure: The terra-luna case,” Finance Research Letters, vol. 51, p. 103358, 2023.
- [24] D. B. Hausch and W. T. Ziemba, “Arbitrage strategies for cross-track betting on major horse races,” Journal of Business, pp. 61–78, 1990.
- [25] D. Wang, S. Wu, Z. Lin, L. Wu, X. Yuan, Y. Zhou, H. Wang, and K. Ren, “Towards a first step to understand flash loan and its applications in defi ecosystem,” in Proceedings of the Ninth International Workshop on Security in Blockchain and Cloud Computing, pp. 23–28, 2021.
- [26] X. Xiong, Z. Wang, W. Knottenbelt, and M. Huth, “Demystifying just-in-time (jit) liquidity attacks on uniswap v3,” Cryptology ePrint Archive, 2023.
Supplementary Information
| (6) |
| (7) |
Eq. 6 and 7 are used to calculate the price discrepancy between the \acLSD primary market and secondary market.
Table I summarizes the information of rETH arbitrages on Unsiwap V3 and Balancer. Fig. 19 shows the staking options on Ethereum. Fig. 18 depicts the profit distribution for rETH arbitrages with staking ETH. Fig. 18 shows the distribution of \acLSD trading volume on three \acpDEX over time.
| Contracts | # Arbitrageurs | # Arbitrages on Balancer | # Arbitrages on UniswapV3 | Arbitrage Profit (ETH) | Arbitrage Amount (ETH) | Arbitrage Interval | Code Public | Code Type | Flash Loan |
| 0x1f7…571 | 329 | 1406 | 497 | 1257.8 | 30433.5 | 2022/11/07-2023/03/07 | ✓ | Vyper | ✓ |
| 0x000…071 | 1 | 124 | 631 | 159.8 | 14117.9 | 2022/12/09-2023/04/16 | ✗ | - | |
| 0x000…14C | 1 | 311 | 62 | 181.0 | 6771.4 | 2022/10/29-2022/12/02 | ✗ | - | |
| 0x005…200 | 2 | 0 | 194 | 16.1 | 2761.5 | 2022/10/28-2023/04/17 | ✗ | - | |
| 0xE46…828 | 24 | 80 | 28 | 79.3 | 1807.1 | 2023/01/24-2023/04/18 | ✓ | Vyper | ✓ |
| 0xa03…f61 | 1 | 0 | 95 | 13.8 | 1519.2 | 2023/01/17-2023/02/03 | ✗ | - | |
| 0x000…d00 | 4 | 81 | 10 | 61.3 | 1482.6 | 2022/11/01-2023/04/13 | ✗ | - | |
| 0x7FB…a52 | 1 | 33 | 19 | 28.8 | 1292.8 | 2022/10/18-2022/10/29 | ✗ | - | |
| 0x294…C72 | 2 | 22 | 14 | 20.3 | 551.5 | 2022/12/13-2023/03/12 | ✗ | - | |
| 0x6fC…dc2 | 8 | 0 | 22 | 1.3 | 483.8 | 2023/03/30-2023/04/18 | ✓ | Solidity | ✓ |
| 0x6C6…64e | 1 | 0 | 20 | 0.5 | 229.9 | 2022/11/03-2022/12/01 | ✗ | - | |
| 0x1c0…4c3 | 1 | 19 | 0 | 292.8 | 4418.8 | 2023/04/18-2023/08/07 | ✗ | - | |
| 0xb7E…74b | 1 | 17 | 0 | 13.6 | 271.9 | 2023/02/04-2023/02/20 | ✗ | - | |
| 0x7f0…00d | 1 | 0 | 17 | 1.1 | 271.9 | 2023/01/09-2023/01/13 | ✗ | - | |
| 0x700…d6d | 1 | 0 | 15 | 1.5 | 239.9 | 2023/02/11-2023/02/15 | ✗ | - | |
| 0x589…88F | 1 | 0 | 12 | 0.2 | 304.3 | 2022/10/26-2022/11/02 | ✗ | - | |
| 0xA7b…E3f | 1 | 6 | 5 | 5.9 | 175.9 | 2023/03/15-2023/03/25 | ✗ | - | |
| 0x16D…11c | 1 | 0 | 10 | 0.2 | 357.3 | 2023/04/16-2023/04/18 | ✗ | - | |
| 0xA90…5d1 | 1 | 8 | 1 | 5.2 | 144.0 | 2022/11/03-2022/11/06 | ✗ | - | |
| 0x05A…d9E | 1 | 0 | 8 | 0.9 | 127.9 | 2023/02/20-2023/03/07 | ✗ | - | |
| 0x91A…a8e | 1 | 0 | 7 | 0.8 | 135.0 | 2022/12/04-2023/03/15 | ✗ | - | |
| 0x86e…e71 | 2 | 6 | 0 | 129.9 | 2161.5 | 2023/04/05-2023/04/10 | ✗ | - | |
| 0x1A6…d8a | 1 | 6 | 0 | 4.8 | 96.0 | 2023/01/30-2023/02/02 | ✗ | - | |
| 0x321…c7b | 1 | 4 | 0 | 12.5 | 343.8 | 2022/09/19-2022/09/23 | ✓ | Solidity | ✓ |
| 0xF33…742 | 2 | 0 | 3 | 0.2 | 374.8 | 2023/05/13-2023/05/20 | ✗ | - | |
| 0x414…507 | 1 | 3 | 0 | 2.4 | 48.0 | 2023/02/27-2023/03/05 | ✗ | - | |
| 0xCCf…923 | 1 | 3 | 0 | 23.2 | 337.7 | 2023/06/11-2023/06/15 | ✗ | - | |
| 0xc68…ee4 | 1 | 0 | 3 | 0.5 | 48.0 | 2023/02/17-2023/02/18 | ✗ | - | |
| 0xcb3…255 | 2 | 0 | 2 | 0.2 | 362.9 | 2023/05/12-2023/05/14 | ✗ | - | |
| 0xEEE…35e | 2 | 2 | 0 | 46.4 | 649.7 | 2023/07/12-2023/08/01 | ✗ | - | |
| 0x6C6…d45 | 1 | 1 | 0 | 6.5 | 174.9 | 2022/09/23-2022/09/23 | ✗ | - | |
| 0x0c1…d05 | 1 | 1 | 0 | 8.3 | 119.9 | 2023/06/23-2023/06/23 | ✗ | - | |
| 0x43a…420 | 1 | 1 | 0 | 4.5 | 124.9 | 2022/09/20-2022/09/20 | ✗ | - | |
| 0xD05…05d | 1 | 0 | 1 | 0.1 | 16.0 | 2022/12/02-2022/12/02 | ✗ | - | |
| 0xf35…94D | 1 | 1 | 0 | 2.0 | 32.0 | 2023/04/18-2023/04/18 | ✗ | - |