Wave mechanics in an ionic liquid mixture
Abstract
Experimental measurements of interactions in ionic liquids and concentrated electrolytes over the past decade or so have revealed simultaneous monotonic and oscillatory decay modes. These observations have been hard to interpret using classical theories, which typically allow for just one electrostatic decay mode in electrolytes. Meanwhile, substantial progress in the theoretical description of dielectric response and ion correlations in electrolytes has illuminated the deep connection between density and charge correlations and the multiplicity of decay modes characterising a liquid electrolyte. The challenge in front of us is to build connections between the theoretical expressions for pair correlation functions and the directly measured free energy of interaction between macroscopic surfaces in experiments. Towards this aim, we here present measurements and analysis of the interactions between macroscopic bodies across a fluid mixture of two ionic liquids of widely diverging ionic size. The measured oscillatory interaction forces in the liquid mixtures are significantly more complex than for either of the pure ionic liquids, but can be fitted to a superposition of two oscillatory and one monotonic mode with parameters matching those of the pure liquids. We discuss this empirical finding, which hints at a kind of wave mechanics for interactions in liquid matter.
1 Introduction
The nano-scale structure and its relation to particle interactions in ionic liquid mixtures is important for many applications ranging from directed synthesis to the optimisation of electrolytes in batteries1, 2, 3. In this article we present new experimental measurements of the interactions between macroscopic objects immersed in a mixture of two ionic liquids, measured using a surface force balance (SFB). Our results for mixtures of ionic liquids are quite complex compared to those for pure ionic liquids, so we begin with a brief discussion of the fundamental relation between measured interaction force between macroscopic surfaces or particles and the bulk liquid’s structure and interactions. Theoretical relationships of this sort are already well established in general terms, but become complicated quickly with increasing complexity of the fluid and so are not always easily applied to realistic experimental scenarios.
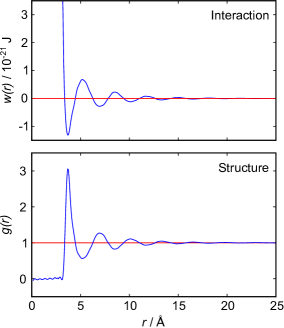
The intimate relationship between liquid structure and interactions can be illustrated by reference to the simple case of liquid argon, for which direct measurements of the pair distribution function, , have been obtained from neutron scattering measurements4 as reproduced in figure 1. In general, is related to the pair potential of mean force, , in a 1-component atomic fluid by:
| (1) |
where is the distance between two particles5. We see that and are comprised of a decaying oscillation, which reflects intermolecular repulsions and packing constraints as expected for a simple fluid at high density6. At low density, by contrast, excluded volume and many-body effects become insignificant and tends towards , the mean field pair potential; oscillations of the sort apparent in figure 1 then disappear and intermolecular attractions dominate the behaviour5.
Detailed calculations for simple atomic fluids capture this experimental behaviour well7, 8. With the only length scales arising from particle size and density, it is found that will contain one term, or mode. This mode may be oscillatory at high densities, dominated by density correlations, or monotonic at low densities. The transition from monotonic to oscillatory decay in extends beyond the critical point and the cross-over has been called the Fisher-Widom line9.
Most real liquids are far more complex than liquid argon; they cannot be parameterised simply by density and radius alone. Instead one would need to consider parameters capturing geometry, charge, charge distribution, polarizability, etc. in order to build a full picture of the structure and interactions within the fluid. Most particularly, electrostatic interactions arising from Coulomb interactions between ionic species in the liquid act over long range and so give rise to significant deviations from mean-field behaviour even at very low concentration. The most famous attempt to quantify the charge distribution in electrolytes is the Debye-Hückel theory which is built from the Poisson-Boltzmann equation, both of which involve strong approximations10. The key result of the Debye-Hückel theory is that the charge distribution and electrostatic potential away from a charged particle decay in a plain exponential manner (compared to the Coulomb power-law decay without ‘screening’). Soon after the Debye-Hückel theory, statistical analysis by Kirkwood of electrolyte properties over a wide range of concentrations predicted the fascinating result that that the charge-charge distribution function switches from plain exponential decay to a damped oscillatory decay at high charge density. Although reminiscent of the crossover in particle density decay at the Fischer-Widom line mentioned above, these electrostatic charge-waves have a different origin and the boundary between plain exponential and oscillatory charge decay has been called the Kirkwood line.11, 12, 13
Although the concepts of Debye screening (at low ion concentration) and the Kirkwood crossover from monotonic to oscillatory charge-charge correlations at high ion concentration are useful heuristic ideas for interpreting interactions in electrolytes, they cannot fully capture real electrolyte behaviour because they arise from theories which do not take into account the correlation between all ions in the electrolyte. A theoretical framework addressing this issue is the dressed ion theory14, which has resulted in many important insights. A key result in the analysis of interactions in electrolytes relevant to our discussion here is that multiple decay modes contribute additively to , , to the pair correlation function, , and to the screened Coulomb potential, 13. The decay modes for the pair correlation function take the form:
| (2) |
where the first bracketed term on the right implies that there are other monotonic Yukawa (i.e. ) terms, and the second bracketed term on the right implies further oscillatory Yukawa terms13. is a mode-specific ( dependent) effective charge for particle , is the effective relative dielectric permittivity (also dependent) and is a phase shift for the oscillation. Equation 2 applies to spherical ions, but similar general expressions describe the decay for any geometry. (The same terms appear in , which can be seen by noting that asymptotically from equation 1.) It is seen that each monotonic term is described by a single decay parameter (the first one is above), and each oscillatory term is described by two parameters (e.g. and above). These decay parameters are solutions to the general equation for 15, 13:
| (3) |
where is the density of ion in the bulk electrolyte, is its bare charge, is its renormalised charge, and is the dielectric factor13. Equation 3 is an equation for with many solutions, leading to the many decay modes in equation 2. The solutions can be real, in which case the mode in the correlation function will be a monotonic Yukawa function with decay length , or pairs of complex conjugates giving rise to an oscillatory Yukawa term with decay length and wavelength . Equation 3 reduces to the expression for the Debye-Hückel screening parameter, , as and only in this limit is there just one decay mode (characterised by the Debye-Hückel screening lenghth, ). In all real electrolytes, there is more than one decay mode and more than one screening length.
The decay modes contributing to the pair correlation function also feature in the potential of mean force (per unit area) between two macroscopic surfaces, , as relevant to our experiments with a surface force balance (SFB)15, 16. That is to say:
| (4) |
where, again, the two brackets indicate that more terms of the monotonic and oscillatory decaying type exist. Each term, or mode, is characterised by a decay parameter (and, for the oscillatory mode, a wavelength) which are identical to the parameters which define the bulk pair correlations and pair potential of mean force, as above. The constants , etc depend on the effective charge on the surfaces.
Since the terms in decay at different rates, the overall value of may be dominated by different modes at different ranges of . That is to say, as two planar surfaces approach one another from large distances, they may go through regions of where the interaction is dominated by a monotonically increasing interaction and other regions where the interaction is oscillatory. Indeed, many past experiments with any kind of electrolyte, ranging from dilute electrolytes to pure ionic liquids can be interpreted in this framework.
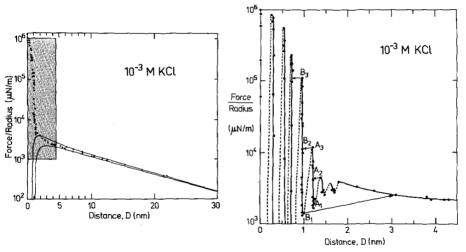
We illustrate this interpretation of by inspection of three example measurements. First, let us consider the measured interaction force across dilute aqueous electrolyte solutions; one of the first examples of such a measurement, for M \ceKCl aqueous solution by Pashley and Israelachvili, is reproduced in figure 2. Similar measurements have been made more recently, revealing similar key features17. At large surface separations a monotonic repulsive interaction acts between the two charged surfaces; at small surface separations the interactions are dominated by an oscillating interaction with a wavelength of nm. Within the framework above, two modes are apparent. The monotonic mode originates mostly from the ion correlations and is similar to the Debye-Hückel prediction at low ionic concentration but not precisely the same, and the oscillatory mode is due primarily to density correlations between the solvent molecules. The reason for the words ‘mostly’ and ‘primarily’ in the previous sentence is that, in fact, all correlations in the electrolyte contribute to each of the decay modes. That is to say, the decay modes cannot – in general – be separated into terms which arise purely from charge-charge correlations, density-density correlations, etc.16. However, in some cases (such as a very dilute electrolyte) it is possible to provide a physical interpretation of the ‘origin’ of each mode in terms of the components of the electrolyte. The contrast between this description and the usual terminology of electrostatic double-layer forces and hydration forces may seem a purely semantic distinction for this example, but as we shall see later the interpretation of interactions in more complex mixtures or higher electrolyte concentration cannot be accommodated without the more precise formulation.
A second example measurement to interpret in light of the dressed ion theory analysis is that of the interaction measured across a pure ionic liquid, of which there have been many over recent years18, 19; further examples are presented later in this manuscript. In these measurements, two decay modes are again observed: somewhat like the dilute electrolyte case, a monotonic decay dominates at long range, while an oscillatory decaying mode dominates at shorter range. The oscillatory part typically has a wavelength close to the ion pair dimension, and so is interpreted as ‘ion layering’ or, equivalently, an oscillatory mode arising predominantly from charge-charge correlations. The monotonic part of the interaction, which is enormously longer-ranged than can be explained from the Debye-Hückel picture alone20, has been called ‘underscreening’ and has been the subject of some debate21, 22, 23, 24, 25. Within the framework of the dressed ion theory, we understand that a monotonically decaying mode can arise in an ionic liquid when the effective charge is low, and recalling that this effective charge comes from the non-linear part of the screening cloud which has the size of the decay length. Physically, this could arise from strong ion correlations (i.e. strong nonlinearity), or associations, of the sort intuited by Pincus and Safran26.
A final example illustrating the insight obtained from this framework is the interaction across ionic liquids containing long-chain cations which are known from scattering experiments to be nanostructured in the bulk fluid. Neutron and X-ray scattering techniques reveal that several short-range structural modes contribute to the bulk structure of pure ionic liquids27, 28, 29, 30: these arise from nearest neighbour interactions concerning the solvation shell around each ion; from charge ordering interactions, which determine the distribution of cations around cations and anions around anions at intermediate length scales; and from the segregation of the non-polar regions of molecular ions away from the charged regions, leading to nanostructured domains at a longer length scale. This third lengthscale in the bulk scattering typically emerges when non-polar chains on the ionic liquid ions are carbon atoms long. Measurements of the surface forces across ionic liquids with increasing hydrocarbon chain length also reveal the appearance of this latter nonpolar nanostructural lengthscale: the measured oscillatory force across longer chain ionic liquids contains an oscillatory force with wavelength consistent with nonpolar ordering – or ‘bilayers’ as the repeat unit between the surfaces31, 32. However, it is not clear why the nonpolar ordering dominates over charge ordering in the surface force measurement, and the interpretation of a sharp structural transition is unsatisfactory for the implication of a phase instability which ought to give rise to an attractive interaction at some range – which is not seen. Instead, we can interpret these measurements as follows. The long-chain ionic liquids support multiple modes in the bulk fluid, including modes arising from their charge- and geometric- asymmetry; some of these are revealed as peaks in the bulk scattering patterns. The surface force measurement picks up some but not all of these modes, i.e. the pre-exponential factors in equation 4, which are determined by the affinity of the surfaces for a particular mode, can be large for some modes and small or zero for others. That is, only some modes resonate with the SFB cavity.
From these examples, we see that the cavity between the mica sheets in the SFB creates a kind of electrostatic resonator, detecting some (but not all) of the modes (decay terms in equations 2 and 4) which define the decay of correlations and density in the bulk fluid. Different modes will dominate at different distances. Related to the requirement that a mode resonate with the mica cavity, in an SFB experiment the amplitudes of the measured modes can vary over a very wide range. We revisit this point later for its relevance to interpretation of the underscreening mode.
In the remainder of the manuscript we present results from direct experimental measurements of the interaction force between atomically smooth mica plates across ionic liquids and their mixtures, measured using a surface force balance (SFB). As we shall see, the results are quite complex and certainly could not be interpreted in the simple physical manner that has been applied before for dilute electrolytes and some aspects of more concentrated electrolytes. Thus, their interpretation presents a useful challenge to the mode analysis outlined above. The interaction force directly gives the free energy of interaction and thus , and the elegant connections between (macroscopic) and (microscopic) , and proposed by the dressed ion theory provides a direct route to some decay modes and parameters which describe correlations in the bulk ionic fluids. We discuss and interpret our measured forces in this way and in doing so hope to better understand the relationship between structure and correlations within electrolytes and the interaction of macroscopic bodies across them.
2 Methods
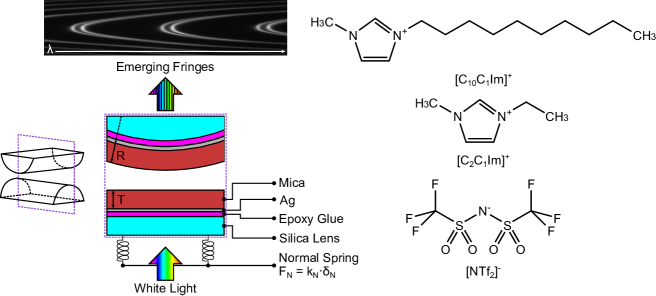
We used the Surface Force Balance (SFB) to measure the interaction force as a function of separation distance between atomically smooth mica sheets across ionic liquids and ionic liquid mixtures. The apparatus and its operating principles has recently been described elsewhere33, 34. The mica sheets are ruby muscovite (S&J Trading Inc.), cleaved in a particle-free environment on both faces to give atomically smooth sheets of centimetric area and precisely uniform thickness across the whole area in the range . A silver layer of thickness 45 nm is deposited onto the mica sheets, which are then cut to size and glued, silver side down, to a hemicylindrical glass lens with radius 0.01 m. Two lenses, prepared from the same mica sheet to ensure identical mica thickness on each lens, are then mounted vertically in the SFB instrument in a crossed-cylinder arrangement such that the mica surfaces face one another, as shown in figure 3. The lower lens rests on a horizontal leaf spring of known spring constant . Collimated white light is shone normal to the two lenses. The silver mirrors on the back of each mica surface form an interferometric cavity, with emerging light taking the form of a series of fringes of equal chromatic order (FECO). Analysis of the FECO allows precise determination of the surface separation, with an accuracy of 0.5 nm and a precision of 0.1 nm.
The first stage of each experiment involves bringing the mica sheets into direct contact in dry air to measure (calibrate) the mica thickness, . Subsequently, a fluid of interest is injected between the lenses, and the lenses are then approached or retracted in a linear fashion using a mechanical or piezoelectric drive. If interaction forces act between the surfaces, the spring upon which the lower surface is mounted deflects by a small amount which appears in the analysis of the FECO as a deviation from the applied linear motion. The interaction force between crossed cylinders , can be calculated from Hooke’s law. is related to the free energy of interaction per unit area at the same distance between parallel plates by the Derjaguin approximation:
| (5) |
where is the radius of curvature of the cylinders.This approximation holds when , as is the case in all of the measurements we show here.
The SFB force runs reported here typically start from distances of 200 nm, and the approach and retraction speeds are nm s-1. Taking account of the viscosity of the ionic liquids, under these conditions we can interpret the forces measured as equilibrium forces (with no measurable velocity-dependent hydrodynamic contribution in this case)34. Furthermore, if we (crudely) assume that the ions within the confined region between the surfaces have diffusion coefficients similar to in the bulk fluid, their characteristic time to travel over 100nm is s, compared to the approach time of the surfaces of s to cover the same distance. This implies that constituent ions explore all configurations during the approach, which is therefore quasi-static from an ergodic perspective as well as from the point of view of hydrodynamics. Combined with the macroscopic area investigated, we interpret the measured interaction free energy per unit area as equal to the potential of mean force per unit area between the two macroscopic plates across the fluid, i.e. .
The ionic liquids studied are 1-ethyl-3-methylimidazolium bis(trifluoromethanesulfonyl)imide, \ce[C2C1Im][NTf2] (Iolitec, %), and 1-decyl-3methylimidazolium bis(trifluoromethanesulfonyl)imide, \ce[C10C1Im][NTf2] (Iolitec, %). Ionic liquids and mixtures were dried for approx. 24h before each experiment on a Schlenk line at mbar and +70∘C. This typically results in water content below 200ppm. The two ionic liquids have a common anion and a smilar cation headgroup, therefore varying the mole fraction in mixtures acts only to alter the fraction of shorter and longer alkyl chains in the ionic fluid. The molecular structures of the ions is shown alongside the schematic of the SFB in figure 3. Experiments were carried out for mixtures of the two ionic liquids at \ce[C2C1Im][NTf2] mole fractions of 0.0, 0.1, 0.3, 0.5, 1.0. Each experiment involves a freshly cleaved pair of mica sheets. Within each experiment multiple experimental runs are made over several hours, including runs at different contact spots on the mica sheets. Fitted values in the following section arise from averages across multiple runs. For clarity in presentation of the results we show single example measurements in the figures within this manuscript, however all measurement runs, from which the averages were obtained, are available within the supporting data files [Here we will provide link to Oxford Research Archive Data deposit]
3 Results and Discussion
Pure Ionic Liquids.
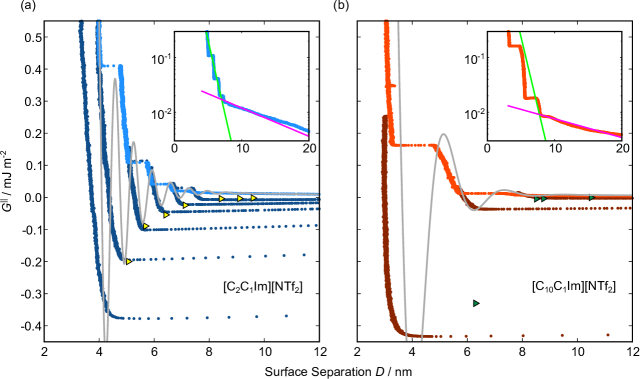
Measurements of the interaction force as a function of separation distance between mica sheets across one short-chain ionic liquid, \ce[C2C1Im][NTf2] and one longer chain ionic liquid, \ce[C10C1Im][NTf2], are presented in figure 4(a) and (b), respectively, with the measured force plotted as . Qualitatively, the results for the two pure ionic liquids show similar features: in each case, we observe an oscillatory region in the profile at surface separations between about 3 and 10 nm, defined by a series of repulsive walls and attractive wells measured during approach and retraction of the mica surfaces. The oscillations appear to decay exponentially as the surface separation is increased. At surface separations greater than about 10 nm the interaction is dominated by a longer-range monotonic component which also appears to decay exponentially as the surface separation is increased (see inset semi-log plot).
The observation of two distinct decay modes, one damped oscillatory and one plain exponential, is reminiscent of many previous measurements of interaction forces in pure ionic liquids35, 36, 31, 37, 38, 39, 20, 18, 19 and can be interpreted as two dominating terms contributing to the overall potential of mean force as in equation 4. We therefore parameterise the measured interaction as follows:
| (6) |
where the first term in the right hand side of equation 6 describes the short range oscillating exponential decay mode, with magnitude , exponential decay length , oscillatory wavelength , and oscillatory offset ; and the second term describes the long range monotonic exponential decay mode, with magnitude and exponential decay length . Note that the experimental decay lengths , and wavelength mirror the theoretical decay lengths , and wavelength from equation 2; we maintain separate notation for the experimentally fitted values so as not to imply any exact equality to the ideal theoretical expressions. The fits to equation 6 are shown superimposed on the data in figure 4 and the fitted values for each ionic liquid are given in table 1. (See SI figure 1 for an example of the fitting procedure.)
| Parameter | \ce[C2C1Im] [NTf2] | \ce[C10C1Im] [NTf2] |
|---|---|---|
| / mJ m-2 | 100 60 | 92 69 |
| / nm | 0.81 0.10 | 0.84 0.17 |
| / nm | 0.67 0.03 | 2.20 0.15 |
| / nm | 0.1 0.5 | 1.3 0.5 |
| / mJ m-2 | 0.040 0.011 | 0.017 0.007 |
| / nm | 8.33 2.40 | 12.68 3.43 |
As discussed in the introduction, intuitive rationalisation of oscillatory forces across short-chain ionic liquids (as in fig. 4(a)) in the past has been based on the close similarity of the oscillatory wavelength, , to the cation-cation or anion-anion correlation length in the bulk fluid. For \ce[C2C1Im] [NTf2], the measured wavelength of 0.67 nm is close to the mean ion pair diameter of nm, (equivalent to the charge-charge correlation length). The oscillations are interpreted as arising from sequential squeeze-out of repeat-units consisting of layers of cations and anions. For the longer chain ionic liquids, as in fig. 4(b), the wavelength of 2.20 nm is much longer than the mean ion pair diameter ( nm) and matches more closely the nonpolar-nonpolar correlation length. This seems to imply sequential squeeze-out of ionic liquid bilayers comprised of cations arranged in tail-to-tail bilayer repeat units31, 32, 40.
Alternatively, the surface interactions in fig. 4(a) and (b) could be described in terms of the dominating modes, i.e. those terms which resonate most strongly in the z-direction of the SFB cavity. For \ce[C2C1Im] [NTf2], the dominating mode between mica surfaces at 3-10 nm separation is the charge-charge correlation mode, whereas for \ce[C10C1Im] [NTf2] the dominating mode in the SFB cavity is the nano-structuring mode - we observe the mode that corresponds to the organisation of the amphiphilic cation nonpolar tails. Other structural modes exist in the , for example the charge-charge correlation and the density-density correlation of headgroups in \ce[C10C1Im] [NTf2], but these do not resonate in the cavity – i.e. their respective prefactors in eq. 4 are small – and so are not picked up in the measurement. It is interesting to consider why, from a molecuar perspective, the nonpolar correlations dominate over the charge-charge correlations for the long chain ionic liquids. In a self-assembled bilayer structure the charge-charge correlation is in the plane of the bilayer while the nonpolar correlation is perpendicular to the plane. Therefore, in the cavity of the SFB, which detects modes resonating perpendicular to the mica surfaces, the fact that only one of these modes is picked up in the measurement indicates that the nanostructure is composed to some large extent of bilayer-like structures arranged parallel to the surfaces.
The long range mode that is observed in both pure ionic liquids, as shown in the insets of figure 4, is attributed to underscreening38, 41, as mentioned in the introduction. We return to discuss this later, in light of results for the mixtures.
Ionic Liquid Mixtures
Figure 5 shows the interaction-distance profiles collected in the ionic liquid mixtures. In each mixture, we again observe two well defined regions: at surface separations of nm, we see a series of attractive and repulsive interactions. At surface separations nm the interaction is dominated by a longer range monotonic repulsive interaction, as will be shown later.
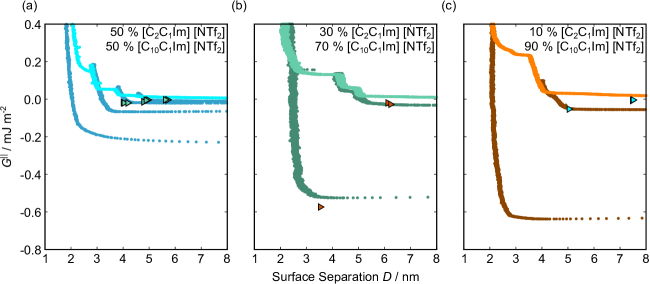
The short-range forces across these ionic liquid mixtures cannot be described by a single damped oscillating mode. In the case of 50 mol % \ce[C2C1Im] [NTf2] the oscillations appear to have an approximately uniform wavelength, but as the concentration of \ce[C2C1Im] [NTf2] is reduced to 30 and then 10 mol %, the form of the measured interaction profiles become much more complex. In each case, the interaction profile shows non-monotonic trends in the positions of maxima and minima. Distances between maxima and minima are also non-uniform, and may be smaller than 0.5 nm or larger than 1.5 nm, within the same profile. We emphasise that, despite their irregular form, these measurements were found to be highly reproducible over hours of measurement time; the features of of 30 and 10 mol % \ce[C2C1Im] [NTf2] are shown in more detail in the supporting information.
Clearly, we cannot rationalise the form of these irregular repulsions and attractions using intuitive arguments about ion layers and bilayers. However, we can attempt a model for the measurement based on the expected decay modes present in the bulk liquid mixture. To reiterate, the bulk fluid will be characterised by correlation functions, , containing many terms, of the monotonic Yukawa or oscillatory Yukawa types only, as in equation 2. Some of these modes will be similar to the modes present in the pure ionic liquids (e.g. cation-anion density correlations), while some will be particular to the mixture (e.g. cation–cation correlations between the two types of cation). Of these, some (but not all) modes will appear in the measurement of surface forces. A reasonable starting point for fitting the data is to assume that each of the oscillatory modes present in SFB measurements for pure ionic liquids may contribute to interactions in the mixture. We take only a single monotonic mode, since the data show no hint of two plain exponential decays; the monotonic underscreening mode is discussed later. Thus we write as a trial function:
| (7) |
where the superscript ′ refers to fixed parameters taking the values from pure \ce[C2C1Im][NTf2] and ′′ to fixed parameters calculated for \ce[C10C1Im][NTf2], as given in table 1. The first term in equation 7 represents the contribution to the interaction from the charge ordering mode of \ce[C2C1Im][NTf2] and the second term the contribution from the bilayer mode of \ce[C10C1Im][NTf2]. and are fitting parameters describing the magnitude of each oscillatory term, and therefore the ‘weight’ of the contribution of each pure liquid to the overall interaction-distance profile. and are offsets for each oscillatory term. The parameters for the third term on the right, the monontonically decaying mode (underscreening), are discussed later. The best fit values for , , , and are determined manually and are given in table 2 and shown superimposed on the experimental measurements in figure 6.
| Mole % | |||||
|---|---|---|---|---|---|
| \ce[C2C1Im] [NTf2] | / mJ m-2 | / nm | / mJ m-2 | ||
| 100 | 100 | 0.1 | 0 | 0 | N/A |
| 50 | 6.4 | 0.09 | 1.6 | 0 | 4 |
| 30 | 11 | 0.5 | 13 | 0 | 0.85 |
| 10 | 7.2 | 0.4 | 14 | 0.7 | 0.51 |
| 0 | 0 | 0 | 92 | 1.3 | N/A |
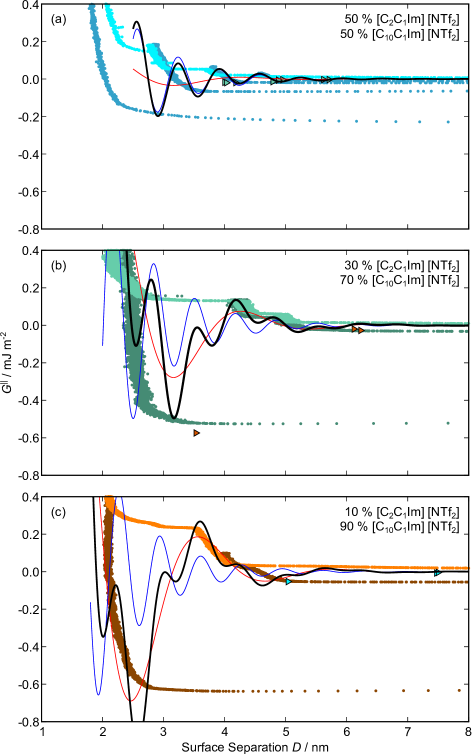
Remarkably for such a simple model, the fits are able to capture much of the complex behaviour of the recorded interaction profiles. For 50 mol % \ce[C2C1Im][NTf2], the major contribution comes from the charge-charge (shorter wavelength) term, although the amplitude is substantially less than for pure \ce[C2C1Im][NTf2]. The non-monotonic progression of maxima and minima seen at 30 and 10 mol % \ce[C2C1Im][NTf2] are reproduced when both the charge-charge mode and the nonpolar ordering (bilayer) modes have similar magnitudes.
One interesting feature of these fits is that the magnitudes of the fitted forces in the mixed liquids at all concentrations investigated are an order of magnitude lower than those calculated for the pure liquids. This is similar to the observation made in a mixture of an ionic liquid with a polar solvent42, in which the magnitude of the observed oscillations also fell at intermediate concentrations. That is to say, the structural modes can interfere destructively.
Unfortunately, the absolute values of the magnitudes of forces, even in the pure liquids, are highly variable between measurements; small perturbations in twist angle of the two mica sheets, in concentration and in surface chemistry can lead to large changes in the values of in equation 6. For this reason it is difficult to extract information from the absolute fitted values and , however it can be instructive to look at the ratio for a single experiment, also given in table 2, where it is clear that decreases as the mole fraction of \ce[C2C1Im][NTf2] is decreased. This makes intuitive sense - the contribution to the overall interaction potential from the modes of the liquid that is in the highest concentration dominate. This does not seem to track linearly with concentration, and at equimolar concentrations it is the charge-charge mode of \ce[C2C1Im][NTf2] that dominates the interaction. This perhaps suggests that the affinity of this mode for the surfaces is greater than that of the bilayer mode of \ce[C10C1Im][NTf2], which may be interpreted in the molecular picture as a greater ability of the long chain ionic liquid to dissolve in the short chain liquid than vice versa. Perhaps relatedly, scattering experiments in similar liquid mixtures also revealed multiple modes including the nonpolar ordering mode at high concentrations of the longer chain ionic liquid43, 44, 45.
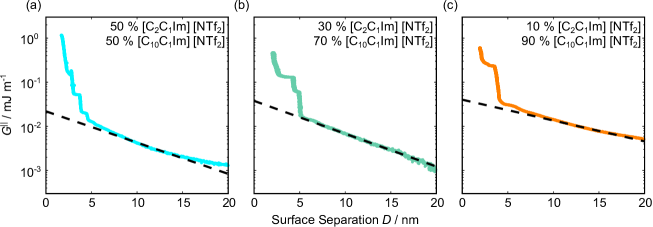
We now turn to consider the long range plain exponenetial decay measured in the mixtures, represented by the final, monotonic, mode in equation 7. Measured forces in the ionic liquid mixtures are shown on a semi-log scale and extending to greater -values in figure 7 in order to facilitate inspection of the longest decaying mode. For each of the mole ratios studied, as for the pure ionic liquids, there is a clear monotonically decaying force beyond the oscillatory force extending beyond 10 nm. Fitting these modes to the monotonic term in equation 7 gives the values as listed in table 3, where values for the pure ionic liquids are also provided for comparison.
| Mole % \ce[C2C1Im] [NTf2] | / mJ m-2 | / nm |
|---|---|---|
| 100 | 0.040 0.011 | 8.33 2.40 |
| 50 | 0.025 0.007 | 6.37 0.77 |
| 30 | 0.036 0.007 | 8.99 2.07 |
| 10 | 0.054 0.020 | 9.87 2.32 |
| 0 | 0.017 0.007 | 12.68 2.32 |
The slowly-decaying monotonic mode in ionic liquid mixtures is likely of similar origin to that reported many times for similar measurements in pure ionic liquids and discussed above; this mode has been called underscreening or anomalous underscreening25 in recognition that the charged surfaces appear less electrostically screened than predicted by mean field theories. The underscreening decay lengths range from about 6 nm to 12 nm, although there is scatter in both and (see table).
One notable observation is that, in the mixtures, only a single underscreening decay mode is observed. This contrasts with the oscillatory region of the interactions in mixtures where two oscillatory modes are superimposed. This is perhaps related to the longer-range effects which give rise to underscreening; the ion correlations which drive non-linear contributions to the correlation functions are determined by charge density distribution, but are less sensitive to the molecular details of the ions.
Another notable feature of the underscreening mode seen here for mixtures, but also for pure ionic liquids, is the very small amplitude (pre-exponential factor) of the term compared to the amplitude of oscillatory modes present in the same system. For example, comparing the numerical values of (underscreening amplitudes) in table 3 with the amplitudes of the oscillatory terms , and in table 2 we see that – despite large scatter – the underscreening is typically a factor of weaker. To detect in a single experiment or simulation both the short-range oscillatory mode, which has a short wavelength and very large amplitude, and a long range monotonic mode, with long wavelength (by factor of ) and much smaller amplitude (by factor of –) requires sufficiently high resolution over a particularly large dynamic range. This may explain why, in some cases, the underscreening mode has not been picked up in some experiments or simulations.
4 Conclusions
We have presented direct measurements of the force-distance profiles between mica sheets across the ionic liquids \ce[C2C1Im][NTf2] and \ce[C10C1Im][NTf2], and their mixtures, using a surface force balance. In the pure liquids, two modes were observed: a long range monotonic mode, characteristic of the underscreening interaction seen in high concentration electrolytes, and a short range damped oscillatory mode. For \ce[C2C1Im][NTf2] the oscillatory mode had the wavelength close to the charge-charge correlation length in the bulk fluids, while in \ce[C10C1Im][NTf2] the oscillatons corresponded to a bilayer self-assembly mode. In the mixed liquids, again at large surface separations a monotonic mode characteristic of underscreening was observed. However, at small separations the series of potential maxima and minima could no longer be fitted to a single decaying oscillation. Instead, we considered a linear superposition of the short-wavelength charge ordering mode from \ce[C2C1Im][NTf2] and the long-wavelength bilayer mode from \ce[C10C1Im][NTf2]; this simple model was able to reasonably capture the behaviour of the observed interaction-distance profiles. We introduced our work with a brief overview of how the dressed ion theory of Roland Kjellander, which provides an exact treatment of ion correlations, can be useful in describing the various contributions to the interaction free energy measured in this sort of experiment. Key messages from the theoretical side, such as the multiplicity of decay modes in all electrolytes and the necessity that these modes follow either exponentially decaying or oscillatory exponential forms, were pointed out and applied in describing the experiments. The same modes characterise the bulk correlation function, the decay of potential, and the potential of mean force between particles and also between macroscopic surfaces such as in the SFB. However the SFB cavity may only resonate with some of the modes; the manner in which the interfaces pin the waves and the possibility for wave superposition indicates a pleasing sort of wave mechanics mediated by the electrolyte solutions.
The authors would like to thank the European Research Council for financial support under grant 101001346, ELECTROLYTE. TG is also grateful to the Worcester College Taylor Scholarship. Amaar Sardharwalla is thanked for assistance with viscosity measurements. Roland Kjellander, Sam Safran and Fyl Pincus are thanked for many delightful and insightful discussions.
References
- Niedermeyer et al. 2012 Niedermeyer, H.; Hallett, J. P.; Villar-Garcia, I. J.; Hunt, P. A.; Welton, T. Mixtures of ionic liquids. Chem. Soc. Rev. 2012, 41, 7780–7802
- Mao et al. 2019 Mao, X.; Brown, P.; Červinka, C.; Hazell, G.; Li, H.; Ren, Y.; Chen, D.; Atkin, R.; Eastoe, J.; Grillo, I.; Padua, A. A. H.; Costa Gomes, M. F.; Hatton, T. A. Self-assembled nanostructures in ionic liquids facilitate charge storage at electrified interfaces. Nature Materials 2019, 18, 1350–1357
- Wang et al. 2020 Wang, Y.-L.; Li, B.; Sarman, S.; Mocci, F.; Lu, Z.-Y.; Yuan, J.; Laaksonen, A.; Fayer, M. D. Microstructural and Dynamical Heterogeneities in Ionic Liquids. Chemical Reviews 2020, 120, 5798–5877
- Yarnell et al. 1973 Yarnell, J. L.; Katz, M. J.; Wenzel, R. G.; Koenig, S. H. Structure Factor and Radial Distribution Function for Liquid Argon at 85 °K. Phys. Rev. A 1973, 7, 2130–2144
- Kjellander 2020 Kjellander, R. Statistical Mechanics of Liquids and Solutions; CRC Press, 2020; Vol. 1
- Widom 1967 Widom, B. Intermolecular Forces and the Nature of the Liquid State. Science 1967, 157, 375–382
- John-Pierre Hansen 2013 John-Pierre Hansen, I. M. Theory of Simple Liquids, 4th ed.; Academic Press, 2013
- Evans et al. 1993 Evans, R.; Henderson, J.; Hoyle, D.; Parry, A.; Sabeur, Z. A. Asymptotic decay of liquid structure: oscillatory liquid-vapour density profiles and the Fisher-Widom line. Molecular Physics 1993, 80, 755–775
- Fisher and Wiodm 1969 Fisher, M. E.; Wiodm, B. Decay of Correlations in Linear Systems. The Journal of Chemical Physics 1969, 50, 3756–3772
- Onsager 1933 Onsager, L. Theories of Concentrated Electrolytes. Chemical Reviews 1933, 13, 73–89
- Kirkwood 1936 Kirkwood, J. G. Statistical Mechanics of Liquid Solutions. Chemical Reviews 1936, 19, 275–307
- de Carvalho and Evans 1994 de Carvalho, R. L.; Evans, R. The decay of correlations in ionic fluids. Molecular Physics 1994, 83, 619–654
- Kjellander 2019 Kjellander, R. The intimate relationship between the dielectric response and the decay of intermolecular correlations and surface forces in electrolytes. Soft Matter 2019, 15, 5866–5895
- Kjellander and Mitchell 1994 Kjellander, R.; Mitchell, D. J. Dressed‐ion theory for electrolyte solutions: A Debye–Hückel‐like reformulation of the exact theory for the primitive model. The Journal of Chemical Physics 1994, 101, 603–626
- Kjellander 2016 Kjellander, R. Decay behavior of screened electrostatic surface forces in ionic liquids: the vital role of non-local electrostatics. Phys. Chem. Chem. Phys. 2016, 18, 18985–19000
- Kjellander 2018 Kjellander, R. Focus Article: Oscillatory and long-range monotonic exponential decays of electrostatic interactions in ionic liquids and other electrolytes: The significance of dielectric permittivity and renormalized charges. The Journal of Chemical Physics 2018, 148, 193701
- Hallett et al. 2023 Hallett, J. E.; Agg, K. J.; Perkin, S. Zwitterions fine-tune interactions in electrolyte solutions. Proceedings of the National Academy of Sciences 2023, 120, e2215585120
- Gebbie et al. 2017 Gebbie, M. A.; Smith, A. M.; Dobbs, H. A.; Warr, G. G.; Banquy, X.; Valtiner, M.; Rutland, M. W.; Israelachvili, J. N.; Perkin, S.; Atkin, R., et al. Long range electrostatic forces in ionic liquids. Chemical communications 2017, 53, 1214–1224
- Fung and Perkin 2023 Fung, Y. K. C.; Perkin, S. Structure and anomalous underscreening in ethylammonium nitrate solutions confined between two mica surfaces. Faraday Discuss. 2023, 246, 370–386
- Smith et al. 2016 Smith, A. M.; Lee, A. A.; Perkin, S. The Electrostatic Screening Length in Concentrated Electrolytes Increases with Concentration. Journal of Physical Chemistry Letters 2016, 7, 2157–2163
- Zeman et al. 2020 Zeman, J.; Kondrat, S.; Holm, C. Bulk ionic screening lengths from extremely large-scale molecular dynamics simulations. Chem. Commun. 2020, 56, 15635–15638
- Coles et al. 2020 Coles, S. W.; Park, C.; Nikam, R.; Kanduč, M.; Dzubiella, J.; Rotenberg, B. Correlation Length in Concentrated Electrolytes: Insights from All-Atom Molecular Dynamics Simulations. Journal of Physical Chemistry B 2020, 124, 1778–1786
- Gaddam and Ducker 2019 Gaddam, P.; Ducker, W. Electrostatic Screening Length in Concentrated Salt Solutions. Langmuir 2019, 35, 5719–5727
- Kumar et al. 2022 Kumar, S.; Cats, P.; Alotaibi, M. B.; Ayirala, S. C.; Yousef, A. A.; van Roij, R.; Siretanu, I.; Mugele, F. Absence of anomalous underscreening in highly concentrated aqueous electrolytes confined between smooth silica surfaces. Journal of Colloid and Interface Science 2022, 622, 819–827
- Härtel et al. 2023 Härtel, A.; Bültmann, M.; Coupette, F. Anomalous Underscreening in the Restricted Primitive Model. Phys. Rev. Lett. 2023, 130, 108202
- Safran and Pincus 2023 Safran, S. A.; Pincus, P. A. Scaling perspectives of underscreening in concentrated electrolyte solutions. Soft Matter 2023, 19, 7907–7911
- Triolo et al. 2007 Triolo, A.; Russina, O.; Bleif, H.-J.; Di Cola, E. Nanoscale Segregation in Room Temperature Ionic Liquids. The Journal of Physical Chemistry B 2007, 111, 4641–4644
- Annapureddy et al. 2010 Annapureddy, H. V. R.; Kashyap, H. K.; De Biase, P. M.; Margulis, C. J. What is the Origin of the Prepeak in the X-ray Scattering of Imidazolium-Based Room-Temperature Ionic Liquids? The Journal of Physical Chemistry B 2010, 114, 16838–16846
- Hettige et al. 2014 Hettige, J. J.; Araque, J. C.; Margulis, C. J. Bicontinuity and Multiple Length Scale Ordering in Triphilic Hydrogen-Bonding Ionic Liquids. The Journal of Physical Chemistry B 2014, 118, 12706–12716
- Amith et al. 2020 Amith, W. D.; Araque, J. C.; Margulis, C. J. A Pictorial View of Viscosity in Ionic Liquids and the Link to Nanostructural Heterogeneity. The Journal of Physical Chemistry Letters 2020, 11, 2062–2066
- Perkin et al. 2011 Perkin, S.; Crowhurst, L.; Niedermeyer, H.; Welton, T.; Smith, A. M.; Gosvami, N. N. Self-assembly in the electrical double layer of ionic liquids. Chemical Communications 2011, 47, 6572–6574
- Smith et al. 2013 Smith, A. M.; Lovelock, K. R. J.; Gosvami, N. N.; Licence, P.; Dolan, A.; Welton, T.; Perkin, S. Monolayer to Bilayer Structural Transition in Confined Pyrrolidinium-Based Ionic Liquids. The Journal of Physical Chemistry Letters 2013, 4, 378–382
- Groves et al. 2021 Groves, T. S.; Perez-Martinez, C. S.; Lhermerout, R.; Perkin, S. Surface Forces and Structure in a Water-in-Salt Electrolyte. Journal of Physical Chemistry Letters 2021, 12, 1702–1707
- Hayler et al. 2024 Hayler, H.; Groves, T. S.; Guerrini, A.; Southam, A.; Zheng, W.; Perkin, S. The Surface Force Balance: Direct Measurement of Interactions in Fluids and Soft Matter. Reports on Progress in Physics 2024,
- Horn et al. 1988 Horn, R. G.; Evans, D. F.; Ninham, B. W. Double-layer and solvation forces measured in a molten salt and its mixtures with water. Journal of Physical Chemistry 1988, 92, 3531–3537
- Perkin et al. 2010 Perkin, S.; Albrecht, T.; Klein, J. Layering and shear properties of an ionic liquid, 1-ethyl-3-methylimidazolium ethylsulfate, confined to nano-films between mica surfaces. Physical Chemistry, Chemical Physics 2010, 12, 1243–1247
- Smith et al. 2013 Smith, A. M.; Lovelock, K. R. J.; Perkin, S. Monolayer and bilayer structures in ionic liquids and their mixtures confined to nano-films. Faraday Discussions 2013, 167, 279–292
- Gebbie et al. 2013 Gebbie, M. A.; Valtiner, M.; Banquy, X.; Fox, E. T.; Henderson, W. A.; Israelachvili, J. N. Ionic liquids behave as dilute electrolyte solutions. Proceedings of the National Academy of Sciences 2013, 110, 9674–9679
- Gebbie et al. 2015 Gebbie, M. A.; Dobbs, H. A.; Valtiner, M.; Israelachvili, J. N. Long-range electrostatic screening in ionic liquids. Proceedings of the National Academy of Sciences 2015, 112, 7432–7437
- Freitas et al. 2018 Freitas, A. A. d.; Shimizu, K.; Smith, A. M.; Perkin, S.; Canongia Lopes, J. N. Structure and dynamics of mica-confined films of [C10C1Pyrr][NTf2] ionic liquid. The Journal of Chemical Physics 2018, 148, 193808
- Lee et al. 2017 Lee, A. A.; Perez-Martinez, C. S.; Smith, A. M.; Perkin, S. Underscreening in concentrated electrolytes. Faraday Discuss. 2017, 199, 239–259
- Smith et al. 2017 Smith, A. M.; Lee, A. A.; Perkin, S. Switching the Structural Force in Ionic Liquid-Solvent Mixtures by Varying Composition. Phys. Rev. Lett. 2017, 118, 096002
- Cabry et al. 2018 Cabry, C. P.; D’Andrea, L.; Shimizu, K.; Grillo, I.; Li, P.; Rogers, S.; Bruce, D. W.; Canongia Lopes, J. N.; Slattery, J. M. Exploring the bulk-phase structure of ionic liquid mixtures using small-angle neutron scattering. Faraday Discuss. 2018, 206, 265–289
- Weber et al. 2019 Weber, C. C.; Brooks, N. J.; Castiglione, F.; Mauri, M.; Simonutti, R.; Mele, A.; Welton, T. On the structural origin of free volume in 1-alkyl-3-methylimidazolium ionic liquid mixtures: a SAXS and 129Xe NMR study. Phys. Chem. Chem. Phys. 2019, 21, 5999–6010
- Cabry et al. 2022 Cabry, C. P.; D’Andrea, L.; Elstone, N. S.; Kirchhecker, S.; Riccobono, A.; Khazal, I.; Li, P.; Rogers, S. E.; Bruce, D. W.; Slattery, J. M. Small-angle neutron scattering from mixtures of long- and short-chain 3-alkyl-1-methyl imidazolium bistriflimides. Phys. Chem. Chem. Phys. 2022, 24, 15811–15823