Field, frequency and temperature dependence of the surface resistance of nitrogen diffused niobium superconducting radio frequency cavities
Abstract
We report the RF performance of several single-cell superconducting radio-frequency cavities subjected to low temperature heat treatment in nitrogen environment. The cavities were treated at temperature 120 - 165 ∘C for an extended period of time (24 - 48 hours) either in high vacuum or in a low partial pressure of ultra-pure nitrogen. The improvement in with a Q-rise was observed when nitrogen gas was injected at 300 ∘C during the cavity cooldown from 800 ∘C and held at 165 ∘C, without any degradation in accelerating gradient over the baseline performance. The treatment was applied to several elliptical cavities with frequency ranging from 0.75 GHz to 3.0 GHz, showing an improved quality factor as a result of low temperature nitrogen treatments. The Q-rise feature is similar to that achieved by nitrogen alloying Nb cavities at higher temperature, followed by material removal by electropolishing. The surface modification was confirmed by the change in electronic mean free path and tuned with the temperature and duration of heat treatment. The decrease of the temperature-dependent surface resistance with increasing RF field, resulting in a Q-rise, becomes stronger with increasing frequency and decreasing temperature. The data suggest a crossover frequency of GHz above which the Q-rise phenomenon occurs at 2 K. Some of these results can be explained qualitatively with an existing model which calculates the intrinsic field-dependence of the surface resistance, considering both equilibrium and nonequilibrium quasiparticle distribution functions.
I Introduction
Recent advances in the processing of bulk superconducting radio frequency (SRF) niobium cavities via interior surface impurity diffusion have resulted in significant improvements in their quality factor (). The motivation for the development of these processes is to reduce the cryogenic operating cost of current and future accelerators while providing reliable operation [1, 2, 3, 4, 5]. Most recently, efforts have been made to preserve high accelerating gradients, , while also increasing the quality factor of SRF cavities [7, 6, 8]. In the literature, these cavity processing recipes are referred to ”nitrogen infusion” cavity processing recipes where, cavities were heat treated at 800 ∘C for 3 hours, then the furnace temperature is reduced to 120 - 200 ∘C and nitrogen is introduced into the furnace at a partial pressure of 25 mTorr for 48 hours. This process has shown an improvement in over the baseline measurements, without the need for post-annealing chemical etching with no significant reduction in quenched field. Even though diffusion of the nitrogen into the bulk of the SRF cavity is limited in depth ( 50 nm) at these low temperatures (120 - 200 ∘C), the introduction of nitrogen is sufficient to modify the cavity surface within the RF penetration depth as seen from RF results, which are similar to those previously reported for high-temperature nitrogen treated cavities. Surface analysis done on the sample coupons treated with cavities showed a complex NbN1-xOx on the surface of SRF cavities, which may be responsible for the Q-rise in those cavities [8]. The absence of post furnace chemical treatment shows a clear benefit in reducing processing steps as well as keeping higher gradient with high values. The field dependence of the surface resistance calculated based on the model which extends the Bardeen-Cooper-Schrieffer (BCS) surface resistance to high rf field qualitatively explained the experimental results suggesting an increase in the quasi-particle’s relaxation time increasing with temperature at which the cavities were treated [8, 9].
More recently, the medium temperature heat treatments of the SRF cavities are being investigated in order to explore the mechanism of impurities diffusion as well as exploration of new dopants. The heat treatment of SRF cavities in the range of 300 - 400 ∘C in vacuum exhibited the increase in quality factors with reduced quenched field similar to those previously observed in impurity diffused SRF cavities [10, 12, 13, 11]. In this manuscript, we present the results from several RF tests on a single cell elliptical cavities with different frequencies treated at low temperature in nitrogen environment to explore the frequency dependence of the field-dependent quality factor.
II Cavity Surface Preparations
Several single cell cavities of frequencies 0.75 - 3.0 GHz were selected for the current study. All of the cavities are fabricated from high-purity (residual resistivity ratio 250), fine grain (ASTM 5) niobium. A summary of the cavities’ electromagnetic parameters are listed in Table 1. Such parameters include the ratio of the peak surface electric and magnetic fields divided by , and , respectively, , where is the cavity active length and is the shunt impedance, and the geometry factor, . Prior to the RF measurements reported in this manuscript, these cavities went through several cycles of heat treatments, chemical polishing and nitrogen diffusion. The baseline RF measurements reflect the surface reset via electropolishing by removing 20 - 40 m from the inner cavity surface.
| Cavity Name | Frequency (GHz) | [mT/(MV/m)] | G () | ||
|---|---|---|---|---|---|
| 750 MHz | 0.75 | 2.24 | 4.18 | 50.9 | 276.3 |
| RDT-06 | 1.3 | 1.85 | 4.23 | 89.8 | 277.8 |
| RDL-02 | 1.5 | 1.99 | 4.18 | 115.7 | 277.2 |
| FH3C | 3.0 | 1.83 | 4.23 | 207.4 | 277.9 |
Before the heat treatment, the cavities were high pressure rinsed and then dried in an ISO 4/5 cleanroom. While in the cleanroom, special caps made from niobium foils were placed to cover the cavity flange openings as shown in 1. The cavity was then transported to the furnace in a clean sealed plastic bag. The vacuum heat treatment procedure started with the 800 ∘C/3h hydrogen degassing step followed by lowering the temperature of the furnace to (120 - 165 ∘C) range. The furnace is continuously pumped during the cooldown process. In temperature range 120 - 300 ∘C at which the total pressure (also corresponds to nitrogen partial pressure) increased to 25 mTorr by introducing high purity nitrogen. Such pressure was maintained without active pumping of the furnace enclosure. Once the temperature has fallen to the desired value (120 - 165 ∘C), which takes about 2 hours, the temperature was held for 24 - 48 hours without active pumping as shown in Fig. 2. The treatment referred to as low temperature baking (LTB) at 120 was done in ultra-high vacuum (UHV) condition while the cavity is actively pumping on a vertical test stand, immediately before insertion in the vertical cryostat.
III Cavity Test Results
III.1 RF Test Results
Standard procedures were followed to clean the cavity surface in preparation for an rf test: degreasing in ultra-pure water with a detergent and ultrasonic agitation, high pressure rinsing with ultra-pure water, drying in the ISO 4/5 cleanroom, assembly of flanges with RF feedthroughs and pump out ports and evacuation. The cavity was inserted in a vertical cryostat and cooled to 4.2 K with liquid helium using the standard Jefferson Lab cooldown procedure in a residual magnetic field of mG along the cavity axis. This procedure results in a temperature difference between the two irises K when the equator temperature crosses the superconducting transition temperature ( 9.25 K), which provides good flux expulsion conditions. Most of the rf measurements were done at a He bath temperature K, acquiring curves and in some instances from 4.2 -1.6 K were obtained at a constant peak surface magnetic field in order to extract the residual resistance, .
III.1.1 750 MHz
The RF test summary of vs. measured at 2.0 K for cavity 750 MHz is shown in Fig. 3. The cavity was previously treated with buffered chemical polishing [14]. The baseline measurement was done after the cavity was subjected to 20 m EP. The cavity was limited by quench at = 1453 mT. The cavity was then subjected to high temperature heat treatment at 800 ∘C/3h followed by the nitrogen injection into the furnace at 300 ∘C. The temperature of the cavity was held at 165 ∘C for 48 hours. After annealing, the cavity RF performance was limited by strong multipacting at = 50 5 mT. This could have resulted from a small shape deformation of the cavity shape after evacuation, as a result of a reduced yield strength of the Nb after the heat treatment at 800 ∘C. The cavity was mechanically stretched back to its initial frequency and it was restrained from deformation during the evacuation, in preparation for the subsequent RF test at 2 K, after high-pressure water rinsing. The strong multipacting was no longer observed but field emission started at 60 mT during the RF test. Helium processing [15] mitigated the field emission, which still limited the cavity to mT. A small increase in quality factor at low rf field was observed, with no apparent Q-rise, after the N-infusion treatment. The Q-rise has been associated with a decrease of the BCS surface resistance with increasing rf field in both 1.3-1.5 GHz Ti-and N-diffused cavities [16, 3]. In order to verify the absence of any decrease of , was measured between 1.7 - 4 K for different -values, ranging between 9 - 42 mT, as shown in Fig. 4(a). The data were fit with the following generic form of thermally-activated surface resistance at , for each -value, with the same method described in Ref. [16]:
| (1) |
where is the temperature of the cavity inner surface and is the Boltzmann constant. A self-consistent calculation of becomes important above 25 mT, in order to clearly separate RF heating from the intrinsic field dependence of . Figure 4(b-d) shows the values of the fit parameters A, U, as a function of , showing an increase of the pre-exponential factor A with increasing RF field, unlike what was measured in N and Ti-doped cavities above 1 GHz.
III.1.2 RDT-06
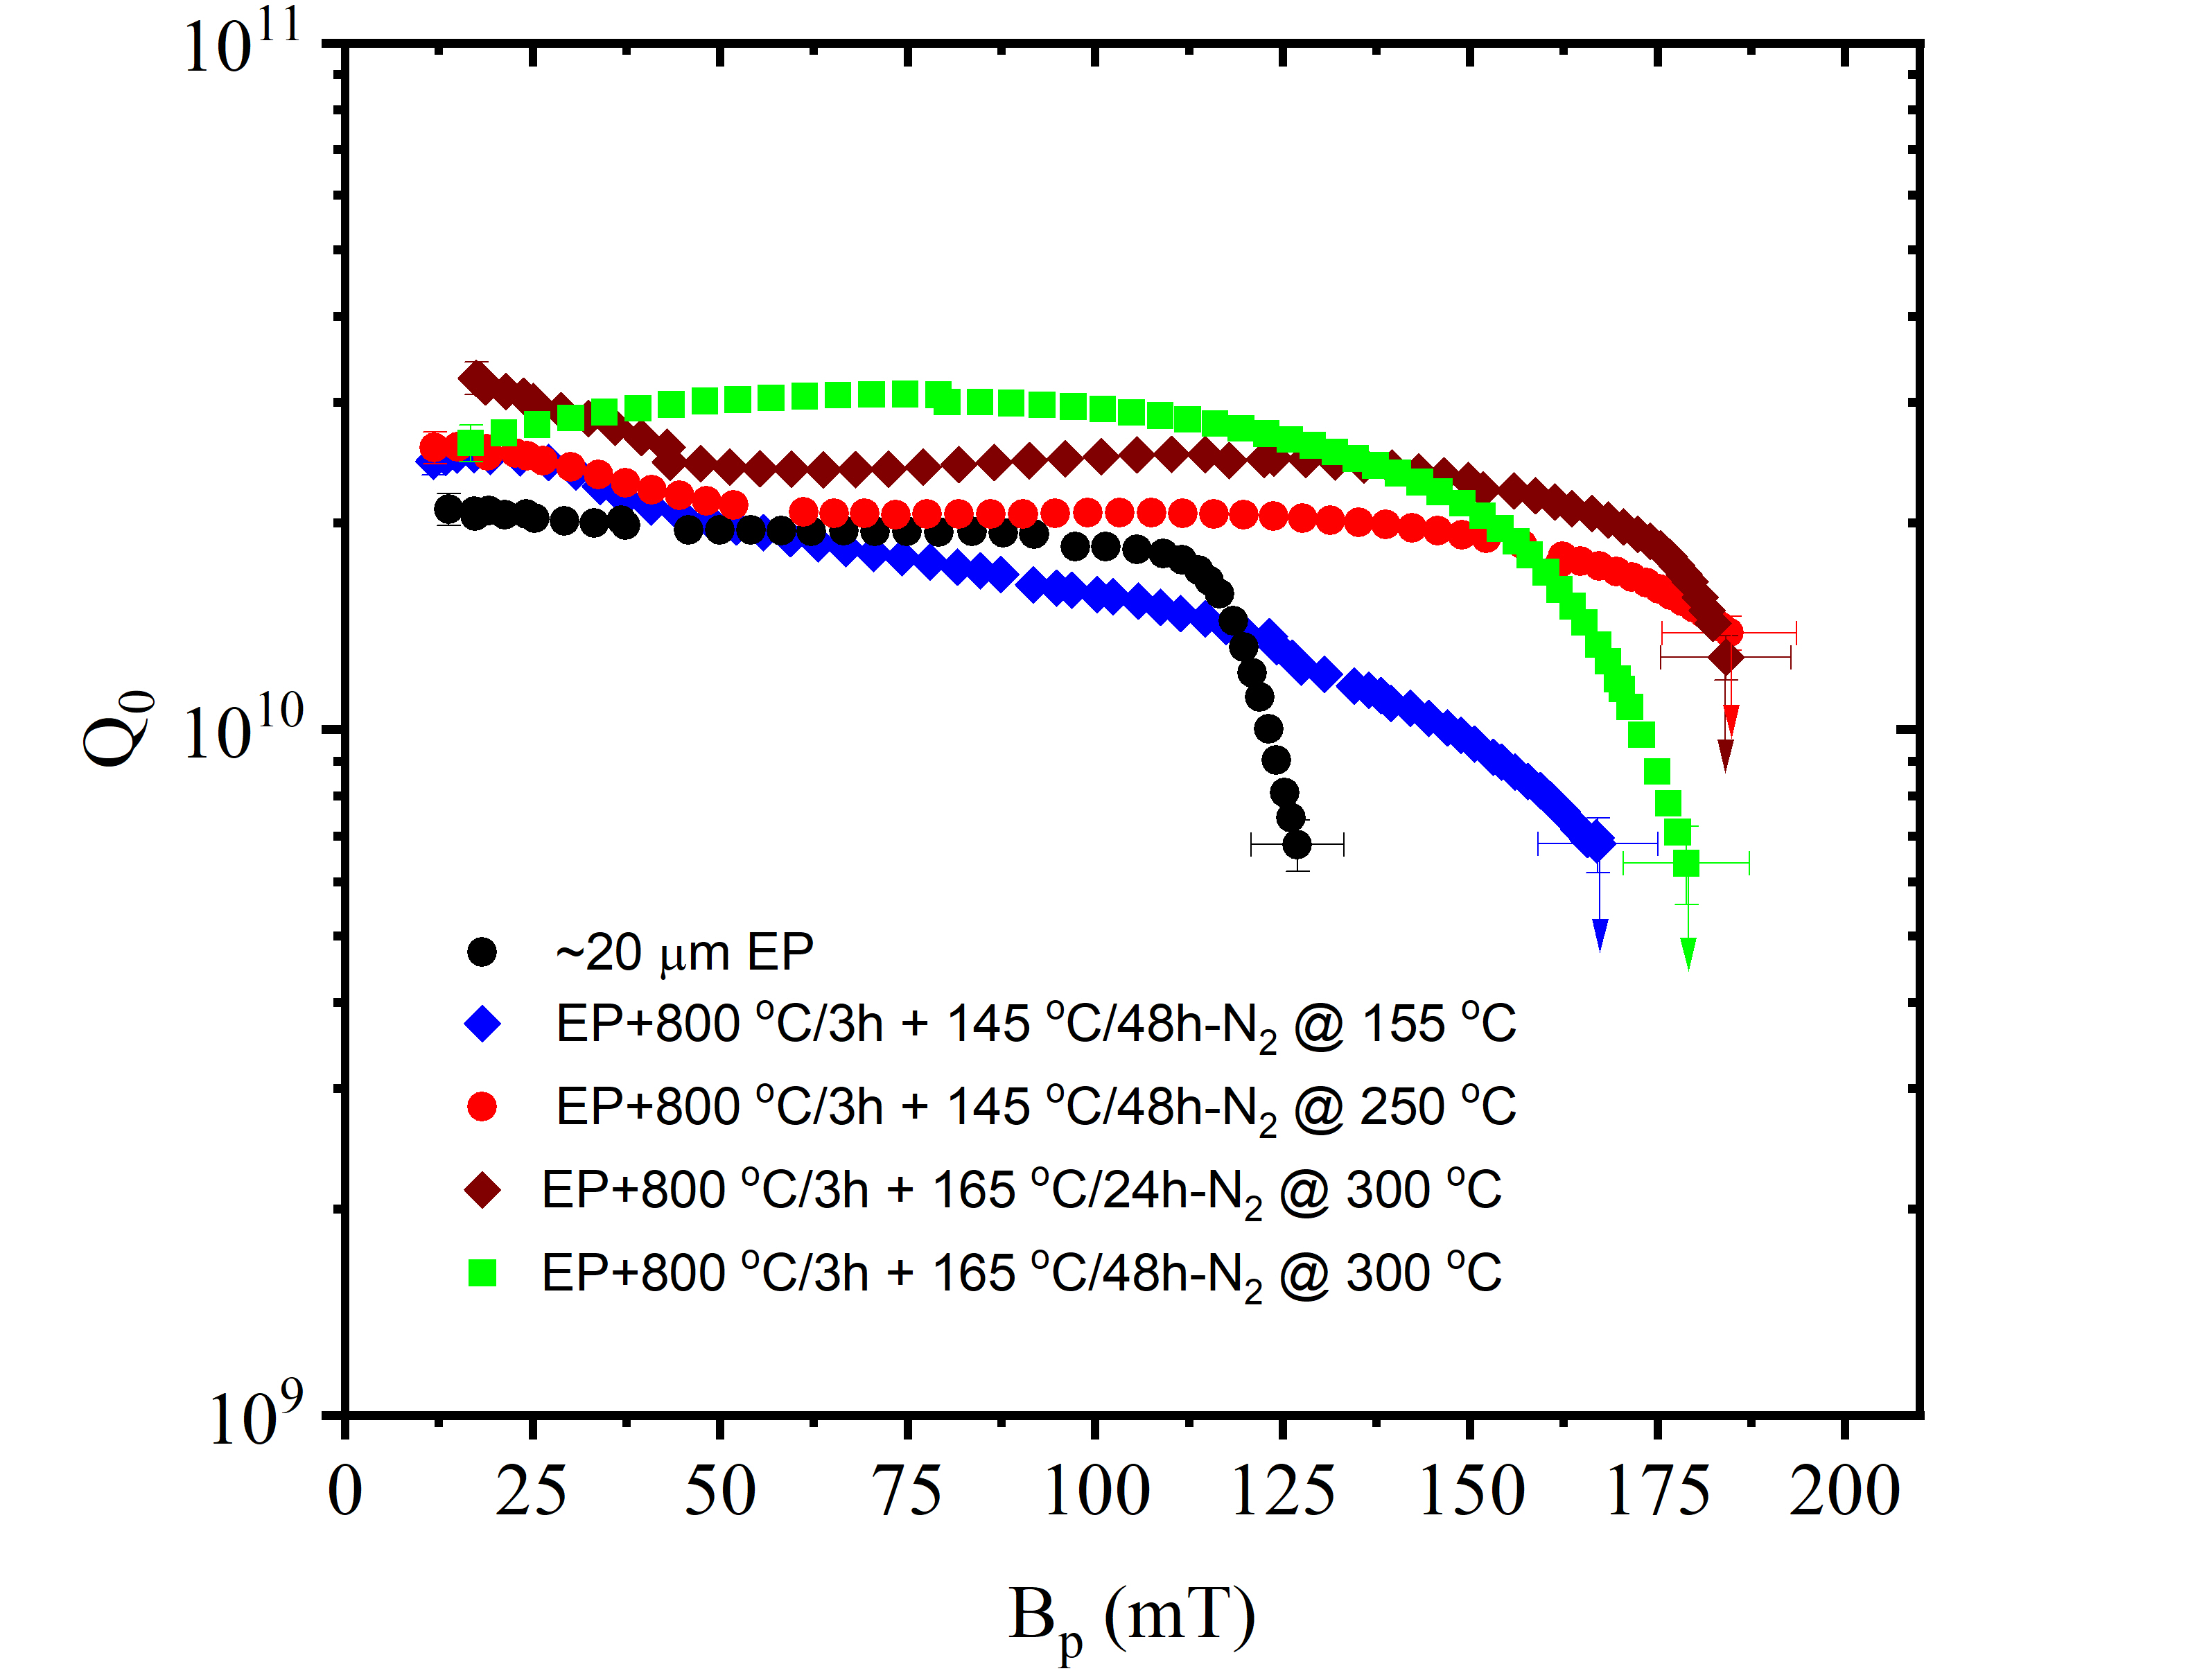
The RF test summary of 1.3 GHz cavity labeled RDT-6 is shown in Fig. 5. The cavity was treated at different temperature while varying the nitrogen injection temperature. The baseline measurement was done after the cavity was subjected to 20 m EP. The cavity was limited at = 1276 mT by the high field Q-slope. It is to be noted that after each of the annealing listed in Fig. 5, the RF surface of cavity was reset by 20 m EP. The cavity was then subjected to high temperature heat treatment at 800 ∘C/3h followed by the nitrogen injection into the furnace at 155 ∘C. The temperature of the cavity was held at 155 ∘C for 48 hours. The RF performance showed the increase in peak RF field to = 1678 mT with = 6.8 before the cavity quench. The low field increases but it decreases with increasing RF field. After the cavity reset by EP, it was again treated at 800 ∘C/3h followed by the nitrogen injection into the furnace at 250 ∘C. The temperature of the cavity was then held at 155 ∘C for 48 hours. The RF performance showed the increase in above 90 mT with at quench field of = 1859 mT. The next heat treatment was done at nitrogen injection into the furnace at 300 ∘C and the cavity was held at 165 ∘C for 48 hours. The RF performance showed the increase with RF field, similar to those observed in cavities with highest 3 at 90 mT. The at high field showed the board Q-slope before it quenched at = 1798 mT with . The final heat treatment was done at the same temperature as the earlier one, but the cavity was held at 165 ∘C only for 24 hours. Again, an overall increase in was observed before the cavity quenched at = 1858 mT with 1.3. The maximum achievable RF field didn’t degrade as result of nitrogen infusion. The results show that can be tuned depending on the temperature of the nitrogen injection into the furnace, duration, and temperature of the cavity during the heat treatment.
III.1.3 RDL-02
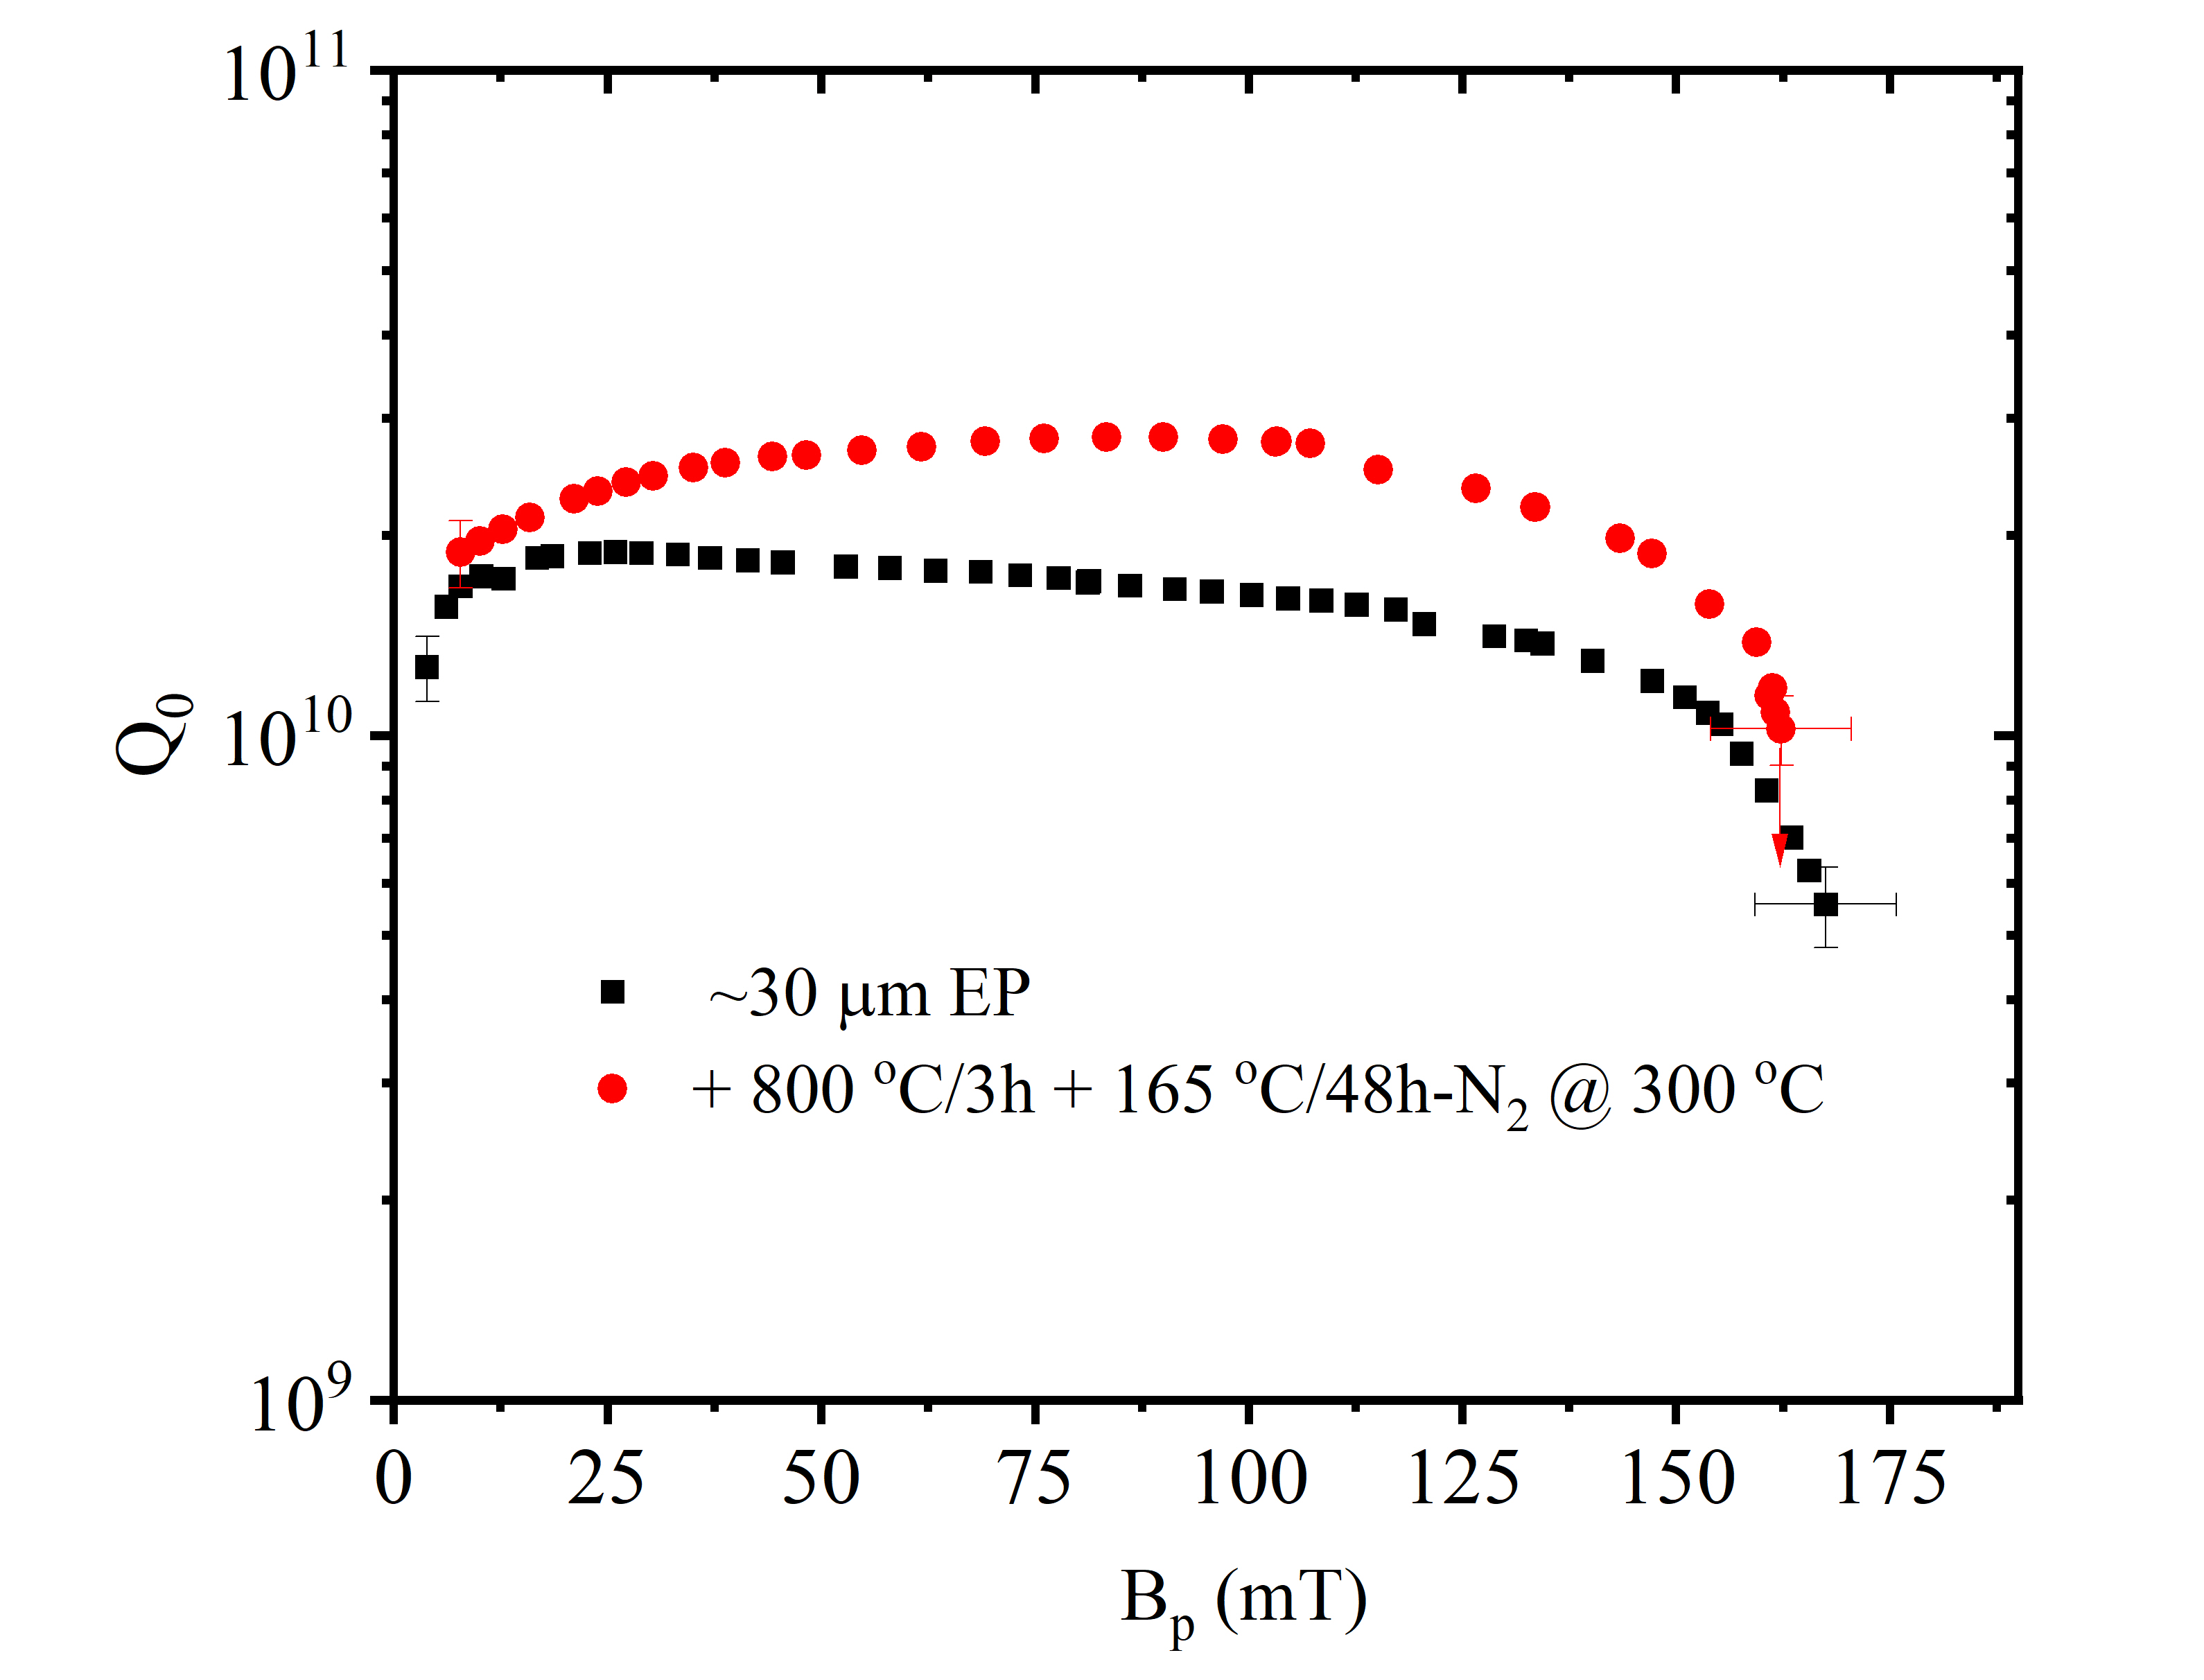
The 1.5 GHz cavity labeled RDL-02 was treated with the profile similar to that shown in Fig. 2, where the nitrogen gas was injected at 300 ∘C. The baseline measurement was limited by high the field Q-slope at = 1685 mT. After the nitrogen infusion the cavity reached = 1625 mT and limited by quench as shown in Fig. 6. The curves shows the Q-rise phenomenon with increasing with peak RF magnetic field up to 2.75 at 107 mT corresponding to accelerating gradient of 26 MV/m. The Q-rise phenomenon is similar to those observed in high temperature nitrogen treated cavities. The details of analysis with cavity treated at different temperature was already presented in Ref. [8].
III.1.4 FH3C
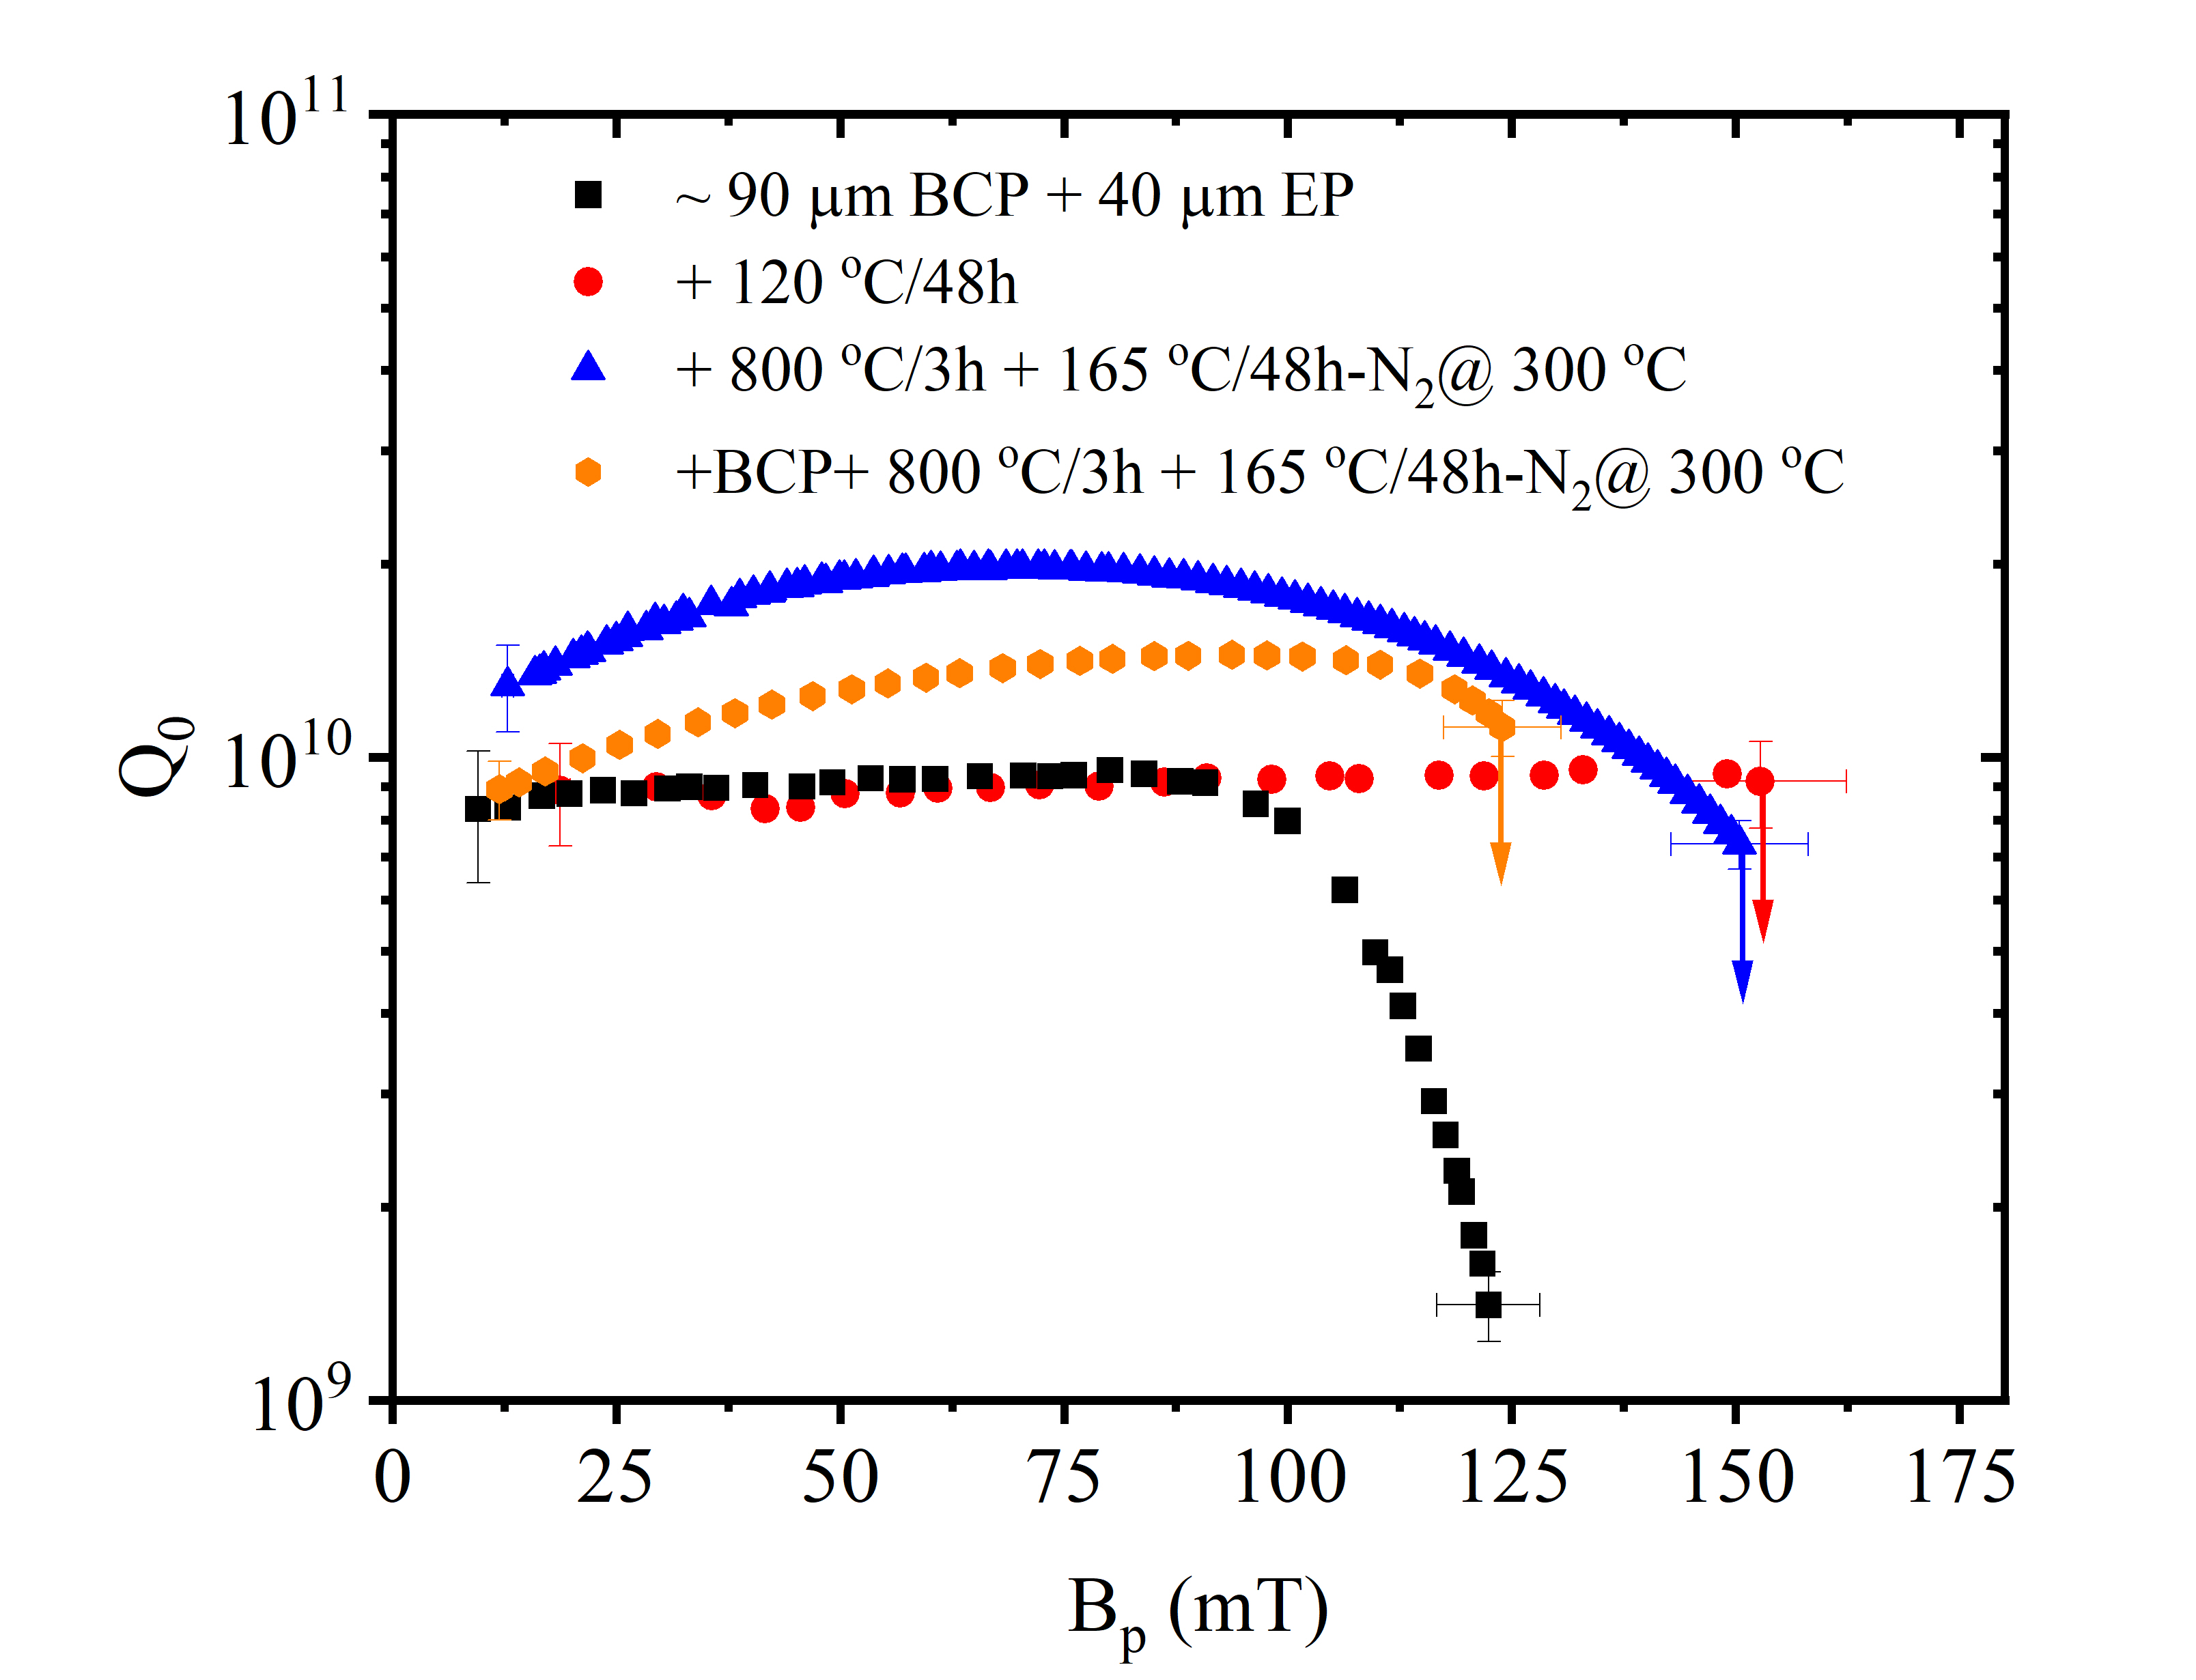
The summary of the RF tests of 3.0 GHz cavity labeled FH3C is shown in Fig. 7. The baseline test was done after the rf surface was treated with 40 m EP [17]. The cavity was limited by high field Q-slope at 1255 mT with . The cavity was then in-situ baked on vertical test stand at 120 for 48 hours while the cavity was actively pumped. As expected, the high field Q-slope is eliminated and cavity reached = 1526 mT with . The cavity was then subjected to additional heat treatment at 800 ∘C/3h followed by the nitrogen injection into the furnace at 300 ∘C during the cooldown and the cavity temperature was then held at 165 ∘C for 48 hours. The RF performance showed the increase in with rf field up to 75 mT and it was limited by quench at = 1506 mT with . The maximum in = 2 was observed at a corresponding accelerating gradient of 18 MV/m.
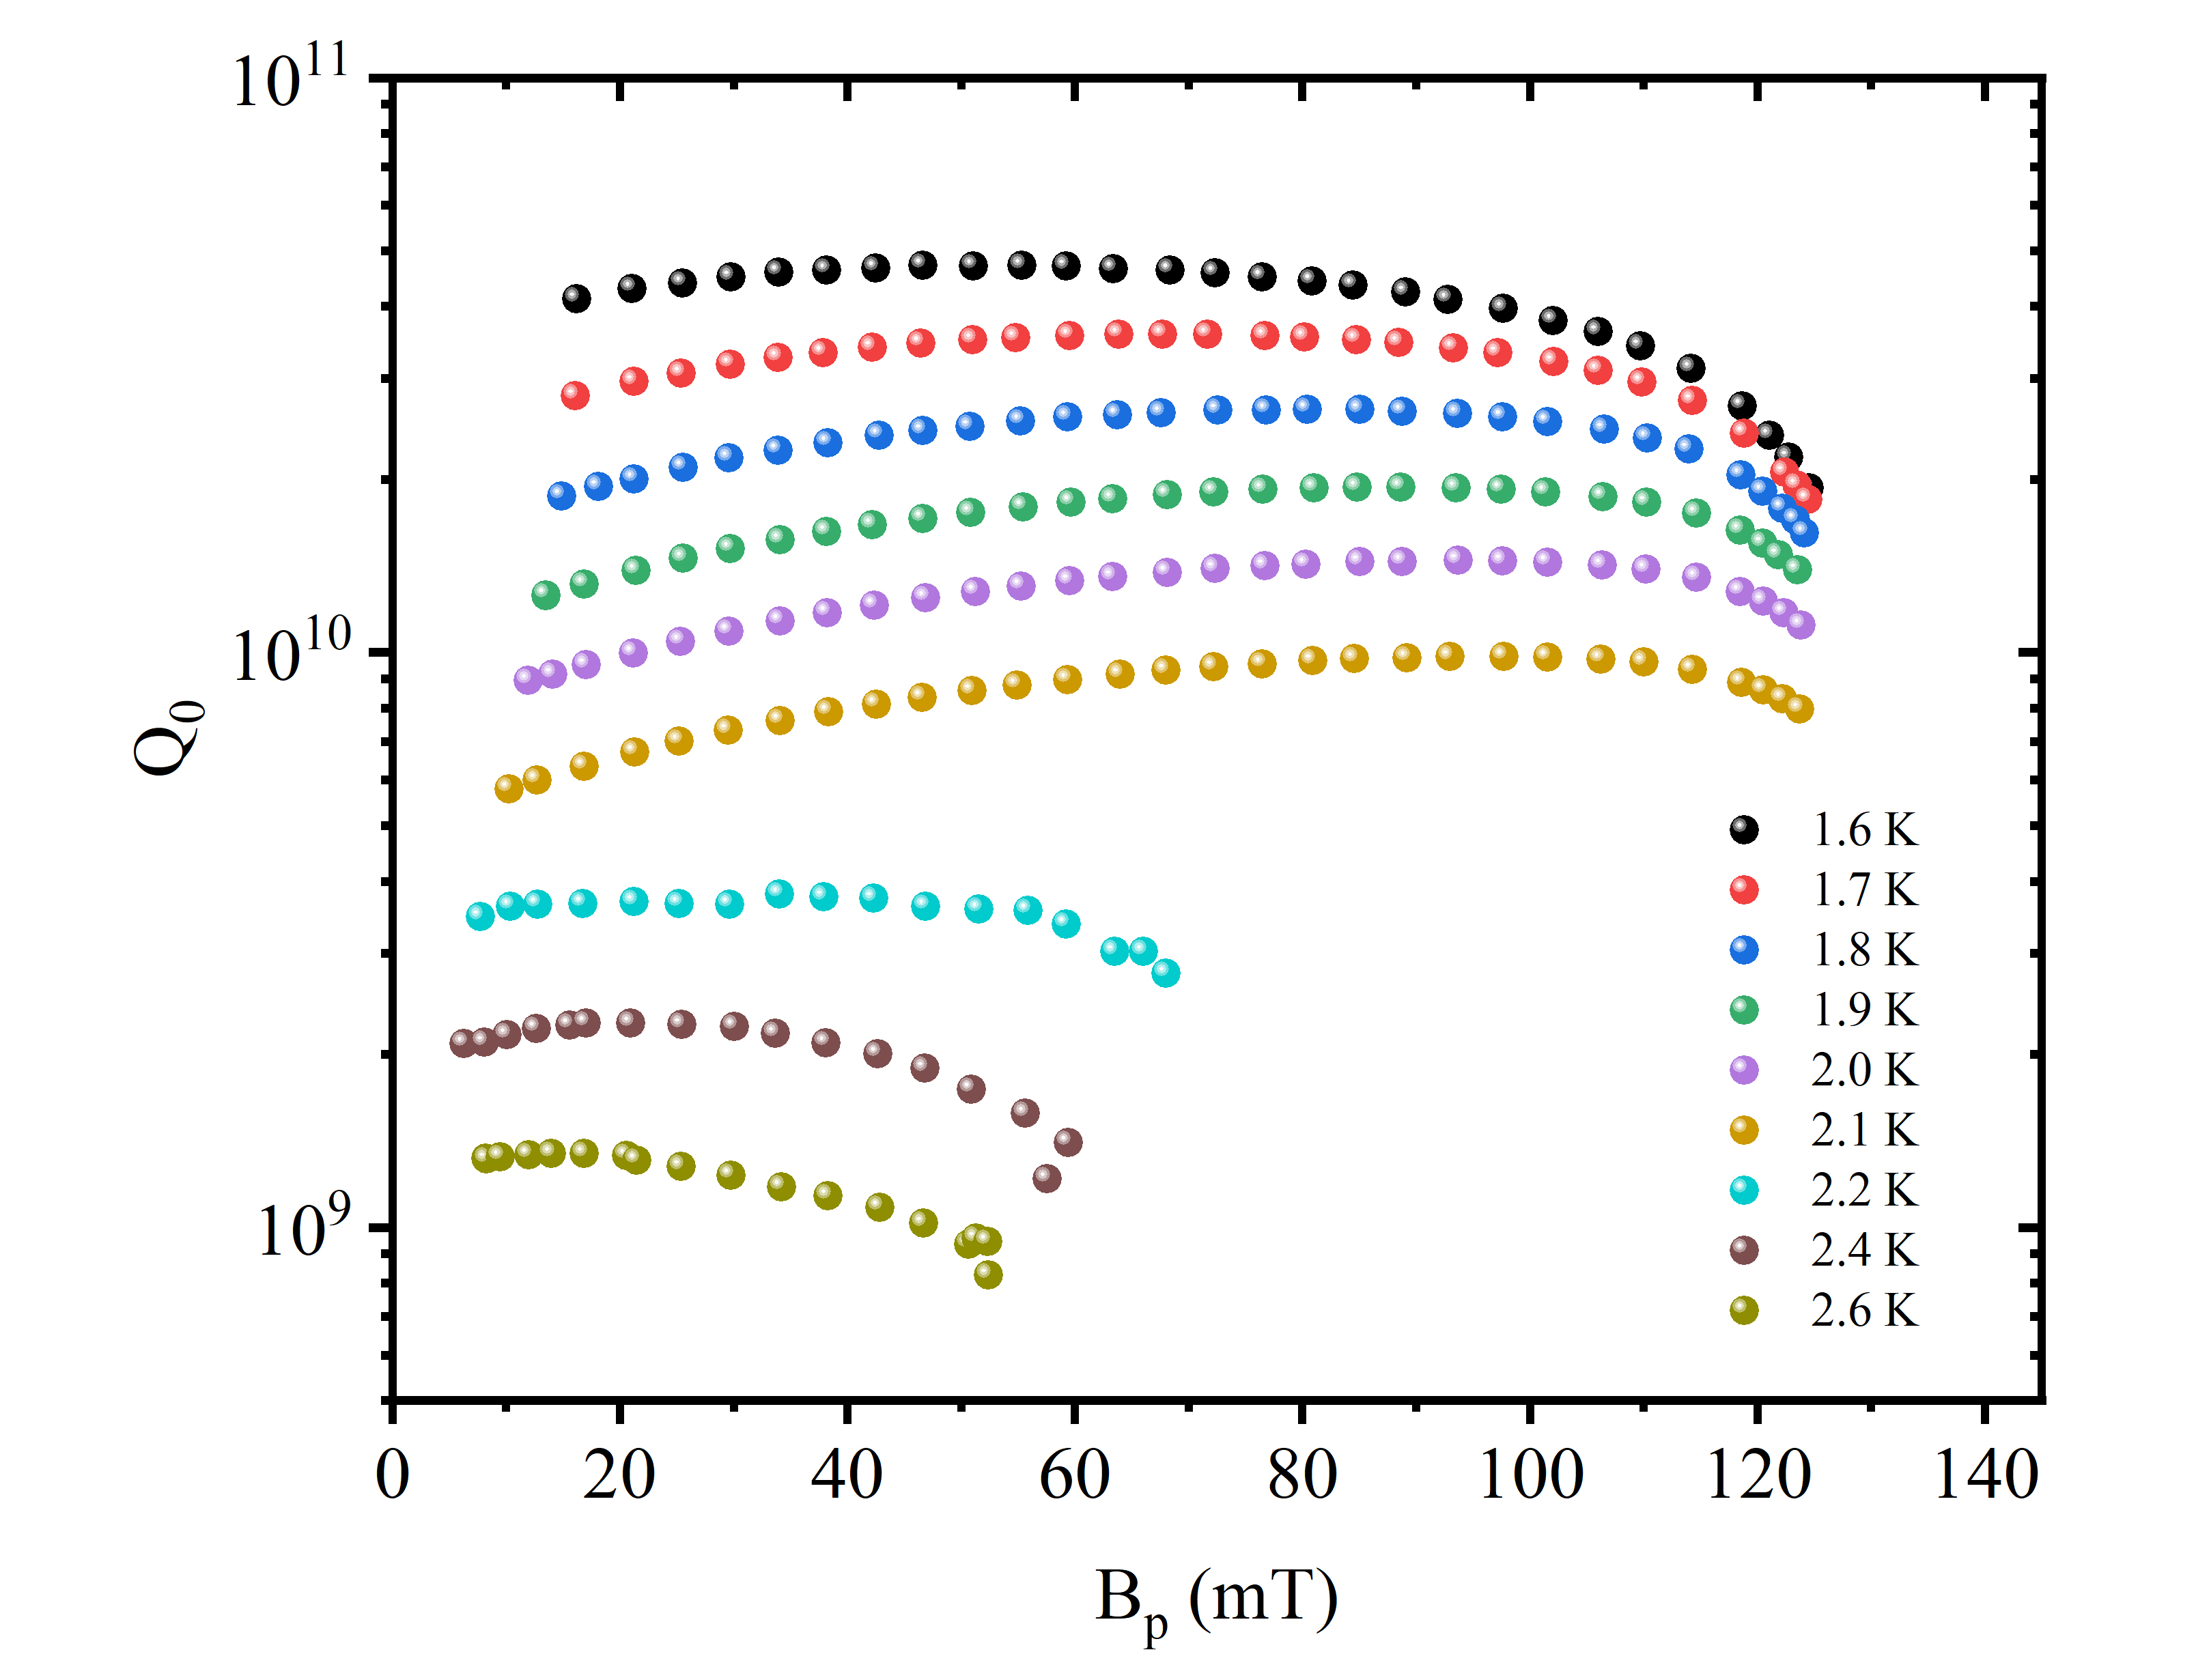
The cavity was stored for 2 years exposed to air and retest resulted in poor performance with high residual resistance. The cavity surface was reset with 10 m BCP and the treatment was performed. At this time, the quality factor as a function of RF field were measured at different temperature from 2.6 - 1.6 K as shown in Fig. 8. The cavity is limited by quench at = 124 mT when RF test was performed in super-fluid helium, whereas at higher temperature the cavity was limited by heating likely due to the inefficient heat transfer to liquid helium bath. The temperature dependence of surface resistance was fitted using Eq. (1) to extract the residual resistance and material parameters and that contribute to the BCS resistance. Figure 9 shows the values of the fit parameters , and as a function of , showing the decrease in with increasing RF field. The logarithmic dependence of is consistent with the theoretical model explaining the Q-rise phenomenon [9, 16].
III.2 RF penetration depth
In order to obtain information about the mean free path near the RF surface, we measured the resonant frequency and quality factor while warming up the cavities from 5 K to above transition temperature ( 9.3 K) using a vector-network analyzer and low-noise rf amplifiers, from which and the change in resonant frequency can be extracted. The frequency shift can be translated into a change in penetration depth according to
| (2) |
where is the geometric factor of the cavity and is the resonant frequency. Using the Casimir-Gorter relation [18], we can obtain , which is the penetration depth at 0 K as:
| (3) |
In the Pippard-limit [19], is directly related to the mean free path of the quasi-particles as:
| (4) |
The measured vs. reduced temperature y = is shown in Fig. 10 for cavity RDT-06. The data were fitted with the Mattis-Bardeen (M-B) theory [20] to extract the mean free path and summarized in Table 2. The lower mean free path , shows that the Nb is in dirty limit due to the low temperature heat treatment in nitrogen environment. Figure 11 shows the measured vs. the reduced temperature parameter, y for all cavities under study for the same treatment of 800 ∘C/3h and the nitrogen injection into the furnace at 300 ∘C followed by the holding temperature of 165 ∘C/48 h. The mean free path is similar for a given recipe for all cavities under study.
| Cavity Name | Frequency (GHz) | Treatment | ) | (nm) | (K) | |
|---|---|---|---|---|---|---|
| 750 MHz | 0.75 | 25 m EP | 390 | 9.30 | ||
| + 800 ∘C + 165 ∘C/48h- @ 300 ∘C | 11 | 9.28 | ||||
| m EP | 478 | 9.30 | ||||
| EP + 800 ∘C + 155 ∘C/48h- @ 155 ∘C | 11 | 9.30 | ||||
| RDT-06 | 1.3 | EP + 800 ∘C + 155 ∘C/48h- @ 250 ∘C | 18 | 9.29 | ||
| EP + 800 ∘C + 165 ∘C/48h- @ 300 ∘C | 5 | 9.28 | ||||
| EP + 800 ∘C + 165 ∘C/24h- @ 300 ∘C | 14 | 9.30 | ||||
| RDL-02 | 1.5 | 25 m EP | 364 | 9.28 | ||
| EP + 800 ∘C + 165 ∘C/48h- @ 300 ∘C | 4 | 9.30 | ||||
| 90 m BCP+ 40 m EP | – | – | – | – | ||
| + 120 /48 h | – | – | – | – | ||
| FH3C | 3.0 | + 800 ∘C + 165 ∘C/48h- @ 300 ∘C | 5 | 9.30 | ||
| +10 m BCP+ 800 ∘C + 165 ∘C/48h- @ 300 ∘C | 7 | 9.27 |
IV Discussion
In the past, LTB at 100 - 150 under UHV has been the standard practice for the final preparation of SRF cavities in order to recover from the high field Q-slope. Different models, related to oxide layer modification, oxygen diffusion, hydrogen segregation, and micro-structural modifications near the surface have been proposed to explain the high-field Q-slope and the LTB effect [21, 22, 23].
In our present study, the introduction of nitrogen during the low temperature baking showed improvement on , as well as the elimination of high field Q-slope, similar to that obtained by LTB in UHV environment. The improvement on was clearly evident when the was injected at higher temperature 250-300 during the cooldown of the cavity from 800 ∘C. Our earlier studies showed that the presence of NbN1-xOx layer between the bulk niobium and top most Nb2O5 layer may be responsible for the high . The electronic properties of such layer and their influence on the electronic density of states of the adjacent superconducting Nb might explain the difference in the RF performance of current cavities compared to those which were subjected to the standard UHV baking. The surface modifications due to thermal treatments are also evident from the results of studies using x-ray photoelectron spectroscopy, magnetization and ac susceptibility measurements of samples treated with the cavities [8].
The RF measurements and sample surface analysis showed that the heat treatment at lower temperature significantly alters the RF surfaces, mostly driving the superconducting Nb towards the dirty limit, where the electronic mean free path is less than the superconducting coherence length within the RF penetration depth [8]. Recent work on heat treatment of SRF cavities at medium temperature (300 - 400 ∘C) also showed the increase in quality factor [10, 11, 12, 13], associated to the diffusion of oxygen from the oxide layer. A theoretical model proposed by Gurevich to explain the Q-rise extends the zero-field BCS surface resistance to high RF fields in the dirty limit [24, 9]. R is obtained from the nonlinear quasiparticle conductivity , given the quasiparticles’ distribution function. The model considers the cases for the Fermi-Dirac equilibrium distribution function and a distribution function describing a frozen density of quasiparticles, resulting from non-equilibrium between quasiparticles and phonons. Non-equilibrium conditions occur when the RF period, , becomes smaller than either the recombination time of Cooper pairs, or the quasi-particles scattering time, . In the absence of RF field, and was estimated to be s and s for Nb at 2 K [29, 27] and they both increase with decreasing temperature [27]. The values of both and are not well known and can change by orders of magnitude because of distribution of impurities, inhomegeneities of superconducting properties and sub-gap states. The model was able to reproduce the Q-rise phenomenon observed in several cavities after nitrogen and titanium diffusion and low temperature baked cavities in nitrogen environment [8]. The model has a single fit parameter, , given by:
| (5) |
where , mT is the thermodynamic critical field at 0 K for Nb with a low concentration of impurities [30], is the wall thickness, is the thermal conductivity, is the Kapitza conductance and quantifies the energy transfer rate between quasiparticles and phonons. All quantities on the right hand side of Eq. (5) are taken at the He bath temperature and zero RF field.
Figure 12 shows as a function of for all cavities under study and subjected to the same recipe of nitrogen treatment: 800 ∘C/3h followed by 165 ∘C/48 h with nitrogen injection into the furnace at ∘C. The temperature-dependent component of the surface resistance decreases approximately linearly with up to mT. The negative slope of is higher with increasing frequency and it becomes positive at 750 MHz. Similar behavior was also reported after the so-called ”N-doping” treatment in which the nitrogen is injected at 800 ∘C [25]. Figure 13 shows the slope of from Fig. 12 as a function of frequency, along with the data from Ref. [25]. A crossover frequency where the slope changes from positive (Q-slope) to negative (Q-rise) is estimated to be 0.95 GHz for impurity diffused SRF cavities at 2.0 K.
Although the model of Refs. [24, 9] predicts a minimum of , we limit our discussion to the field range below that at which the minimum of occurs, since this minimum can be significantly affected by extrinsic effects such as local hot-spots.
A qualitative explanation for the trend shown in Fig. 13 may be as follows: for a given RF frequency, there is a temperature, , below which nonequilibrium conditions between quasiparticles and phonons occur, as shown schematically in Fig. 14. The negative slope of predicted by the model is higher for non-equilibrium conditions, with all other parameters being the same. Lower RF frequency results in lower so that nonequilibrium conditions, leading to a stronger Q-rise, may occur well below 2 K. Figure 16 shows, as an example, at 2 K measured in the 3 GHz cavity and a least-square fit with the model of Refs. [24, 9] with the nonequilibrium distribution function, resulting in , as well as calculated with the equilibrium distribution function at 2 K and 750 MHz for the same value of . The trend for the negative slope of may result from the RF frequency at which nonequilibrium conditions occur at K being between GHz.
However, given the temperature dependence of , one would expect the crossover frequency to be reduced significantly as the temperature is reduced from 2 K, to 1.6 K, which is not the case in Fig. 13.
Furthermore, the model of Refs. [24, 9] always predicts a negative slope of at low field, resulting from the broadening of the peaks in the density of states induced by the RF current taking into account of either equilibrium or non-equilibrium distribution function. However, it was also shown that a small broadening of the peaks in the density of states due to magnetic impurities or subgap states can suppress the Q-rise and result in a positive slope of at low field [29]. Nonuniform superconducting properties in different regions of the surface of Nb cavities from scanning tunneling microscopy measurements have been reported [31, 32]. In addition, the plot in Fig. 15 of for the different cavities after the same treatment, shows to be greater for the 750 MHz cavity than that of the 3 GHz cavity. This result is contrary to the residual resistance increasing with frequency, as shown in other studies [33, 34] and as expected from some theoretical models [33, 35]. Much lower -values were obtained for the same cavity after different treatments, as shown in Table 2. These results may suggest the presence of a higher density of nonuniform superconducting regions or trapped vortices in the 750 MHz cavity after the N-infusion treatment, than for the higher frequency cavities, contributing to an increasing with increasing RF field.
The temperature dependence of the slope of below mT can be obtained from the data measured in the 3 GHz cavity, shown in Fig. 8. The plot in Fig. 17 shows a increase of the negative slope of from 2.1 K to 1.6 K. Similar results were reported in ”N-doped” cavities at 1.3 GHz [28]. The model of Ref. [24] correctly predicts the temperature dependence of the slope, however the value of which described well the data at 2 K is already quite low such that the slope predicted by the model at 1.6 K does not increase significantly compared to the experimental data.
V Summary
Improvement in the quality factor of SRF Nb cavities was observed after annealing at 800 ∘C/3 h in vacuum followed by baking at 120 - 165 ∘C in low partial pressure of nitrogen inside a furnace compared to the traditional 120 ∘C bake in UHV. The improvement in with Q-rise was observed only when the gas was injected in the furnace at 300 ∘C during the cooldown from the 800 ∘C. The negative slope of the normalized temperature dependent surface resistance as a function of ln() increased with increasing frequency, with a crossover frequency from positive to negative slope of frequency 0.95 GHz. The negative slope was found to increase with decreasing temperature. Both aspects can be qualitatively explained with a model of the intrinsic field-dependence of the surface resistance, considering a temperature-dependent transition of the quasiparticles to a nonequilibrium state with respect to the phonons. Further theoretical development may be needed to fully understand the frequency dependence of the Q-rise. From the experimental point of view, the frequency dependence of the non-linear surface resistance may be better explored with multi-mode half-wave resonators, which minimize variability related to material, processing recipe, and size [36, 37, 38, 39].
High quality factor at high accelerating gradient in SRF cavities would be of great interest for lowering the cryogenic heat load of high-energy accelerators such as the proposed Linear Collider [40]. Processes that result in a reduced surface resistance in Nb SRF cavities may be relevant for the development of SRF cavities in superconductor-based quantum computers [41, 42] as well as dark matter research [43].
VI Acknowledgments
We would like to acknowledge Jefferson Lab technical staff members for the cavity surface processing and cryogenic support. We would also like to thank E. Lechner for writing a Matlab program to do least-squares fitting with the model described in Refs. [24, 9] . This is authored by Jefferson Science Associates, LLC under U.S. DOE Contract No. DE-AC05-06OR23177.
References
- [1] P. Dhakal, G. Ciovati, and G. R. Myneni, A path to higher with large grain niobium cavities, in Proc. 3rd Int. Particle Accelerator Conf. (IPAC’12), New Orleans, LA, USA, May 2012, paper WEPPC091, pp. 2426-2428.
- [2] P. Dhakal, G. Ciovati, G. R. Myneni, K. E. Gray, N. Groll, P. Maheshwari, D. M. McRae, R. Pike, T. Proslier, F. Stevie, R. P. Walsh, Q. Yang, and J. Zasadzinzki, Effect of high temperature heat treatments on the quality factor of a large-grain superconducting radio-frequency niobium cavity, Phys. Rev. ST Accel. Beams 16, 042001 (2013).
- [3] A. Grassellino, A. Romanenko, D. Sergatskov, O. Melnychuk, Y. Trenikhina, A. Crawford, A. Rowe, M. Wong, T. Khabiboulline, and F. Barkov, Nitrogen and argon doping of niobium for superconducting radio frequency cavities: a pathway to highly efficient accelerating structures, Supercond. Sci. Technol. 26, 102001 (2013).
- [4] P. Dhakal, G. Ciovati, P. Kneisel and G. R. Myneni, Enhancement in quality factor of SRF niobium cavities by material diffusion, IEEE Trans. Appl. Supercond. 25, 3500104 (2015).
- [5] P. Dhakal,Nitrogen doping and infusion in SRF cavities: A review, Physics Open 5, 100034 (2020).
- [6] P. N. Koufalis et al., Low temperature nitrogen baking of a SRF cavities, in Proc. LINAC’16, East Lansing, MI, USA, Sep. 2016, pp. 472-474. doi:10.18429/JACoW-LINAC2016-TUPRC025
- [7] A. Grassellino et al., Unprecedented quality factors at accelerating gradients up to 45 in niobium superconducting resonators via low temperature nitrogen infusion, Supercond. Sci. Technol. 30, 094004 (2017).
- [8] P. Dhakal, S. Chetri, S. Balachandran, P.J. Lee,and G. Ciovati, Effect of low temperature baking in nitrogen on the performance of a niobium superconducting radio frequency cavity, Phys. Rev. Accel. Beams 21, 032001 (2018).
- [9] A. Gurevich, Theory of rf superconductivity for resonant cavities, Supercond. Sci. Technol. 30, 034004 (2017).
- [10] S. Posen, A. Romanenko, A. Grassellino, O.S. Melnychuk, and D.A. Sergatskov, Ultralow surface resistance via vacuum heat treatment of superconducting radio frequency cavities, Phys. Rev. Applied 13, 014024 (2020).
- [11] Q. Zhou,F. S. He,W. Pan, P. Sha, Z. Mi, abd B. Liu, Medium-temperature baking of 1.3 GHz superconducting radio frequency single-cell cavity. Radiat. Detect Techno.l Methods 4, 507–512 (2020).
- [12] H. Ito, H. Araki, K. Takahashi, and K. Umemori, Progress of Theoretical and Experimental Physics, ptab056 (2021).
- [13] E.M. Lechner, J.W. Angle, F.A. Stevie, M.J. Kelley, C.E. Reece, A.D. Palczewski, RF surface resistance tuning of superconducting niobium via thermal diffusion of native oxide, Appl. Phys. Lett., 119, 082601 (2021).
- [14] P. Kneisel, G. Ciovati, R. Bundy, B. Clemens, D. Forehand, B. Golden, S. Manning, B. Manus, F. Marhauser, R. Overton, R.A. Rimmer, G. Slack, L. Turlington, and H. Wang, Preliminary results from prototype niobium cavities for the JLAB Ampere-class FEL, IEEE Particle Accelerator Conference (PAC), 2007, pp. 2487-2489, doi: 10.1109/PAC.2007.4441292.
- [15] H. Padamsee, J. Knobloch, and T. Hays, RF Superconductivity for Accelerators. (Wiley-VCH Verlag GmbH and Co. KGaA, Weinheim, Second Ed., 2008).
- [16] G. Ciovati, P. Dhakal, and A. Gurevich, Decrease of the surface resistance in superconducting niobium resonator cavities by the microwave field, App. Phys. Lett., 104, 092601 (2014).
- [17] G. Ciovati, G. Eremeev, and F. Hannon, High field Q slope and the effect of low-temperature baking at 3 GHz. Physical Review Accelerators and Beams, 21(1), 012002 (2018).
- [18] C. Gorter and H. Casimir, Zur thermodynamik dessupraleitenden zustandes, Z. Tech. Phys.15, 539 (1934).
- [19] A. Pippard and W. L. Bragg, An experimental and theoretical study of the relation between magnetic field and current in a superconductor, Proc. R. Soc.A 216, 547 (1953).
- [20] D. C. Mattis and J. Bardeen, Theory of the anomalous skin effect in normal and superconducting metals, Phys. Rev. 111, 412 (1958).
- [21] G. Ciovati, Improved oxygen diffusion model to explain the effect of low-temperature baking on high field losses in niobium superconducting cavities, Appl. Phys. Lett. 89, 022507 (2006).
- [22] G. Ciovati, G. Myneni, F. Stevie, P. Maheshwari, and D. Griffins, High field Q slope and the baking effect: Review of recent experimental results and new data on Nb heat treatments, Phys. Rev. ST Accel. Beams 13, 022002 (2010).
- [23] Marc Wenskat, Jakub Čižek, Maciej Oskar Liedke, Maik Butterling, Christopher Bate, Petr Haušild, Eric Hirschmann, Andreas Wagner, and Hans Weise,Vacancy hydrogen interaction in niobium during low-temperature baking, Sci. Rep. 10, 8300 (2020).
- [24] A. Gurevich, Reduction of dissipative nonlinear conductivity of superconductors by static and microwave magnetic fields, Phys. Re. Lett. 113, 087001 (2014).
- [25] M. Martinello, M. Checchin, A. Romanenko, A. Grassellino, S. Aderhold, S. K. Chandrasekeran, O. Melnychuk, S. Posen, and D. A. Sergatskov, Field-enhanced superconductivity in high-frequency niobium accelerating cavities, Phys. Rev. Lett. 121, 224801 (2018).
- [26] A. Gurevich, Tunning microwave losses in superconducting resonators, Supercond. Sci. Technol. 36 063002 (2023).
- [27] S. B. Kaplan, C. C. Chi, D. N. Langenberg, J. J. Chang,S. Jafarey, and D. J. Scalapino, Quasiparticle and phonon lifetimes in superconductors, Phys.Rev.B 14,4854 (1976).
- [28] P. Dhakal, J. Makita, G. Ciovati, P. Kneisel, and G. R. Myneni, Nitrogen doping study in ingot niobium cavities, in the Proc. of IPAC15, Richmond VA, paper WEPWI009.
- [29] T. Kubo and A. Gurevich, Field-dependent nonlinear surface resistance and its optimization by surfacenanostructuring in superconductors, Phys. Rev. B., 100, 064522 (2019).
- [30] W. Desorbo, Effect of dissolved gases on some superconducting properties of niobium, Phys. Rev. 132, 107 (1963).
- [31] E. M. Lechner, B. D. Oli, J. Makita, G. Ciovati, A. Gurevich, and Maria Iavarone, Electron tunneling and X-ray photoelectron spectroscopy studies of the superconducting properties of nitrogen-doped niobium resonator cavities, Phys. Rev. A, 13, 044044 (2020).
- [32] E. M. Lechner, B. D. Oli, J. Makita, G. Ciovati, A. Gurevich, and Maria Iavarone, Characterization of dissipative regions of a N-doped superconducting radio-frequency cavity, Frontiers in Electronic Materials, 3, 1-14 (2023).
- [33] J. Halbritter, On RF residual losses in superconducting cavities, in Proc. 2nd Workshop on RF Supercond., Geneva, Switzerland, 1984, pp. 427-446.
- [34] G. Ciovati; R. Geng, J. Mammosser, and J. W. Saunders, Residual resistance data from cavity production projects at Jefferson Lab, IEEE Transactions on Applied Superconductivity 21 (2011).
- [35] W. P. M. R. Pathirana and A. Gurevich, Effect of random pinning on nonlinear dynamics and dissipation of a vortex driven by a strong microwave current, Phys Rev. B 103, 184518 (2023).
- [36] J. R. Delayen, H. Park, S. U. De Silva, G. Ciovati and Z. Li, Determination of the magnetic field dependence of the surface resistance of superconductors from cavity tests, Phys. Rev. Accel. Beams 21, 122001 (2018).
- [37] P. Kolb, Z. Yao, T. Junginger, B. Dury, A. Fothergill, M. Vanderbanck, and R. E. Laxdal, Coaxial multi-mode cavities for fundamental superconducting rf research in an unprecedented parameter space, Phys. Rev. Accel. Beams 23, 122001 (2020)
- [38] N.K. Raut, S.U. De Silva, J.R. Delayen, B.D. Khanal, J.K. Tiskumara, G. Ciovati, and P. Dhakal, Temperature, RF Field, and Frequency Dependence Performance Evaluation of Superconducting Niobium Half-Wave Coaxial Cavity, in Proc. 21th Int. Conf. RF Supercond. (SRF’23), Grand Rapids, MI, USA, Jun. 2023, pp. 686-690.
- [39] P. Kolb1, Z. Yao, A. Blackburn, R. Gregory, D. Hedji, M. McMullin, T. Junginger, and R. E. Laxdal, Mid-T heat treatments on BCP’ed coaxial cavities at TRIUMF, Front. Electron. Mater. 3 (2023).
- [40] L. Evans and S. Michizano, The international linear collider machine staging report 2017, arXiv:1711.00568 (2017).
- [41] A. Romanenko, R. Pilipenko, S. Zorzetti, D. Frolov, M. Awida, S. Belomestnykh, S. Posen, and A. Grassellino, Three-dimensional superconducting resonators at T 20 mK with photon lifetimes up to = 2s, Phys. Rev. Applied 13, 034032.
- [42] A. Krasnok, P. Dhakal, A. Fedorov, P. Frigola, M. Kelly, S. Kutsaev, Advancements in superconducting microwave cavities and qubits for quantum information systems, arXiv:2304.09345 (2023).
- [43] K. M. Backes, A. Palken, S. A. Kenany, B. M. Brubaker, S. B.Cahn, A. Droster, G. C. Hilton, S. Ghosh, H. Jackson, S. K. Lamoreaux, A. F. Leder, K. W. Lehnert, S. M. Lewis, M. Malnou, R. H. Maruyama, N. M. Rapidis, M. Simanovskaia, S. Singh, D. H. Speller, I. Urdinaran, L. R. Vale, E. C. van Assendelft, K. van Bibber,and H. Wang, A quantum enhanced search for dark matter axions, Nature 590, 238–242 (2021).