A thermodynamic criterion for the formation of Circumplanetary Disks
Abstract
The formation of circumplanetary disks is central to our understanding of giant planet formation, influencing their growth rate during the post-runaway phase and observability while embedded in protoplanetary disks. We use 3D global multifluid radiation hydrodynamics simulations with the FARGO3D code to define the thermodynamic conditions that enable circumplanetary disk formation around Jovian planets on wide orbits. Our simulations include stellar irradiation, viscous heating, static mesh refinement, and active calculation of opacity based on evolving dust fluids. We find a necessary condition for the formation of circumplanetary disks in terms of a mean cooling time: when the cooling time is at least one order of magnitude shorter than the orbital time scale, the specific angular momentum of the gas is nearly Keplerian at scales of . We show that the inclusion of multifluid dust dynamics favors rotational support because dust settling produces an anisotropic opacity distribution that favors rapid cooling. In all our models with radiation hydrodynamics, specific angular momentum decreases as time evolves in agreement with the formation of an inner isentropic envelope due to compressional heating. The isentropic envelope can extend up to and shows negligible rotational support. Thus, our results imply that young gas giant planets may host spherical isentropic envelopes, rather than circumplanetary disks.
1 Introduction
In the dominant planet formation paradigm of core accretion (Pollack et al., 1996), gas giants grow through accretion of solids and gas from the protoplanetary disk. At early times mass accretion onto the envelope is limited by Kelvin-Helmholtz cooling, which radiates away energy from gravitational contraction and accretion of solids; as the planet cools, more mass can become bound. In this phase, the outer boundary of the planetary atmosphere is matched to either the Hill Radius or Bondi Radius, whichever is smaller (e.g., Pollack et al., 1996; Ayliffe & Bate, 2009a; Tanigawa et al., 2012; Ormel et al., 2015; Cimerman et al., 2017; Kurokawa & Tanigawa, 2018; Lambrechts & Lega, 2017; Béthune & Rafikov, 2019; Zhu et al., 2021). A sharp transition in the evolution to the so-called “runaway” phase occurs when the envelope becomes strongly self-gravitating (Pollack et al., 1996; Hubickyj et al., 2005; Rafikov, 2006; D’Angelo & Lubow, 2008; Piso & Youdin, 2014; Lee & Chiang, 2015; D’Angelo et al., 2021). The envelope contraction rate accelerates, allowing mass to accrete onto the envelope at an increasing rate. This phase of growth is expected to continue until limited by the supply of gas from the disk.
Subsequent to the runaway phase, the envelope is thought to accrete at the rate supplied by the disk, which depends upon disk processes including gap opening and photoevaporation that reduce the mass supply (Lissauer et al., 2009; Mordasini et al., 2012; D’Angelo & Bodenheimer, 2013). The accretion of angular momentum from the disk, in excess of what can be accommodated within the spin angular momentum of the planet, leads to the expectation that circumplanetary disk formation will also happen at this time (Quillen & Trilling, 1998; Ward & Canup, 2010). This process has been studied with a range of methodologies from 1D solutions of the stellar-structure equations to fully three-dimensional radiation hydrodynamic simulations (Klahr & Kley, 2006; Marley et al., 2007; Spiegel & Burrows, 2012; Mordasini et al., 2012; Berardo et al., 2017; Aoyama et al., 2021; Lambrechts et al., 2019; Fung et al., 2019; Szulágyi et al., 2016, 2019; Marleau et al., 2023; Choksi et al., 2023).
Existing three-dimensional simulations have shown that post-runaway accretion can occur via either a distinguishable circumplanetary disk or via a weakly rotationally supported envelope, depending upon the thermal state of the circumplanetary gas. In the simplest (and best understood) limits, isothermal models produce robust rotationally supported disks, while adiabatic systems host weakly rotationally supported envelopes (Fung et al., 2019). More physically, this bifurcation in flow morphology can be related to the opacity, with pioneering work by Ayliffe & Bate (2009b) concluding that sufficiently low opacity enables strong rotational support. Follow-up work by Szulágyi et al. (2016) and Szulágyi (2017) instead frames the circumplanetary disk formation question in terms of temperature at the inner boundary of the simulation and planet mass.
For black hole accretion, the dividing line between the geometrically thin disks found in Active Galactic Nuclei, and the thick flows inferred for the Galactic Center and M87, is understood to depend upon how fast the gas can lose energy as it accretes (Rees et al., 1982). In this work, we seek an analogous thermodynamic criterion for circumplanetary disk formation in terms of the average cooling time and the specific angular momentum. Because of the primacy of opacity in setting the cooling as a function of location and the low temperatures of the disk, it is crucial to include dust dynamics (Chachan et al., 2021; Krapp et al., 2022). We develop and validate our cooling criterion using global, radiation hydrodynamic simulations of Jovian-mass planets in the outer regions of protoplanetary disks. The simulations include full multi-species dust transport that determines an actively evolving opacity, allowing us to account for how the variations in opacity due to the settling of different-size particles modifies the cooling time. We show how consideration of the cooling rate as a function of the radius within the Hill sphere both encompasses prior results and provides a more general criterion for circumplanetary formation that incorporates temperature, density, opacity, and planet mass.
This work is organized as follows. In Section 2 we introduce our numerical framework. In Section 3 we describe the main results of our numerical exploration with emphasis on the evolution of cooling time and specific angular momentum inside the Hill sphere. In Section 4 we discuss our findings and summarize our work.
2 Numerical Method
The numerical simulations in this work are carried out using the multi-fluid code FARGO3D (Benítez-Llambay & Masset, 2016; Benítez-Llambay et al., 2019). We first introduce the equations in Section 2.1, then continue with a summary of the key features of the numerical method in Section 2.2.
2.1 Equations
Our hydrodynamics simulations solve the following set of equations for the gas and dust fluid.
| (1) | |||||
| (2) | |||||
| (3) | |||||
| (4) |
for . , , and correspond to the gas and dust densities and velocities, respectively. The angular velocity . The dust diffusion flux is given by
| (5) |
where is the diffusion coefficient. The Stokes number corresponds to
| (6) |
with and the particle size and material density, respectively. In all our disk models, the maximum Stokes number at the vicinity of the planet is . To prevent large Stokes numbers at very low-density regions we force the maximum Stokes number to .
The gravitational potential includes the contributions from the central star and the planet and neglects the indirect term, thus
| (7) |
where is a softening length, and and correspond to planet mass and radial vector position. In this work, we consider a Jupiter mass-like planet on a fixed circular orbit at from the central star, with orbital frequency . The viscous stress tensor, , is given by
| (8) |
with the gas kinematic viscosity.
The gas energy is obtained from radiative transfer equation based on the Flux-Limited-Diffusion approximation (Krumholz et al., 2007),
| (9) |
with the gas internal energy, the gas temperature, the Planck mean opacity, the Rosseland mean opacity, the Stefan-Bolztmann constant, the radiative energy, and the radiative flux which is obtained as
| (10) |
where is the Rosseland mean opacity, is the speed of light, and is the flux-limiter defined as (Levermore & Pomraning, 1981)
| (11) |
with . In this work, we assume since they show little discrepancies at the scale of the Hill sphere in the calculations of Krapp et al. (2022). The Planck mean opacity is obtained utilizing the dust densities as
| (12) |
where is the obtained from the approximate emissivity averaged over the Planck spectrum (Barranco et al., 2018)
| (13) |
stellar, , and viscous, , heating terms in Eq. (9) are implemented following Bitsch et al. (2013).
2.2 numerical simulations
We solve Eqs. (1)-(4) using the code FARGO3D with nonuniform meshes and the rapid advection algorithm for arbitrary meshes (RAM) (Benítez-Llambay et al., 2023). We perform global three-dimensional simulations on a spherical mesh centered at the star, with coordinates . The numerical domain comprises only half of the disk in the vertical direction, with . The radial domain is set to whereas in azimuth we include the entire disk . Results will be described as a function of spherical coordinates centered at the planet defined as .
We use a nonuniform static mesh to increase the numerical resolution in the vicinity of the planet. The grid is obtained using a mesh density function method. For azimuth (and latitude) and radial direction, the mesh density functions follow from equations B1 and B8 of Benítez-Llambay et al. (2023), respectively. The parameters of the mesh density functions are shown in Table 2.2.
The planet potential is fixed at , and . In this work, we consider a planet mass of . The Hill radius correspond to . The softening length defines a sphere with a radius of grid cells centered at the planet, which gives (about of the Hill radius) for our standard resolution.
| Coord. | Center | Min/Max | a | b | c | |
|---|---|---|---|---|---|---|
| 0 | 15 | 512 | ||||
| 8 | 84 | |||||
| 9 | 260 |
2.2.1 Boundary conditions
Since we simulate only one disk hemisphere, we adopt reflecting boundary conditions at the disk equator. At we set if , otherwise . For all other variables, we set . We also set the radiative energy to with at . In the radial direction, we set the radial derivatives of the density and dust azimuthal velocity are set to zero. We additionally include buffer zones that restore the density to be equal to the initial value, which also prevents undesired reflections that may perturb the flow at the region of interest (de Val-Borro et al., 2006). In the inner buffer zone, we set the Rosseland mean opacity to to prevent the formation of a density bump due to the strong heating from stellar irradiation. Finally, we adopt periodic boundary conditions in the azimuthal direction.
2.2.2 Initial conditions and disk model
Our initial disk model considers an axisymmetric vertically isothermal protoplanetary disk with gas in hydrostatic equilibrium and dust in settling-diffusion equilibrium as described in (Krapp et al., 2022). The initial gas surface density and temperature . The initial dust surface density correspond to , where the dust-to-gas density ratio is obtained assuming a power-law distribution
| (14) |
The slope of the distribution corresponds to and the total dust-to-gas mass ratio is set to . The sizes are obtained considering a log-uniform distribution with and . We consider 7 dust fluids and each species has a size (that is the maximum size of each mass bin). The two fluids with smaller sizes are assumed to be well-mixed with the gas, thus, we only integrate the equations of 5 dust fluids in our simulations. The gas kinematic viscosity and dust diffusion are and , respectively.
The central star is a solar mass star with an effective temperature of and a radius of . Before introducing the planet, we run the disk model with stellar irradiation to find the axisymmetric equilibrium for all the quantities.
The balance between stellar irradiation and radiative cooling generates a hotter surface layer and a vertically isothermal disk region, consistent with the outcome of passively irradiated disk models (Chiang & Goldreich, 1997). The Hill sphere of the planet will be well embedded in this vertically isothermal region. We take the outcome from the radiative axisymmetric model after 10 orbits to generate the 3D disk initial conditions by expanding density, velocity, temperature, radiative energy, internal energy, and opacity along the azimuthal coordinate. In our models, the temperature, density, and velocity field converge to a numerical equilibrium after 10 orbits.
2.3 Simulation models
In this work, we consider five different simulations. The models denoted as standard, isothermal, and multifluid correspond to our baseline simulations. The standard model has no dust dynamics whereas the multifluid evolves the opacity self-consistently from dust dynamics. The isothermal model does not include radiative transfer and assumes a local isothermal equation of state with . We additionally include a run, high_res that doubles the resolution of the standard simulation inside the Hill sphere (). Finally, we will compare the results of the standard model with a reduced opacity model, low, where the dust-to-gas ratio is set to .
2.3.1 Analysis
To present our results we interpolate the data onto a spherical mesh of radius centered at the planet location. The mesh is evenly spaced with cells. We define the spherical average of a given scalar as . We calculate on the semi-sphere with radius as
| (15) |
The total average inside a semi-sphere of radius is obtained as
| (16) |
where denoted the number of grid cells utilized in the interpolation along the radial direction (e.g., for ).
3 Results
In this section, we identify an empirical criterion for the formation of rotationally supported circumplanetary structures. We focus on the correlation between effective cooling time scale and specific angular momentum, which ultimately governs CPD formation. We also provide comprehensive descriptions of the envelope structure and flow patterns observed in our simulation suite. We provide evidence that the slowly evolving three-dimensional flows within the Hill sphere arise due to a subtle balance between accretion and advection of momentum.
In particular, we show that a critical cooling time of only at scales of produces weakly rotationally supported envelopes. The choice of is motivated by the truncation radius in isothermal models of circumplanetary disks (Canup & Ward, 2002; Martin & Lubow, 2011). That this critical value falls far below unity in the local dynamical timescale illustrates the degree to which even very rapid cooling is not well captured by isothermal runs. We shall show that this criterion is also consistent with previous numerical results from a diverse range of setups.
We also find that rotational support and cooling time in non-isothermal runs are not steady-state quantities that can be assigned to a given planet parameter set. Instead, we find that both quantities continue to evolve over tens to hundreds of orbits. Thus we frame the formation of CPDs not as a dichotomy, but as a time-dependent question.
3.1 Relating cooling, contraction, and rotational support
Our simulation suite reveals a correlation between the evolution of the specific angular momentum contained within planetary envelopes, and the cooling rate of the envelope. The balance between the two sets the degree of rotational support in the gas. As the cooling time grows, the luminosity from the contracting atmosphere is increasingly trapped within the envelope, increasing local pressure support. This pressure support helps to drive circulation patterns, which in turn lead to an outward flux of specific angular momentum. Because the quantities evolve slowly in time, our choice of a CPD criterion is based on the measured envelope cooling rate, rather than based on innate parameters of the run.
Assuming most of the energy is carried away by the radiative diffusion flux with , we estimate the effective cooling time scale of the envelope as
| (17) |
where is the specific heat capacity at constant volume and is the luminosity of the semi-sphere of radius and is obtained from the radiative flux as
| (18) |
Note that the choice of integration limits means that defined here is not the Kelvin-Helmholtz timescale of the contracting protoplanetary envelope in a volume with radius . Instead, this definition of captures the cooling timescale of the spherical shell of gas between and . Thus, indicates how fast material between and has to cool down to become rotationally supported. With this definition, the cooling time tends to increase towards smaller , which captures the fact that CPDs form from the outside in when the gas is not isothermal. While formally our Eq. (17) includes the Hill surface, in our numerical calculations we will only integrate a volume up to . This choice is only a matter of convenience to avoid the sharp gradients in the luminosity introduced by the shocks of the spiral wakes generated by the planet. These shocks could lead to cases with when the surface matches the location of the shock.
Our cooling time only accounts for the radiative flux, neglecting any contributions from convection (advection of energy through the surfaces). In principle one could modify the definition to account for convective energy transport, however in this case one would expect rotational support to be negligible.
In addition to the effective cooling time we calculate the specific angular momentum111Note that corresponds to the vertical component of the specific angular momentum vector along a -axis centered at . of the envelope defined as
| (19) |
We normalize the specific angular momentum to the Keplerian specific angular momentum defined as , with .
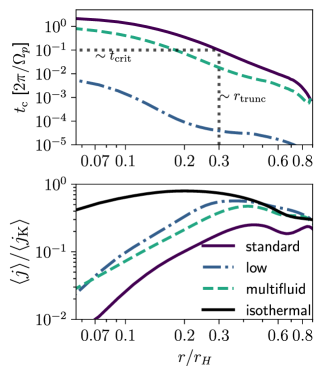
In Figure 2 we show the obtained values of and after 20 orbits for the multifluid, low and standard models. The isothermal model provides a useful upper bound on the specific angular momentum contained within the envelope (for fixed planet parameters). In this case, we find that at . This degree of support corresponds to a canonical thick, circumplanetary disk like morphology in the gas.
In assessing the dividing line between relatively strong and weak rotational support, we look for the values of such that . Overall, we find that
| (20) |
Eq. (20) sets a thermodynamic criterion for the presence of substantially rotational-supported envelopes at scales of .
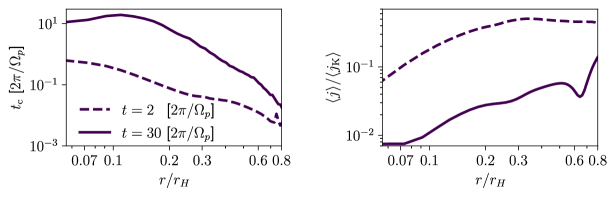
In Figure 2 we show that at scales of , the specific angular momentum when for multifluid and low after 20 orbits. However, the standard model shows lower specific angular momentum with a slightly longer cooling time. While the isothermal model has reached a steady state, the specific angular momentum continuously decreases as cooling time increases in the rest of the models. This lack of steady-state can be seen in Figure 3, where in the top row we show the obtained values of and after 2 and 30 planetary orbits for the standard model. To further validate the criterion of Eq. (20) we include two additional runs as well as a qualitative comparison with results from the works of Ayliffe & Bate (2009b) and Szulágyi et al. (2016) in Appendix A. In all cases, we show that the criterion given by is satisfied.
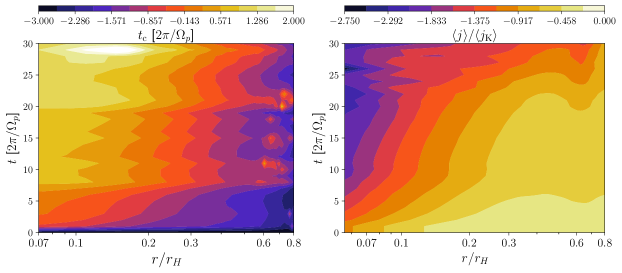
To illustrate the evolution of cooling time and rotational support, in Figure 3 (bottom row) we also show their simultaneous evolution in time and radius. In the left panel, the color map shows the effective cooling time as a function of the planet’s orbital time, , and radial distance from the planet, . Initially, rapidly increases to reach a monotonic growth phase. The right panel shows the same color map but for the specific angular momentum. After 30 orbits, the specific angular momentum continues to decrease for . The decay of the specific angular momentum (even in nearly isothermal conditions) is due to the formation of an isentropic envelope at the smoothing length due to compressional heating from work. In this region, the gas pressure increases with time, with a more steep pressure gradient. As we will show in Section 3.1.1 this pressure gradient is enough to balance the planet’s potential.
3.1.1 Radial force balance
To better understand the coupled evolution of cooling and rotational support, we consider the radial force balance within the envelopes. Initially, all of the the simulations, regardless of thermodynamics, show coherent rotational support at scales of . The average specific angular momentum of the in-falling material is usually some fraction of (Ward & Canup, 2010). As the sytem evolves, this specific angular momentum can be partially restored to the background protoplanetary disk by torques and/or advection of momentum. Moreover, the coupling between and through the radial momentum equation implies that some fraction of the angular momentum can also be delivered into radial momentum as the pressure gradient balances the gravitational force. For example, consider a coordinate system centered at the planet’s potential, the radial momentum equation corresponds to
| (21) |
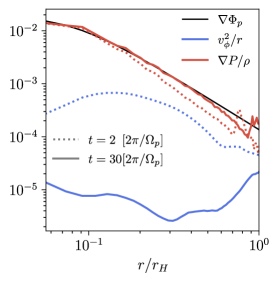
where is the smoothed potential of the planet. Eq. (21) is coupled with continuity equations, energy flux, azimuthal and meridional momentum. Now, assume that initially, the system is nearly (but not perfectly) at rotational equilibrium, that is . Since the gas inside the Hill sphere is not perfectly balanced, radial and meridional flows can deliver mass and entropy into the system, which in turn can increase the pressure support. As the pressure support increases to balance the gravitational acceleration, i.e., , the rotational support provided by will diminish, turning into radial momentum. Therefore, the system will evolve from a CPD-like morphology (partially rotationally supported gas flow) to a near spherically symmetric and pressure-supported envelope. To further test this hypothesis we consider the spherical average of the radial force equation. Neglecting viscous forces, the average radial force balance equation at the planet reference frame can be cast as
| (22) |
where is the planet potential (including the smoothing length). In Figure 4 we show the the spherical average of the terms in Eq.(22). We omit the term since is at least one order of magnitude smaller than . During the first planetary orbits, provides additional support at scales . However, as time evolves, rotational support becomes negligible and the pressure gradient will balance the gravitational acceleration inside the Hill sphere. Moreover, the rate at which pressure support increases is the same rate as rotational support decreases. The rates are shown in Fig. 5 where we plot the azimuthal velocity measured from the simulations together with the estimated velocity obtained assuming radial force balance, e.i, . Both velocities decrease as a function of time and the obtained rate suggests that pressure balance should be fully reached after 50 planetary orbits. This rate indicates a short-lived rotationally supported envelope, however, this time scale is sensitive to the local physics of the disk.
3.2 Envelope structure in numerical models
In this section, we describe the properties of the flow inside the Hill sphere for our simulations. We start by describing the velocity field for the standard, multifluid and isothermal models. We also compare the results with a higher-resolution simulation to test the degree of numerical convergence. We denote the higher-resolution model with high_res. The model has the same initial conditions and parameters as the standard run, however, the mesh has been defined to achieve a resolution of , whereas the standard run has . Since we double the resolution, we also decrease the smoothing length for the high_res model ().
3.2.1 Meridional velocity field and accretion
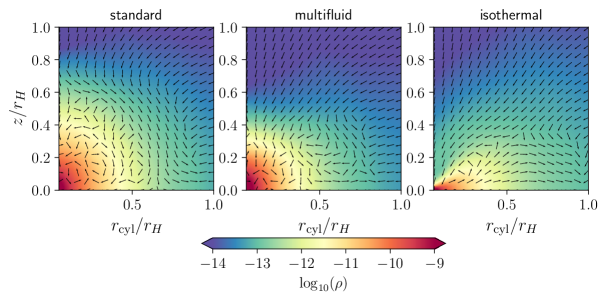
In Figure 6 we show the azimuthal average density inside the Hill sphere for the standard, multifluid and isothermal models at . The results are displayed in cylindrical coordinates centered at the planet’s potential. The isothermal run shows circumplanetary disks that extend out to . Contrary, the standard model displays a spherically symmetric density substructure that extends out to . The multifluid model, shows a similar spherically symmetric envelope as obtained in the standard model, however, the radial extension of the envelope in this case is about .
In Figure 6 we also include the azimuthal average of the meridional velocity field defined as , that is, the velocity field obtained from the average of the radial and vertical cylindrical velocities. The standard model shows two distinctive patterns in the flow. At the inner regions , the mean flow is dominated by meridional circulation with a characteristic scale of .
Beyond the mean field has a vertical inflow that may penetrate the interior to only near . Away from that polar region, the flow circulates and leaves the Hill sphere at the midplane.
The meridional velocity field indicates that the envelope at is partially shielded from the circulating material coming from the protoplanetary disks. This partially shielded interior region has been also reported in radiation hydrodynamical simulations (Lambrechts et al., 2019) and adiabatic models with thermal relaxation (Kurokawa & Tanigawa, 2018). We show in Section 3.2.3 that the gas inside this partially shielded region is an isentropic envelope in nearly hydrostatic equilibrium. On the other hand, the material from the protoplanetary disks can reach the interior of the circumplanetary disks in the isothermal model. In this case, the meridional flow shows that polar inflow can reach the circumplanetary disks at scales , and material leaves the Hill sphere at the midplane (Tanigawa et al., 2012; Kurokawa & Tanigawa, 2018; Béthune & Rafikov, 2019; Fung et al., 2019).
On average, the accretion towards the planet can be studied as a by-product of the meridional circulation. The mass flux through the Hill surface is obtained from the balance between mid-plane outflow and polar inflow, and is given by , where is the unit vector along . Inflow and outflow correspond to cases with and , respectively.
In the isothermal model, we found that the outflow and inflow flux balances within 1%-10% at the scale of the Hill radius, in agreement with results reported in previous isothermal global models (Fung et al., 2019; Krapp et al., 2022; Choksi et al., 2023). Note, however, that the inclusion of a sink inside the smoothing length could lead to a different meridional flow pattern, but will not alter the accretion regime in a significant manner (Choksi et al., 2023). We discuss the need for more realistic boundary conditions in Section 4.
At we report inflow and outflow values of with a net flux of for the isothermal model. Inside the Hill radius, the inflow/outflow rates increase giving , with a net flux of at .
Overall, the total mass increases during the first 5 orbits. After this short growing phase phase, the envelope has become rotationally supported. Subsequently, there is a density (mass) re-adjustment where the total mass of the envelope slowly decreases.
In the standard and multifluid model, the mass flux is dominated by inflow at with a net flux of . However, a transition to outflow-dominated flux occurs at in both cases, with a similar net flux . The total mass inside the Hill sphere increases as a function of time until pressure support fully balances the potential of the planet. The timescale for this mass adjustment is about and orbits for the standard and multifluid models, respectively. Overall, the flux of mass obtained in our simulations is in good agreement with previous work of Ayliffe & Bate (2009a), but somewhat lower than those reported in Szulágyi et al. (2014); Lambrechts et al. (2019). Note that our Jupiter mass planet is at a distance of while in previously mentioned works simulations adopt disk conditions at a distance of . The choice of a different initial condition, disk viscosity, and numerical resolution complicates a detailed comparison between the measured accretion rates in physical units. We emphasize the good qualitative agreement of the meridional circulation patterns inside the Hill sphere.
3.2.2 3D flow topology
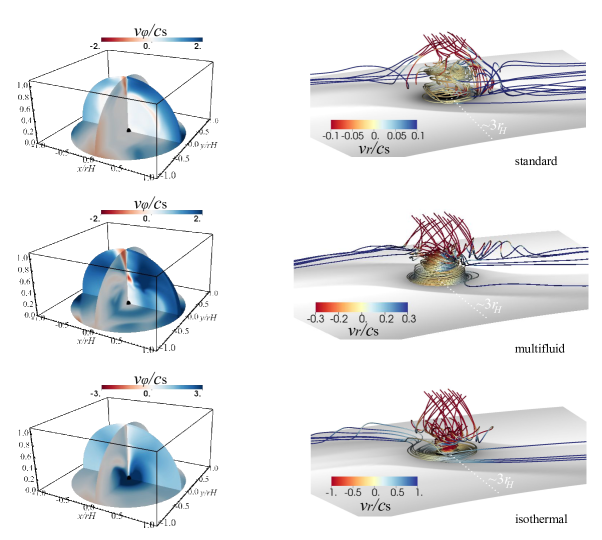
In Figure 7 we compare the topology of the velocity field between the standard, multifluid, and isothermal models222The low model show similar results to the multifluid case, with a isentropic region inside and weak rotational support between .. The left panels of Figure 7 show the azimuthal velocity inside the Hill sphere. The azimuthal velocity in the isothermal highlights the presence of a CPD where . The supersonic azimuthal velocity indicates the strong rotational support at that scale. By contrast, the standard model shows negligible rotational support within the Hill Sphere. In turn, the flow is dominated by small-scale fluctuations, consistent with the small circulation pattern depicted in Figure 6 with the meridional velocity field.
Intermediate between these regimes is the multifluid model, which still shows a coherent rotational velocity (net specific angular momentum) after orbits. While the gas is slowly evolving towards a spherically symmetric isentropic envelope as in the standard model, the transitory phase with faster cooling and higher net-specific angular momentum could promote the formation of a dusty sub-disk. We defer a detailed discussion of the dust substructure to subsequent work (Paper II), and limit our discussion in this work to the critical cooling time and properties of the gas flow.
The right panels of Figure 7 show the streamlines of the velocity field after 30 planetary orbits in each model. Within the Hill sphere, the systems have all reached a steady state in their flow field at this time, despite the aforementioned slow evolution in cooling time and specific angular momentum. In contrast, outside the Hill radius, the background protoplanetary disk continues to evolve as the planet carves a gap; however, gap opening seems to have little impact on the structure of the inner envelope. The simple expectation is a slow reduction of the mass flux towards the Hill surface (Lin & Papaloizou, 1993). In all models, inflow dominates near the polar regions, however, only in the isothermal model do the streamlines penetrate within . The outflowing streamlines match up with the location of the spiral wakes excited by the planet.
Of particular note is that in the models including radiative transfer, both inflow and outflow within the Hill Sphere are subsonic. This finding is in stark contrast to what is typically assumed in the core accretion model of giant planets in this mass range (Lissauer et al., 2011; Marleau et al., 2023). Supersonic flow is only seen in model low, where the opacity has been dramatically reduced to approach isothermal conditions. In this case, a weak shock forms above as the flow reaches the CPD surface. This shock introduces an order-of-magnitude jump in the average luminosity (see Figure 9. Supersonic accretion at nearly the free-fall speed is only obtained for the local isothermal simulation. A dramatic reduction in the infall velocity could ultimately have implications for the assumed generation of accretion shocks, either on to CPDs or the planetary surface itself. We discuss in Section 3.2.3 other apparent discrepancies between our radiative transfer models and the standard assumptions of core accretion.
3.2.3 Comparison with Spherically Symmetric Core Accretion Models: An isentropic structure?
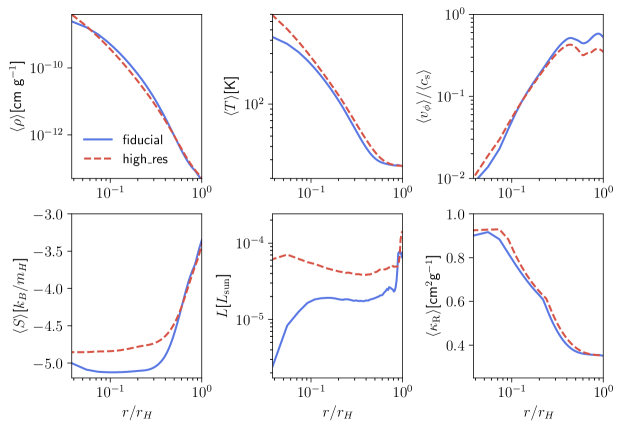
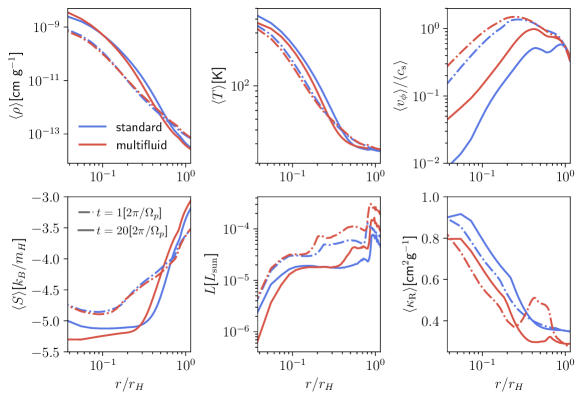
To further compare our models with one-dimensional core accretion theory, we calculate the spherical average of the density, temperature, opacity, azimuthal velocity, entropy, and luminosity. In Figure 8 we show the comparison between the runs high_res and standard whereas in Figure 9 we compare the runs multifluid and standard. We calculate the entropy:
| (23) |
where and are the Boltzmann constant and proton mass, respectively.
In all cases simulated in this work, the spherical average of the envelope is characterized by three different regions. An inner isentropic domain at , an outer isothermal domain at , and a transition between both isentropic and isothermal regimes where luminosity is nearly constant.
As shown in Figure 6, the isentropic region works as a barrier for the meridional flow (see e.g., Kurokawa & Tanigawa, 2018). Whether this region is a numerical manifestation of the slowly contracting envelopes envisioned by Ginzburg & Chiang (2019) remains uncertain. Different boundary conditions at the scales of the smoothed potential could alter the formation of an isentropic inner envelope, though see (Choksi et al., 2023). One reason for the formation of the isentropic envelope is that the flow is not at equilibrium with the planet’s potential initially. Therefore, the internal energy interior to the smoothing length increases as the material is compressed, adding heat to the system due to work. Initially, this term introduces an energy rate between at scales due to the converging flow towards the planet potential. After 20 orbits as material continues to accrete near the smoothing length. This energy rate is sufficient to increase pressure support and form an isentropic region near the smoothed potential. Note that in this work we do not include a source of energy inside the smoothing potential as accretion luminosity (Benítez-Llambay et al., 2015), which could further increase the cooling time inside the Hill sphere.
While the multifluid model shows an isentropic and nearly spherically symmetric envelope at scales of , the streamlines and azimuthal velocity shown in Figure 7 indicate the presence of rotation as well. We find that the dust within this region can successfully settle into an at least transitory CPD-like structure. We will explore the properties of the dust component of the multilfluid model in Paper II. For the low run, the isentropic envelope forms at scales of . This result suggests that a more significant reduction of the opacity is required to rapidly cool the area near the smoothing length.
3.2.4 Hydrostatic Modeling
After dividing the envelope into an isothermal and isentropic regime, the spherical average of the temperature and density can be modeled from solutions of the momentum equation in nearly hydrostatic equilibrium. As time evolves and the flow reaches a quasi-steady state the position of the isentropic and isothermal boundaries do not vary. We denote the isentropic boundary as . In particular, inside the isentropic domain, the temperature can be described by the hydrostatic equilibrium solution
| (24) |
where the temperature at the isentropic radius, , is . The density is obtained from the isentropic condition . The size of the isentropic region decreases as rotational support becomes important. It seems as well that the critical cooling time is obtained at for the standard and multifluid models. This result implies that if one could estimate the value of from the initial disk conditions and the planet mass, one could also estimate the inner extension of the rotationally supported envelope. However, obtaining the value of from initial conditions will require a thorough numerical exploration with better-informed boundary conditions at the scales of the smoothed planet potential. Note that the outer extension of the circumplanetary disk is set by the tidal truncation radius (Martin & Lubow, 2011). In cases where no rotational support is expected.
3.2.5 Model Comparisons and Numerical Convergence
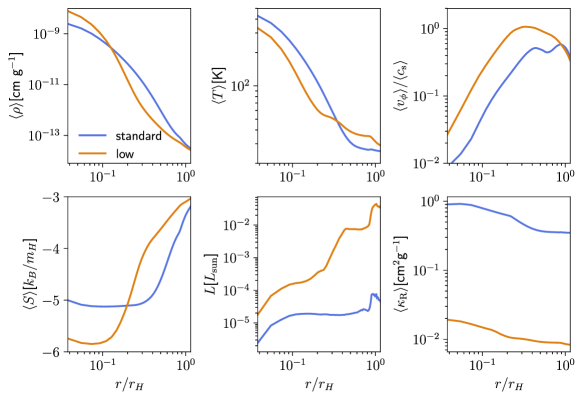
Besides characterizing the spherical average of the planet’s envelope, the results displayed in Figure 8 also show a high degree of convergence with numerical resolution. As expected, as we increase the resolution we reach hotter and denser regions of the envelope which can be seen at scales . This hotter envelope shows a rise in the temperature of about between in comparison to the standard model, as well as a slightly lower density at the same scales. These small difference in the density and temperature introduce only a small discrepancy of a factor between the luminosities of each model. The luminosities are shown in the bottom-middle panel of Figure 8. The higher luminosity and small differences between temperature and density imply a slightly shorter cooling time for the higher-resolution run. However, the degree of rotational support is in very good agreement between the two models, as shown in the top-right panel of Figure 8.
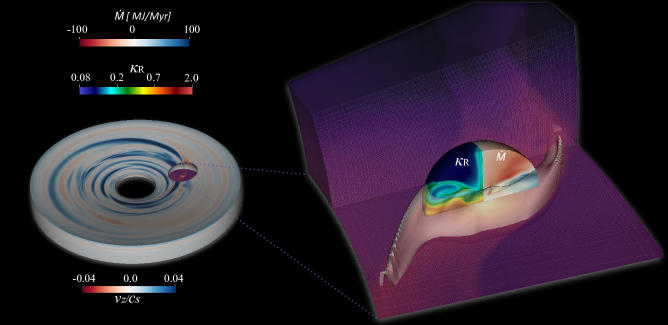
The same comparison is displayed in Figure 9 for the standard and multifluid model. In this comparison, we include the results after 1 and 20 orbits, respectively. Both models show a similar time evolution, with density, and temperature increasing as the envelope reaches equilibrium. Both models obtain a similar average density, while the temperature and opacity are slightly smaller in the multiluid model. Initially, the multifluid model also shows a slightly higher luminosity at scales . These differences between average temperature, opacity, and luminosity translate into a shorter cooling time for the multifluid model. Simultaneously, rotational support is more prominent in the multifluid model. However, note as well that the ratio decreases as a function of time in both standard and multifluid model. In turn, both models show a nearly isentropic inner region. While on average the Rosseland mean opacities are nearly the same between both models, the multifluid run shows an anisotropic distribution which introduces a (locally) shorter cooling time above the midplane (see Figure1). The spherical average shown in Figure9 does not highlight the faster cooling on the surface of the disk due to high opacity at the midplane. Therefore, this anisotropic cooling favors rotational support. This result highlights the importance of self-consistent opacity modeling based on dust dynamics (Krapp et al., 2022). We have only considered here a single size distribution and we anticipate that reducing the mass load in the small grains will promote even faster cooling of the envelope. Therefore, the inclusion of dust evolution will also be crucial to accurately evaluate the thermodynamic criterion for CPD formation.
4 Discussion and Conclusions
The formation of circumplanetary disks has profound implications for the growth of the planet (Pollack et al., 1996; Lubow et al., 1999), the formation of natural satellites (Canup & Ward, 2002; Mosqueira & Estrada, 2003), and the potential detection of giant protoplanets (Isella et al., 2014; Benisty et al., 2021). Understanding the conditions for the formation of circumplanetary disks is therefore a crucial task for planet formation theories. Thus, in this work, we provide a thermodynamic criterion for the formation of rotationally supported envelopes around embedded planets. We believe that our criterion based on effective cooling time (see Eq. (20)) synthesizes previous results from numerical simulations where circumplanetary disk formation is addressed in terms of opacity (Ayliffe & Bate, 2009b) and inner temperature cap (Szulágyi et al., 2016; Szulágyi, 2017) (a comparison is shown in Appendix A. We expect that Eq. (20) is a necessary but not sufficient condition for the formation of circumplanetary disks, due to the formation of an inner isentropic envelope even with short cooling times. Moreover, Eq. (20) can not be trivially cast in terms of disk initial conditions and planet mass. Therefore, to confirm the formation of circumplanetary disks we need to solve the radiation hydrodynamics equation to determine the evolution of specific angular momentum inside the Hill radius.
A common outcome of our non-isothermal models is the formation of an inner isentropic envelope, which is very weakly rotational. Typically, we find that the isentropic region extends out to , though the radial extension depends on the cooling conditions. This envelope structure has been observed in a variety of previous models in both the shearing sheet and global formalisms (Szulágyi et al., 2016; Lambrechts & Lega, 2017; Zhu et al., 2021; Bailey & Zhu, 2023). Nevertheless, it remains unclear if this outcome captures an astrophysical phenomenon: heating from accretion onto a protoplanet, or if it is a consequence of choices of boundary conditions or thermodynamic approximations. We have verified that this isentropic region is not simply the result of insufficient resolution, which is consistent with the existence of the envelope in previous numerical work (e.g. (Szulágyi et al., 2016)) which achieved higher maximum resolution over short timescales.
In our simulations, we have identified that the main source of heat inside the smoothing length is due to the compressional heating term in the energy equation: . This energy input prevents rapid radiative cooling and as time evolves it significantly contributes to the formation of the isentropic envelope, even in cases with reduced opacity of %2 the standard value. Besides heating from , cells inside the smoothing length show modest heating from artificial viscosity since we do not use a tensor for the artificial viscosity as discussed in (Stone & Norman, 1992). Without a full treatment of the flow down to the planetary surface, including accurate thermodynamics and the self-gravity of the growing protoplanet envelope, it is not possible to determine whether this heating over or underestimates that which would be provided by a real growing planet.
Despite the uncertainties as to the origin of this isentropic region, it is consistent with some modern post-runaway models of slowly contracting giant planets (Ginzburg & Chiang, 2019). Contrary to the rapid contraction model where the material is supplied by a circumplanetary disk (Mordasini et al., 2012; Berardo et al., 2017), the growth of a slow-contracting (nearly isentropic) envelope is driven by spherical accretion. Therefore, a better understanding of the formation of the isentropic region warrants further exploration, since we do not include additional heating sources such as accretion luminosity or shocks inside the smoothing length.
Because of the lingering uncertainties in how to accurately correlate protoplanet energy input rates with astrophysical parameters (disk opacity, semi-major axis, protoplanet mass), the cooling criterion presented in this work is a useful benchmark for analytic and numerical models, that is agnostic to numerical choices. We stress that the formation of an inner isentropic envelope does not alter the correlation between specific angular momentum and cooling time described in this work. The correlation between specific angular momentum and cooling time is expected from an idealized model of a slow contracting unmagnetized gas cloud (Nakamoto & Nakagawa, 1994). That is, a shorter cooling time could favor stronger rotational support that becomes dominant in the isothermal limit. In this work, we found the specific angular momentum is always smaller than that obtained in isothermal disk models. In our global simulations, envelopes only reach isothermal conditions at scales , even in cases with reduced dust-to-gas mass ratio (see low model). Thus, our results show that radiation hydrodynamics models with cooling times comparable to the orbital timescale bear little resemblance to isothermal models, even though this is a metric commonly invoked as “nearly isothermal”.
This cooling time scale, and therefore the rotational support of the gas envelope is sensitive to the opacity distribution. In this work, we have validated our thermodynamic criterion with multifluid simulations where the mean opacity is updated based on the local dust dynamics. We have considered standard-size distributions and settling-diffusion equilibrium. As shown in Krapp et al. (2022), a different settling condition (and/or dust-to-gas mass load) impacts the opacity gradient. In cases where micron size grains are depleted, due to e.g. dust evolution (Birnstiel et al., 2012), more anisotropic opacity distributions are expected at scales of and therefore shorter cooling times. In turn, rotational support could increase.
Our global simulations with sufficient resolution at scales of the Hill radius also show that material is not in free-fall, but rather is characterized by subsonic meridional circulation. Therefore, our global simulations can better inform the boundary conditions utilized in local models (Berardo et al., 2017; Marleau et al., 2023). Simultaneously, future global simulations could be improved by matching conditions of local models at the scale of the smoothing length (typically 100 to 1000 Jupiter radii). We stress, however, that a self-consistent model that connects the Hill sphere down to the core surface should also account for the gravitational potential and gravitational energy of the gas (Béthune & Rafikov, 2019) as well as a more accurate equation of state (D’Angelo & Bodenheimer, 2013). We have improved on existing models by including a multifluid approach to solve the dust dynamics. Our multifluid model is crucial to accurately calculate the gas (material) opacity where temperatures are lower than , as well as, to characterize the distribution of solids (up to -size particles) of the planet’s envelope.
5 Software and third party data repository citations
All the data was generated with a modified version of the open-source software FARGO3D available at https://bitbucket.org/fargo3d/public.git. The data underlying this article will be shared on reasonable request to the corresponding author.
Appendix A Additional runs
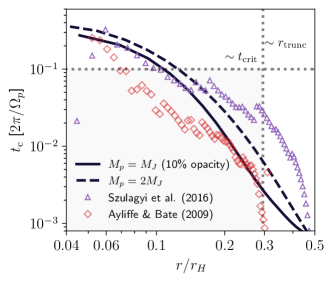
In this section, we validate the cooling criterion (20) including two additional runs with our setup from Section 2. The first run considers a Jupiter mass planet and a reduced opacity with , whereas the second run corresponds to the standard model with a planet mass . In these two cases, we report cooling times shorter than and average specific angular momentum of at scales of , providing additional support to our criterion. The cooling times obtained after 30 planet’s orbits in our models are shown in Figure 10. In both cases, an isentropic envelope forms after 60 planetary orbits, and specific angular momentum decreases as reported for the standard run.
In Figure 10 we additionally include the results from the previous works of (Ayliffe & Bate, 2009b) and (Szulágyi et al., 2016) and estimate the cooling time based on density and temperature profiles. In the case of Ayliffe & Bate (2009b) we consider the case of with a one-percent IGO reduced opacity (data obtained from dashed line profiles in Figure 2 from Ayliffe & Bate (2009b)), whereas in the case of Szulágyi et al. (2016) we consider the case with and (blue curve in Figure 3 from Szulágyi et al. (2016)). Both cases show the formation of circumplanetary disks, and therefore the effective cooling time should be shorter than if energy is predominantly transported by radiative diffusion. There are several differences between our models and those from Ayliffe & Bate (2009b) and Szulágyi et al. (2016), therefore our comparison is meant to be qualitative. On the one hand, these previous works consider the planet at from the central star where viscous heating is likely to set the temperature near the midplane. Moreover, Ayliffe & Bate (2009b) also includes the self-gravity of the gas, which is neglected in our case. Note as well that the integration time scales, numerical resolution, and methods are also substantially different in all cases. Finally, since we do not have access to the opacity calculation, we estimate the opacity utilizing the table from Bell & Lin (1994) (variations in the opacity may introduce discrepancies of a factor of a few in the cooling time). Overall, the cooling time is well below the , which agrees with the formation of circumplanetary disks discussed in both works.
References
- Aoyama et al. (2021) Aoyama, Y., Marleau, G.-D., Ikoma, M., & Mordasini, C. 2021, ApJ, 917, L30, doi: 10.3847/2041-8213/ac19bd
- Ayliffe & Bate (2009a) Ayliffe, B. A., & Bate, M. R. 2009a, MNRAS, 393, 49, doi: 10.1111/j.1365-2966.2008.14184.x
- Ayliffe & Bate (2009b) —. 2009b, MNRAS, 397, 657, doi: 10.1111/j.1365-2966.2009.15002.x
- Bailey & Zhu (2023) Bailey, A., & Zhu, Z. 2023, arXiv e-prints, arXiv:2310.03117, doi: 10.48550/arXiv.2310.03117
- Barranco et al. (2018) Barranco, J. A., Pei, S., & Marcus, P. S. 2018, ApJ, 869, 127, doi: 10.3847/1538-4357/aaec80
- Bell & Lin (1994) Bell, K. R., & Lin, D. N. C. 1994, ApJ, 427, 987, doi: 10.1086/174206
- Benisty et al. (2021) Benisty, M., Bae, J., Facchini, S., et al. 2021, ApJ, 916, L2, doi: 10.3847/2041-8213/ac0f83
- Benítez-Llambay et al. (2019) Benítez-Llambay, P., Krapp, L., & Pessah, M. E. 2019, ApJS, 241, 25, doi: 10.3847/1538-4365/ab0a0e
- Benítez-Llambay et al. (2023) Benítez-Llambay, P., Krapp, L., Ramos, X. S., & Kratter, K. M. 2023, ApJ, 952, 106, doi: 10.3847/1538-4357/acd698
- Benítez-Llambay et al. (2015) Benítez-Llambay, P., Masset, F., Koenigsberger, G., & Szulágyi, J. 2015, Nature, 520, 63, doi: 10.1038/nature14277
- Benítez-Llambay & Masset (2016) Benítez-Llambay, P., & Masset, F. S. 2016, ApJS, 223, 11, doi: 10.3847/0067-0049/223/1/11
- Berardo et al. (2017) Berardo, D., Cumming, A., & Marleau, G.-D. 2017, ApJ, 834, 149, doi: 10.3847/1538-4357/834/2/149
- Béthune & Rafikov (2019) Béthune, W., & Rafikov, R. R. 2019, MNRAS, 488, 2365, doi: 10.1093/mnras/stz1870
- Birnstiel et al. (2012) Birnstiel, T., Klahr, H., & Ercolano, B. 2012, A&A, 539, A148, doi: 10.1051/0004-6361/201118136
- Bitsch et al. (2013) Bitsch, B., Crida, A., Morbidelli, A., Kley, W., & Dobbs-Dixon, I. 2013, A&A, 549, A124, doi: 10.1051/0004-6361/201220159
- Canup & Ward (2002) Canup, R. M., & Ward, W. R. 2002, AJ, 124, 3404, doi: 10.1086/344684
- Chachan et al. (2021) Chachan, Y., Lee, E. J., & Knutson, H. A. 2021, ApJ, 919, 63, doi: 10.3847/1538-4357/ac0bb6
- Chiang & Goldreich (1997) Chiang, E. I., & Goldreich, P. 1997, ApJ, 490, 368, doi: 10.1086/304869
- Choksi et al. (2023) Choksi, N., Chiang, E., Fung, J., & Zhu, Z. 2023, MNRAS, 525, 2806, doi: 10.1093/mnras/stad2269
- Cimerman et al. (2017) Cimerman, N. P., Kuiper, R., & Ormel, C. W. 2017, MNRAS, 471, 4662, doi: 10.1093/mnras/stx1924
- D’Angelo & Bodenheimer (2013) D’Angelo, G., & Bodenheimer, P. 2013, ApJ, 778, 77, doi: 10.1088/0004-637X/778/1/77
- D’Angelo & Lubow (2008) D’Angelo, G., & Lubow, S. H. 2008, ApJ, 685, 560, doi: 10.1086/590904
- D’Angelo et al. (2021) D’Angelo, G., Weidenschilling, S. J., Lissauer, J. J., & Bodenheimer, P. 2021, Icarus, 355, 114087, doi: https://doi.org/10.1016/j.icarus.2020.114087
- de Val-Borro et al. (2006) de Val-Borro, M., Edgar, R. G., Artymowicz, P., et al. 2006, MNRAS, 370, 529, doi: 10.1111/j.1365-2966.2006.10488.x
- Fung et al. (2019) Fung, J., Zhu, Z., & Chiang, E. 2019, ApJ, 887, 152, doi: 10.3847/1538-4357/ab53da
- Ginzburg & Chiang (2019) Ginzburg, S., & Chiang, E. 2019, MNRAS, 490, 4334, doi: 10.1093/mnras/stz2901
- Hubickyj et al. (2005) Hubickyj, O., Bodenheimer, P., & Lissauer, J. J. 2005, Icarus, 179, 415, doi: 10.1016/j.icarus.2005.06.021
- Isella et al. (2014) Isella, A., Chandler, C. J., Carpenter, J. M., Pérez, L. M., & Ricci, L. 2014, ApJ, 788, 129, doi: 10.1088/0004-637X/788/2/129
- Klahr & Kley (2006) Klahr, H., & Kley, W. 2006, A&A, 445, 747, doi: 10.1051/0004-6361:20053238
- Krapp et al. (2022) Krapp, L., Kratter, K. M., & Youdin, A. N. 2022, ApJ, 928, 156, doi: 10.3847/1538-4357/ac5899
- Krumholz et al. (2007) Krumholz, M. R., Klein, R. I., McKee, C. F., & Bolstad, J. 2007, ApJ, 667, 626, doi: 10.1086/520791
- Kurokawa & Tanigawa (2018) Kurokawa, H., & Tanigawa, T. 2018, MNRAS, 479, 635, doi: 10.1093/mnras/sty1498
- Lambrechts & Lega (2017) Lambrechts, M., & Lega, E. 2017, A&A, 606, A146, doi: 10.1051/0004-6361/201731014
- Lambrechts et al. (2019) Lambrechts, M., Lega, E., Nelson, R. P., Crida, A., & Morbidelli, A. 2019, A&A, 630, A82, doi: 10.1051/0004-6361/201834413
- Lee & Chiang (2015) Lee, E. J., & Chiang, E. 2015, ApJ, 811, 41, doi: 10.1088/0004-637X/811/1/41
- Levermore & Pomraning (1981) Levermore, C. D., & Pomraning, G. C. 1981, ApJ, 248, 321, doi: 10.1086/159157
- Lin & Papaloizou (1993) Lin, D. N. C., & Papaloizou, J. C. B. 1993, in Protostars and Planets III, ed. E. H. Levy & J. I. Lunine, 749
- Lissauer et al. (2009) Lissauer, J. J., Hubickyj, O., D’Angelo, G., & Bodenheimer, P. 2009, Icarus, 199, 338, doi: 10.1016/j.icarus.2008.10.004
- Lissauer et al. (2011) Lissauer, J. J., Fabrycky, D. C., Ford, E. B., et al. 2011, Nature, 470, 53, doi: 10.1038/nature09760
- Lubow et al. (1999) Lubow, S. H., Seibert, M., & Artymowicz, P. 1999, ApJ, 526, 1001, doi: 10.1086/308045
- Marleau et al. (2023) Marleau, G.-D., Kuiper, R., Béthune, W., & Mordasini, C. 2023, ApJ, 952, 89, doi: 10.3847/1538-4357/accf12
- Marley et al. (2007) Marley, M. S., Fortney, J. J., Hubickyj, O., Bodenheimer, P., & Lissauer, J. J. 2007, ApJ, 655, 541, doi: 10.1086/509759
- Martin & Lubow (2011) Martin, R. G., & Lubow, S. H. 2011, MNRAS, 413, 1447, doi: 10.1111/j.1365-2966.2011.18228.x
- Mordasini et al. (2012) Mordasini, C., Alibert, Y., Klahr, H., & Henning, T. 2012, A&A, 547, A111, doi: 10.1051/0004-6361/201118457
- Mosqueira & Estrada (2003) Mosqueira, I., & Estrada, P. R. 2003, Icarus, 163, 198, doi: 10.1016/S0019-1035(03)00076-9
- Nakamoto & Nakagawa (1994) Nakamoto, T., & Nakagawa, Y. 1994, ApJ, 421, 640, doi: 10.1086/173678
- Ormel et al. (2015) Ormel, C. W., Shi, J.-M., & Kuiper, R. 2015, MNRAS, 447, 3512, doi: 10.1093/mnras/stu2704
- Piso & Youdin (2014) Piso, A.-M. A., & Youdin, A. N. 2014, ApJ, 786, 21, doi: 10.1088/0004-637X/786/1/21
- Pollack et al. (1996) Pollack, J. B., Hubickyj, O., Bodenheimer, P., et al. 1996, Icarus, 124, 62, doi: 10.1006/icar.1996.0190
- Quillen & Trilling (1998) Quillen, A. C., & Trilling, D. E. 1998, The Astrophysical Journal, 508, 707, doi: 10.1086/306421
- Rafikov (2006) Rafikov, R. R. 2006, ApJ, 648, 666, doi: 10.1086/505695
- Rees et al. (1982) Rees, M. J., Begelman, M. C., Blandford, R. D., & Phinney, E. S. 1982, Nature, 295, 17, doi: 10.1038/295017a0
- Spiegel & Burrows (2012) Spiegel, D. S., & Burrows, A. 2012, ApJ, 745, 174, doi: 10.1088/0004-637X/745/2/174
- Stone & Norman (1992) Stone, J., & Norman, M. 1992, ApJS, 80, 753, doi: 10.1086/191680
- Szulágyi (2017) Szulágyi, J. 2017, ApJ, 842, 103, doi: 10.3847/1538-4357/aa7515
- Szulágyi et al. (2016) Szulágyi, J., Masset, F., Lega, E., et al. 2016, MNRAS, 460, 2853, doi: 10.1093/mnras/stw1160
- Szulágyi et al. (2014) Szulágyi, J., Morbidelli, A., Crida, A., & Masset, F. 2014, ApJ, 782, 65, doi: 10.1088/0004-637X/782/2/65
- Szulágyi et al. (2019) Szulágyi, J., Dullemond, C. P., Pohl, A., & Quanz, S. P. 2019, Monthly Notices of the Royal Astronomical Society, 487, 1248, doi: 10.1093/mnras/stz1326
- Szulágyi et al. (2016) Szulágyi, J., Masset, F., Lega, E., et al. 2016, Monthly Notices of the Royal Astronomical Society, 460, 2853, doi: 10.1093/mnras/stw1160
- Tanigawa et al. (2012) Tanigawa, T., Ohtsuki, K., & Machida, M. N. 2012, ApJ, 747, 47, doi: 10.1088/0004-637X/747/1/47
- Ward & Canup (2010) Ward, W. R., & Canup, R. M. 2010, AJ, 140, 1168, doi: 10.1088/0004-6256/140/5/1168
- Zhu et al. (2021) Zhu, Z., Jiang, Y.-F., Baehr, H., et al. 2021, MNRAS, 508, 453, doi: 10.1093/mnras/stab2517