Upper Limits of 44Ti Decay Emission in Four Nearby Thermonuclear Supernova Remnants
Abstract
To identify progenitors and investigate evidence of He burning, we searched for decay radiation of freshly synthesized 44Ti in four young nearby thermonuclear supernova remnants: Kepler, SN 1885, G1.9+0.3 and SN 1006, by analysing the up-to-date NuSTAR archival data. No apparent flux excess from the 68 and 78 keV line emissions accompanying decay was detected above the power law continuum applied for the remnants and the absorbed stray light. By comparing the inferred upper limits of the line flux and the initial 44Ti masses with a wide variety of supernova nucleosynthesis models, we placed constraints on the supernova progenitors. We derived the first NuSTAR line flux upper limit for Kepler and ruled out most of the double-detonation scenarios with a thick He layer under low density. We estimated, for the first time, the upper limit for SN 1885, which is high because of the large distance yet still remains consistent with the He shell detonation. The new flux and mass limit of G1.9+0.3 derived from a longer total exposure is lower than the results from previous studies and evidently excludes explosive burning of He-rich matter. The relatively advanced age and the large spatial extent of SN 1006 have prevented meaningful constraints.
keywords:
ISM: supernova remnants – nuclear reactions, nucleosynthesis, abundances – X-rays: general1 Introduction
A thermonuclear supernova (SN) is the drastic explosion of a white dwarf (WD) powered by the runaway fusion of carbon and oxygen. Thermonuclear SNe were always considered the synonym of Type Ia SNe until recent advances in SN survey revealed several subclasses with distinct photometric and spectral properties (see Jha et al. 2019 for a review). It is also generally accepted that no single progenitor system or explosion mechanism could account for the whole thermonuclear SN family. Many models have been proposed to explain the distinct observational characteristics of each subtype.
The existing thermonuclear SN models can be classified based on their distinctions in specific details of the explosion. In the binary progenitor scenario, the models can be divided into the single degenerate channel, where the companion of the exploding WD is a main sequence star or an evolved star (Nomoto, 1982; Whelan & Iben, 1973), and the double degenerate channel, where the companion is another WD (Iben & Tutukov, 1984; Webbink, 1984). Regarding the propagation of the combustion fronts, thermonuclear SN models can be characterised by detonation with supersonic shock waves (Arnett, 1969), pure deflagration with subsonic flame fronts (Nomoto et al., 1984; Fink et al., 2014), or their combinations, e.g., delayed detonation (Khokhlov, 1991; Seitenzahl et al., 2013) and gravitationally confined detonation (Plewa et al., 2004; Seitenzahl et al., 2016). Another fundamental factor for the outcome of a thermonuclear SN is the mass of the primary exploding WD, and it also changes how the fusion runaway is set off. Near the centre of a WD close to the Chandrasekhar mass limit (near-), the extreme density and temperature spontaneously lead to a runaway carbon fusion (Nomoto et al., 1984). Alternatively, a WD below the Chandrasekhar limit (sub-) can be detonated by the detonation in the accreted He shell (double-detonation, Livne, 1990; Woosley & Weaver, 1994; Shen & Bildsten, 2014) or by the violent interactions during the merger process of the double degenerate scenario (violent merger, Pakmor et al., 2010, 2012, 2013). Other newly proposed methods for ignition include WD-WD head-on collisions (Kushnir et al., 2013; Papish & Perets, 2016) and 235U fission chain reactions (Horowitz & Caplan, 2021).
Some unconventional models have also been put forward for some unusual thermonuclear SNe. For example, the He shell detonation model has been proposed for Ca-rich transients, where the He shell detonation does not lead to a secondary detonation in the CO WD core (Perets et al., 2010; Waldman et al., 2011). Weng et al. (2022) suggested the supernova remnant (SNR) G306.3-0.9 is likely the first found Galactic Ca-rich transient remnant based on its metal abundances. Another interesting model is the core-degenerate merger, which is also suggested as the progenitor of the Kepler SNR and SN PTF 11kx (Tsebrenko & Soker, 2013; Soker et al., 2013). In this scenario, a hot massive core of an asymptotic giant branch (AGB) star merges with its WD companion, leading to an or super- mass WD explosion (Kashi & Soker, 2011).
Traditionally, the element abundances revealed by thermal X-ray spectra are used to distinguish between the characteristic nucleosynthesis of the models above. However, accurate diagnostics of various plasma parameters, such as temperature and ionisation state, are crucial for interpreting the emission lines excited by electron collisions (e.g. Mewe, 1999). Potential large errors might arise from modelling the continuous distributions of post-shock gas properties with oversimplified discrete shock models (e.g. Zhekov et al., 2006, 2009; Alp et al., 2021) or atomic code uncertainties (Mernier et al., 2020).
In contrast, the decay radiation of the radioactive element 44Ti provides straightforward insights into its abundance and the corresponding nucleosynthesis processes. Upon de-excitation, the nucleus of 44Sc (daughter of 44Ti) emits hard X-ray line emissions at 68, 78 and 146 keV (Chen et al., 2011), independent of the plasma conditions. Furthermore, both the ejecta and the circumstellar medium of SNRs are optically thin to these photons.
44Ti is mainly produced in SNe by two channels: (i) alpha-rich freeze-out, occurring when nuclear statistical equilibrium (NSE) reactions develop in a low-density regime (Woosley et al., 1973); (ii) explosive He burning (Timmes et al., 1996). Because few burning regions in thermonuclear SN reach the conditions of alpha-rich freeze-out, thermonuclear SNe typically produce only of 44Ti. However, in models involving a He shell, e.g. double-detonation, the He detonation can produce a yield of . A thick He shell detonation or a low-mass hybrid WD merger can reach a 44Ti yield up to (for recent brief discussions, see Lach et al., 2020; Weinberger et al., 2020; Kosakowski et al., 2023).
Because of the relatively long half-life of 59 yr, 44Ti decay radiation can power the late-time light curves and be detected in young SNRs (Kosakowski et al., 2023). However, 44Ti decay emission from SNRs has only been robustly detected in two core-collapse SNRs, Cas A and SN 1987A, both revealing large amounts of 44Ti (, Grefenstette et al., 2014; Boggs et al., 2015). Such rarity is increasingly puzzling in deeper surveys, as seen in the INTEGRAL survey (The et al., 2006; Dufour & Kaspi, 2013; Tsygankov et al., 2016; Weinberger et al., 2020). No detection in thermonuclear SNRs has been confirmed yet (but see a probable Swift/BAT detection in Tycho SNR by Troja et al., 2014, which disfavoured a pure deflagration origin). Nevertheless, the solar 44Ca abundance requires a moderate fraction of thermonuclear SNe to produce substantial 44Ti ejecta during the burning of He-rich material (Woosley & Weaver, 1994; Timmes et al., 1996; Weinberger et al., 2020), which may also account for the origin of the Galactic 511 keV emission (Perets, 2014; Zenati et al., 2023). Moreover, the inferred upper mass limits of 44Ti in SNRs can place constraints on their progenitors.
To search for possible 44Ti signatures in thermonuclear SNRs, update previous results, and provide indications on their origins, we analysed up-to-date NuSTAR archival data of four nearby targets: Kepler, SN 1885, G1.9+0.3 and SN 1006. We give brief overviews of the targets in Section 2. The data, its reproduction and the background treatments in this study are described in Section 3. We present the results and the constraints on their progenitors in Section 4 and 5, respectively. The paper concludes with final remarks in Section 6.
2 Targets
We selected targets which are positively identified as the thermonuclear type with an estimated age of yr from a Galactic SNR catalogue(Ferrand & Safi-Harb, 2012). The catalogues of the Large Magellanic Cloud (Maggi et al., 2016; Bozzetto et al., 2017) and the Small Magellanic Cloud (Maggi et al., 2019) were also checked but the matching targets were not covered by NuSTAR observations. We also included SN 1885 in M31 for its peculiarity.
2.1 Kepler
Occurring in 1604, Kepler is the latest historical SN. Based on the recorded light curve and the dominant Fe line emission, it is one of the most certain thermonuclear SNRs (Reynolds et al., 2007; Katsuda et al., 2015). Oddly, the SNR is interacting with the N-rich circumstellar medium (van den Bergh & Kamper, 1977; Blair et al., 1991), which suggests an AGB star wind mass-loss history and thus the single degenerate origin (Karakas, 2010; Chiotellis et al., 2012; Sun & Chen, 2019). However, the search for the surviving donor has failed (Kerzendorf et al., 2014). A possible solution is the core-degenerate scenario, where the AGB star core has merged with the WD companion near the end of the binary evolution (Tsebrenko & Soker, 2013). The overabundance of iron-group elements (IGEs) favours the overluminous 91T-like subtype, while the fast brightness decline in Korean and European observation records is more consistent with the 91bg-like SNe (Patnaude et al., 2012; Katsuda et al., 2015; Vink, 2017).
No gamma rays from 44Ti decay have been confirmed in Kepler. A upper flux limit of was determined for the 1157 keV 44Sc decay line from COMPTEL observations (Dupraz et al., 1997). INTEGRAL/IBIS reported a upper limit of for the 68 and 78 keV lines (Tsygankov et al., 2016), while INTEGRAL/SPI obtained a limit of for 68/78/1157 keV line combined fits (Weinberger et al., 2020). Kepler is one of the calibration sources of NuSTAR and has been monitored for over 1 Ms in 8 years, but results of a 44Ti search utilizing these data had been absent.
2.2 SN 1885
SN 1885, exploding in the M31 galaxy, is one of the most recent nearby thermonuclear supernovae. Based on visual estimations in the 19th century, it exhibits many peculiar behaviours: an extremely short rise time, a fast brightness decline, a red colour throughout the evolution, etc (de Vaucouleurs & Corwin, 1985).
Its remnant was identified as a foreground absorption spot just 16 arcsecs away from the M31 centre. The detected Fe i and Fe ii resonance lines revealed a Fe mass of 0.1 – 1.0 , which is consistent with subluminous or normal Type Ia SNe and confirms the thermonuclear origin (Fesen et al., 1989, 1999; Hamilton & Fesen, 2000). The HST image and spectrum analyses revealed the asymmetric Ca i and Fe i absorption, the outer Mg and Ca shell and the extended Fe plumes. These structures might be hints of an off-centre delayed detonation near- explosion (Fesen et al., 2007, 2015, 2017).
2.3 G1.9+0.3
G1.9+0.3 is the youngest known SNR in the Galaxy so far (Reynolds et al., 2008). The lack of a pulsar wind nebula or a jet-like structure, high ejecta velocities and the bilateral synchrotron X-ray rim suggest a thermonuclear origin (Reynolds et al., 2008; Borkowski et al., 2013b). Borkowski et al. (2010) reported the detection of 44Sc K lines ( keV) after electron capture, translating to a 68 keV line flux of with a wide line width of 4.0 keV and a 44Ti mass of (Borkowski et al., 2013a; Zoglauer et al., 2015). INTEGRAL/IBIS obtained a 3 line flux upper limit of , while NuSTAR and INTEGRAL/SPI got 2 upper limits of – and , respectively (Tsygankov et al., 2016; Zoglauer et al., 2015; Weinberger et al., 2020).
2.4 SN 1006
The high Galactic latitude () and the elemental abundances revealed by X-ray observations make SN 1006 a very likely Type Ia event (Yamaguchi et al., 2008; Uchida et al., 2013). The failed searches for a surviving donor star disfavoured the single degenerate origin (González Hernández et al., 2012; Kerzendorf et al., 2012), while the discovery of a H i cavity might suggest otherwise (Sano et al., 2022). Furthermore, the non-detection of a surviving WD indicates a merger if in the double degenerate scenario (Kerzendorf et al., 2018; Shields et al., 2022).
3 Data and Methods
3.1 X-ray Data and Calibration
The NuSTAR observations utilised are listed in Table 1. The NuSTAR Data Analysis Software (NUSTARDAS, v2.1.1) and associated calibration database (CALDB, v20220510)111https://heasarc.gsfc.nasa.gov/docs/nustar/analysis/ files were used to reproduce data and extract spectra. We performed the spectral analysis with Xspec (v12.12.0)222https://heasarc.gsfc.nasa.gov/docs/xanadu/xspec/ and other tools in HEASoft (v6.29)333https://heasarc.gsfc.nasa.gov/docs/software/lheasoft/.
| Target | ObsID | Exposure a | PI | Distance | Age | Galactic Coordinates |
| ks | kpc | yr | l/b() | |||
| Kepler | 40001020002, 90201021002, 90201021004, 90201021006, 90201021008, 90201021010, 10501005002, 10601005002, 10701407002, 10701407004, 10801407002, 10901407002 | 887 | F. Harrison | 5.1b | 414 | 4.52/+6.82 |
|---|---|---|---|---|---|---|
| SN 1885 | 50101001002, 50201001002, 50302001002, 50302001004, 50302001006 | 279 | M. Yukita | 731c | 132 | 121.17/-21.57 |
| G1.9+0.3 | 40001015002, 40001015003, 40001015005, 40001015007, 40702003002, 40702003004, 40702003006, 40702003008, 40702003010 | 811 | F. Harrison, A. Zoglauer | 8.5d | 117e | 1.87/+0.33 |
| SN 1006 | 40110001002, 40110002002 | 381 | J. Li | 2f | 1010 | 237.57/+14.57 |
| a The NuSTAR/FPMA exposure after livetime corrections, data screening and removal of periods affected by solar activities | ||||||
| b Sankrit et al. (2016); c Wagner-Kaiser et al. (2015); d Luken et al. (2020); Reynolds et al. (2008); e Carlton et al. (2011); f Nikolić et al. (2013); Ghavamian et al. (2002) | ||||||
The data were reprocessed by the standard data analysis pipeline nupipeline to generate cleaned, calibrated event list files. Strict criteria were applied to identify South Atlantic Anomaly and the “tentacle” passages. The periods affected by solar activities were removed by screening the light curve bins with abruptly increased count rates. The utilised total exposure time for each target is listed in Table 1.
3.2 Spectra Extraction
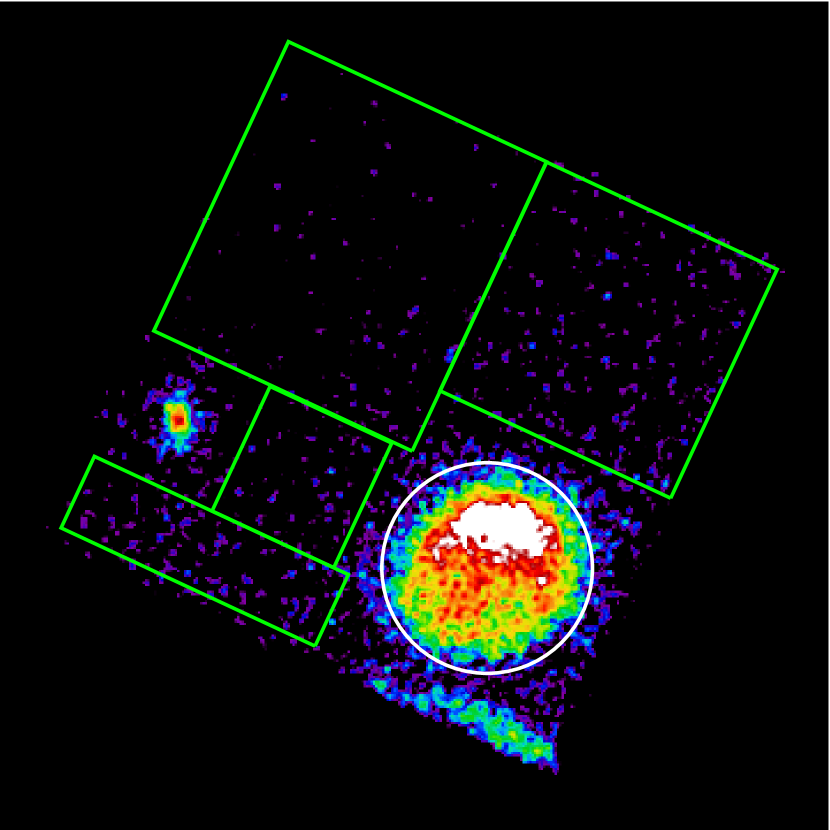
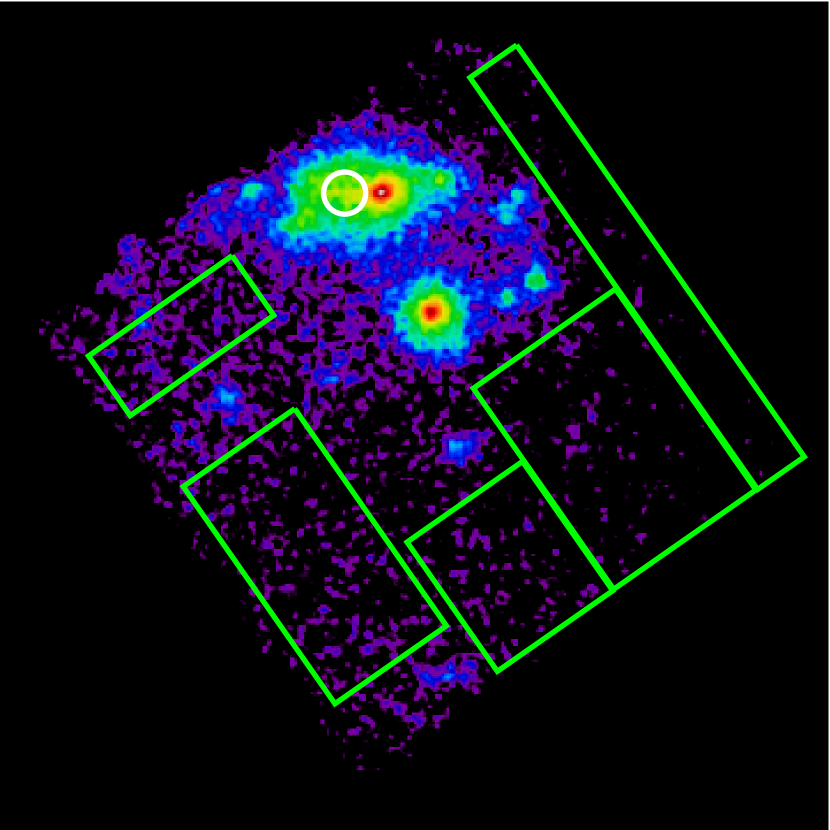
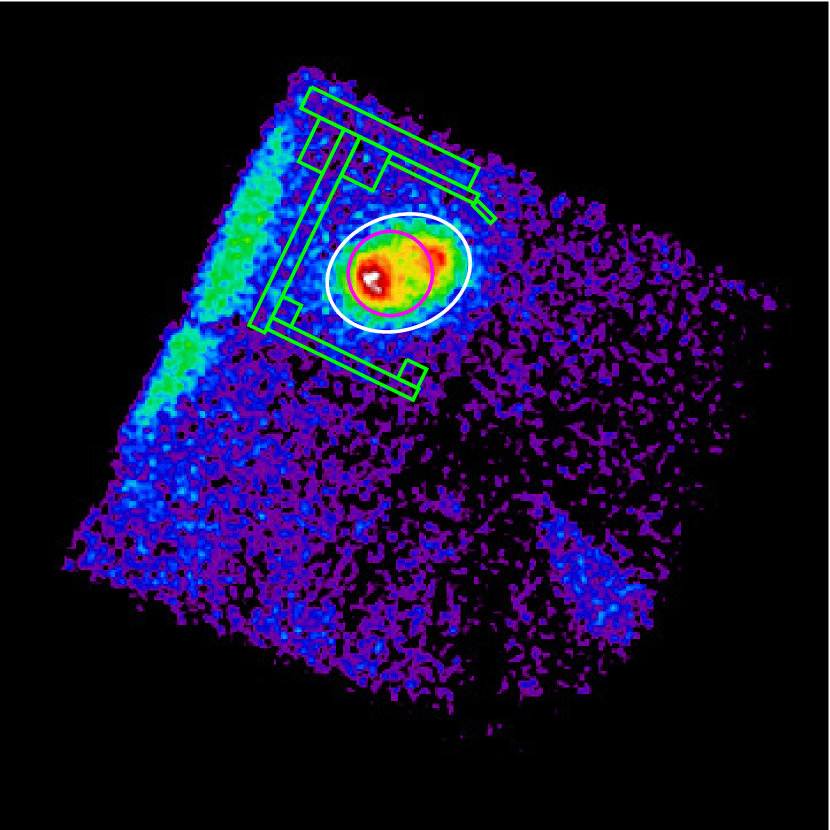
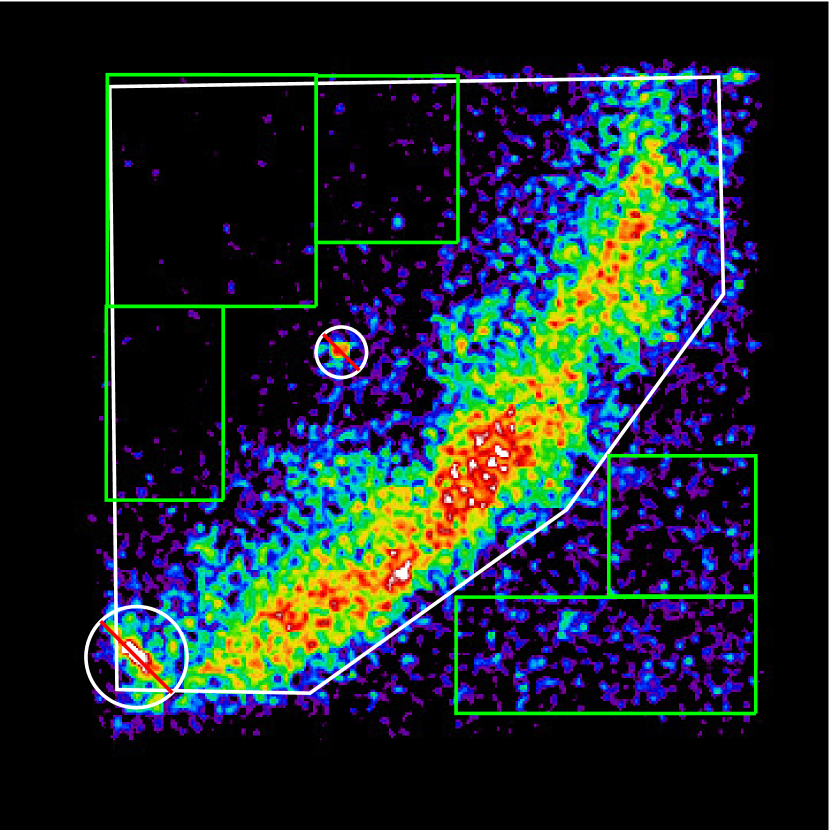
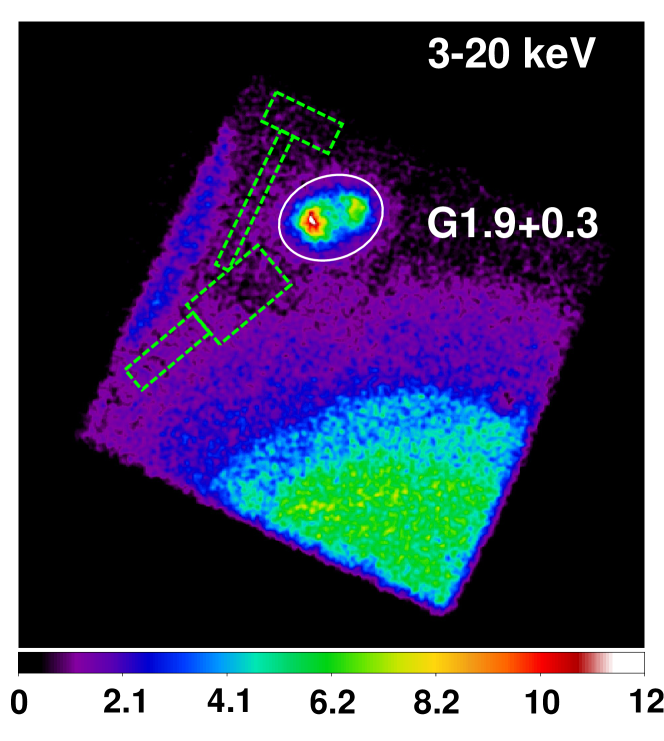
The spectra were extracted from the reprocessed event files using the standard dedicated module, nuproducts. All targets were treated as extended sources, except SN 1885, which is considered a point source. In the case of extended sources, the auxiliary response files were weighted according to the event counts across the extended regions, thereby reflecting the spatial distribution of the response. The source regions were defined as slightly larger than the entire SNRs to account for the Point Spread Function wing, which is not included in the extended source response. We also avoided the regions illuminated by the stray light (SL), photons that reach the focal plane directly from nearby bright sources without passing through any optics for reflection. The affected regions were determined visually and from the estimated SL map in the NuSTAR Stray Light Source Catalog (StrayCats, Grefenstette et al., 2021). Figure 1 displays the extraction regions of some observations as an example. More details can be found in Appendix A.1.
The source spectra were binned with the optimal binning scheme based on the response matrices (Kaastra & Bleeker, 2016). We also checked that the bins in the generated background spectra (see Section 3.3) contained at least 3 photons to reduce the systematic errors that occurred when the W-statistic (labelled as C-stat in Xspec, Cash, 1979) is used for the spectral fitting of weak sources 444https://giacomov.github.io/Bias-in-profile-poisson-likelihood/.
3.3 Background Subtraction
For all SNRs except G1.9+0.3, we modelled the NuSTAR background with the software package nuskybgd (Wik et al., 2014). The background spectra are described by the components as follows: (1) the “Internal" background consists of a featureless continuum and a series of activation and fluorescent lines; (2) the “Aperture" SL component is the cosmic X-ray background (CXB) which is not blocked by the aperture stops and irradiates directly the detectors; (3) the “Solar" background comes from scattered and reflected emission from the Sun and the Earth’s albedo; (4) and the “fCXB” component is the CXB focused by the optics. The nuskybgd software first extracted spectra from the defined background regions with visible point sources excluded (see Figure 1 for an example). Then the software performed joint fits to the spectra which include the spatial gradients of the background components. At last, nuskybgd produced faked spectra for the source region based on the best-fit background model, which would be subtracted in later analysis.
In addition to SL, many of the observations utilised were impacted by a rare occurrence known as absorbed stray light (ASL). While photons from nearby bright sources can pass through the open gap between the aperture stops and the optical bench at small angles and become SL, photons from sources at larger angles should be blocked by the stops. Nevertheless, high-energy photons may still penetrate the blockers and reach the detector, possibly because of the absence of the Sn layer. These photons are partially absorbed and appeared as ASL, spreading over an extended area of the detector (see Madsen et al., 2017a, fig. 15). We included an extra heavily attenuated power law component to address background regions affected by ASL. Detailed descriptions of the background treatments for each target and the intervening ASL are provided in Appendix A.2.
4 Results
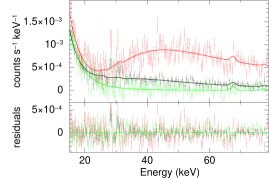
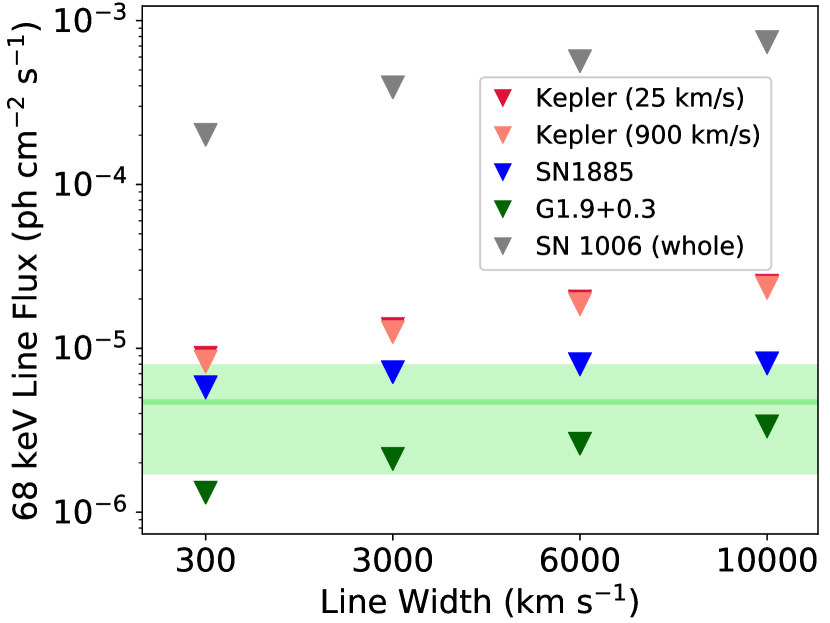
The FPMA and FPMB spectra were jointly fitted with a power law model plus two velocity-shifted Gaussian lines (powerlaw+vashift*(gauss+gauss)), which describe the underlying source continuum and the 44Ti decay lines, respectively. The centroids of the Gaussian lines were fixed at 67.87 and 78.32 keV, and the fluxes were tied with the absolute intensities (branching ratios) of 93.0%/96.4% (Chen et al., 2011). The velocity shifts of the lines were determined by the locations of the SNRs in Table 1 and the Galactic rotation curve (Wenger et al., 2018; Reid et al., 2014). Considering the small numbers of counts in the hard end of the source spectra, all fittings were based on C-statistic. We used the Anderson-Darling statistic and the goodness command for goodness-of-fit testing of the underlying continuum, and our corresponding models proved to be all sufficient. The scarcity of high-energy photons also meant that the dominating background Poisson fluctuations would greatly affect the line flux measurements, and hence we adopted a similar approach to Grefenstette et al. (2014). We generated 1,000 faked background realizations for each spectrum and repeated the fitting to obtain a distribution of best-fit results. The mean values of the 68 keV line flux and its error were taken as the best estimates. The confidence interval was calculated by the delta statistics technique in Xspec and given at level. Further adjustments to the fitting process for each SNR are described below. The spectra and the fitting models are shown in Appendix C. In all four SNRs, we did not detect well-defined 44Ti lines, and only flux upper limits were obtained.
4.1 Kepler
For observations affected by the continnum excess from ASL, a highly absorbed power law (phabs*powerlaw) was added, for which the response for SL was assigned, as in Appendix A.2. The photon indices were tied by assuming a consistent ASL spectral shape and same sources intervening the extraction regions due to comparable pointings and position angles, while those of obs. 90201021002 and 90201021004 were tied separately because the ASL was dominated by a nearby outburst event (see Appendix B). The potential errors arising from spectral variability of the ASL sources are addressed in Section 4.4. A cross-normalization constant was added to account for the instrument-dependent flux discrepancy. The spectral fits were performed over the 15 – 79 keV regime. Apart from the local standard of rest (LSR) velocity of 25 km/s at a distance of 5.1 kpc (Sankrit et al., 2016), we also used the average ejecta Doppler shift of 900 km/s measured by XMM-Newton/RGS as the bulk velocity of 44Ti (Kasuga et al., 2021) and got a smaller flux limit.
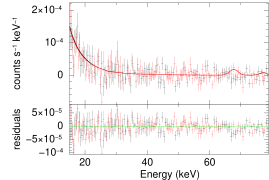
The line flux upper limit with a Doppler shift of 900 km/s and a width of km/s is (see Figure 2). Despite the long exposure, we obtained a consistent but higher line flux limit than that from previous INTEGRAL observations, which is likely due to the ASL.
4.2 G1.9+0.3
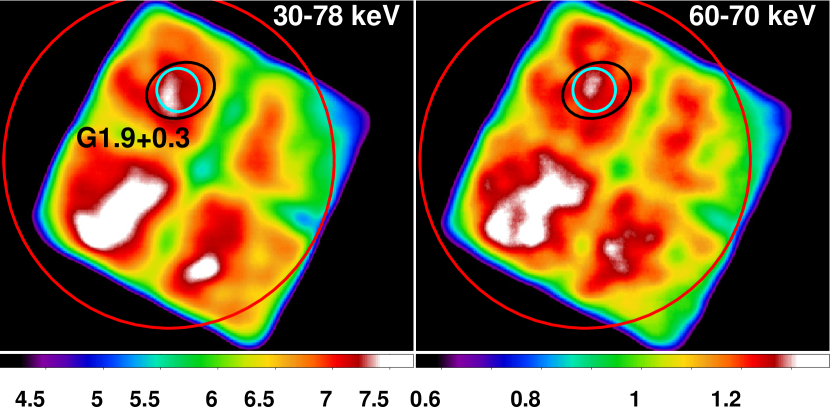
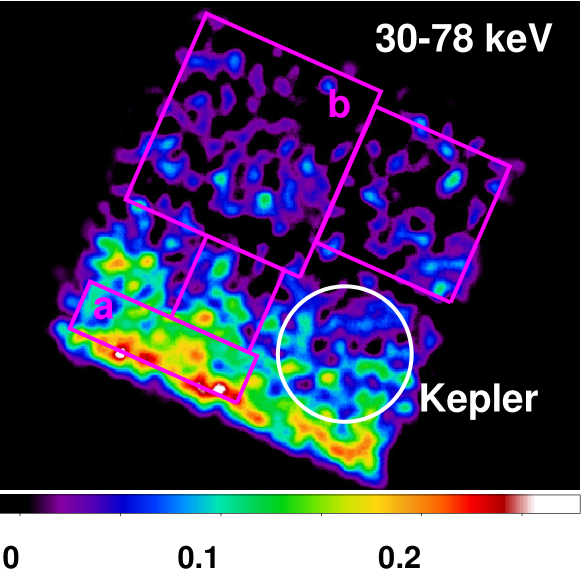
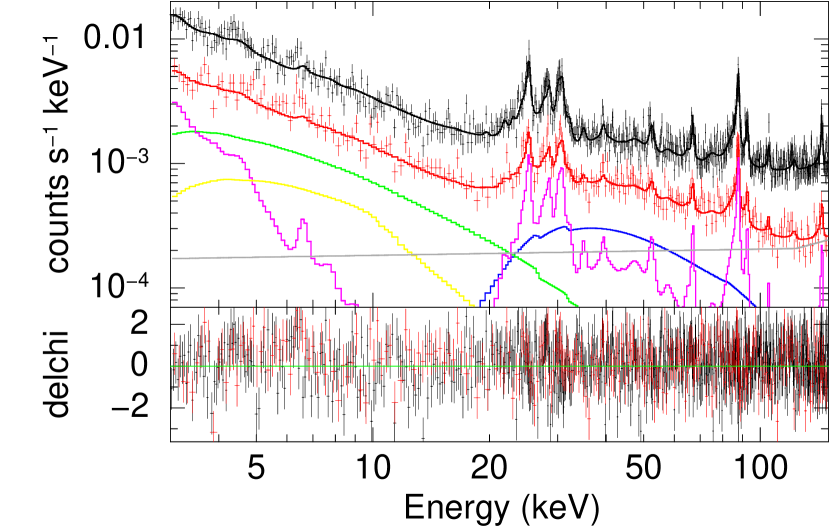
We found faint extended emissions above 30 keV in both the spectra and the combined images with a pattern similar to the predicted ASL (see Figure 3 and Madsen et al., 2017a). It can be also seen that this excess is stronger inside the SNR and thus cannot be subtracted using background spectra from nearby regions (see high-energy spectrum residuals in Figure 3). Therefore, postulating an ASL origin, we adopted the same fitting procedures as in Section 4.1. To bring out the faint emission, we combined the FPMA and FPMB spectra obtained from the observations conducted in July 2013 and August to October 2021, respectively (resulting in a total of four spectra after combination). We allowed the photon indices to vary, taking into account potential ASL variability. The SL response was used for the ASL component and it produced a more physical photon index ( and for the years 2013 and 2021, respectively, with 1 errors) compared with the standard response (), although the goodness-of-fit tests returned equally good results. It is noted that the photon indices presented here have limited constraints and exhibit large errors due to the scarcity of counts.
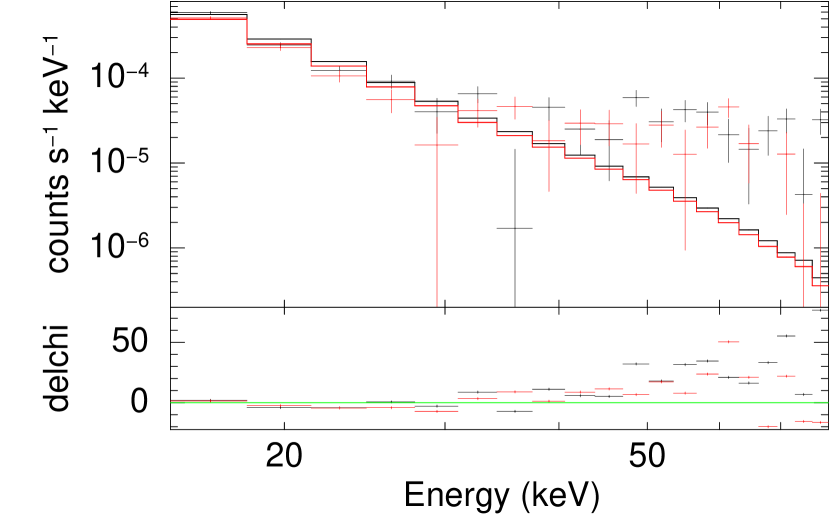
The confirmation of the ASL origin requires the identification of the SL source and its predicted ASL pattern from ray-trace simulations. The ASL shape depicted by the red circle in Figure 3 was determined simply by eye. The focus of our analysis is to claim the necessity of a new underlying continuum, rather than the accurate fits of the ASL.
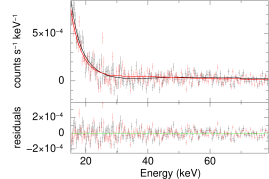
The line flux upper limit with a width of km/s is , which is lower than previous works (Tsygankov et al., 2016; Weinberger et al., 2020) due to the long exposure.
In the heavily smoothed combined image of 60 – 70 keV, a seeming excess can be observed inside the SNR (Figure 3). We extracted spectra from an enclosing circle but still found no apparent 44Ti lines and only derived flux upper limits. Although the 44Sc line has also been found to be more prominent in the interior of the SNR (Borkowski et al., 2010, 2013a), some excess can be seen at a similar location in the 30 – 78 keV image. Hence this residual likely originates from the ASL rather than 44Ti decay.
4.3 SN 1885 & SN 1006
Regarding SN 1885, the velocity shift of the line centroid was set as the radial velocity of M31 ( km/s, McConnachie, 2012). The spectra were fitted over 15-79 keV. The line flux upper limit with a width of km/s is (see Figure 2).
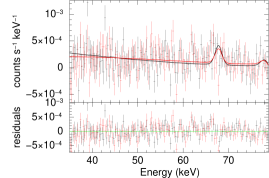
For SN 1006, due to the strong instrument lines around 20 – 30 keV, the spectra were fitted over 35 – 79 keV. The two NuSTAR observations only covered the northeast (NE) and southwest (SW) parts of the SNR, covering of the total area. The line flux upper limits with a width of km/s for the NE and SW part are and , respectively. Assuming uniform 44Ti distribution, the extrapolated upper limit for the whole SNR is (see Figure 2).
4.4 Systematic Errors
The shape of the underlying continuum might significantly impact the determination of the line flux, particularly when the spectral shape is not well defined because of low counts, as is the case here. Generally, if the photon index of the ASL power law model is fixed or smaller, it will result in a lower upper limit for the line flux. This effect would be more pronounced for a broader line. To assess these errors, we set the ASL photon indices to those obtained during the background analysis of Kepler and G1.9+0.3 (see Appendix A.2). Regarding Kepler, the ASL photon index in each spectrum was fixed to the background value corresponding to the observation. This approach can also help address the potential temporal variability of the ASL, assuming the detector is solely illuminated by a single ASL source. We obtained a line flux upper limit of (a decrease). For G1.9+0.3, the ASL indices were fixed at 2.30 and 2.73 for the years 2013 and 2021, respectively, resulting in an upper limit of (a decrease). Apart from the possibility that multiple ASL sources illuminated different areas on the detector, it is noted that the ASL photon indices inferred from the background are also influenced by many factors (see Appendix A.2). Therefore, they may not necessarily provide a more accurate fit, but should be seen as a test case for errors.
Due to the absorption edge at 78.4 keV of Pt layers on the mirror modules, the response is poor near the 78 keV decay line and thus might affect the flux measurements. In some test fits, we found that removal of the 78 keV Gaussian line or the photons above 78 keV would usually lead to a difference in the acquired flux upper limits. Because the mirror response was excluded in the ASL continuum model for Kepler and G1.9+0.3, a decrease in the flux limits was obtained compared with the standard response.
The velocity shift would also affect the flux measurement, mostly due to the strong instrument line at 67.06 keV. As an extreme test, shifting the line centroid by 1,000 km/s would lead to a flux deviation for narrow line widths ( or km/s) and for broad line widths ( or km/s).
The background spectra of G1.9+0.3 were simply scaled but not simulated repeatedly from nearby regions, and errors due to Poisson fluctuations could be large. Using the faked background spectra of Kepler, SN 1885 and SN 1006, we obtained relative standard deviations of 15 – 30% from the distributions of the line flux limits. The wide variance proved that it was necessary to consider the background Poisson during the spectral analysis. It is likely that the presented limits of G1.9+0.3 also hold similar errors.
The upper limits were calculated by the delta fit statistics. However, this method is only correct for the Gaussian data and is just asymptotically correct for the W-stat used in this analysis. We ran several Markov chain Monte Carlo (MCMC) test chains with steps of (the ASL spectral shape was fixed to reduce the auto-correlation time in some of the chains) and found generally differences compared with the delta statistic technique.
To conclude, we estimated systematic errors of – for Kepler, SN 1885 and SN 1006, while a larger error of is expected for G1.9+0.3 because of the background noise and the uncertain ASL shape. We note that we did not discuss every factor (e.g. the coverage of source extraction regions or background regions), and the uncertainty on the distance also greatly affects the translation from line fluxes to 44Ti masses (see Equation 1).
5 Discussion
With the 44Ti half-life (59.1 yr, Chen et al., 2011), the age and the distance to the SNR known, the decay line flux upper limit given in Section 4 can be converted to the 44Ti production upper limit of the initial SN nucleosynthesis by
| (1) |
with the 68 keV line flux, the age, the distance, the half-life, the absolute intensity and the proton mass. The calculations are based on the decay rate and absolute intensity measured in terrestrial laboratories on cold neutral 44Ti nuclide, with the modifications caused by temperature or electron states considered trivial and ignored (Diehl, 2022).
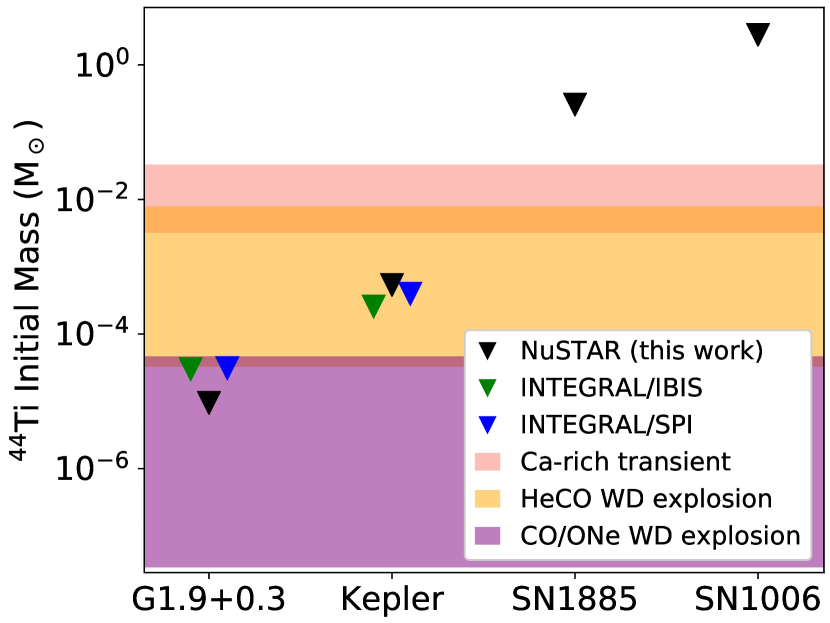
Figure 4 shows the comparisons between the derived 44Ti mass limits and the theoretical SN nucleosynthesis models listed in Table 2. The ages and the distances utilised are listed in Table 1. The ages were calculated by their average NuSTAR observation start dates.
| Model | Subgroup |
| Ca-rich transient | WD thick He shell detonationa HeCO WD-CO WD mergerb |
|---|---|
| HeCO WD explosion | violent mergerc double detonationd |
| CO/ONe WD explosion | near- PD/DDT/GCDe sub- detonation/violent mergerf Iaxg |
| a Waldman et al. (2011); Sim et al. (2012) | |
| b Zenati et al. (2023) | |
| c Pakmor et al. (2021, 2022); Roy et al. (2022) | |
| d The CO core might not be ignited in some models (sometimes artificially suppressed). Kromer et al. (2010); Woosley & Kasen (2011); Moll & Woosley (2013); Townsley et al. (2019); Leung & Nomoto (2020a); Gronow et al. (2020, 2021a, 2021b) | |
| e PD: pure deflagration; DDT: delayed detonation; GCD: gravitationally confined detonation. A few pure deflagration configurations might overlap the Iax models. Iwamoto et al. (1999); Travaglio et al. (2004, 2005); Maeda et al. (2010); Seitenzahl et al. (2013); Fink et al. (2014); Ohlmann et al. (2014); Seitenzahl et al. (2016); Leung & Nomoto (2018); Lach et al. (2022b); Neopane et al. (2022) | |
| f Sim et al. (2010); Pakmor et al. (2010, 2012); Kromer et al. (2013); Marquardt et al. (2015); Kromer et al. (2016) | |
| g Kromer et al. (2015); Leung & Nomoto (2020b); Lach et al. (2022a) | |
5.1 SN Models
The SN models listed in Table 2 are classified according to the quantity of 44Ti production.
In the models consisting of CO or ONe WDs with no He in the initial compositions, the -rich freeze-out of explosive silicon burning typically produces a 44Ti yield of – . We categorised these models as “CO/ONe WD explosion".
If a hybrid WD is involved in the SN explosion, the burning of the He shell provides another channel for substantial 44Ti output. We refer to these models as “HeCO WD explosion", consisting of WD violent merger and WD double detonation. As the fate of WDs in violent mergers can vary greatly (e.g. Pakmor et al., 2022), they have been placed into a separate group but can also trigger double detonations in some cases. During He burning, particles accumulate along the -chain to create new elements. Its nucleosynthesis is mainly affected by the rate of the triple- reaction and subsequent -captures, which, in turn, is determined by factors such as the masses of the WD core/shell and the C enrichment of the shell. It can be seen in Figure 4 that the 44Ti ejecta mass of this group spans a wide range of – . Under certain conditions, 44Ti would become one of the most abundant newly synthesised elements.
The 44Ti production can be further enhanced through -capture onto 40Ca if the SN is able to produce large amounts of Ca, resulting in a “Ca-rich transient" (see references in Table 2). One possible scenario is when the thick He shell () on a low-mass WD () is detonated. The He detonation might still ignite the WD CO core in good symmetry (i.e. double detonation), producing abundance patterns different from Ca-rich transients. However, due to the He shell being the main production site, this kind of model still features comparably large 44Ti yields (Sim et al., 2012). The 44Ti overabundance can also occur in the HeCO WD-CO WD merger (Zenati et al., 2023), where the thinner He shell is well-mixed with the accreted CO debris before detonation. The Ca-rich transient models typically predict – of 44Ti production.
5.2 Kepler
In Figure 4, we can see that all three upper limits exclude the He-rich models with high 44Ti outputs and Ca-rich transient models.
Figure 5 presents a comparison between the 44Ti productions of a set of WD double detonation models (Leung & Nomoto, 2020a) and the observational limits. The lowest limit obtained by INTEGRAL/IBIS (Tsygankov et al., 2016) reject models with thick He shells ().
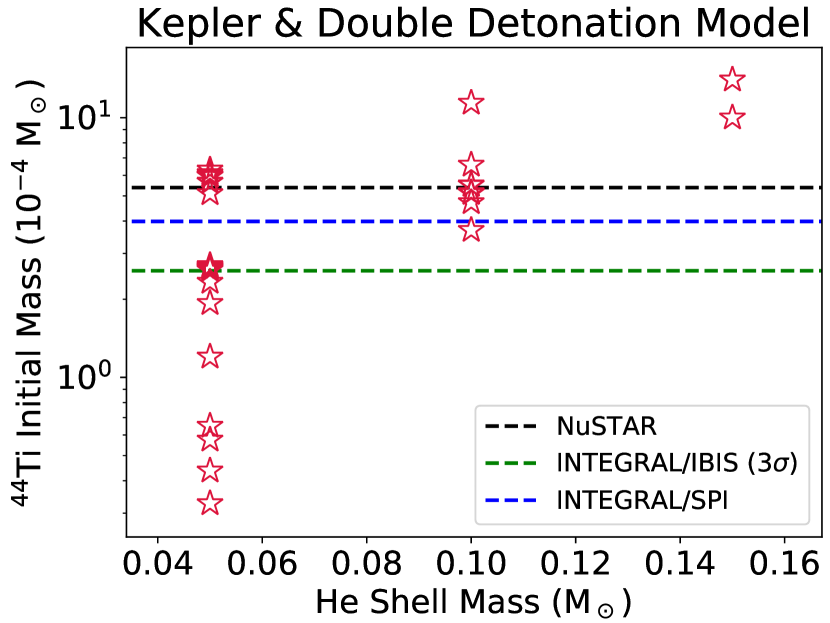
However, the nucleosynthesis of He burning is also sensitive to other factors. Figure 6 shows the 44Ti yields of all remaining double detonation models in Table 2, in different He shell base densities. We excluded extreme models ejecting negligible 56Ni since they cannot reproduce the IGE overabundance and the peak brightness in the historical light curve of Kepler (Patnaude et al., 2012; Katsuda et al., 2015). It is noted that depending on specific configurations, the core-shell interface is not distinct or the runaway does not happen at the shell base in some models (e.g. Woosley & Kasen, 2011; Gronow et al., 2020). Hence, the density depicted here is still an approximate and overgeneralized parameter. For similar densities, an increase in the 44Ti ejecta mass with the shell mass can be seen. Conversely, for a given shell mass, the 44Ti ejecta mass decreases as the density rises. Therefore, the mass upper limit can also agree with the models featuring thicker He shells but under high densities, which can be achieved through accretion onto a massive CO core unless significantly heated by nova-like events or the accretion stream (Woosley & Kasen, 2011; Townsley et al., 2019). Another contributing factor is C enrichment in the He shell. It has been found that substantial C pollution greatly reduces 44Ti production (Kromer et al., 2010; Gronow et al., 2020). However, relevant calculations in thick He shells () are still absent, and it remains unclear whether such a massive shell can survive on the WD surface (Shen & Bildsten, 2009).
5.3 G1.9+0.3
Referring to Figure 4, while the INTEGRAL results still reach the lower end of HeCO WD models, we infer an initial 44Ti mass limit of , which has fully entered the regime of CO WD explosions and confirms a He-poor origin.
This mass limit is also lower than some CO/ONe WD models with high 44Ti yield, which provides some interesting hints to the progenitor. Figure 7 shows the relative frequency of “CO/ONe WD explosion" models listed in Table 2 compared with their 44Ti yields, after excluding the models that cannot disrupt the whole WD (i.e. mass of the bound remnant ). We divided the models into three subgroups: pure deflagration, delayed detonation (including gravitationally confined detonation) and sub- consisting of pure detonation and violent merger.
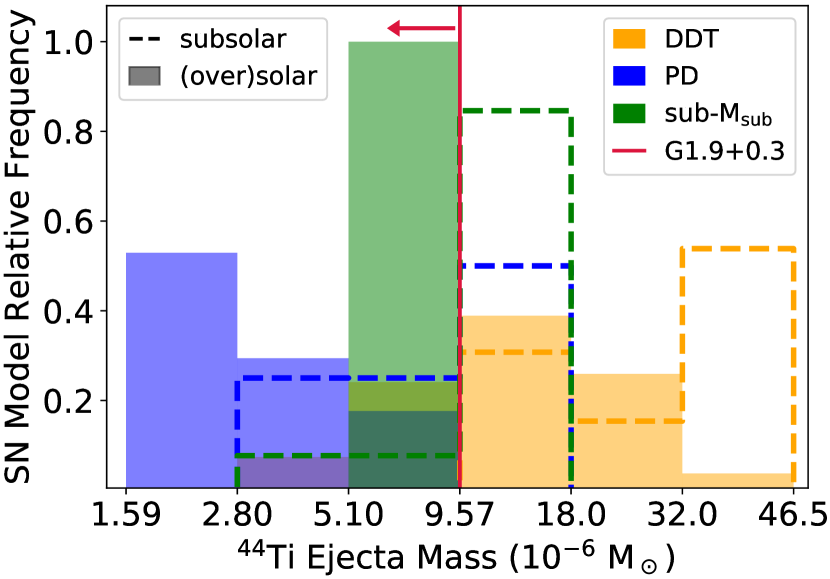
All pure deflagration and sub- models with solar metallicity fall within the upper limit of G1.9+0.3 while all subsolar delayed detonation models produce more 44Ti than the limit. It is reasonable that the neutron excess brought by initial metallicity affects the production of the symmetric element 44Ti. Since a larger amount of 44Ti is expected in the delayed detonation phase (e.g. Iwamoto et al., 1999), it can be also seen that only a few delayed detonation but most pure deflagration models meet the mass limit. Still, an additional systematic error of 33% or the 3 limit for a 10,000 km/s wide line would agree with 4 out of the 13 selected subsolar delayed detonation models for the translated mass. It is noted that the frequency in Figure 7 is largely shaped by the chosen SN configurations (see references in Table 2) and should never be treated quantitatively. For example, although Seitenzahl et al. (2013) and Leung & Nomoto (2018) both found that increasing metallicity would reduce 44Ti production, their different model treatments have led to slightly overlapping output ranges. Figure 7 shows that the 2 limit of G1.9+0.3 favours an (over)solar origin and excludes the delayed detonation models with the highest 44Ti output.
The line flux upper limit obtained for a typical ejecta velocity ( km/s) is consistent with the 90% confidence lower bound translated from the Sc 4.1 keV line observed by Chandra (see Figure 2). However, our upper limit cannot meet the Sc 4.1 keV line best-fit flux unless the line is very wide ( km/s). The Chandra observation displayed a broad line width of km/s although being affected by the nearby Ca line (Zoglauer et al., 2015), and the width lower limit is consistent with the proper motion measurements (Carlton et al., 2011). However, such a velocity is too high for -rich freeze-out products and can be only reached by the outermost SN ejecta (e.g. Iwamoto et al., 1999). Although the fastest 44Ti can attain an extremely rapid velocity (up to km/s) in certain violent mergers or gravitationally confined detonation models (e.g. Pakmor et al., 2012; Lach et al., 2022b), the majority of the 44Ti still has a speed of km/s. Besides, fast-moving 44Ti ejecta seems to contradict the evidence that the Sc line is more prominent in the SNR interior (Borkowski et al., 2013a). Therefore, it is probable that the true flux and width of the 44Ti decay emission in G1.9+0.3 fall within the lower confidence intervals established by Borkowski et al. (2013a), based on our upper limits. Weinberger et al. (2020) also found this minor inconsistency when comparing the Chandra signal with the upper limits they derived from INTEGRAL data. They suggested that stable isotopes like 45Sc might also contribute to this 4.1 keV fluorescent line.
5.4 SN 1885 & SN 1006
Based on the low explosion energy and low ejecta mass (Perets et al., 2011), it is also likely that SN 1885 originated from a Ca-rich transient and a large amount of 44Ti might remain in the SNR after a century. However, due to the large distance to M31, for a line width of km/s which is comparable to the Ca and Fe ejecta expansion velocities in optical and UV spectra (Fesen et al., 2017), the inferred 44Ti mass limit is 0.26 . This limit is much higher than all presented models but it also means that a Ca-rich transient origin cannot be excluded. For the NuSTAR upper limit to reach the highest 44Ti output in present Ca-rich transient models, i.e. (Perets et al., 2010; Zenati et al., 2023), an additional effective exposure of at least Ms is required.
As for SN 1006, we derived a large 44Ti mass limit of 2.8 from a large line flux upper bound. It exceeds previous results obtained from the COMPTEL and INTEGRAL observations (Iyudin et al., 1999; Tsygankov et al., 2016), and even a WD mass. All three results cannot provide any physical constraints to the progenitor scenario.
6 Conclusions
We utilised NuSTAR archival data and searched for 44Ti decay lines in the hard X-ray spectra of four nearby thermonuclear SNRs: Kepler, SN 1885, G1.9+0.3 and SN 1006. We could not find apparent decay lines at 68 or 78 keV but only obtained flux upper limits. The mass limits place some constraints on their progenitors.
1. We derived the first NuSTAR constraint on the 44Ti decay emission upper limit for Kepler, which is . The translated 44Ti mass limit excludes the Ca-rich transient and the WD double detonation progenitor with high 44Ti output, but cannot rule out the hybrid WD explosion if the He shell is thin or under high density.
2. We obtained the first 44Ti decay line flux constraint for SN 1885. Because of the large distance, the mass upper limit of 0.26 is higher than the predicted yields of all current Ca-rich transient models.
3. Owing to the long exposure, the updated flux upper limit for G1.9+0.3 is lower than the limits provided by all previous observations. The mass limit of confirms a He-poor WD origin and is lower than those predicted by the subsolar delayed detonation models. The low 44Ti ejecta mass favours a progenitor with (over)solar metallicity and a less dominant detonation phase. However, all CO WD explosion subtypes still remain possible considering systematic errors.
4. Due to the large spatial extent and old age, we were unable to obtain any physical constraints on SN 1006.
We note that the conclusions above rely on the validity of the selected SN models in Table 2 and the adequacy of our crude continuum model to account for the ASL.
Acknowledgements
This work has made use of the Heidelberg Supernova Model Archive (HESMA), https://hesma.h-its.org. This research has made use of the NUSTARDAS software, jointly developed by the ASI Space Science Data Center (SSDC, Italy) and the California Institute of Technology (Caltech, USA). This work was made possible by the NuSTAR mission, which is led by Caltech, managed by the Jet Propulsion Laboratory, and funded by NASA.
J.W. acknowledges the help and advice on NuSTAR data reduction from Jiang-tao Li. J.W. expresses gratitude to Roman Krivonos for discussions on NuSTAR SL and ASL.
J. W., P.Z., and Y.C. thank the supports by NSFC grants 12273010, 12173018 and 12121003. HBP acknowledges support for this project from the European Union’s Horizon 2020 research and innovation program under grant agreement No 865932-ERC-SNeX.
Data Availability
The observational data utilised in this research are publicly available through the archives of the High Energy Astrophysics Science Archive Research Center (HEASARC), accessible at https://heasarc.gsfc.nasa.gov/docs/archive.html. Interested researchers will obtain access to the intermediate and final results, as well as the corresponding analysis script employed in this study, upon reasonable request to the authors.
References
- Alp et al. (2021) Alp D., Larsson J., Fransson C., 2021, ApJ, 916, 76
- Arnett (1969) Arnett W. D., 1969, Ap&SS, 5, 180
- Bassi et al. (2019) Bassi T., et al., 2019, MNRAS, 482, 1587
- Blair et al. (1991) Blair W. P., Long K. S., Vancura O., 1991, ApJ, 366, 484
- Boggs et al. (2015) Boggs S. E., et al., 2015, Science, 348, 670
- Borkowski et al. (2010) Borkowski K. J., Reynolds S. P., Green D. A., Hwang U., Petre R., Krishnamurthy K., Willett R., 2010, ApJ, 724, L161
- Borkowski et al. (2013a) Borkowski K. J., Reynolds S. P., Green D., Hwang U., Petre R., Krishnamurthy K., Willett R., 2013a, in AAS/High Energy Astrophysics Division #13. p. 127.06
- Borkowski et al. (2013b) Borkowski K. J., Reynolds S. P., Hwang U., Green D. A., Petre R., Krishnamurthy K., Willett R., 2013b, ApJ, 771, L9
- Bozzetto et al. (2017) Bozzetto L. M., et al., 2017, ApJS, 230, 2
- Carlton et al. (2011) Carlton A. K., Borkowski K. J., Reynolds S. P., Hwang U., Petre R., Green D. A., Krishnamurthy K., Willett R., 2011, ApJ, 737, L22
- Cash (1979) Cash W., 1979, ApJ, 228, 939
- Chen et al. (2011) Chen J., Singh B., Cameron J. A., 2011, Nuclear Data Sheets, 112, 2357
- Chiotellis et al. (2012) Chiotellis A., Schure K. M., Vink J., 2012, A&A, 537, A139
- Diehl (2022) Diehl R., 2022, in , Handbook of X-ray and Gamma-ray Astrophysics. p. 62, doi:10.1007/978-981-16-4544-0_86-1
- Dufour & Kaspi (2013) Dufour F., Kaspi V. M., 2013, ApJ, 775, 52
- Dupraz et al. (1997) Dupraz C., Bloemen H., Bennett K., Diehl R., Hermsen W., Iyudin A. F., Ryan J., Schoenfelder V., 1997, A&A, 324, 683
- Evans et al. (2020) Evans I. N., et al., 2020, in American Astronomical Society Meeting Abstracts #235. p. 154.05
- Ferrand & Safi-Harb (2012) Ferrand G., Safi-Harb S., 2012, Advances in Space Research, 49, 1313
- Fesen et al. (1989) Fesen R. A., Hamilton A. J. S., Saken J. M., 1989, ApJ, 341, L55
- Fesen et al. (1999) Fesen R. A., Gerardy C. L., McLin K. M., Hamilton A. J. S., 1999, ApJ, 514, 195
- Fesen et al. (2007) Fesen R. A., Höflich P. A., Hamilton A. J. S., Hammell M. C., Gerardy C. L., Khokhlov A. M., Wheeler J. C., 2007, ApJ, 658, 396
- Fesen et al. (2015) Fesen R. A., Höflich P. A., Hamilton A. J. S., 2015, ApJ, 804, 140
- Fesen et al. (2017) Fesen R. A., Weil K. E., Hamilton A. J. S., Höflich P. A., 2017, ApJ, 848, 130
- Fink et al. (2014) Fink M., et al., 2014, MNRAS, 438, 1762
- Gaia Collaboration et al. (2021) Gaia Collaboration et al., 2021, A&A, 649, A1
- Ghavamian et al. (2002) Ghavamian P., Winkler P. F., Raymond J. C., Long K. S., 2002, ApJ, 572, 888
- González Hernández et al. (2012) González Hernández J. I., Ruiz-Lapuente P., Tabernero H. M., Montes D., Canal R., Méndez J., Bedin L. R., 2012, Nature, 489, 533
- Grefenstette et al. (2014) Grefenstette B. W., et al., 2014, Nature, 506, 339
- Grefenstette et al. (2017) Grefenstette B. W., et al., 2017, ApJ, 834, 19
- Grefenstette et al. (2021) Grefenstette B. W., et al., 2021, ApJ, 909, 30
- Gronow et al. (2020) Gronow S., Collins C., Ohlmann S. T., Pakmor R., Kromer M., Seitenzahl I. R., Sim S. A., Röpke F. K., 2020, A&A, 635, A169
- Gronow et al. (2021a) Gronow S., Collins C. E., Sim S. A., Röpke F. K., 2021a, A&A, 649, A155
- Gronow et al. (2021b) Gronow S., Côté B., Lach F., Seitenzahl I. R., Collins C. E., Sim S. A., Röpke F. K., 2021b, A&A, 656, A94
- Hamilton & Fesen (2000) Hamilton A. J. S., Fesen R. A., 2000, ApJ, 542, 779
- Harp et al. (2010) Harp D. I., Liebe C. C., Craig W., Harrison F., Kruse-Madsen K., Zoglauer A., 2010, in Angeli G. Z., Dierickx P., eds, Society of Photo-Optical Instrumentation Engineers (SPIE) Conference Series Vol. 7738, Modeling, Systems Engineering, and Project Management for Astronomy IV. p. 77380Z, doi:10.1117/12.856626
- Harrison et al. (2013) Harrison F. A., et al., 2013, ApJ, 770, 103
- Horowitz & Caplan (2021) Horowitz C. J., Caplan M. E., 2021, Phys. Rev. Lett., 126, 131101
- Iben & Tutukov (1984) Iben I. J., Tutukov A. V., 1984, ApJS, 54, 335
- Iwamoto et al. (1999) Iwamoto K., Brachwitz F., Nomoto K., Kishimoto N., Umeda H., Hix W. R., Thielemann F.-K., 1999, ApJS, 125, 439
- Iyudin et al. (1999) Iyudin A. F., et al., 1999, Astrophysical Letters and Communications, 38, 383
- Jha et al. (2019) Jha S. W., Maguire K., Sullivan M., 2019, Nature Astronomy, 3, 706
- Kaastra & Bleeker (2016) Kaastra J. S., Bleeker J. A. M., 2016, A&A, 587, A151
- Karakas (2010) Karakas A. I., 2010, MNRAS, 403, 1413
- Kashi & Soker (2011) Kashi A., Soker N., 2011, MNRAS, 417, 1466
- Kasuga et al. (2021) Kasuga T., Vink J., Katsuda S., Uchida H., Bamba A., Sato T., Hughes J. P., 2021, ApJ, 915, 42
- Katsuda et al. (2015) Katsuda S., et al., 2015, ApJ, 808, 49
- Kerzendorf et al. (2012) Kerzendorf W. E., Schmidt B. P., Laird J. B., Podsiadlowski P., Bessell M. S., 2012, ApJ, 759, 7
- Kerzendorf et al. (2014) Kerzendorf W. E., Childress M., Scharwächter J., Do T., Schmidt B. P., 2014, ApJ, 782, 27
- Kerzendorf et al. (2018) Kerzendorf W. E., Strampelli G., Shen K. J., Schwab J., Pakmor R., Do T., Buchner J., Rest A., 2018, MNRAS, 479, 192
- Khokhlov (1991) Khokhlov A. M., 1991, A&A, 245, 114
- Kosakowski et al. (2023) Kosakowski D., Ugalino M. I., Fisher R., Graur O., Bobrick A., Perets H. B., 2023, MNRAS, 519, L74
- Krimm et al. (2013) Krimm H. A., et al., 2013, ApJS, 209, 14
- Kromer et al. (2010) Kromer M., Sim S. A., Fink M., Röpke F. K., Seitenzahl I. R., Hillebrandt W., 2010, ApJ, 719, 1067
- Kromer et al. (2013) Kromer M., et al., 2013, ApJ, 778, L18
- Kromer et al. (2015) Kromer M., et al., 2015, MNRAS, 450, 3045
- Kromer et al. (2016) Kromer M., et al., 2016, MNRAS, 459, 4428
- Kushnir et al. (2013) Kushnir D., Katz B., Dong S., Livne E., Fernández R., 2013, ApJ, 778, L37
- Lach et al. (2020) Lach F., Röpke F. K., Seitenzahl I. R., Coté B., Gronow S., Ruiter A. J., 2020, A&A, 644, A118
- Lach et al. (2022a) Lach F., Callan F. P., Bubeck D., Röpke F. K., Sim S. A., Schrauth M., Ohlmann S. T., Kromer M., 2022a, A&A, 658, A179
- Lach et al. (2022b) Lach F., Callan F. P., Sim S. A., Röpke F. K., 2022b, A&A, 659, A27
- Leung & Nomoto (2018) Leung S.-C., Nomoto K., 2018, ApJ, 861, 143
- Leung & Nomoto (2020a) Leung S.-C., Nomoto K., 2020a, ApJ, 888, 80
- Leung & Nomoto (2020b) Leung S.-C., Nomoto K., 2020b, ApJ, 900, 54
- Li et al. (2018) Li J.-T., et al., 2018, ApJ, 864, 85
- Livne (1990) Livne E., 1990, ApJ, 354, L53
- Luken et al. (2020) Luken K. J., et al., 2020, MNRAS, 492, 2606
- Madsen et al. (2017a) Madsen K. K., Christensen F. E., Craig W. W., Forster K. W., Grefenstette B. W., Harrison F. A., Miyasaka H., Rana V., 2017a, Journal of Astronomical Telescopes, Instruments, and Systems, 3, 044003
- Madsen et al. (2017b) Madsen K. K., Forster K., Grefenstette B. W., Harrison F. A., Stern D., 2017b, ApJ, 841, 56
- Maeda et al. (2010) Maeda K., Röpke F. K., Fink M., Hillebrandt W., Travaglio C., Thielemann F. K., 2010, ApJ, 712, 624
- Maggi et al. (2016) Maggi P., et al., 2016, A&A, 585, A162
- Maggi et al. (2019) Maggi P., et al., 2019, A&A, 631, A127
- Marquardt et al. (2015) Marquardt K. S., Sim S. A., Ruiter A. J., Seitenzahl I. R., Ohlmann S. T., Kromer M., Pakmor R., Röpke F. K., 2015, A&A, 580, A118
- McConnachie (2012) McConnachie A. W., 2012, AJ, 144, 4
- Mernier et al. (2020) Mernier F., et al., 2020, Astronomische Nachrichten, 341, 203
- Mewe (1999) Mewe R., 1999, in van Paradijs J., Bleeker J. A. M., eds, , Vol. 520, X-Ray Spectroscopy in Astrophysics. p. 109, doi:10.1007/978-3-540-49199-6_2
- Moll & Woosley (2013) Moll R., Woosley S. E., 2013, ApJ, 774, 137
- Neopane et al. (2022) Neopane S., Bhargava K., Fisher R., Ferrari M., Yoshida S., Toonen S., Bravo E., 2022, ApJ, 925, 92
- Nikolić et al. (2013) Nikolić S., van de Ven G., Heng K., Kupko D., Husemann B., Raymond J. C., Hughes J. P., Falcón-Barroso J., 2013, Science, 340, 45
- Nomoto (1982) Nomoto K., 1982, ApJ, 253, 798
- Nomoto et al. (1984) Nomoto K., Thielemann F. K., Yokoi K., 1984, ApJ, 286, 644
- Ohlmann et al. (2014) Ohlmann S. T., Kromer M., Fink M., Pakmor R., Seitenzahl I. R., Sim S. A., Röpke F. K., 2014, A&A, 572, A57
- Pakmor et al. (2010) Pakmor R., Kromer M., Röpke F. K., Sim S. A., Ruiter A. J., Hillebrandt W., 2010, Nature, 463, 61
- Pakmor et al. (2012) Pakmor R., Kromer M., Taubenberger S., Sim S. A., Röpke F. K., Hillebrandt W., 2012, ApJ, 747, L10
- Pakmor et al. (2013) Pakmor R., Kromer M., Taubenberger S., Springel V., 2013, ApJ, 770, L8
- Pakmor et al. (2021) Pakmor R., Zenati Y., Perets H. B., Toonen S., 2021, MNRAS, 503, 4734
- Pakmor et al. (2022) Pakmor R., et al., 2022, MNRAS, 517, 5260
- Papish & Perets (2016) Papish O., Perets H. B., 2016, ApJ, 822, 19
- Patnaude et al. (2012) Patnaude D. J., Badenes C., Park S., Laming J. M., 2012, ApJ, 756, 6
- Perets (2014) Perets H. B., 2014, arXiv e-prints, p. arXiv:1407.2254
- Perets et al. (2010) Perets H. B., et al., 2010, Nature, 465, 322
- Perets et al. (2011) Perets H. B., Badenes C., Arcavi I., Simon J. D., Gal-yam A., 2011, ApJ, 730, 89
- Plewa et al. (2004) Plewa T., Calder A. C., Lamb D. Q., 2004, ApJ, 612, L37
- Reid et al. (2014) Reid M. J., et al., 2014, ApJ, 783, 130
- Reynolds et al. (2007) Reynolds S. P., Borkowski K. J., Hwang U., Hughes J. P., Badenes C., Laming J. M., Blondin J. M., 2007, ApJ, 668, L135
- Reynolds et al. (2008) Reynolds S. P., Borkowski K. J., Green D. A., Hwang U., Harrus I., Petre R., 2008, ApJ, 680, L41
- Roy et al. (2022) Roy N. C., et al., 2022, ApJ, 932, L24
- Sankrit et al. (2016) Sankrit R., Raymond J. C., Blair W. P., Long K. S., Williams B. J., Borkowski K. J., Patnaude D. J., Reynolds S. P., 2016, ApJ, 817, 36
- Sano et al. (2022) Sano H., Yamaguchi H., Aruga M., Fukui Y., Tachihara K., Filipović M. D., Rowell G., 2022, ApJ, 933, 157
- Sarbadhicary et al. (2019) Sarbadhicary S. K., Chomiuk L., Badenes C., Tremou E., Soderberg A. M., Sjouwerman L. O., 2019, ApJ, 872, 191
- Seitenzahl et al. (2013) Seitenzahl I. R., et al., 2013, MNRAS, 429, 1156
- Seitenzahl et al. (2016) Seitenzahl I. R., et al., 2016, A&A, 592, A57
- Shen & Bildsten (2009) Shen K. J., Bildsten L., 2009, ApJ, 699, 1365
- Shen & Bildsten (2014) Shen K. J., Bildsten L., 2014, ApJ, 785, 61
- Shields et al. (2022) Shields J. V., et al., 2022, ApJ, 933, L31
- Sim et al. (2010) Sim S. A., Röpke F. K., Hillebrandt W., Kromer M., Pakmor R., Fink M., Ruiter A. J., Seitenzahl I. R., 2010, ApJ, 714, L52
- Sim et al. (2012) Sim S. A., Fink M., Kromer M., Röpke F. K., Ruiter A. J., Hillebrandt W., 2012, MNRAS, 420, 3003
- Soker et al. (2013) Soker N., Kashi A., García-Berro E., Torres S., Camacho J., 2013, MNRAS, 431, 1541
- Sun & Chen (2019) Sun L., Chen Y., 2019, ApJ, 872, 45
- The et al. (2006) The L. S., et al., 2006, A&A, 450, 1037
- Timmes et al. (1996) Timmes F. X., Woosley S. E., Hartmann D. H., Hoffman R. D., 1996, ApJ, 464, 332
- Townsley et al. (2019) Townsley D. M., Miles B. J., Shen K. J., Kasen D., 2019, ApJ, 878, L38
- Travaglio et al. (2004) Travaglio C., Hillebrandt W., Reinecke M., Thielemann F. K., 2004, A&A, 425, 1029
- Travaglio et al. (2005) Travaglio C., Hillebrandt W., Reinecke M., 2005, A&A, 443, 1007
- Troja et al. (2014) Troja E., et al., 2014, ApJ, 797, L6
- Tsebrenko & Soker (2013) Tsebrenko D., Soker N., 2013, MNRAS, 435, 320
- Tsygankov et al. (2016) Tsygankov S. S., Krivonos R. A., Lutovinov A. A., Revnivtsev M. G., Churazov E. M., Sunyaev R. A., Grebenev S. A., 2016, MNRAS, 458, 3411
- Uchida et al. (2013) Uchida H., Yamaguchi H., Koyama K., 2013, ApJ, 771, 56
- Vink (2017) Vink J., 2017, in Alsabti A. W., Murdin P., eds, , Handbook of Supernovae. p. 2063, doi:10.1007/978-3-319-21846-5_92
- Wagner-Kaiser et al. (2015) Wagner-Kaiser R., Sarajedini A., Dalcanton J. J., Williams B. F., Dolphin A., 2015, MNRAS, 451, 724
- Waldman et al. (2011) Waldman R., Sauer D., Livne E., Perets H., Glasner A., Mazzali P., Truran J. W., Gal-Yam A., 2011, ApJ, 738, 21
- Webbink (1984) Webbink R. F., 1984, ApJ, 277, 355
- Weinberger et al. (2020) Weinberger C., Diehl R., Pleintinger M. M. M., Siegert T., Greiner J., 2020, A&A, 638, A83
- Weng et al. (2022) Weng J., et al., 2022, ApJ, 924, 119
- Wenger et al. (2018) Wenger T. V., Balser D. S., Anderson L. D., Bania T. M., 2018, ApJ, 856, 52
- Whelan & Iben (1973) Whelan J., Iben Icko J., 1973, ApJ, 186, 1007
- Wik et al. (2014) Wik D. R., et al., 2014, ApJ, 792, 48
- Woosley & Kasen (2011) Woosley S. E., Kasen D., 2011, ApJ, 734, 38
- Woosley & Weaver (1994) Woosley S. E., Weaver T. A., 1994, ApJ, 423, 371
- Woosley et al. (1973) Woosley S. E., Arnett W. D., Clayton D. D., 1973, ApJS, 26, 231
- Yamaguchi et al. (2008) Yamaguchi H., et al., 2008, PASJ, 60, S141
- Yukita et al. (2017) Yukita M., et al., 2017, ApJ, 838, 47
- Zenati et al. (2023) Zenati Y., Perets H. B., Dessart L., Jacobson-Galán W. V., Toonen S., Rest A., 2023, ApJ, 944, 22
- Zhekov et al. (2006) Zhekov S. A., McCray R., Borkowski K. J., Burrows D. N., Park S., 2006, ApJ, 645, 293
- Zhekov et al. (2009) Zhekov S. A., McCray R., Dewey D., Canizares C. R., Borkowski K. J., Burrows D. N., Park S., 2009, ApJ, 692, 1190
- Zoglauer et al. (2015) Zoglauer A., et al., 2015, ApJ, 798, 98
- de Vaucouleurs & Corwin (1985) de Vaucouleurs G., Corwin H. G. J., 1985, ApJ, 295, 287
- van den Bergh & Kamper (1977) van den Bergh S., Kamper K. W., 1977, ApJ, 218, 617
Appendix A Details of Data Reduction
A.1 Source Regions
Among the targets, SN 1885 is not apparent in the X-ray regime, hence we used a source region with a diameter equal to the Half Power Diameter of NuSTAR (, Harrison et al., 2013), centred at the location (RA = , dec = ) that is determined by earlier optical images (Sarbadhicary et al., 2019). The nearby bright X-ray source, Swift J0042.6+4112 (Yukita et al., 2017), was selected as the reference object to correct the astrometric errors (mainly translational) and the systematic offsets between the FPMA and FPMB modules (Harp et al., 2010; Harrison et al., 2013). The relative shift between its centroid position in each 3 – 78 keV NuSTAR FPM image and its reported location in the Chandra Source Catalog 2.0 (Evans et al., 2020) was used to adjust the coordinates above. Because of the fine astrometric accuracy of the Chandra telescope and previous optical observations (Sarbadhicary et al., 2019), we suppose that our crude corrections are already sufficient for our large extraction region.
For SN 1006, only of the total SNR area was covered by the observations. If the distribution of 44Ti ejecta is non-uniform, as already seen in Cas A (Grefenstette et al., 2017), it would introduce significant errors.
Due to the mast movements and the attitude variations, some source regions close to the detector edge might get partly out of the field of view (FoV) during the long exposure and produce incorrect time-dependent corrections. For those regions, we adjusted the size of the sub-regions divided to account for the spatial variations of the response for extended sources.
A.2 Background Treatments
In SN 1006, the background regions free from source emission are limited due to the large size of the SNR. Therefore, we also included regions within the SNR in the nuskybgd background analysis since the interior is dominated by keV thermal emission, which is negligible to NuSTAR and our analysis. Similar treatments were also adopted by Li et al. (2018). To prevent the possible 44Ti decay lines from affecting the fits of nearby instrumental lines and thus the later flux measurement of themselves, we still only used the regions outside the SNR to estimate the 65, 67, 75 and 86 keV lines of the internal component. Hence, the flux of these four instrumental lines within the source region was mostly determined by scaling the best-fit normalization in one detector with typical ratios derived from previous studies, rather than through joint-fitting spectra across the FoV.
As for G1.9+0.3, the FoV including the source region is heavily affected by SL from multiple nearby sources, which also introduces more complex background components besides the standard nuskybgd analysis. Therefore, we simply extracted spectra from nearby source-free regions in the same detector for background subtraction, as in Zoglauer et al. (2015). Using the generated detector maps, we checked that the defined source and background regions exclude any area that spent of exposure time in another detector due to mast motions. We note that although it did not account for the spatial variation of the background and SL perfectly, this treatment will only cause small errors because the dominant underlying emission around the 44Ti decay lines is of instrumental origin and should be fairly uniform across the same detector.
In all NuSTAR observations of Kepler, we found residual extended emission keV located at the southern half of the FoV after background subtraction by nuskybgd (see Figure 8 for an example). This emission is uncorrelated with the telescope position angle and is not concentrated around some well-defined sky coordinates, which indicates that it is unlikely instrumental or from the focused celestial objects. We suggest that this emission excess originates from ASL (Madsen et al., 2017a). Although the verification of its origin requires ray-trace simulations, we note that its low energy absorption feature is consistent with the ASL spectrum of Crab (Madsen et al., 2017a). Further discussions and evidence from an outburst event during the observations can be found in Appendix B.
The accurate modelling of the ASL passing through the aperture module is intricate and beyond the scope of this paper. Therefore, we simply used a highly absorbed power law model (phabs*powerlaw) to describe the ASL spectra present in the background regions, with the photon indices tied together but the column densities varying freely to account for different depths of transmission through the aperture. The response file assigned to this model component was constructed by nuskybgd, which excludes the optics response compared with the standard files for the focused observations. Similar treatments are also adopted for the SL analysis in Madsen et al. (2017b) and Grefenstette et al. (2021). An example of the ASL fits in the background modelling is displayed in Figure 8. The photon indices of ASL range from 1.58 to 2.35 in the observations with ASL affecting Kepler. There can be several reasons for the difference in photon indices. These include different background regions being illuminated by different ASL sources, being blocked by varying depths of aperture absorption, state transitions in ASL sources, as well as limitations due to low counts in the spectra. It is noted that the ASL was modelled by an SL response plus a photoelectric absorption model (phabs) originally designed for the interstellar medium, which might also hinder us from obtaining an accurate photon index. However, the values of the /d.o.f. () and the residual plots showed that this model is sufficient to describe the ASL spectral shape from a statistical perspective. Our analysis here focuses on the measurements of the 68 and 78 keV line fluxes rather than obtaining precise physical interpretations of the underlying ASL.
To investigate the system errors arising from the ASL spectral shape discussed in Section 4.4, we conducted background analyses of the longest observations of G1.9+0.3 (obs. 40001015007 and 40702003008) in 2013 and 2021. The background regions were selected to avoid the SL illuminated regions as indicated by the StrayCats catalogue (see Figure 9 for an example). The resulting photon indices were 2.30 and 2.73, respectively. However, complex SL patterns exist which cannot be unambiguously identified by the catalogue, and both the SL and ASL appeared to cover the entire FoV. Consequently, we obtained a high fitting /d.o.f. value (1.36 and 1.46, respectively), and were unable to identify completely SL or ASL free background regions that could be used as a reference to provide better constraints. Photon indices within 2 – 3 yielded similarly acceptable goodness of fit.
Appendix B ASL from an Nearby Transient
Confirming ASL requires ray-trace simulations to predict its pattern on the detector, and is more challenging due to the scarcity of high-energy photons compared to identifying SL sources. Nevertheless, during a nearby outburst event, a distinctive ASL pattern can emerge that is only present in the corresponding period, which can be easily linked to the transient source.
Figure 10 displays the images after background subtraction using the nuskybgd routine for four consecutive observations of Kepler. The first and last images exhibit a pattern of residual extended emission above 30 keV similar to that shown in Figure 8. However, during early 2017, its shape changed significantly, accompanied by a notable increase in its intensity. This peculiar behaviour suggests an outburst event occurring in the southwest direction of Kepler.
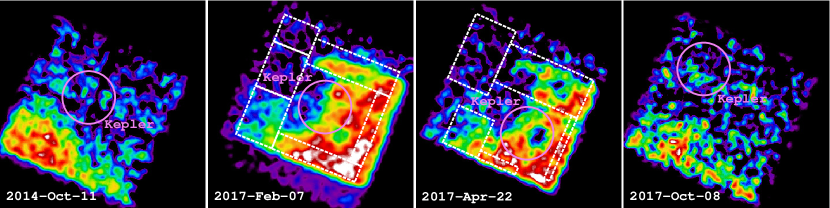
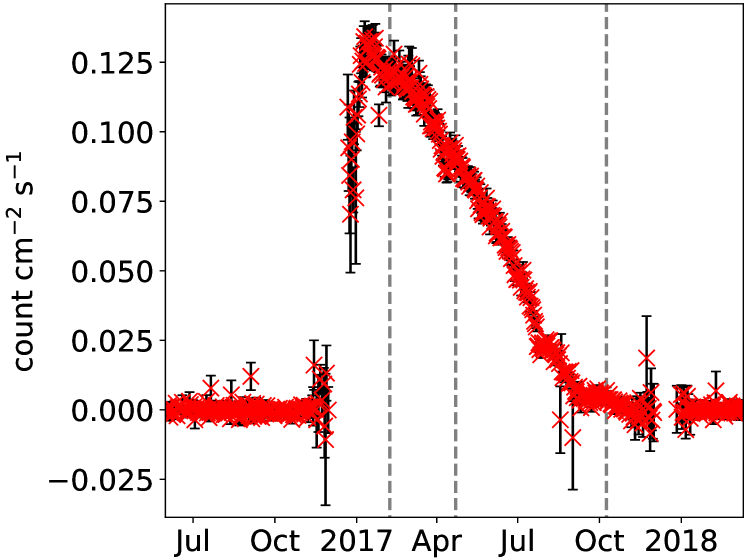
We identified a black hole binary named Granat 1716-249 in the Swift/BAT Transient Monitor catalogue (Krimm et al., 2013) which underwent an outburst during this period (see Figure 11). It returned to the quiescent state in October 2017 and the corresponding extended residual also vanished during the NuSTAR observation at the same time (see Figure 10). Granat 1716-249 (RA = , dec = , Gaia Collaboration et al., 2021), positioned degrees southwest of Kepler, falls within the typical angular range for ASL sources (Madsen et al., 2017a). All the evidence strongly suggests that the residual emissions observed after background subtraction in obs. 90201021002 and 90201021004 are attributed to the ASL originating from Granat 1716-249.
To test if our treatment of ASL in Section 3 and 4 is correct, we also performed the same spectral fits (phabs*powerlaw model plus the SL response) in the background regions depicted in Figure 10. We obtained excellent goodness of fit, and the 90% confidence interval of the photon index is 2.11 – 2.12 and 1.87 – 1.94 in obs. 90201021002 and 90201021004, respectively. The index difference is likely due to the different extraction regions and thus different absorptions which were poorly constrained in our model, but does not indicate the state transition. The photon index is softer than the observed index of 1.5 – 1.8 in the spectral evolution captured by Swift during the outburst (Bassi et al., 2019). This implies that our crude treatment still cannot fully reproduce accurate parameters of the ASL, although statistically sufficient in spectral fits.
We also obtained varying absorption depth across the ASL, but the errors are too large and we cannot find the crescent pattern originating from the overlapping aperture (Madsen et al., 2017a).
Appendix C Source Spectra
Figure 12 shows the fitting of the SNR spectra with one of the background realisations (except G1.9+0.3) as an example.