From Keywords to Structured Summaries: Streamlining Scholarly Knowledge Access
Abstract
This short paper highlights the growing importance of information retrieval (IR) engines in the scientific community, addressing the inefficiency of traditional keyword-based search engines due to the rising volume of publications. The proposed solution involves structured records, underpinning advanced information technology (IT) tools, including visualization dashboards, to revolutionize how researchers access and filter articles, replacing the traditional text-heavy approach. This vision is exemplified through a proof of concept centered on the “reproductive number estimate of infectious diseases” research theme, using a fine-tuned large language model (LLM) to automate the creation of structured records to populate a backend database that now goes beyond keywords. The result is a next-generation IR method accessible at https://orkg.org/usecases/r0-estimates.
Keywords:
Structured scholarly knowledge Large Language Models Visualization dashboards Next-generation scholarly IR platform.1 Introduction
The proliferation of scientific literature demands a reevaluation of scholarly article information retrieval (IR) engines [19, 8]. The rapidly expanding volume of scientific publications across various domains [1, 23] has led to an urgent need for more efficient and precise methods of accessing and filtering these vast knowledge stores. Traditional keyword-based search engines, which once served as the primary means of IR, are proving inadequate to help researchers keep track of the fast-paced scientific progress. As a result, there is a growing demand for innovative approaches, such as structured scholarly content representations [16, 18] and advanced machine learning algorithms [2, 35], going beyond keywords, facilitating the application of smarter information technology (IT) and access tools to assist the researcher to effectively navigate the text-heavy landscape of scholarly literature. Projects like the Open Research Knowledge Graph (ORKG) [5] are driving the shift towards fine-grained structured knowledge representations, enabling smarter views [32] and comparisons of research aspects [31]. This paradigm shift not only promises to streamline the research process but also holds the potential to democratize access to scientific knowledge, making it more accessible to a broader audience, including non-experts seeking insights into cutting-edge research.
Traditional scholarly article IR engines rely on keywords, bibliometrics, and citation graphs, resulting in ranked lists of relevant publications. However, this approach necessitates time-intensive cognitive tie-ups for the researcher to navigate and filter the text-heavy results. This paper’s central research agenda is to enhance access and filtering of scholarly knowledge on IR platforms using structured knowledge. The growing interest in structured scholarly knowledge, exemplified by projects like the Semantic Scholar Literature Graph [2] and Open Research Knowledge Graph (ORKG) [5], suggests the need for rethinking scholarly information access through next-generation IT. Our aim is to use IT to streamline scholarly content access, reducing cognitive load on researchers dealing with text-heavy models of filtering publications in traditional IR platforms. To achieve this, we explore the concept of dashboards, which provide easily understandable views of crucial information via visual representations, aiding decision-making [41]. A knowledge dashboard on IR platforms, based on structured scholarly knowledge facets, would simplify research by replacing text-heavy ranked lists with smart IT-generated charted summaries for filtering publications and research discovery. The device of dashboards is not new in representing scientific information [27, 42]. Khodaveisi et al. [26] examined 26 recently introduced dashboards during the Covid-19 pandemic, focusing on their technical features [39, 40, 46, 47, 4, 21, 37, 38, 43, 45, 34, 6, 17, 33, 25, 10, 29, 22, 9, 14, 24, 13, 15, 3, 11, 7]. These dashboards mainly served citizen science by tracking COVID-19 cases, analyzing epidemiological trends, and aiding decision-making, drawing data from public databases like the World Health Organization (WHO) and Johns Hopkins, or electronic health records at the hospital organization level. In contrast, we aim to apply next-generation IT to structured facets of scholarly knowledge itself, streamlining the creation of research snapshots on the IR platforms based on data extraction mechanisms supported by LLMs.
In pursuit of our vision, this short paper demonstrates a proof-of-concept (POC) over a collection of articles on the “reproductive number estimate of infectious diseases” research theme. The reproductive number estimate for infectious diseases, often denoted as “,” is a measurement indicating the average number of secondary cases generated by a single infected individual in a population [20]. To structure this knowledge, we adopt the orkg-R0 semantic model [30], defining six crucial properties for the research theme: the disease name under investigation, the study location, the study date, the value, the %Confidence Interval values, and the computation method for . In scholarly knowledge organization, properties are research-theme-specific. Our POC focuses on a readily structured research theme, but the forthcoming discussion on smart IT dashboards extends to various themes and properties. More than that, well-defined properties enable the comparison among different research works so one can determine which works to read further w.r.t. the compared property value. In our POC, we treat the properties as indicators of interest to researchers when filtering for scholarly information on the theme. Thus we define four research questions (RQs) for them. RQ1: what are the max estimates reported for the diseases in our database? RQ2: For a chosen disease, how many studies have been reported across study locations? RQ3: what is the min and max for a disease across study locations? RQ4: locate on the world map where the diseases have been studied? In our POC, these RQs are represented as chart summaries in a dashboard, enhancing publication and research filtering. This IT-driven approach deconstructs scholarly knowledge into user-friendly visuals, improving the filtering process beyond keyword-based methods and empowering researchers. The rest of the paper explains the technical details of the various modules that bring our POC to life.
2 The Automatic Knowledge Structuring Model
We employ the ORKG-FLAN-T5 R0 large language model (LLM) from Hugging Face, available at link. This LLM, based on the T5 architecture [36], is finely tuned for precise extraction of epidemiological data, particularly for generating structured research contribution summaries related to the estimate in infectious diseases. It aids in systematically extracting structured epidemiological information from scientific literature, benefiting the fields of epidemiology and virology by addressing the specific challenge of estimation. The question at hand is: what are the key properties for structuring a summary of estimate research in infectious diseases? To address this, an expert semantic modeler created a research comparison based on structured property-value pairs for Covid-19 estimate contributions from 30 abstracts, resulting in six properties: disease name, location, date, R0 value, %Confidence Interval (CI) values, and method. This structuring, known as orkg-R0, aims for a balanced approach between generality and specificity in organizing estimate research. Subsequently, a larger corpus of 1,500 articles underwent annotation for machine learning training. Each article’s title and abstract were paired with one or more structured summaries depending on the number of values reported.
The ORKG-FLAN-T5 R0 model111The technical paper is under double-blind review and will be cited in the final version. is an instruction fine-tuned variant of FLAN-T5 Large (780 M) using instruction finetuning as an incremental progression of the instruction-tuning paradigm introduced as FLAN (Finetuned Language Net) [36, 44, 12, 28]. The model is trained to respond to the structuring task objective formulated as the question: What are the values for the following properties of the basic reproduction number estimate (R0): disease name, location, date, R0 value, %CI values, and method? The model processes a paper’s title and abstract, producing a structured description. A sample of the LLM versus gold-standard human responses can be found online at this URL.
3 Our Scholarly Articles Collection
Our POC article collection focused specifically on relevant studies related to our chosen research theme of estimates. We obtained these articles through keyword-based searches in the PubMed database, the largest source of biomedical and life sciences research articles. Our latest search was conducted on September 13, 2023, to compile the POC collection. The exact search query applied was the following: (basic reproduction number[TIAB] OR basic reproductive number[TIAB] OR basic reproduction ratio[TIAB] OR basic reproductive rate[TIAB] OR basic reproductive ratio[TIAB] OR basic reproduction rate[TIAB] OR R0[TIAB]) NOT (R0 resection OR cancer). The search query aimed to retrieve papers containing any synonym variant of estimate in the title or abstract, yielding 7,127 articles. The search results were exported as a CSV file, including metadata fields like PubMed ID, publication date, title, and abstract.
3.1 Our Structured Scholarly Articles Collection
The initial keyword-based article collection did not constitute the final dataset for our IR platform, as articles not reporting an R0 value needed to be filtered out. To refine our collection, we employed the ORKG-FLAN-T5 R0 LLM, queried through Python with the Transformers library. This model, trained to provide structured JSON descriptions for articles reporting R0 estimates, excluded unanswerable cases. Subsequently, unanswerable records were removed, resulting in 2,051 remaining articles with 2,736 structured descriptions. These JSON response objects were reorganized into columns based on six properties, and location property values were normalized using GeoNames and other sources, extrapolated into a new column. For values reported in ranges, preprocessing split them into minimum and maximum values. The processed data was imported to a PostgreSQL 15 database, serving as the backend storage. A query for the top 20 most represented infectious diseases in our database is shown in Table 1. Notably, the high precision demonstrated by the LLM ensured that all the top reported diseases are indeed ascertained infectious diseases. Geographically, our database includes studies from all seven continents, with the top 20 countries being: China, India, United States, Italy, Brazil, Japan, South Korea, Iran, United Kingdom, Saudi Arabia, Spain, Pakistan, Germany, Bangladesh, Canada, Nigeria, France, Colombia, Netherlands, and Taiwan.
| covid-19 (1002) | mers-cov (21) | measles (15) | hepatitis c (8) |
| dengue (41) | cholera (18) | hepatitis b (12) | tuberculosis (8) |
| influenza (29) | zika (18) | zika virus (12) | monkeypox (8) |
| hiv (23) | african swine fever (17) | ebola (11) | west nile virus (7) |
| sars (22) | ebola (17) | hand, foot, and mouth disease (8) | malaria (7) |
4 A Next-Generation Scholarly IR Platform
We introduce a next-generation scholarly IR platform dashboard as a proof of concept (POC) for our selected theme on “reproductive number estimates of infectious diseases.” The aim is to streamline scholarly knowledge access with advanced frontend IT. This is addressed by breaking down complex scholarly information into four user-friendly visual summaries that consolidate properties from structured knowledge. Each visual provides a concise summary, addressing a specific RQ as an assistant to the researcher, thus enabling to make more informed decisions when filtering for papers. The platform is freely accessible as a web-based application at the following URL: https://orkg.org/usecases/r0-estimates. Furthermore, just its visualization dashboard widget and underlying workflow are displayed in Figure 1. In this technical workflow, the frontend communicates with the backend through a Web API for database queries and data retrieval. Python scripts manage service requests, interpreting component queries and directing database queries. A Python script scheduler periodically updates the database with new articles, querying PubMed for the initial article collection and following the processing cycle as outlined in subsection 3.1 before updating the database with structured summaries. Our workflow maximizes the use of cutting-edge technology, including an optimized next-generation LLM.
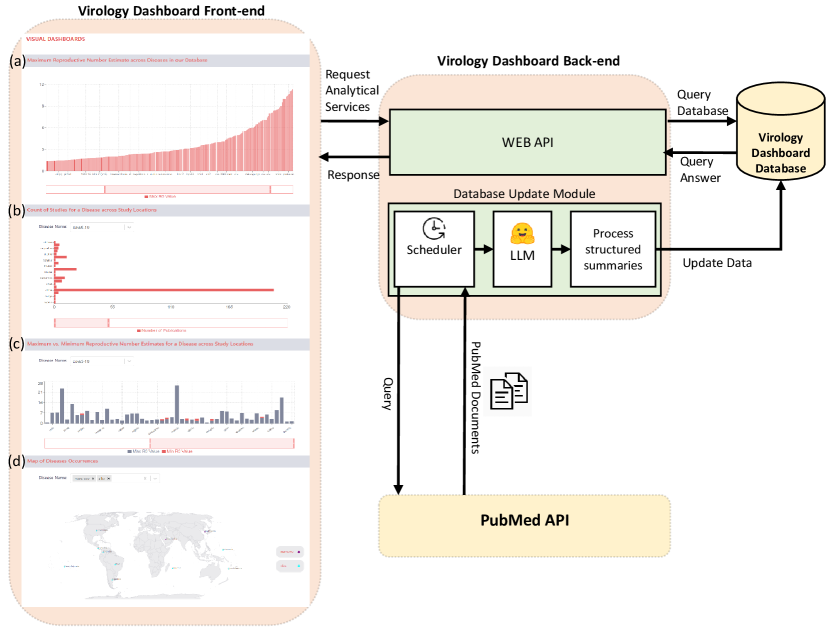
4.1 Charting the data: collating, summarizing, and reporting
Our IR platform comprises three main components: 1) a statistics snapshot displaying total papers, structured knowledge, infectious diseases, and locations in our database, and 2) typical to IR engines, a standard paper listing in a table with keyword-based fields, from which a selected subset is filtered or returned. This is built using the JavaScript data tables library, ag-grid. And, 3) a visual analytical dashboard widget featuring four charts that address the previously introduced four research questions. This process involves collating relevant structured data properties, selecting the most suitable chart from the React chart library that would best summarize the response, and creating a query to retrieve the necessary data from the structured database to report the visual answer. Each RQ and its corresponding visual chart is described next. RQ1: what are the max estimates reported for the diseases in our database? We present a “bar chart” with unique diseases on the x-axis and their corresponding max values on the y-axis. Hovering over a bar reveals the disease and its max value. The chart is adjustable within a specific max range, aiding disease-focused analysis. In the absence of this chart, researchers face a time-consuming task of manually comparing notes in thousands of papers for estimates and associated diseases, which is both tedious and arduous. RQ2: For a chosen disease, how many studies have been reported across study locations? Displayed as a “vertical composed chart,” the y-axis represents study locations, while the x-axis shows the study count. This chart displays only filtered information for the disease name entered in the text box. RQ2 naturally extends RQ1, allowing researchers to explore where and how many studies have been conducted on a given disease. RQ3: what is the min and max for a disease across study locations? Implemented as a “stacked bar chart” to filter disease-specific min and max values across various locations. RQ4: locate on the world map where the diseases have been studied? Enables comparison of up to three disease studies on a world map through a “composable map chart.” Each of these charts make possible to alleviate the tedium of traditional IR in filtering for relevant scholarly articles.
Each visual offers interactive disease selection filters and serves as an informed scholarly article filtering option. When enabled, it displays filtered studies accessible directly on PubMed. Our next-gen IR platform simplifies scholarly knowledge exploration, potentially benefiting citizen science.
5 Conclusion
In this short paper, we introduced a proof-of-concept for an advanced scholarly IR engine that reduces the cognitive load posed by text-heavy keyword-based search results in traditional IR. In traditional IR, researchers often need to make mental notes to filter papers for reading, akin to searching for a needle in a haystack due to exponential publication rates. This highlights the need to rethink traditional keyword-based scholarly IR by explicitly modeling salient research aspects, making them machine-actionable for next-generation IT filtering visual assistants.
References
- [1] Altbach, P.G., De Wit, H.: Too much academic research is being published. International Higher Education (96), 2–3 (2019)
- [2] Ammar, W., Groeneveld, D., Bhagavatula, C., Beltagy, I., Crawford, M., Downey, D., Dunkelberger, J., Elgohary, A., Feldman, S., Ha, V., et al.: Construction of the literature graph in semantic scholar. In: Proceedings of the 2018 Conference of the North American Chapter of the Association for Computational Linguistics: Human Language Technologies, Volume 3 (Industry Papers). pp. 84–91 (2018)
- [3] Arias-Carrasco, R., Giddaluru, J., Cardozo, L.E., Martins, F., Maracaja-Coutinho, V., Nakaya, H.I.: Outbreak: a user-friendly georeferencing online tool for disease surveillance. Biological Research 54, 1–6 (2021)
- [4] Aristizábal-Torres, D., Peñuela-Meneses, C.A., Barrera-Rodríguez, A.M.: An interactive web-based dashboard to track covid-19 in colombia. case study: five main cities. Revista de Salud Pública 22, 214–219 (2023)
- [5] Auer, S., Oelen, A., Haris, M., Stocker, M., D’Souza, J., Farfar, K.E., Vogt, L., Prinz, M., Wiens, V., Jaradeh, M.Y.: Improving access to scientific literature with knowledge graphs. Bibliothek Forschung und Praxis 44(3), 516–529 (2020)
- [6] Bae, Y.S., Kim, K.H., Choi, S.W., Ko, T., Jeong, C.W., Cho, B., Kim, M.S., Kang, E.: Information technology–based management of clinically healthy covid-19 patients: lessons from a living and treatment support center operated by seoul national university hospital. Journal of medical Internet research 22(6), e19938 (2020)
- [7] Barone, S., Chakhunashvili, A., Comelli, A.: Building a statistical surveillance dashboard for covid-19 infection worldwide. Quality Engineering 32(4), 754–763 (2020)
- [8] Bornmann, L., Haunschild, R., Mutz, R.: Growth rates of modern science: a latent piecewise growth curve approach to model publication numbers from established and new literature databases. Humanities and Social Sciences Communications 8(1), 1–15 (2021)
- [9] Carroll, R., Prentice, C.R.: Using spatial and temporal modeling to visualize the effects of us state issued stay at home orders on covid-19. Scientific Reports 11(1), 13939 (2021)
- [10] Chande, A., Lee, S., Harris, M., Nguyen, Q., Beckett, S.J., Hilley, T., Andris, C., Weitz, J.S.: Real-time, interactive website for us-county-level covid-19 event risk assessment. Nature human behaviour 4(12), 1313–1319 (2020)
- [11] Chauhan, R., Goel, P., Kumar, V., Soni, N., et al.: Understanding covid-19 using data visualization. In: 2021 international conference on advance computing and innovative technologies in engineering (ICACITE). pp. 555–559. IEEE (2021)
- [12] Chung, H.W., Hou, L., Longpre, S., Zoph, B., Tay, Y., Fedus, W., Li, E., Wang, X., Dehghani, M., Brahma, S., et al.: Scaling instruction-finetuned language models. arXiv preprint arXiv:2210.11416 (2022)
- [13] Clement, F., Kaur, A., Sedghi, M., Krishnaswamy, D., Punithakumar, K.: Interactive data driven visualization for covid-19 with trends, analytics and forecasting. In: 2020 24th International Conference Information Visualisation (IV). pp. 593–598. IEEE (2020)
- [14] Marques da Costa, N., Mileu, N., Alves, A.: Dashboard comprime_compri_mov: Multiscalar spatio-temporal monitoring of the covid-19 pandemic in portugal. Future Internet 13(2), 45 (2021)
- [15] Dixon, B.E., Grannis, S.J., McAndrews, C., Broyles, A.A., Mikels-Carrasco, W., Wiensch, A., Williams, J.L., Tachinardi, U., Embi, P.J.: Leveraging data visualization and a statewide health information exchange to support covid-19 surveillance and response: application of public health informatics. Journal of the American Medical Informatics Association 28(7), 1363–1373 (2021)
- [16] Ermakova, L., Bordignon, F., Turenne, N., Noel, M.: Is the abstract a mere teaser? evaluating generosity of article abstracts in the environmental sciences. Frontiers in Research Metrics and Analytics 3, 16 (2018)
- [17] Florez, H., Singh, S.: Online dashboard and data analysis approach for assessing covid-19 case and death data. F1000Research 9 (2020)
- [18] Fontelo, P., Gavino, A., Sarmiento, R.F.: Comparing data accuracy between structured abstracts and full-text journal articles: implications in their use for informing clinical decisions. BMJ Evidence-Based Medicine 18(6), 207–211 (2013)
- [19] Fortunato, S., Bergstrom, C.T., Börner, K., Evans, J.A., Helbing, D., Milojević, S., Petersen, A.M., Radicchi, F., Sinatra, R., Uzzi, B., et al.: Science of science. Science 359(6379), eaao0185 (2018)
- [20] Gordis, L.: Epidemiology e-book. Elsevier Health Sciences (2013)
- [21] Hodgson, L.E., Leckie, T., Hunter, A., Prinsloo, N., Venn, R., Forni, L.: Covid-19 recognition and digital risk stratification. Future Healthcare Journal 7(3), e47 (2020)
- [22] Hohl, A., Delmelle, E.M., Desjardins, M.R., Lan, Y.: Daily surveillance of covid-19 using the prospective space-time scan statistic in the united states. Spatial and spatio-temporal epidemiology 34, 100354 (2020)
- [23] Horbach, S.P.: Pandemic publishing: Medical journals strongly speed up their publication process for covid-19. Quantitative Science Studies 1(3), 1056–1067 (2020)
- [24] Hyman, M., Mark, C., Imteaj, A., Ghiaie, H., Rezapour, S., Sadri, A.M., Amini, M.H.: Data analytics to evaluate the impact of infectious disease on economy: Case study of covid-19 pandemic. Patterns 2(8) (2021)
- [25] Ibrahim, H., Sorrell, S., Nair, S.C., Al Romaithi, A., Al Mazrouei, S., Kamour, A.: Rapid development and utilization of a clinical intelligence dashboard for frontline clinicians to optimize critical resources during covid-19. Acta Informatica Medica 28(3), 209 (2020)
- [26] Khodaveisi, T., Dehdarirad, H., Bouraghi, H., Mohammadpour, A., Sajadi, F., Hosseiniravandi, M.: Characteristics and specifications of dashboards developed for the covid-19 pandemic: a scoping review. Journal of Public Health pp. 1–22 (2023)
- [27] Lezhnina, O., Kismihók, G., Prinz, M., Stocker, M., Auer, S.: A scholarly knowledge graph-powered dashboard: Implementation and user evaluation. Frontiers in Research Metrics and Analytics 7, 934930 (2022)
- [28] Longpre, S., Hou, L., Vu, T., Webson, A., Chung, H.W., Tay, Y., Zhou, D., Le, Q.V., Zoph, B., Wei, J., et al.: The flan collection: Designing data and methods for effective instruction tuning. arXiv preprint arXiv:2301.13688 (2023)
- [29] Marivate, V., Combrink, H.M.: Use of available data to inform the covid-19 outbreak in south africa: a case study. arXiv preprint arXiv:2004.04813 (2020)
- [30] Oelen, A., D’Souza, J., Stocker, M., Vogt, L., Farfar, K.E., Haris, M., Fadel, K., Jaradeh, M.Y., Wiens, V.: Covid-19 reproductive number estimates (2020). https://doi.org/10.48366/R44930, https://www.orkg.org/orkg/comparison/R44930
- [31] Oelen, A., Jaradeh, M.Y., Farfar, K.E., Stocker, M., Auer, S.: Comparing research contributions in a scholarly knowledge graph. In: CEUR workshop proceedings; 2526. vol. 2526, pp. 21–26. Aachen: RWTH Aachen (2019)
- [32] Oelen, A., Stocker, M., Auer, S.: Smartreviews: towards human-and machine-actionable reviews. In: Linking Theory and Practice of Digital Libraries: 25th International Conference on Theory and Practice of Digital Libraries, TPDL 2021, Virtual Event, September 13–17, 2021, Proceedings 25. pp. 181–186. Springer (2021)
- [33] Pathak, I., Choi, Y., Jiao, D., Yeung, D., Liu, L.: Racial-ethnic disparities in case fatality ratio narrowed after age standardization: A call for race-ethnicity-specific age distributions in state covid-19 data. MedRxiv (2020)
- [34] Peddireddy, A.S., Xie, D., Patil, P., Wilson, M.L., Machi, D., Venkatramanan, S., Klahn, B., Porebski, P., Bhattacharya, P., Dumbre, S., et al.: From 5vs to 6cs: Operationalizing epidemic data management with covid-19 surveillance. In: 2020 IEEE International Conference on Big Data (Big Data). pp. 1380–1387. IEEE (2020)
- [35] Pride, D., Cancellieri, M., Knoth, P.: Core-gpt: Combining open access research and large language models for credible, trustworthy question answering. In: International Conference on Theory and Practice of Digital Libraries. pp. 146–159. Springer (2023)
- [36] Raffel, C., Shazeer, N., Roberts, A., Lee, K., Narang, S., Matena, M., Zhou, Y., Li, W., Liu, P.J.: Exploring the limits of transfer learning with a unified text-to-text transformer. The Journal of Machine Learning Research 21(1), 5485–5551 (2020)
- [37] Raj, P., Kumar, C., Rawat, M.: Automatic retrieval of updated information related to covid-19 from web portals. European Journal of Molecular and Clinical Medicine pp. 5130–5136 (2020)
- [38] Ravinder, R., Singh, S., Bishnoi, S., Jan, A., Sharma, A., Kodamana, H., Krishnan, N.A.: An adaptive, interacting, cluster-based model for predicting the transmission dynamics of covid-19. Heliyon 6(12) (2020)
- [39] Salehi, M., Arashi, M., Bekker, A., Ferreira, J., Chen, D.G., Esmaeili, F., Frances, M.: A synergetic r-shiny portal for modeling and tracking of covid-19 data. Frontiers in public health 8, 623624 (2021)
- [40] Santhanavanich, T., Kim, C., Coors, V.: Integration of heterogeneous coronavirus disease covid-19 data sources using ogc sensorthings api. ISPRS Annals of the Photogrammetry, Remote Sensing and Spatial Information Sciences 6, 135–141 (2020)
- [41] Santos, H., Dantas, V., Furtado, V., Pinheiro, P., McGuinness, D.L.: From data to city indicators: A knowledge graph for supporting automatic generation of dashboards. In: The Semantic Web: 14th International Conference, ESWC 2017, Portorož, Slovenia, May 28–June 1, 2017, Proceedings, Part II 14. pp. 94–108. Springer (2017)
- [42] Santos, H., Dantas, V., Furtado, V., Pinheiro, P., McGuinness, D.L.: From data to city indicators: A knowledge graph for supporting automatic generation of dashboards. In: The Semantic Web: 14th International Conference, ESWC 2017, Portorož, Slovenia, May 28–June 1, 2017, Proceedings, Part II 14. pp. 94–108. Springer (2017)
- [43] Ulahannan, J.P., Narayanan, N., Thalhath, N., Prabhakaran, P., Chaliyeduth, S., Suresh, S.P., Mohammed, M., Rajeevan, E., Joseph, S., Balakrishnan, A., et al.: A citizen science initiative for open data and visualization of covid-19 outbreak in kerala, india. Journal of the American Medical Informatics Association 27(12), 1913–1920 (2020)
- [44] Wei, J., Bosma, M., Zhao, V.Y., Guu, K., Yu, A.W., Lester, B., Du, N., Dai, A.M., Le, Q.V.: Finetuned language models are zero-shot learners. arXiv preprint arXiv:2109.01652 (2021)
- [45] Wissel, B.D., Van Camp, P., Kouril, M., Weis, C., Glauser, T.A., White, P.S., Kohane, I.S., Dexheimer, J.W.: An interactive online dashboard for tracking covid-19 in us counties, cities, and states in real time. Journal of the American Medical Informatics Association 27(7), 1121–1125 (2020)
- [46] Yang, D.H., Chien, T.W., Yeh, Y.T., Yang, T.Y., Chou, W., Lin, J.K.: Using the absolute advantage coefficient (aac) to measure the strength of damage hit by covid-19 in india on a growth-share matrix. European Journal of Medical Research 26(1), 1–11 (2021)
- [47] Zhu, Z., Meng, K., Caraballo, J., Jaradat, I., Shi, X., Zhang, Z., Akrami, F., Liao, H., Arslan, F., Jimenez, D., et al.: A dashboard for mitigating the covid-19 misinfodemic. In: Proceedings of the 16th Conference of the European Chapter of the Association for Computational Linguistics: System Demonstrations (2021)