Observation of the antiferromagnetic phase transition in the fermionic Hubbard model
Abstract
The fermionic Hubbard model (FHM)Hubbard (1963), despite its simple form, captures essential features of strongly correlated electron physics. Ultracold fermions in optical latticesEsslinger (2010); Bohrdt et al. (2021) provide a clean and well-controlled platform for simulating FHM. Doping its antiferromagnetic ground state at half filling, various exotic phases are expected to arise in the FHM simulator, including stripe orderZheng et al. (2017), pseudogapTimusk and Statt (1999), and -wave superconductorsXiang and Wu (2022), offering valuable insights into high-temperature superconductivityAnderson (1987); Scalapino et al. (1986); Lee et al. (2006). Although notable progress, such as the observation of antiferromagnetic correlations over shortHart et al. (2015) and extended distancesMazurenko et al. (2017), has been obtained, the antiferromagnetic phase has yet to be realized due to the significant challenges of achieving low temperatures in a large and uniform quantum simulator. Here, we report the observation of the antiferromagnetic phase transition in a three-dimensional fermionic Hubbard system comprising lithium-6 atoms in a uniform optical lattice with approximately 800,000 sites. When the interaction strength, temperature, and doping concentration are finely tuned to approach their respective critical values, sharp increases in the spin structure factor (SSF) are observed. These observations can be well described by a power-law divergence, with a critical exponent of 1.396 from the Heisenberg universality classCampostrini et al. (2002). At half filling and with optimal interaction strength, the measured SSF reaches 123(8), signifying the establishment of an antiferromagnetic phase. Our results set the stage for exploring the low-temperature phase diagram of FHM.
Introduction
The Hamiltonian of the fermionic Hubbard model (FHM) takes a simple form, essentially consisting of two terms: one for nearest-neighbor hopping and the other for the on-site interaction between electrons with opposite spins. The FHM is capable of describing a wide range of strongly correlated electron physicsArovas et al. (2022), including interaction-driven metal-to-insulator transitionJördens et al. (2008); Schneider et al. (2008), quantum magnetismAuerbach (1998), and unconventional superconductivityXiang and Wu (2022); Lee et al. (2006). However, despite sixty years of intensive studies, an accurate understanding of its low-temperature physics remains elusiveArovas et al. (2022); Qin et al. (2022). Exact analytical solutions are available only in one dimension (1D) or in the limit of infinite spatial dimensionsGiamarchi (2003); Georges et al. (1996). Although a broad variety of advanced numerical techniques have been developed, controlled quantitative studies are still scarce, particularly in the low-temperature regime. Quantum Monte Carlo (QMC) simulations typically suffer from the negative sign problem, while other methods, such as density matrix renormalization groupSchollwöck (2005), face limitations due to the exponential increase in computer memory requirements with system size. Even at half filling, simulations can become computationally prohibitive for sufficiently large systems at low temperaturesQin et al. (2022).
In the past two decades, the development of modern laser and atomic techniques has led to the experimental realization of the FHM with ultracold atoms in optical latticesEsslinger (2010); Gross and Bloch (2017). The precise control of Hamiltonian parameters has enabled these ultracold atomic systems to serve as powerful platforms for exploring the strongly correlated properties of FHM in low-temperature and doped regimes, which are not easily accessible through analytical and numerical methodsBohrdt et al. (2021). To achieve this goal, a crucial and unavoidable step is the realization of the Néel phase transition and the antiferromagnetic phase in the FHM. This requires reaching low temperatures, preparing large and homogeneous systems, and developing new probing techniques. Along these lines, many important advances have been achieved. In 3D, the realizations of both Mott and band insulating phasesJördens et al. (2008); Schneider et al. (2008), as well as the observation of short-range quantum magnetismGreif et al. (2013), have been reported. Notably, the spin structure factor (SSF) was observed to reach a value of at a temperature approximately higher than the Néel temperature , suggesting the occurrence of short-range antiferromagnetic correlationsHart et al. (2015). In 2D, the advent of fermionic quantum gas microscopesGross and Bloch (2017); Gross and Bakr (2021) has enabled the direct measurement of antiferromagnetic correlations as a function of distance across a square lattice of approximately 80 sitesMazurenko et al. (2017). At a temperature of , fitting the data with an exponentially decaying ansatz yielded a correlation length of , which approximately reaches the linear lattice size. Nonetheless, observation of critical phenomena, such as the power-law divergence of the SSF or the algebraic decay of the correlation function, has yet to be achieved as direct and conclusive evidence for the Néel phase transition.
In this work, we develop a large-scale quantum simulator for exploring the low-temperature physics of FHM by combining two key advancements: the generation of a low-temperature homogeneous Fermi gas in a box trap and the demonstration of a 3D flat-top optical lattice with uniform site potentials. At half filling, the Hamiltonian of the FHM exhibits symmetry, and, as the temperature decreases, it undergoes a transition to an antiferromagnetic Néel phase at the , with the symmetry spontaneously breaking. As a consequence, it is believed that this antiferromagnetic phase transition shares the same universality class as the 3D classical Heisenberg modelCampostrini et al. (2002), implying that the SSF should exhibit a divergent behavior, with and a critical exponent of . Away from half filling, the Néel temperature is significantly suppressed; nevertheless, the Heisenberg universality is expected to remain unchanged for small doping. We measure the SSF of the realized FH system as a function of the interaction strength, temperature, and doping concentration, employing spin-sensitive Bragg diffraction of lightHart et al. (2015). Indeed, we do observe the expected critical divergent phenomena both at and away from half filling, providing conclusive evidence for the realization of the antiferromagnetic phase transition. Our results, particularly those away from half filling, are difficult to address even with state-of-the-art numerical computations, highlighting the advantages of quantum simulation and opening the avenue for tackling fundamental problems in strongly correlated Fermi systemsNorman (2011); Keimer et al. (2015).
Experimental scheme and setup
To investigate quantum magnetism within 3D FHM using ultracold Fermi gases, two critical conditions must be satisfied. First, it is essential to establish a spatially uniform 3D optical lattice, ensuring that the nearest-neighbor hopping , on-site interaction , and chemical potential remain nearly constant throughout the entire system or, at the very least, across a large portion of it. Second, it is imperative to reduce the system temperature below the exchange energy for the establishment of long-range quantum magnetism. A common approach involves an initial preparation of degenerate Fermi gases using optical dipole traps, followed by slowly turning on the optical lattice potential. However, due to the nonuniform intensity distribution of the Gaussian laser beams, the resulting optical lattice potential also exhibits a Gaussian envelopeBloch et al. (2008). This leads to variations in , , and as a function of spatial coordinate , resulting in the coexistence of multiple phases throughout the entire system. For instance, even with a moderate average atom number per lattice site, the system forms a multi-shell structure, changing from a band insulator to a metal, then to a Mott insulator, and finally back to the metal as one moves from the inner region outwardHo and Zhou (2009). Moreover, the density distributions of Fermi gases in harmonic traps are inherently nonuniform, in contrast to the uniform density distributions of low- phases near half filling in the optical lattices. This leads to unavoidable heating effects due to the redistribution of the atomic density when loading Fermi gases into optical lattices. Additional compensating potentials have been employed to cancel out the underlying harmonic potential of the optical latticesHart et al. (2015); Mazurenko et al. (2017), effectively increasing the size of the uniform density region. Unfortunately, this approach does not rectifies the nonuniformity of and , nor does it mitigate the heating induced by density redistribution during the lattice loading.
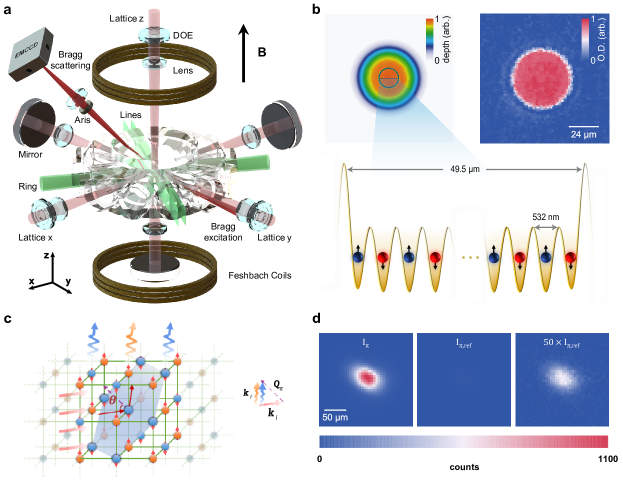
To overcome the aforementioned challenges, we present a novel approach that combines a box trap with a flat-top optical lattice (see Fig. 1). This method involves loading a low-temperature homogeneous Fermi gas into the central uniform region, which is isolated by box trapNavon et al. (2021); Li et al. (2022), within the flat-top optical lattice. Three key advantages are worth highlighting: (i) In the central region of the system, approximately m (equivalent to 93 lattice sites) in diameter, , , and are essentially independent of , despite the presence of residual potential disorder with a rms value of approximately 0.6%. (ii) The density distribution of the homogeneous Fermi gas closely resembles that of strongly correlated lattice systems near half filling, effectively suppresses the density redistribution when turning on the lattice potential, resulting in near-adiabatic lattice loading. (iii) The average single-particle entropy of a homogeneous Fermi gas is approximately half of that of a nonuniform Fermi gas confined in a harmonic trap with the same reduced temperature , enabling us to realize a 3D fermionic Hubbard (FH) system with very low single-particle entropyHo and Zhou (2009).
Our system consists of ultracold fermionic 6Li atoms, which are evenly populated among the hyperfine levels () and (), respectively. These atoms are confined within a cylindrical box trap with an inner diameter of 49.5 m and a height of 47.7 m at a magnetic field of 568 G, where the -wave scattering length . After devoting great technical efforts, we are able to prepare a non-interacting, homogeneous Fermi gas with a density of approximately (corresponding to half filling in the optical lattice) and a low temperature of 0.041(1), or, equivalently, a low initial single-particle entropy of , where is the Fermi temperature. Then, we gradually increase the lattice depth over a period of 18 ms to reach a final value of 6.25, resulting in a nearest-neighbor hopping of kHz. Here, kHz denotes the recoil energy, where is the Planck constant, represents the atomic mass, and nm is the lattice spacing. Simultaneously, we ramp up the magnetic field from 568 G to a predetermined final value within 12 ms, allowing us to achieve various on-site interactions using Feshbach resonance, with ranging from to kHz. In Fig. 1b, we show a representative in situ image of the realized low-temperature FH system, with and at half filling. It is observed that the atomic density distribution in the central region is highly uniform. In the vicinity of the system boundary, defined by the repulsive box potential with a finite width, the atomic density, or equivalently, lattice filling, experiences a rapid decrease over a distance of approximately 3 m. Utilizing available QMC dataHart et al. (2015) at and , along with the precise knowledge of the box trap potential, we employ the local density approximation (LDA) method to simulate the density distribution of atoms. The results suggest that approximately 68% of the lattice sites are precisely singly occupied in the system. Moreover, the on-site interaction , determined by the homogeneous lattice potential, remains nearly constant throughout the entire system.
To investigate the long-range antiferromagnetic order within the system, we employ the spin-sensitive coherent Bragg scattering technique, a method similar to that used in previous workHart et al. (2015), as illustrated in Fig. 1c. The incident Bragg photons, which are sensitive to spins and characterized by the wave vector , experience precisely opposite phase shifts when scattered by two different spin states. Hence, when the Bragg condition is fulfilled, , with representing a reciprocal lattice vector of the magnetic sublattice, the emitted photons with the wave vector undergo constructive interference, leading to a coherent enhancement of the Bragg signalCorcovilos et al. (2010) :
| (1) |
where and are the dimensionless detuning and the on-resonance saturation parameter of the Bragg laser, respectively. Before the measurement, we linearly increase the lattice depth from to in 100 s to pin the optical lattice and greatly enhance the Debye-Waller factor . Subsequently, a 1.5 s Bragg pulse with and is applied, and the scattered photons in the direction, within a full collection solid angle of sr, are captured by an EMCCD. An additional reference image, denoted as , is acquired by turning off the optical lattice at 20 and allowing a 50 s time-of-flight, during which the Debye-Waller factor approaches zero. These measurements enable us to access the spin structure factor , a crucial quantity for characterizing the long-range antiferromagnetic orderCorcovilos et al. (2010):
| (2) | ||||
where represents the total number of atoms. Here, the subscripts and denote lattice sites, is a spin- operator along the spin- axis, and is the site vector. The prefactor can be determined accurately. The obtained single-shot images are presented in Fig. 1d, revealing that the Bragg signal’s intensity is approximately one hundred times greater than that of the reference signal. This substantial increase signifies the successful establishment of a long-range antiferromagnetic order in the system.
Experimental results
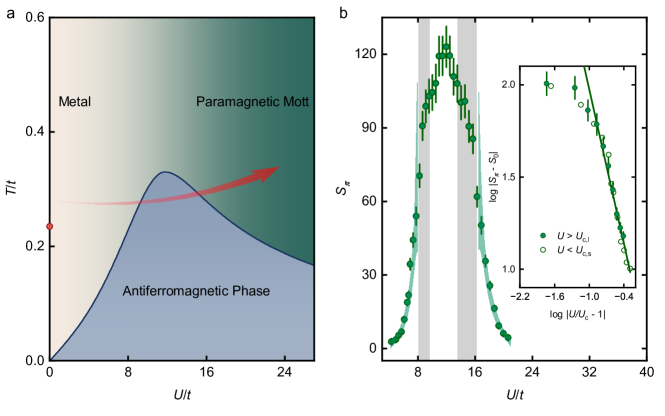
We start with the half-filling case, where the physics of the FHM is well understoodStaudt et al. (2000); Kozik et al. (2013). As illustrated in Fig. 2a, for small values of , the system above behaves as a metallic paramagnet, and the Néel transition arises from a spin-density wave (SDW) instability with a small modulation of sublattice magnetizationHirsch (1987). The mean-field theory predicts an exponentially small Néel temperature , where represents the density of states at the Fermi surfaceHirsch (1987). At strong interaction strengths, the paramagnet above evolves into a Mott insulator. The low-energy sector of the FH Hamiltonian reduces to the Heisenberg model, and the antiferromagnetic phase transition occurs atDomb (2000) . Between these two limiting branches lies a smooth crossover region, where reaches its maximum, denoted as , at an optimal . While the dynamical mean-field theoryGeorges et al. (1996) suggests at , numerical simulations indicate a lower valueKozik et al. (2013); Qin et al. (2022), , within the range of . Note that, we depict at a higher on-site interaction of in Fig. 2a for two reasons: First, near the system boundary, the atomic density becomes suppressed and deviates from half filling, which is more pronounced for smaller values of . Consequently, due to the sensitivity of the SDW instability on the Fermi surface, it is expected that the for the small- branch will be reduced. Second, the residual disorder in the lattice potentialPaiva et al. (2015), characterized by a randomness strength , results in a modified exchange energyDuan et al. (2003) . This might lead to a slight increase in for the Heisenberg branch. Therefore, the optimal is expected to be larger than the numerical estimate.
To explore the phase diagram, we prepare the half-filled FH system with various on-site interactions. At , the lowest attainable temperature, , can be calculated by assuming an adiabatic evolution from the homogeneous Fermi gas to the FH system (red dot in Fig. 2a). However, due to the non-adiabatic nature of the lattice loading, a slight temperature increment of approximately 20% is observed. As increases, the thermometry of the FH system becomes extremely challenging. Therefore, the temperature dependence on can only be estimated, as indicated by the red arrow in Fig. 2a. The measured SSF as a function of on-site interactions is displayed in Fig. 2b. Starting with a small value of at , the SSF increases smoothly as increases until reaching . It then enters into a sharp increase until , and finally slows down and reaches a maximal average value at . Notably, in a single measurement, can even be observed due to critical fluctuations. When is further increased, becomes suppressed, undergoes a rapid drop around , and then decreases to at . The curve of is roughly symmetric around .
The antiferromagnetic phase transition in the half-filled FHM can be classified into the universality class of the 3D Heisenberg model, owing to the inherent symmetry in its HamiltonianCampostrini et al. (2002). Consequently, as an infinitely large and fully equilibrated FH system approaches the critical point, the correlation length increases as , and the SSF diverges as , with and being the universal critical exponentsCampostrini et al. (2002). The symbol represents the proximity to the critical point in the parameter space of interaction, temperature, and atomic density. We find that the data for and are well captured by , where denotes the background contribution. The determined Néel transition points are and for the small- and large- branches, respectively, with being fixed. The inset of Fig. 2b clearly demonstrates the scaling phenomenon, where the data coincide with a straight line having a slope of , signifying the power-law divergence. Remarkably, the data for the small- and large- branches collapse approximately onto a single curve, providing a direct illustration for the universality.
In practical scenarios, it is anticipated that the correlation length will eventually saturate at a finite . This saturation is likely to occur on a scale smaller than the linear system size, primarily for the following reasons. As the critical point is approached, following the Kibble-Zurek mechanism, the relaxation time diverges as , with the dynamic exponent , making it challenging for the system to reach equilibrium. Additionally, the experimental system is susceptible to imperfections. The atomic density is suppressed near the boundary, leading to a deviation from half filling. Furthermore, even with a small strength, the residual disorder in the lattice potential significantly reduces the correlation length. As a result, the divergence of the SSF is attenuated and saturated at , as manifested by the crest curve within the range . Moreover, the obtained SSF, which is an average of around in the Brillouin zone, is significantly lower than the actual SSF of the system. This discrepancy is especially pronounced in the antiferromagnetic phase, where approximates a delta function centered at . Therefore, even a slight momentum mismatch in the Bragg scattering measurement would result in a dramatic decrease in the measured value.
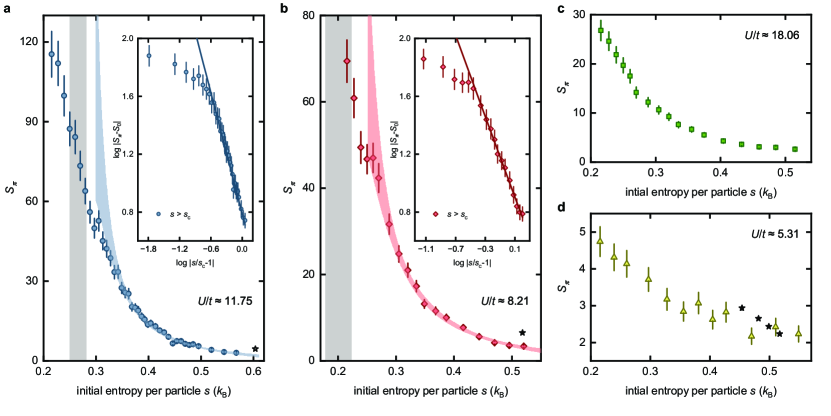
We then measure as a function of temperature and present the results in Fig. 3a-d for , , , and , respectively. It is worth noting that, instead of using the temperature of the FH system, we employ the initial entropy per particle , determined from the non-interacting, homogeneous Fermi gas. This choice is necessitated by the extremely difficulty in accurately measuring temperature in the low-entropy regime of the FH system. Fortunately, as long as exhibits a smooth dependence on , the critical divergence is expected to remain unchanged, as clearly evidenced in Figs. 3a and b. For and , the power-law fit yields a critical entropy of . Similarly, for and , the fitting results in . In contrast, for the critical scaling appears to be relatively weak, indicating that our system is in proximity to but has not yet reached the Néel transition. Finally, for , the critical scaling is hardly discernible, suggesting that would occur at a significantly lower temperature.
With the measured potential shape of the box trap, initial entropy per particle, and the QMC dataHart et al. (2015), we apply the LDA to calculate the values. It is important to note that QMC data are not available for strong interaction strengths and low temperatures, especially away from half filling. Therefore, LDA results are only obtained at high temperatures and for , , and , which are represented by the black stars in Figs. 3a, b, and d. For , the LDA values of agree well with the experimental measurements. However, for and , the numerical calculations are approximately 20% greater than the experimental results. While the measured are indeed lower than their actual values, there are two additional reasons contributing to the numerical-experimental discrepancies: (i) The entropy per particle of the FH system is slightly higher than that of the homogeneous Fermi gas (i.e., ), due to the inherent non-adiabaticity during the lattice loading. (ii) The numerical calculations have not taken into account the residual disorder in the lattice potential.
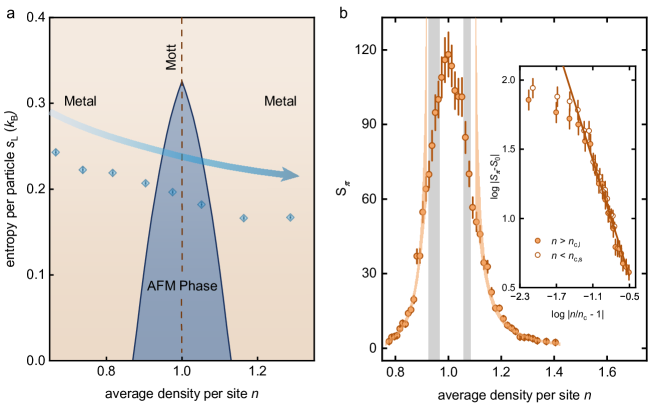
We now consider the 3D FH model away from half filling. In the doped regime, simulation time of QMC increases exponentially with system size and inverse temperature, primarily due to the fermionic sign problem, leaving little conclusive knowledge available. Nevertheless, second-order perturbation theory suggests that, at a fixed , the Néel temperature is significantly reduced by doping. Recently, state-of-the-art theoretical calculations using the dynamical vertex approximation (DA)Schäfer et al. (2017) or diagrammatic Monte CarloLenihan et al. (2022) predict that with 10%-20% doping, reaches zero at a quantum critical point (QCP)Schäfer et al. (2017). Furthermore, even at doping levels of 5%-15%, the ground state transitions from an antiferromagnet to an incommensurate SDW state, mainly driven by the doping-induced deformation of the Fermi surface. The transition is considered to be in the 3D Heisenberg universality class for small doping, but it remains largely unknown for large doping, where several closely competing low-energy states may exist, and the QCP can play an essential roleSchäfer et al. (2017).
In the experiment, we prepare the FH system at the optimal and lowest temperature, where reaches its maximal value at half filling. The phase diagram is depicted in Fig.4a, where the vertical axis represents the entropy per particle of the FH system. The blue dots and the thick arrow represent the measured and the estimated as a function of the average density per lattice site , respectively, where corresponds to half filling. The discrepancy between and indicates a non-adiabatic increase in entropy. The experimental results for are displayed in Fig.4b as a function of , clearly showing sharp increases or decreases near the critical points. The power-law scaling function , with , fits the experimental data well for or , resulting in critical values of and , respectively. Furthermore, in the log-log plot, similar to the case of varying interaction strength or temperature, the data points for or collapse onto a solid line with a slope of . While our experimental data are not sufficient to provide a precise determination of the magnetic critical exponent , the quality of the fit suggests consistency with the 3D Heisenberg universality.
Outlook
We have developed an advanced quantum simulation platform for the 3D FHM by first preparing a low-temperature homogeneous Fermi gas in a box trap and then adiabatically loading it into a 3D optical lattice with uniform site potentials. This approach ensures nearly uniform on-site interaction and nearest-neighbor hopping across the lattice, which consists of approximately 800,000 sites and operates at a temperature well below . We have observed the critical divergences in the SSF, which is smoking-gun evidence of the antiferromagnetic phase transition. Our setup offers great promise for exploring the low-temperature and doped physics of FHMKeimer et al. (2015). It enables us to observe and investigate exotic quantum phases in 3D or quasi-2D by tuning the interlayer coupling strengths. Examples include spin-charge separationVijayan et al. (2020); Senaratne et al. (2022) in higher dimensions, pseudogapTimusk and Statt (1999) in repulsive settings, and stripe orderZheng et al. (2017) at specific fillings, by utilizing techniques such as spin-sensitive Bragg diffraction of lightHart et al. (2015), momentum-resolved microwave spectroscopyLi et al. (2024); Stewart et al. (2008), and Bragg scattering in the long-wavelength limitLi et al. (2022); Senaratne et al. (2022). Moreover, by adding optical superlattices to the setup, we can realize coupled plaquette arrays and explore the possible -wave pairing thereinYing et al. (2014). These quantum simulations will provide valuable experimental data, enhancing our understanding on the role of quantum magnetism in the mechanism of high-temperature superconductivity. Furthermore, by tuning the atomic interactions to be attractive, we aim to realize the long-sought single-band superfluid in the attractive FHMHofstetter et al. (2002); Hartke et al. (2023) and explore the underlying physics of the BCS-BEC crossoverChen et al. (2005); Zwerger (2011) within a lattice context.
We thank J.-P. Hu, J. Schmiedmayer, Y. Qi, Y.-Y. He, and Q.-J. Chen for discussions. This work is supported by the Innovation Program for Quantum Science and Technology (Grant No. 2021ZD0301900), NSFC of China (Grant No. 11874340), the Chinese Academy of Sciences (CAS), the Anhui Initiative in Quantum Information Technologies, the Shanghai Municipal Science and Technology Major Project (Grant No.2019SHZDZX01), and the New Cornerstone Science Foundation.
References
- Hubbard (1963) J. Hubbard, Proc. R. Soc. Lond. A 276, 238 (1963).
- Esslinger (2010) T. Esslinger, Annu. Rev. Condens. Matter Phys. 1, 129 (2010).
- Bohrdt et al. (2021) A. Bohrdt, L. Homeier, C. Reinmoser, E. Demler, and F. Grusdt, Ann. Phys. 435, 168651 (2021).
- Zheng et al. (2017) B. X. Zheng, C. M. Chung, P. Corboz, G. Ehlers, M. P. Qin, R. M. Noack, H. Shi, S. R. White, S. Zhang, and G. K. L. Chan, Science 358, 1155 (2017).
- Timusk and Statt (1999) T. Timusk and B. Statt, Rep. Prog. Phys. 62, 61 (1999).
- Xiang and Wu (2022) T. Xiang and C. Wu, D-wave Superconductivity (Cambridge University Press, 2022).
- Anderson (1987) P. W. Anderson, Science 235, 1196 (1987).
- Scalapino et al. (1986) D. J. Scalapino, E. Loh, and J. E. Hirsch, Phys. Rev. B 34, 8190 (1986).
- Lee et al. (2006) P. A. Lee, N. Nagaosa, and X.-G. Wen, Rev. Mod. Phys. 78, 17 (2006).
- Hart et al. (2015) R. A. Hart, P. M. Duarte, T.-L. Yang, X. Liu, T. Paiva, E. Khatami, R. T. Scalettar, N. Trivedi, D. A. Huse, and R. G. Hulet, Nature 519, 211 (2015).
- Mazurenko et al. (2017) A. Mazurenko, C. S. Chiu, G. Ji, M. F. Parsons, M. Kanász-Nagy, R. Schmidt, F. Grusdt, E. Demler, D. Greif, and M. Greiner, Nature 545, 462 (2017).
- Campostrini et al. (2002) M. Campostrini, M. Hasenbusch, A. Pelissetto, P. Rossi, and E. Vicari, Phys. Rev. B 65, 144520 (2002).
- Arovas et al. (2022) D. P. Arovas, E. Berg, S. A. Kivelson, and S. Raghu, Annu. Rev. Condens. Matter Phys. 13, 239 (2022).
- Jördens et al. (2008) R. Jördens, N. Strohmaier, K. Günter, H. Moritz, and T. Esslinger, Nature 455, 204 (2008).
- Schneider et al. (2008) U. Schneider, L. Hackermüller, S. Will, T. Best, I. Bloch, T. A. Costi, R. W. Helmes, D. Rasch, and A. Rosch, Science 322, 1520 (2008).
- Auerbach (1998) A. Auerbach, Interacting electrons and quantum magnetism (Springer Science & Business Media, 1998).
- Qin et al. (2022) M. Qin, T. Schäfer, S. Andergassen, P. Corboz, and E. Gull, Annu. Rev. Condens. Matter Phys. 13, 275 (2022).
- Giamarchi (2003) T. Giamarchi, Quantum physics in one dimension, Vol. 121 (Clarendon press, 2003).
- Georges et al. (1996) A. Georges, G. Kotliar, W. Krauth, and M. J. Rozenberg, Rev. Mod. Phys. 68, 13 (1996).
- Schollwöck (2005) U. Schollwöck, Rev. Mod. Phys. 77, 259 (2005).
- Gross and Bloch (2017) C. Gross and I. Bloch, Science 357, 995 (2017).
- Greif et al. (2013) D. Greif, T. Uehlinger, G. Jotzu, L. Tarruell, and T. Esslinger, Science 340, 1307 (2013).
- Gross and Bakr (2021) C. Gross and W. S. Bakr, Nat. Phys. 17, 1316 (2021).
- Norman (2011) M. R. Norman, Science 332, 196 (2011).
- Keimer et al. (2015) B. Keimer, S. A. Kivelson, M. R. Norman, S. Uchida, and J. Zaanen, Nature 518, 179 (2015).
- Bloch et al. (2008) I. Bloch, J. Dalibard, and W. Zwerger, Rev. Mod. Phys. 80, 885 (2008).
- Ho and Zhou (2009) T.-L. Ho and Q. Zhou, Proc. Natl. Acad. Sci. 106, 6916 (2009).
- Navon et al. (2021) N. Navon, R. P. Smith, and Z. Hadzibabic, Nat. Phys. 17, 1334 (2021).
- Li et al. (2022) X. Li, X. Luo, S. Wang, K. Xie, X.-P. Liu, H. Hu, Y.-A. Chen, X.-C. Yao, and J.-W. Pan, Science 375, 528 (2022).
- Corcovilos et al. (2010) T. A. Corcovilos, S. K. Baur, J. M. Hitchcock, E. J. Mueller, and R. G. Hulet, Phys. Rev. A 81, 013415 (2010).
- Staudt et al. (2000) R. Staudt, M. Dzierzawa, and A. Muramatsu, Eur. Phys. J. B 17, 411 (2000).
- Kozik et al. (2013) E. Kozik, E. Burovski, V. W. Scarola, and M. Troyer, Phys. Rev. B 87, 205102 (2013).
- Hirsch (1987) J. E. Hirsch, Phys. Rev. B 35, 1851 (1987).
- Domb (2000) C. Domb, Phase transitions and critical phenomena (Elsevier, 2000).
- Paiva et al. (2015) T. Paiva, E. Khatami, S. Yang, V. Rousseau, M. Jarrell, J. Moreno, R. G. Hulet, and R. T. Scalettar, Phys. Rev. Lett. 115, 240402 (2015).
- Duan et al. (2003) L.-M. Duan, E. Demler, and M. D. Lukin, Phys. Rev. Lett. 91, 090402 (2003).
- Schäfer et al. (2017) T. Schäfer, A. A. Katanin, K. Held, and A. Toschi, Phys. Rev. Lett. 119, 046402 (2017).
- Lenihan et al. (2022) C. Lenihan, A. J. Kim, F. Šimkovic, and E. Kozik, Phys. Rev. Lett. 129, 107202 (2022).
- Vijayan et al. (2020) J. Vijayan, P. Sompet, G. Salomon, J. Koepsell, S. Hirthe, A. Bohrdt, F. Grusdt, I. Bloch, and C. Gross, Science 367, 186 (2020).
- Senaratne et al. (2022) R. Senaratne, D. Cavazos-Cavazos, S. Wang, F. He, Y.-T. Chang, A. Kafle, H. Pu, X.-W. Guan, and R. G. Hulet, Science 376, 1305 (2022).
- Li et al. (2024) X. Li, S. Wang, X. Luo, Y.-Y. Zhou, K. Xie, H.-C. Shen, Y.-Z. Nie, Q. Chen, H. Hu, Y.-A. Chen, X.-C. Yao, and J.-W. Pan, Nature 626, 288 (2024).
- Stewart et al. (2008) J. Stewart, J. Gaebler, and D. Jin, Nature 454, 744 (2008).
- Ying et al. (2014) T. Ying, R. Mondaini, X. D. Sun, T. Paiva, R. M. Fye, and R. T. Scalettar, Phys. Rev. B 90, 075121 (2014).
- Hofstetter et al. (2002) W. Hofstetter, J. I. Cirac, P. Zoller, E. Demler, and M. D. Lukin, Phys. Rev. Lett. 89, 220407 (2002).
- Hartke et al. (2023) T. Hartke, B. Oreg, C. Turnbaugh, N. Jia, and M. Zwierlein, Science 381, 82 (2023).
- Chen et al. (2005) Q. Chen, J. Stajic, S. Tan, and K. Levin, Phys. Rep. 412, 1 (2005).
- Zwerger (2011) W. Zwerger, The BCS-BEC Crossover and the Unitary Fermi Gas, Vol. 836 (Springer Science & Business Media, 2011).