The influence of silicon on the formation and transformation of corrosion products
Fabio E. Furcas, Shishir Mundra, Barbara Lothenbach, Camelia N. Borca, Thomas Huthwelker, Ueli M. Angst
Institute for Building Materials, ETH Zürich, 8093, Zürich, Switzerland
Empa Concrete & Asphalt Labortory, 8600 Dübendorf, Switzerland
Swiss Light Source, Paul Scherrer Institut, 5232 Villigen, Switzerland
Corresponding author: uangst@ethz.ch
Abstract
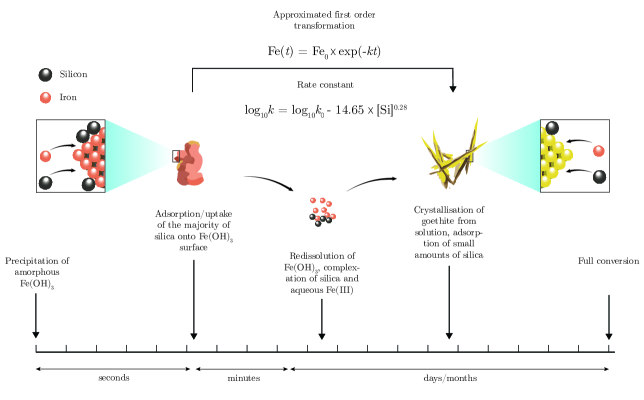
Accurate model predictions of corrosion-driven damage in reinforced concrete structures necessitate a comprehensive understanding of the rate of corrosion product formation. Here, we investigate the influence of dissolved \chSi characteristic of cementitious systems on the rate of corrosion product transformation at alkaline pH. Compared to systems aged in the absence of \chSi, small amounts of \chSi retard the formation rate of the thermodynamically stable corrosion product goethite by a factor of 10. The estimated first order rate constant of transformation decreases exponentially as a function of the dissolved \chSi concentration and follows the progression . Findings further suggest that the observed retardation is primarily due to the formation of a mobile aqueous \chFe-\chSi complex. The concentration of Si in cementitious systems has a crucial influence, and additional research is required to fully incorporate this factor into reactive transport models, ultimately essential for accurate service life predictions.
1 Introduction
Corrosion of steel in concrete is widely recognised as one of the main causes for the structural degradation of reinforced concrete structures1.
Apart from the corrosion process itself and the reduction in the reinforcement cross-sectional area, the dissolution of iron at the steel-concrete interface may lead to the precipitation of corrosion products in the concrete pore network. Over time, the formation of these iron (hydr)oxide phases can generate internal stresses leading to cracks, spalling of the concrete cover, ingress of chlorides, carbonates and moisture2, thus rendering the degradation process self-sustaining. Within this vicious cycle, both the concrete pore solution chemistry as well as the type of corrosion products formed play a crucial role.
Over the course of the last decades, the formation of iron (hydr)oxide phases in aqueous electrolytes has been researched extensively in the fields of soil 3, 4 and environmental science5, 6. Whilst the majority of studies published focused on their stability at mildly acidic to mildly alkaline pH, selected publications investigated the transformation of corrosion products in mill raffinates7, air pollution control residues 8 and other highly alkaline systems 9. In comparison, comparatively little research has been devoted to the formation of corrosion products in highly alkaline environments and in the presence of other solutes commonly encountered in cementitious systems. In an attempt to forecast the corrosion performance of traditional, highly alkaline binders including Portland cement and facilitate the development and usage of alternative, environmentally benign cementitious materials, a more thorough scientific understanding about the formation of corrosion products in aqueous electrolytes characteristic to these systems must be established 10.
1.1 Some corrosion products are more expansive than others
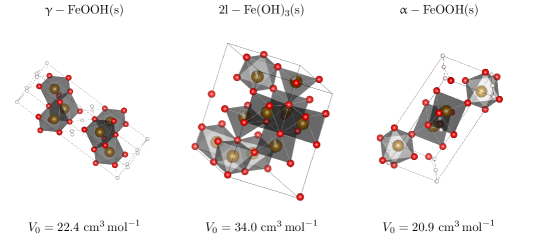
Depending on the crystal structure and the bulk chemical composition, some iron (hydr)oxides have significantly larger specific molar volumes than others. Polymorphs of the \chFeOOH type generally feature a small specific molar volume, ranging from 20.9 for goethite () to approximately 25.5 for akaganéite () 11, 12. Amorphous iron hydroxides including 2- and 6-line ferrihydrite () feature a of up to 34.0 13 and are thus almost 5 times as voluminous as crystalline \chFe^0 ( )14. From a concrete durability viewpoint, the formation of either of these comparatively small \chFeOOH polymorphs is favourable, as the magnitude of internal stresses generated is expected to be lower.
1.2 The influence of the pore solution chemistry
The rate and mechanism of corrosion product formation and transformation is heavily dependent on both the pH and the presence of pore solution constituents other than aqueous \chFe. 2-line ferrihydrite, the most soluble iron hydroxide often preceding the formation of more crystalline iron phases15, has been observed to exclusively transform to goethite () at pH > 1316, i.e. characteristic to the pore solution of the majority of uncarbonated Portland cement based binders17, 18, 19. At lower pH values (pH = 9 to 11), as typical for the pore solution of carbonated concrete 20, MgO-based cements 21 and MSH 22, 2-line ferrihydrite transforms into mixtures of hematite () and goethite5. As the overall process is rate-limited by the dissolution of 2-line ferrihydrite, transformation rates are greatly accelerated the higher the degree of alkalinity 23.
Other ionic species including sulphates, carbonates and silicon have been reported to retard phase transformation or completely alter the type(s) of iron (hydr)oxide(s) stabilised. Amongst all ionic constituents commonly encountered in the pore solution of cementitious systems, silicon arguably plays the largest role. Small amounts of \chSi in the orders of M are characteristic for the pore solution of a diverse landscape of cementitious systems including CEM I17, 18, CEM I with additions of calcium sulfoaluminates19, fly-ash24, 25, 26, blast-furnace slag26, silica fume26, 27, 28, metakaolin28 or CEMIII/B with nanosilica29. At pH 13, \chSi retards the dissolution of 2-line ferrihydrite and readily adsorbs onto goethite 15, 30. Schulz et al. 31 show that the Fe(II)-catalysed transformation of 2-line ferrihydrite and lepidocrocite () to goethite and magnetite () is inhibited in the presence of silicate at neutral pH. Other studies evidence the formation of aqueous \chFe-\chSi complexes32, that could influence total aqueous iron concentration.
This paper investigates the effect of dissolved silicon on the formation of corrosion products at alkaline pH . A combination of X-ray diffraction (XRD) and X-ray absorption spectroscopy (XAS) measurements is used to determine the type and formation rate of iron (hydr)oxide phases aged in the presence of 0.1 and 0.5 mM \chNa2SiO3. Aqueous \chFe and \chSi concentration measurements determined via inductively coupled plasma optical emission spectroscopy (ICP-OES) provide further insights into the likely mechanism of corrosion product transformation, the effect of silicon on the dissolution and re-precipitation of solid phases involved and the formation of aqueous \chFe-\chSi complexes. In combination with the results of a previous study investigating the rate of corrosion product transformation in the absence of silicon, we derive a semi-empirical relationship that quantifies the estimated first-order rate constant of transformation as a function of the aqueous \chSi concentration. Findings can be used to calculate the rate of iron (hydr)oxide formation across a broad range of cementitious systems. This study is intended to serve as a base-case for future investigations into the formation of corrosion products in the presence of sulfates, carbonates and other prominent cementitious pore solution constituents.
2 Methods
2.1 Preparation of supersaturated stock solutions
The sample preparation has been described in detail in Furcas et al. 16. Briefly, 1 M of has been dissolved in 2 wt. % \chHNO3. 5 of the resultant acidic stock solution was mixed with 245 of 4 basic stock solutions containing 0.104 M (pH = 13) and 1.024 M (pH = 14) \chNaOH as well as 0.100 and 0.500 mM of \chNa2SiO3, respectively. Stock solutions were stirred rigorously and aged in fresh polyethylene containers at ambient temperature for up to 30 days. Solid phases were extracted by centrifugation at 10000 rpm for 15 min and subsequent freeze drying and stored as dry powders. Liquid phase aliquots were taken by extracting approx. 1 from the aged stock solution with a syringe. Aliquots were filtered using 0.20 nylon filters (Semadeni AG, Ostermundigen, Switzerland) and mixed with 2 wt. % \chHNO3 (EMSURE) purchased from Merck Group (Merck KGaA, Darmstadt, Germany), at a ratio of 1:10 for early and 1:8 for late equilibration times to prevent further precipitation.
2.2 Iron hydroxide reference standards
A total of 3 reference standards are considered in this study, 2-line ferrihydrite (), goethite () and lepidocrocite (). They were selected based on a previous investigation into the formation of corrosion products at alkaline pH16. Both 2-line ferrihydrite and lepidocrocite were synthesised following the experimental procedure of Schwertmann and Cornell 15, goethite was purchased from Thermo Fisher Scientific, Waltham, MA, USA. The identity of all standards was confirmed by XRD16. Their extended X-ray absorption fine structure (EXAFS) spectra were recorded in a previous study 16.
2.3 Inductively coupled plasma optical emission spectroscopy
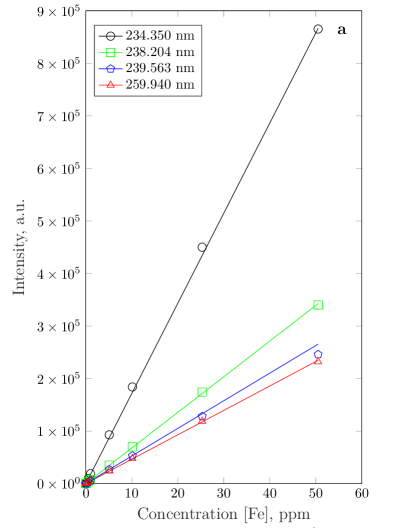
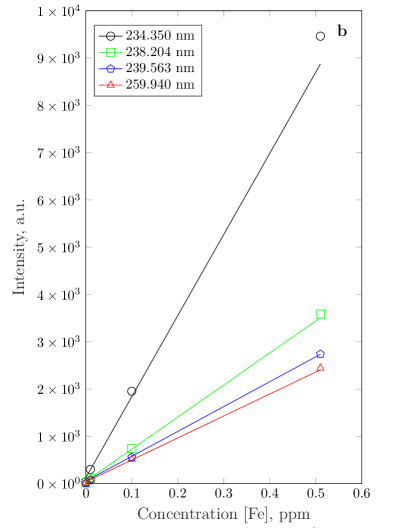
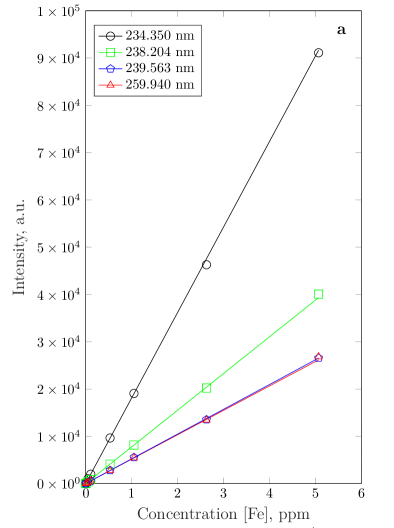
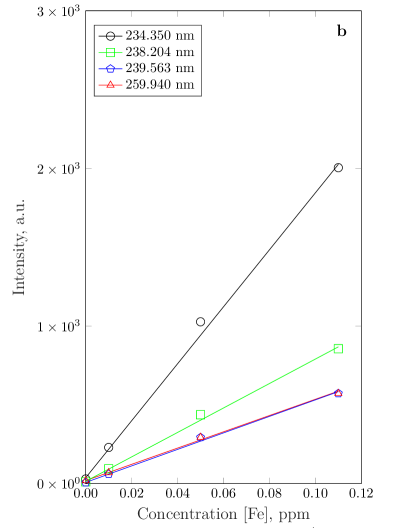
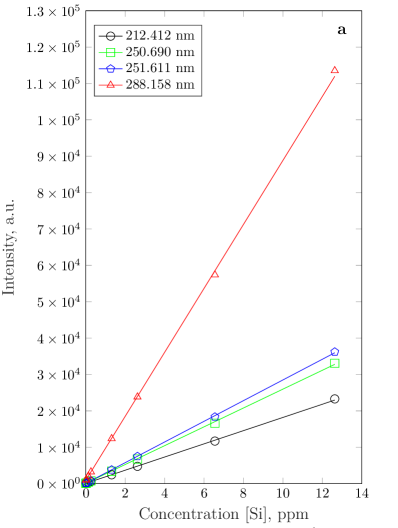
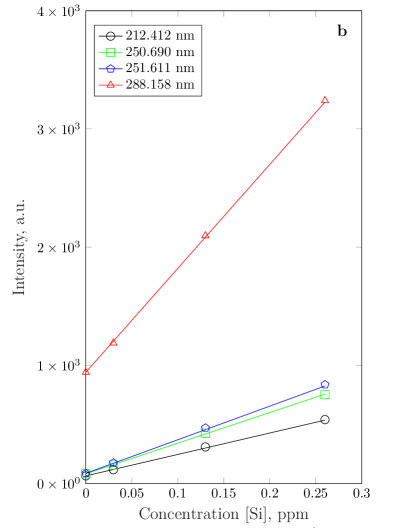
The composition of the solution was measured using the Agilent 5110 ICP-OES instrument (Agilent Technologies Inc., Santa Clara, CA, USA). Iron and silica concentrations were determined via linear interpolation on a set of 8 discrete reference concentrations, ranging from 0.01 to 50 ppm for \chFe and 0.01 to 50 ppm for \chSi. The limit of quantitation (LOQ) was determined for each analyte emission line, \chFe 234.350, 238.204, 239.563, 259.940 and \chSi 250.690, 251.611, 288.158 , according to the reccomendations of Caruso et al. 33 (Supporting information, Tab. S1). At 0.163 and 1.105 , \chFe 259.940 and \chSi 250.690 feature the highest LOQ of all analyte spectral lines recorded and will thus be considered the global limits of quantitation. The detailed account of all reference standard compositions and calibration lines is presented in Supporting Information, Tab. S2, S3. and Fig. S4, S5 and S6. For more details, the reader is referred to Furcas et al. 16.
2.4 X-ray diffraction
Powder X-ray diffraction patterns were recorded from to in steps of 0.02 , using the Bruker D8 Advance. The diffractometer uses a coupled configuration, Co K ratiation ( ) and a LynxEye XE-T detector. Diffraction patterns of reference components and solids extracted from supersaturated stock solution were analysed with the open source X-ray diffraction and Rietveld and refinement programme Profex 34. The identity of the reference standards was confirmed by comparison to the reference powder diffraction spectra of 2-line ferrihydrite 35, goethite 36, 37 and lepidocrocite (PDF entry 00-044-1415), as detailed in 16.
2.5 X-ray absorption spectroscopy
All synchrotron-based investigations were carried out at the PHOENIX (Photons for the Exploration of Nature by Imaging and XAFS) beamline at the Swiss Light Source (SLS), Paul Scherrer Institute (PSI), Villigen, Switzerland. The beamline specifications have been described elsewhere38. Iron hydroxide powders were uniformly applied to conductive carbon tape on a roughened-up copper sample holder and measured at ambient temperature under vacuum at approx. . The Total Fluorescent Yield (TFY) of the sample was measured using a four-element vortex detector. The Total Electron Yield (TEY) of the sample was measured as the incident photon flux on a Ni-coated polyester foil, located in a different vacuum chamber at approx. . Iron hydroxide powder samples were measured times, the reference standards 8 times.
Fe K-edge spectra including the X-ray absorption near edge structure (XANES) and the extended X-ray absorption fine structure (EXAFS) were recorded from 7041 to 7858 eV, i.e. from 70 eV below to approximately 750 eV above the absorption edge. The recorded data was analysed and normalised using the IFFEFIT (ATHENA) software package39, 40. The attenuated TFY signal was corrected for self-absorption by adjusting it to the TEY using the software in-built Fluo- algorithm, providing the molecular formula of various samples analysed. Radial distribution functions were generated from -weighted EXAFS spectra by performing a Fourier transform over 1.5 to 10.0 , using the Kaiser-Bessel window function. The relative amount of different iron hydroxides in the sample was determined by linear combination fitting (LCF) in the XANES region extending from 20 eV below to 40 eV above the Fe K-edge. The weights of all reference standards, 2-line ferrihydrite, lepidocrocite and goethite, were constrained to lie between the values of 0 and 1 and forced to add up to 1.
3 Results and discussion
3.1 Aqueous concentration measurements
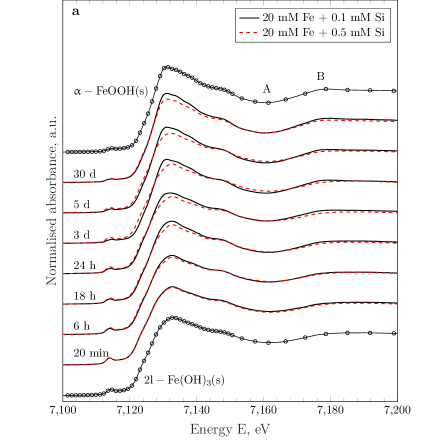
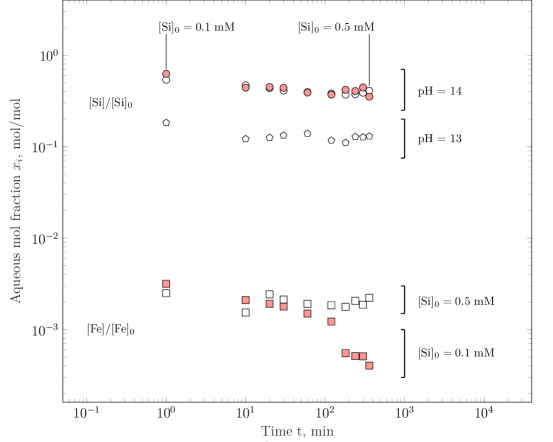
The aqueous iron and silicon concentrations measurements in equilibrium with various solid iron hydroxide phases suggest the transformation of highly soluble 2-line ferrihydrite towards a more crystalline Fe-bearing phase. Fig. 1 show the decrease of and as a function equilibration time. At pH = 14 (Fig. 1a and Fig. 1c), the initial reduction in the aqueous iron concentration observed in silicon-free solutions prevails across all silicon concentrations tested. Levelling off at approximately M after 1 hour, the aqueous iron concentration in the presence of 0.5 mM \chNa2SiO3 is 5 times higher than that measured in the absence of silicon. The iron concentration in solutions containing 0.1 mM \chNa2SiO3 decreases faster than that measured in the presence of 0.5 mM \chNa2SiO3 and slower compared to the silicon-free samples.
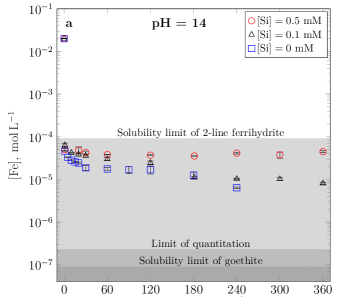
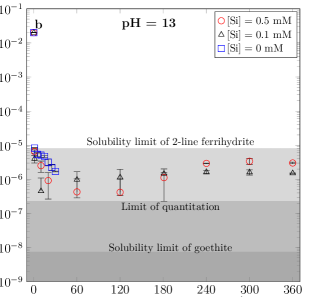
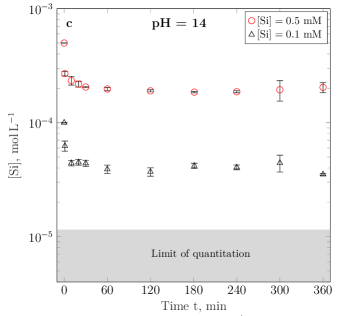
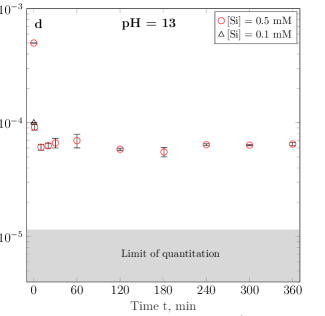
After 3 hours, the aqueous iron concentration in the presence of both 0 mM and 0.1 mM \chNa2SiO3 plateaus at M, i.e. approximately 100 times higher than the calculated solubility of goethite at pH 14. All measured , within 1 minute of equilibration time and thereafter, were found to be below the solubility limit of 2-line ferrihydrite and approach the aqueous iron concentration in equilibrium with goethite at rates inversely correlated to the initial concentration of \chNa2SiO3. The aqueous silicon concentration on the other hand rapidly drops to 40 % of its initial value, irrespective of the dissolved amounts of \chNa2SiO3. At pH = 13 (Fig. 1b and Fig. 1d), the progression of rapidly reduces to M, i.e. approximately 10 % of the initial concentration. At the same time, aqueous iron concentrations are significantly lower than those measured at pH = 14. Even though the solubility limit of 2-line ferrihydrite decreases by one order of magnitude from pH 14 to 13 (compare Figure 1a and 1b), the same initial reduction in the aqueous iron concentration within 1 minute of equilibration time is observed. No clear correlation can be established between the decrease of and the dissolved aqueous silicon concentration. Within the standard deviation of various in the presence of 0.1 mM and 0.5 mM \chNa2SiO3, it appears that the aqueous iron concentration initially decreases below the measured concentrations in the absence of silicon, but then increases above it at longer equilibration times, striving towards a consistent solubility of after 2 hours. The in the presence of \chNa2SiO3 is in the order of M within the first 2 hours of equilibration, just above the LOQ of the ICP device, and thus features significantly higher standard errors than the measurements at pH = 14. Note that the aqueous silicon concentration measured from solutions containing 0.1 mM \chNa2SiO3 at pH = 13 are below the respective LOQ across all analyte emission lines.
3.2 Mineral phase identification
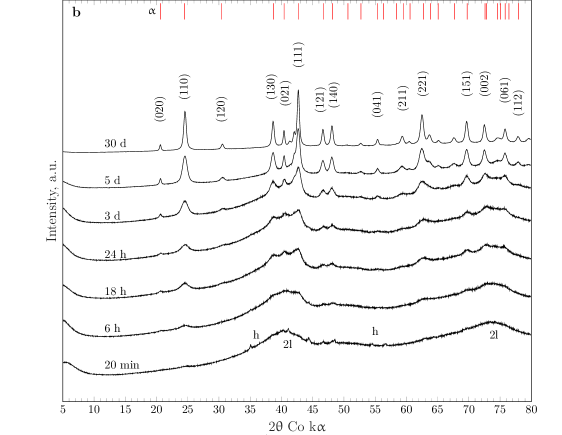
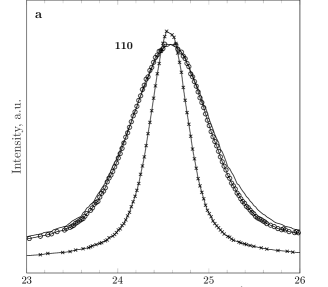
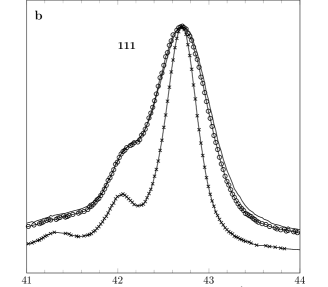
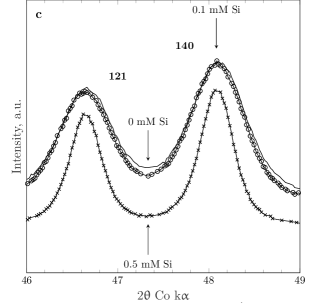
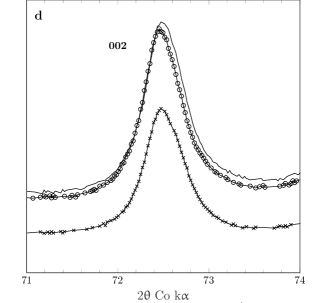
The obtained X-ray diffraction patterns and absorption spectra independently corroborate the formation of goethite from 2-line ferrihydrite at the investigated physiochemical conditions. As illustrated in Fig. 2, dried solids extracted from supersaturated iron stock solution at pH = 14 are completely amorphous to X-ray diffraction at early equilibration times. Both diffraction patterns at 20 minutes feature two broad peaks at and , characteristic to amorphous 2-line ferrihydrite as well as negligible amounts of halite (\chNaCl(s)). In the presence of 0.1 mM \chNa2SiO3 (Fig. 2a), all major peaks of goethite emerge from the initial diffraction pattern within one day, similar to the observations in the absence of \chSi16. At elevated concentrations of 0.5 mM \chNa2SiO3 (Fig. 2b), only the most prominent lattice plane reflections are discernible from the amorphous diffraction pattern of 2-line ferrihydrite after 1 day. Peaks after 30 days are generally sharper than those measured in the 0.1 mM \chNa2SiO3 sample or in the absence of silicon (Supporting information, Fig. S1) at the same point in time. The observed increase in peak sharpness can be attributed to the adsorption of \chSi onto the terminal goethite crystal faces, leading to preferential growth on the other crystal faces15.

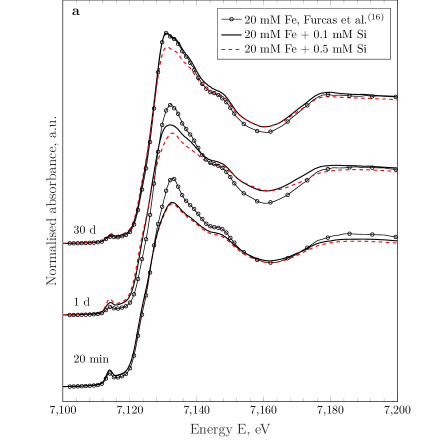
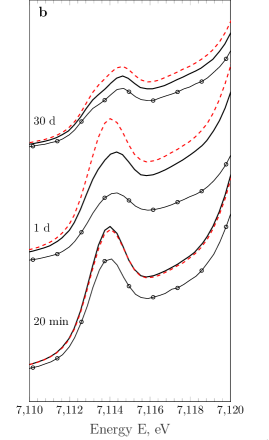
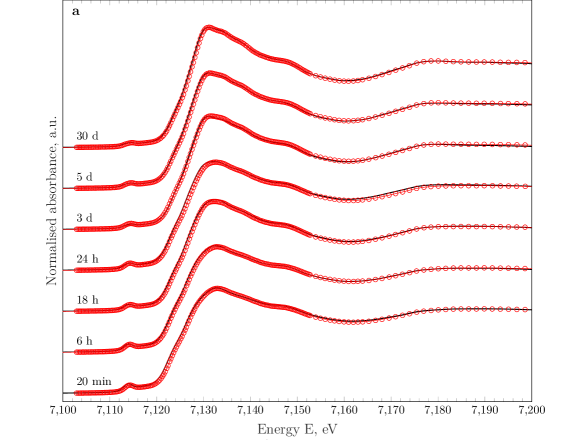
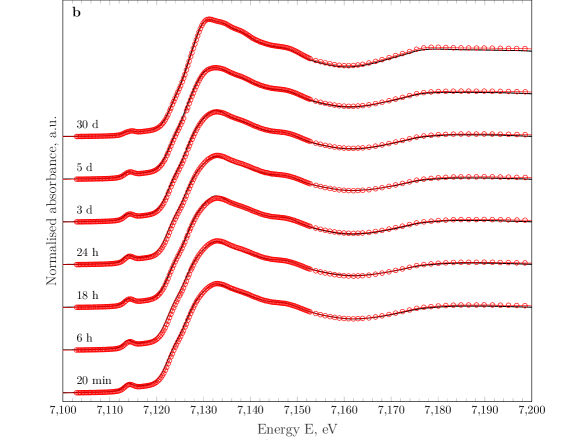
Experimentally determined Fe K-edge XANES spectra (Fig. 3) exhibit a pre-edge feature at approximately eV, resulting from quadrupolar 1s 3d electronic transitions in the absorber iron ion, characteristic to Fe(III) compounds 41, 42. Over the course of the experiment, the integrated peak intensity of the pre-edge feature reduces, whilst the white line intensity as well as the magnitude of the first destructive (A) and constructive (B) interference after the rising edge increases, indicating a transition towards a more centrosymetric, octrahedral coordination environment 43, 44.
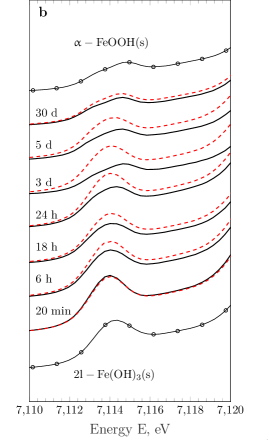
Here, the white line and pre-edge feature intensities of spectra corresponding to an initial silicon concentration of 0.1 mM are in between those aged in the presence of 0.5 mM \chNa2SiO3 and in the absence of silicon (Fig. 4). XANES spectra of iron hydroxide powders extracted from supersaturated stock solution after 30 days closely resemble the spectrum of the goethite reference standard.
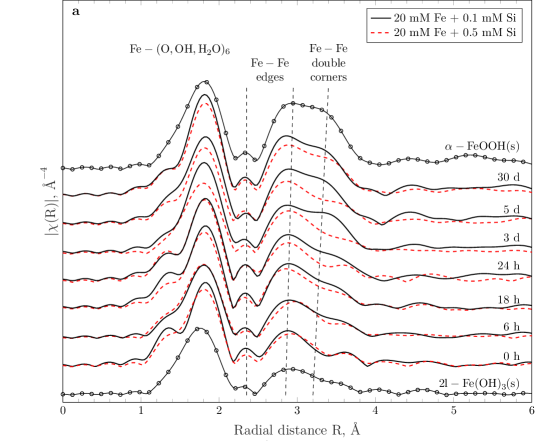
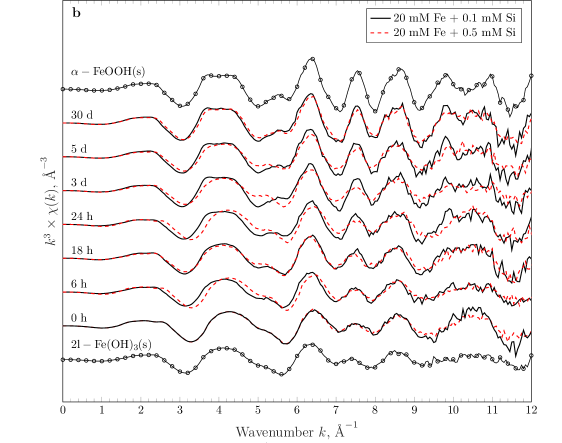
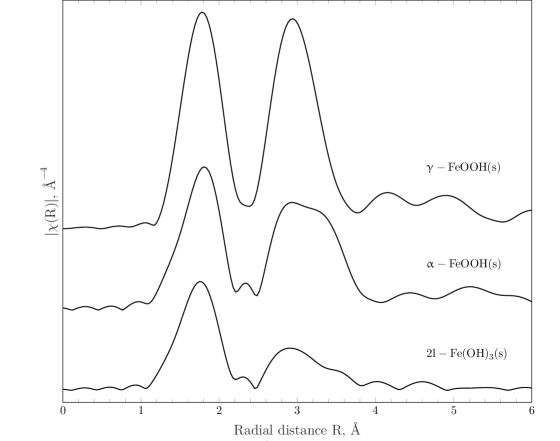
The observed transformation is also evidenced from the radial distribution functions (RDF) of iron hydroxide powders extracted at different equilibration times. As illustrated in Fig. 5, the peaks in the Fourier transformed -weighted EXAFS spectra constitute 3 distinct contributions due to the presence of bonds at distances of 45, edges at to and double corners at , respectively32, 46. At low equilibration times, the coordination environment of \chFe resembles that of 2-line ferrihydrite, featuring little to no contribution of the octahedra-linking corners. At successively higher equilibration times, both pairs in the two first iron coordination shells become significantly more pronounced. The evolution clearly indicates a change in the local coordination environment of iron and the formation of a corner-sharing octahedral structure. Moreover, the ratio of the second ( edge) to the third ( double corner) peak intensity decreases as a function of equilibration time. At 30 days, the relative peak intensities of both contributions fall short of those measured in the synthetic goethite reference standard. This is presumably due to a lower degree of crystallinity of the goethite phase stabilised at alkaline pH and in the presence of silicon when compared to its synthetic counterpart. The RDF of synthetic lepidocrocite only exhibits an intense edge peak and a comparatively weak corner contribution. This feature is unique amongst all common iron (hydr)oxides and arises from the topology of lepidocrocite chains.
As schematically illustrated in Fig. 6, one octahedron of lepidocrocite () shares a total of 6 edges and consequentially only 2 corners with the adjacent ones 46.
The respective \chFe-\chFe double corner contributions in 2-line ferrihydrite () and goethite (), as displayed in Fig. 7 are significantly higher. It is thus likely that the measured iron hydroxide powders do not contain lepidocrocite in quantities sufficiently large to be detected by EXAFS. Comparing the obtained RDF at the same equilibration times, it can be recognised that both the first coordination shell as well as various edge and double corner contributions are suppressed in the presence of 0.5 mM, compared to 0.1 mM \chNa2SiO3. Analogous to the hindered polymerisation of octahedrally coordinated Fe(III) in Si containing solution, as described by Pokrovski et al. 32, the observed peak intensity attenuation strongly suggests the presence of \chSi ligands within the second coordination shell around the ferric ion. The observed retardation is also in agreement with a number of studies investigating the transformation of solid primary to secondary iron (hydr)oxides and is commonly attributed to the adsorption or incorporation of silicon into the crystal or nucleus of the primary phase 4, 47, 30, 48.
3.3 The kinetics of corrosion product phase transformation
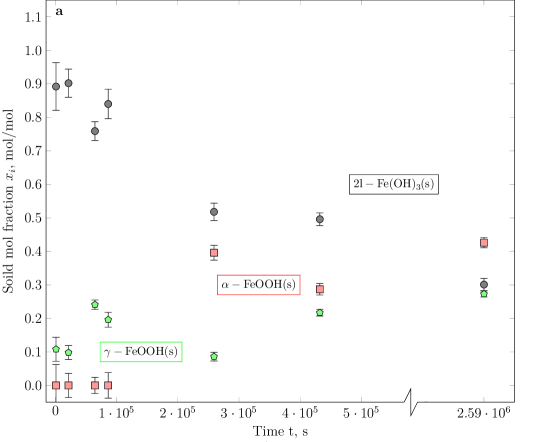
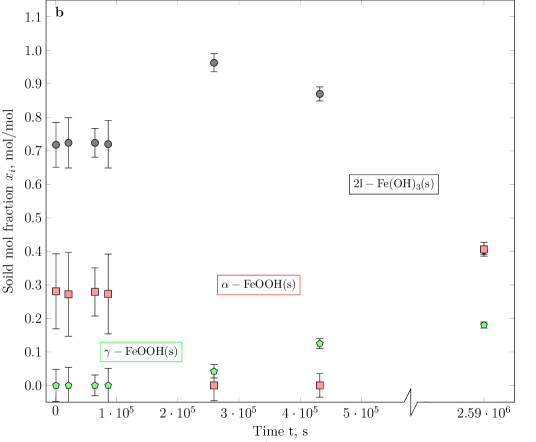
The rate of phase transformation was calculated by linear combination fitting (LCF) of various XAS spectra of iron hydroxide powders aged in the presence of 0.1 and 0.5 mM \chSi in the near-edge region from 20 eV below to 40 eV above the absorption edge (Supporting information, Fig. S2). From within the pool of reference standards employed, 2-line ferihydrite, goethite and lepidocrocite, weighted combinations of 2-line ferrihydrite and goethite best reproduce the measured XANES spectra of aged iron hydroxide powders. Including the third standard, lepidocrocite, yielded a less robust fit with comparatively high standard deviations in the predicted solid molar fractions (Supporting information, Fig. S3). The computed molar fractions of 2-line ferrihydrite as a function of time are displayed in Fig. 8.
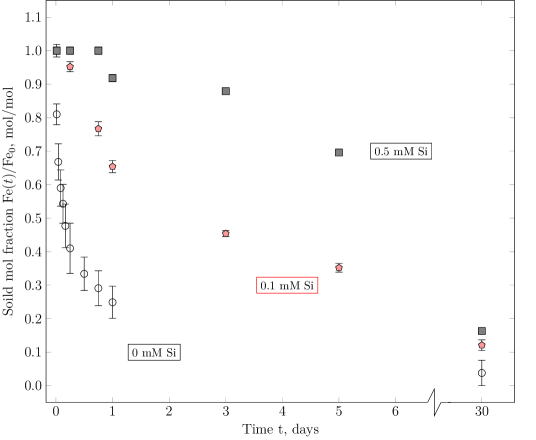
It is clear that there is a positive correlation between the dissolved silicon concentration and the observed solid fraction of 2-line ferrihydrite. In the absence of silicon, the formation of goethite is rapid, consuming close to 75 % of 2-line ferrihydrite within 24 hours, as reported in Furcas et al. 16. In the same timespan, the conversion extent amounts to approximately 35 % and 8 % in the presence of 0.1 mM and 0.5 mM \chSi, respectively. After 30 days, all progressions approach full conversion. Assuming the time-dependent amount of 2-line ferrihydrite () is proportional to its rate of transformation,
| (1) |
can be computed by fitting its mol fraction with respect to the initial iron concentration to the integrated first order rate equation . Fig. 9 displays the resultant estimated rate constant of phase transformation in as a function of the aqueous \chSi concentration. It is shown that the presence of M of \chSi, corresponding to an initial iron to silicon ratio of 1:200, is sufficient to reduce the rate of corrosion product transformation by one order of magnitude.
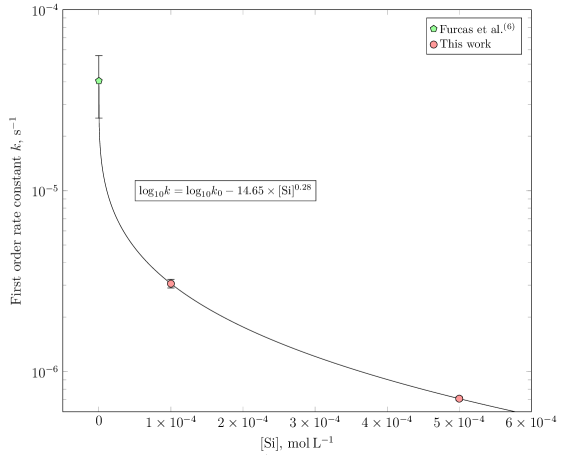
Further reduction is exponential with respect to the silicon concentration and follows
| (2) |
where is the rate of 2-line ferrihydrite transformation at pH = 14 in the absence of silicon.
3.4 A suggested mechanism of the influence of Si on the transformation of corrosion products
XRD (Fig. 2) and EXAFS (Fig. 5) measurements demonstrate a delayed formation of the crystalline corrosion product goethite from amorphous 2-line ferrihydrite in the presence of silicon. The RDF and X-ray diffractograms of iron hydroxide phases aged in the presence of 0.5 mM \chNa2SiO3 are equivalent to the measurements of solid phases stabilised in the presence of 0.1 mM \chNa2SiO3 at earlier equilibration times. Changes in the aqueous phase composition over the course of the transformation further indicate that the concentrations of iron are increased in the presence of silicon (compare Figure 1). Vice versa, the fraction of silicon that remains in the aqueous phase with respect to the amount initially dissolved increases w.r.t. the aqueous iron concentration. In either case, the balance, i.e. the difference between the initial and aqueously dissolved number of moles of \chFe and \chSi, partitions into one of the two solid phases, 2-line ferrihydrite and goethite. These trends are summarised in Fig. 10.
From the aqueous \chSi concentration measurements presented in Figure 1, it is apparent that the initial reduction in the dissolved silicon concentration is concluded within the first few minutes of equilibration time. As evident from the extended X-ray absorption fine structures presented in Figure 5, the solids stabilised across the same timespan consist exclusively of 2-line ferrihydrite. Consequentially, the difference between the initial and final aqueous silicon concentration must have predominantly associated to 2-line ferrihydrite, rather than goethite. These observations are in agreement with Schulz et al. 31, demonstrating that the vast majority of dissolved \chSi is associated with 2-line ferrihydrite during its Fe(II)-catalysed transformation to other iron (hydr)oxides at neutral pH. The remaining amount of \chSi that is not adsorbed or taken-up by 2-line ferrihydrite within the first hour of equilibration time appears to influence the morphology of goethite crystals stabilised and the aqueous iron concentration in equilibrium with both solid phases. Cornell and Giovanoli 30 show that high levels of \chSi (9.6 mol % relative to the total number of moles including water) significantly enhances the development of the terminal (021), (111) and (121) crystal faces. Although the aqueous \chSi concentration of 0.1 and 0.5 mM used in this paper is significantly lower, the onset of the (110) and (111) face development over the (002) face is evidenced from an increase in their crystallinity at 0.5 mM (compare Supplementary information, Figure S1).
Provided that the adsorption of \chSi onto 2-line ferrihydrite slows down its dissolution15, 31, the aqueous iron concentration resulting of the dissolution of 2-line ferrihydrite is expected to be lower in the presence of \chSi. Given additionally that the dissolution of 2-line ferrihydrite limits the rate of goethite precipitation 23, while the precipitation of goethite is not occurring instantly as is evidenced by the fact that aqueous iron concentrations plateau above the goethite solubility limit (irrespective of the presence of Si, see Figure 1), the overall aqueous iron concentration as measured by ICP-OES resultant of the combined dissolution of 2-line ferrihydrite and precipitation of goethite is also expected to be lower in the presence of \chSi. As the measured are instead higher, it is likely that some of the aqueous iron that would otherwise be coordinated as \chFe(OH)4^- forms an aqueous \chFe-\chSi complex32. In comparison to the transformation of 2-line ferrihydrite in the absence of silicon, the observed retardation would thus be due to the competitive formation of goethite and the hitherto unconsidered \chFe-\chSi complex, effectively reducing the amount of \chFe(OH)4^- at disposal to precipitate. The formation of such a complex could explain the strongly increased aqueous iron concentration in cementitious systems containing dissolved \chSi compared to systems aged in the absence of silicon13, 49, 50. Figure 11 illustrates these findings in the form of a schematic reaction diagram.
Further deconvolution of the influence of silicon on the transformation mechanism would require a more detailed investigation of (i) the nature of complexes formed as well as (ii) the rate of silicon adsorption onto both solid phases and (iii) the rate of 2-line ferrihydrite dissolution as a function of the amount of silicon adsorbed. Moreover, it cannot be excluded that small quantities of \chSi are incorporated into or alter the structure of corrosion products formed. To this effect, the utilised approach to quantify the transformation of 2-line ferrihydrite to goethite by means of XAS LCF may not be applicable at higher silicon concentrations. Instead, the structure and stoichiometry of -bearing iron phases requires rigorous modelling of the local coordination environment of both ligands.
3.5 Implications for the durability of reinforced concrete structures
With regard to the durability of reinforced concrete structures, these findings imply that the pore solution chemistry, i.e. the high degree of alkalinity and the presence of \chSi, maintains an aqueous Fe(III) concentration well above its thermodynamic solubility limit. Irrespective of whether these Fe(III) species are coordinated as one of the Fe(III) hydrolysis products or in the form of an aqueous \chFe-\chSi complex, they remain mobile in the aqueous phase. Cementitious systems dissolving high amounts of silicon could thus facilitate iron transport and therefore the precipitation of corrosion products distant from the steel-concrete interface. Moreover, the kinetically hindered transformation of 2-line ferrihydrite to goethite could lead to a faster accumulation of internal stresses, as the high-volume corrosion product 2-line ferrihydrite dissolves comparatively slower. As these competing reactive mass-transport phenomena are highly dependent on the local solute concentrations as well as the pore shape in which the corrosion products precipitate, further experimental and computational studies are needed to assess whether the delayed transformation of corrosion products contributes to the structural degradation on a macroscopic level.
4 Conclusions
The findings presented in this study and other research on the precipitation of corrosion products at alkaline pH substantiate the following major conclusions:
-
•
The stabilisation of the thermodynamically favourable corrosion product goethite from amorphous 2-line ferrihydrite is delayed in the presence of silicon.
-
•
At the aqueous silicon concentration characteristic to a broad range of cementitious systems, the estimated rate constant of transformation decreases exponentially with respect to .
-
•
The observed retardation of goethite formation is likely a consequence of 3 distinct reactive phenomena, (i) the hindered dissolution of 2-line ferrihydrite, (ii) the formation of a soluble iron-silicon complex and (iii) changes to the morphology of the goethite crystals.
- •
-
•
With regard to the durability of reinforced concrete structures, the observed retardation prospectively generates more internal stresses due to the precipitation of corrosion products, as the specific molar volume of 2-line ferrihydrite is significantly higher than that of goethite. Moreover, the aqueous iron concentration in equilibrium with both phases is higher compared to systems containing no silicon, facilitating the transport of iron complexes across the concrete pore network.
Acknowledgements
All XAS measurements were performed at the PHOENIX beamline at the Swiss Light Source, Paul Scherrer Institut, Villigen, Switzerland. The authors thank Dr. Michael Plötze from the ETH Zürich ClayLab at the Institute for Geotechnical Engineering for access to the XRD equipment, help with the measurement and discussion. The authors also thank Raphael Kuhn and Dr. Alexandru Pirvan from the Empa Concrete & Asphalt Laboratory for their help with the ICP-OES measurements. The authors are further grateful for the financial support provided for Fabio Enrico Furcas by the European Research Council (ERC) under the European Union’s Horizon 2020 research and innovation program (grant agreement no. 848794).
Author contributions
Fabio E. Furcas: Conceptualization, Investigation, Formal analysis, Visualization, Writing - Original Draft
Shishir Mundra: Conceptualization, Investigation, Writing - Review & Editing, Supervision
Barbara Lothenbach: Conceptualization, Formal analysis, Writing - Review & Editing, Supervision
Camelia N. Borca: Investigation, Writing - Review & Editing
Thomas Huthwelker: Investigation, Writing - Review & Editing
Ueli M. Angst: Conceptualization, Writing - Review & Editing, Supervision, Funding acquisition
Data availability
The experimental data generated in this study is openly available in the ETH Research Collection, https://doi.org/10.3929/ethz-b-000658759.
Supplementary information
| Element | Spectral line, nm | SD | LOD | LOQ | ||||
|---|---|---|---|---|---|---|---|---|
| (ppm) | () | () | () | () | ||||
| \chFe | 234.350 | 0.888 | 0.016 | 2.961 | 0.053 | |||
| 238.204 | 1.418 | 0.025 | 4.726 | 0.085 | ||||
| 239.563 | 1.304 | 0.023 | 4.348 | 0.078 | ||||
| 259.940 | 2.724 | 0.049 | 9.081 | 0.163 | ||||
| \chSi | 212.412 | 8.215 | 0.293 | 27.385 | 0.975 | |||
| 250.690 | 9.307 | 0.331 | 31.023 | 1.150 | ||||
| 251.611 | 6.672 | 0.238 | 22.204 | 0.792 | ||||
| 288.158 | 7.918 | 0.282 | 26.394 | 0.940 | ||||
| Standard | Element, ppm | |||||||||||||||||
|---|---|---|---|---|---|---|---|---|---|---|---|---|---|---|---|---|---|---|
| Number | Na | K | Ca | Mg | Al | Fe | S | Si | P | |||||||||
| 8 | 50.5506 | 50.2203 | 50.3531 | 50.4780 | 20.2052 | 50.3020 | 50.2344 | 50.3595 | 50.3269 | |||||||||
| 7 | 25.3110 | 25.1456 | 25.2121 | 25.2747 | 10.1169 | 25.1865 | 25.1527 | 25.2153 | 25.1990 | |||||||||
| 6 | 10.1346 | 10.0684 | 10.0950 | 10.1201 | 4.0508 | 10.0848 | 10.0712 | 10.0963 | 10.0898 | |||||||||
| 5 | 5.0766 | 5.0435 | 5.0568 | 5.0693 | 2.0291 | 5.0517 | 5.0449 | 5.0574 | 5.0542 | |||||||||
| 4 | 1.0239 | 1.0172 | 1.0199 | 1.0224 | 0.4093 | 1.0188 | 1.0175 | 1.0200 | 1.0194 | |||||||||
| 3 | 0.5096 | 0.5063 | 0.5076 | 0.5089 | 0.2037 | 0.5071 | 0.5064 | 0.5077 | 0.5640 | |||||||||
| 2 | 0.1017 | 0.1010 | 0.1013 | 0.1016 | 0.0407 | 0.1012 | 0.1011 | 0.1013 | 0.1013 | |||||||||
| 1 | 0.0101 | 0.0101 | 0.0101 | 0.0102 | 0.0041 | 0.0101 | 0.0101 | 0.0101 | 0.0101 | |||||||||
| Standard | Element, ppm | |||||||||||||||||
|---|---|---|---|---|---|---|---|---|---|---|---|---|---|---|---|---|---|---|
| Number | Na | K | Ca | Mg | Al | Fe | S | Si | P | |||||||||
| 7 | 50.4817 | 50.1734 | 49.6668 | 20.2355 | 20.2262 | 5.0717 | 50.3728 | 12.6314 | - | |||||||||
| 6 | 26.1642 | 26.0044 | 25.7418 | 10.4878 | 10.4830 | 2.6286 | 26.1077 | 6.5467 | - | |||||||||
| 5 | 10.4703 | 10.4064 | 10.3013 | 4.1970 | 4.1951 | 1.0519 | 10.4477 | 2.6198 | - | |||||||||
| 4 | 5.2400 | 5.2080 | 5.1555 | 2.1005 | 2.0995 | 0.5264 | 5.2287 | 1.3111 | - | |||||||||
| 3 | 1.0496 | 1.0432 | 1.0327 | 0.4207 | 0.4206 | 0.1055 | 1.0474 | 0.2626 | - | |||||||||
| 2 | 0.5293 | 0.5261 | 0.5208 | 0.2122 | 0.2121 | 0.0532 | 0.5282 | 0.1324 | - | |||||||||
| 1 | 0.1057 | 0.1051 | 0.1040 | 0.0424 | 0.0424 | 0.0106 | 0.1055 | 0.0265 | - | |||||||||
References
- Bertolini et al. (2013) Luca Bertolini, Bernhard Elsener, Pietro Pedeferri, Elena Redaelli, and Rob Polder. Corrosion of Steel in Concrete, volume 392. Wiley-Vch, Weinheim, Germany, 2013.
- Wong et al. (2010) HS Wong, YX Zhao, AR Karimi, NR Buenfeld, and WL Jin. On the penetration of corrosion products from reinforcing steel into concrete due to chloride-induced corrosion. Corrosion Science, 52(7):2469–2480, 2010. ISSN 0010-938X.
- Schwertmann and Murad (1983) U Schwertmann and E Murad. Effect of ph on the formation of goethite and hematite from ferrihydrite. Clays and Clay Minerals, 31(4):277–284, 1983. ISSN 1552-8367.
- Schwertmann and Thalmann (1976) U Schwertmann and H Thalmann. The influence of Fe (II), Si, and pH on the formation of lepidocrocite and ferrihydrite during oxidation of aqueous FeCl2 solutions. Clay Minerals, 11(3):189–200, 1976. ISSN 0009-8558.
- Das et al. (2011a) Soumya Das, M Jim Hendry, and Joseph Essilfie-Dughan. Transformation of two-line ferrihydrite to goethite and hematite as a function of pH and temperature. Environmental Science & Technology, 45(1):268–275, 2011a. ISSN 0013-936X.
- Das et al. (2011b) Soumya Das, M Jim Hendry, and Joseph Essilfie-Dughan. Effects of adsorbed arsenate on the rate of transformation of 2-line ferrihydrite at pH 10. Environmental Science & Technology, 45(13):5557–5563, 2011b. ISSN 0013-936X.
- Robertson et al. (2019) Jared Robertson, M Jim Hendry, T Kotzer, and Kebbi A Hughes. Geochemistry of uranium mill tailings in the Athabasca Basin, Saskatchewan, Canada: A review. Critical Reviews in Environmental Science and Technology, 49(14):1237–1293, 2019. ISSN 1064-3389.
- Sørensen et al. (2000) Mette A Sørensen, Christian Bender Koch, Mairead M Stackpoole, Rajendra K Bordia, Mark M Benjamin, and Thomas H Christensen. Effects of thermal treatment on mineralogy and heavy metal behavior in iron oxide stabilized air pollution control residues. Environmental Science & Technology, 34(21):4620–4627, 2000. ISSN 0013-936X.
- Hansen et al. (2001) Birgitte Ø Hansen, Pierre Kwan, Mark M Benjamin, Chi-Wang Li, and Gregory V Korshin. Use of iron oxide-coated sand to remove strontium from simulated Hanford tank wastes. Environmental Science & Technology, 35(24):4905–4909, 2001. ISSN 0013-936X.
- Angst (2023) Ueli M Angst. Steel corrosion in concrete – Achilles’ heel for sustainable concrete? Cement and Concrete Research, 172:107239, 2023. ISSN 0008-8846.
- Majzlan et al. (2003) Juraj Majzlan, Brian E Lang, Rebecca Stevens, Alexandra Navrotsky, Brian F Woodfield, and Juliana Boerio-Goates. Thermodynamics of Fe oxides: Part I. Entropy at standard temperature and pressure and heat capacity of goethite (-FeOOH), lepidocrocite (-FeOOH), and maghemite (-Fe2O3). American Mineralogist, 88(5-6):846–854, 2003.
- Post and Buchwald (1991) Jeffrey E Post and Vagn F Buchwald. Crystal structure refinement of akaganéite. American Mineralogist, 76(1-2):272–277, 1991.
- Dilnesa et al. (2011) BZ Dilnesa, B Lothenbach, G Le Saout, G Renaudin, Adel Mesbah, Yaroslav Filinchuk, A Wichser, and E Wieland. Iron in carbonate containing AFm phases. Cement and Concrete Research, 41(3):311–323, 2011.
- Robie and Hemingway (1995) Richard A Robie and Bruce S Hemingway. Thermodynamic properties of minerals and related substances at 298.15 K and 1 bar (105 Pascals) pressure and at higher temperatures, volume 2131. US Government Printing Office, 1995.
- Schwertmann and Cornell (2008) Udo Schwertmann and Rochelle M Cornell. Iron Oxides in the Laboratory: Preparation and Characterization. John Wiley & Sons, 2 edition, 2008.
- Furcas et al. (2023a) Fabio E Furcas, Barbara Lothenbach, Shishir Mundra, Camelia N Borca, Cristhiana Carine Albert, O Burkan Isgor, Thomas Huthwelker, and Ueli M Angst. Transformation of 2-line ferrihydrite to goethite at alkaline pH. Environmental Science & Technology, 2023a. ISSN 0013-936X.
- Leemann and Lothenbach (2008) Andreas Leemann and Barbara Lothenbach. The influence of potassium–sodium ratio in cement on concrete expansion due to alkali-aggregate reaction. Cement and Concrete Research, 38(10):1162–1168, 2008. ISSN 0008-8846.
- Leemann et al. (2011) Andreas Leemann, Gwenn Le Saout, Frank Winnefeld, Daniel Rentsch, and Barbara Lothenbach. Alkali–silica reaction: the influence of calcium on silica dissolution and the formation of reaction products. Journal of the American Ceramic Society, 94(4):1243–1249, 2011. ISSN 0002-7820.
- Le Saoût et al. (2013) Gwenn Le Saoût, Barbara Lothenbach, Akihiro Hori, Takayuki Higuchi, and Frank Winnefeld. Hydration of portland cement with additions of calcium sulfoaluminates. Cement and Concrete Research, 43:81–94, 2013. ISSN 0008-8846.
- Pu et al. (2012) Qi Pu, Linhua Jiang, Jinxia Xu, Hongqiang Chu, Yi Xu, and Yan Zhang. Evolution of pH and chemical composition of pore solution in carbonated concrete. Construction and Building Materials, 28(1):519–524, 2012. ISSN 0950-0618.
- Bernard et al. (2023) Ellina Bernard, Hoang Nguyen, Shiho Kawashima, Barbara Lothenbach, Hegoi Manzano, John Provis, Allan Scott, Cise Unluer, Frank Winnefeld, and Paivo Kinnunen. MgO-based cements – Current status and opportunities. RILEM Technical Letters, 8:65–78, 2023. ISSN 2518-0231.
- Bernard et al. (2017) Ellina Bernard, Barbara Lothenbach, Daniel Rentsch, Isabelle Pochard, and Alexandre Dauzères. Formation of magnesium silicate hydrates (MSH). Physics and Chemistry of the Earth, Parts A/B/C, 99:142–157, 2017. ISSN 1474-7065.
- Furcas et al. (2023b) Fabio Enrico Furcas, Shishir Mundra, Barbara Lothenbach, and Ueli Angst. Speciation controls the kinetics of iron hydroxide precipitation and transformation. arXiv preprint arXiv:2311.12464, 2023b.
- Schöler et al. (2017) Axel Schöler, Barbara Lothenbach, Frank Winnefeld, Mohsen Ben Haha, Maciej Zajac, and Horst-Michael Ludwig. Early hydration of SCM-blended portland cements: A pore solution and isothermal calorimetry study. Cement and Concrete Research, 93:71–82, 2017. ISSN 0008-8846.
- Deschner et al. (2013) Florian Deschner, Barbara Lothenbach, Frank Winnefeld, and Jürgen Neubauer. Effect of temperature on the hydration of Portland cement blended with siliceous fly ash. Cement and Concrete Research, 52:169–181, 2013.
- Van Niejenhuis et al. (2020) Colin B Van Niejenhuis, Ibrahim G Ogunsanya, and Carolyn M Hansson. Analysis of pore solution of different cements with and without admixed chlorides. ACI Materials Journal, 117(3), 2020. ISSN 0889-325X.
- Bach et al. (2012) TTH Bach, C Cau Dit Coumes, Isabelle Pochard, C Mercier, B Revel, and Andre Nonat. Influence of temperature on the hydration products of low pH cements. Cement and Concrete Research, 42(6):805–817, 2012. ISSN 0008-8846.
- Chappex (2012) Thêodore Chappex. The role of aluminium from supplementary cementitious materials in controlling alkali-silica reaction. Thesis, 2012.
- Lothenbach et al. (2012) Barbara Lothenbach, Gwenn Le Saout, Mohsen Ben Haha, Renato Figi, and Erich Wieland. Hydration of a low-alkali CEM III/B–SiO2 cement (LAC). Cement and Concrete Research, 42(2):410–423, 2012.
- Cornell and Giovanoli (1987) Rochelle M Cornell and Rudolf Giovanoli. The influence of silicate species on the morphology of goethite (-FeOOH) grown from ferrihydrite (5\chFe2O39\chH2O). Journal of the Chemical Society, Chemical Communications, (6):413–414, 1987.
- Schulz et al. (2022) Katrin Schulz, Laurel K ThomasArrigo, Ralf Kaegi, and Ruben Kretzschmar. Stabilization of ferrihydrite and lepidocrocite by silicate during Fe(II)-catalyzed mineral transformation: Impact on particle morphology and silicate distribution. Environmental Science & Technology, 56(9):5929–5938, 2022. ISSN 0013-936X.
- Pokrovski et al. (2003) Gleb S Pokrovski, Jacques Schott, François Farges, and Jean-Louis Hazemann. Iron (III)-silica interactions in aqueous solution: Insights from X-ray absorption fine structure spectroscopy. Geochimica et Cosmochimica Acta, 67(19):3559–3573, 2003. ISSN 0016-7037.
- Caruso et al. (2017) Francesco Caruso, Sara Mantellato, Marta Palacios, and Robert J Flatt. ICP-OES method for the characterization of cement pore solutions and their modification by polycarboxylate-based superplasticizers. Cement and Concrete Research, 91:52–60, 2017. ISSN 0008-8846.
- Doebelin and Kleeberg (2015) Nicola Doebelin and Reinhard Kleeberg. Profex: a graphical user interface for the Rietveld refinement program BGMN. Journal of Applied Crystallography, 48(5):1573–1580, 2015. ISSN 1600-5767.
- Michel et al. (2007) F Marc Michel, Lars Ehm, Sytle M Antao, Peter L Lee, Peter J Chupas, Gang Liu, Daniel R Strongin, Martin AA Schoonen, Brian L Phillips, and John B Parise. The structure of ferrihydrite, a nanocrystalline material. Science, 316(5832):1726–1729, 2007. ISSN 0036-8075.
- Brown (1961) George Brown. The X-ray identification and crystal structures of clay minerals. Mineralogical Society, 1961.
- Harrison et al. (1975) Ronald Keith Harrison, Young BR, and Dagger PF. Goethite from Hindlow, Derbyshire. 1975.
- Henzler et al. (2018) Katja Henzler, Evgenii O Fetisov, Mirza Galib, Marcel D Baer, Benjamin A Legg, Camelia Borca, Jacinta M Xto, Sonia Pin, John L Fulton, and Gregory K Schenter. Supersaturated calcium carbonate solutions are classical. Science Advances, 4(1), 2018. ISSN 2375-2548.
- Ravel and Newville (2005) Bruce Ravel and Matthew Newville. ATHENA, ARTEMIS, HEPHAESTUS: data analysis for X-ray absorption spectroscopy using IFEFFIT. Journal of Synchrotron Radiation, 12(4):537–541, 2005. ISSN 0909-0495.
- Newville (2001) Matthew Newville. IFEFFIT: interactive XAFS analysis and FEFF fitting. Journal of Synchrotron Radiation, 8(2):322–324, 2001. ISSN 0909-0495.
- Wilke et al. (2001) Max Wilke, François Farges, Pierre-Emmanuel Petit, Gordon E Brown Jr, and François Martin. Oxidation state and coordination of Fe in minerals: An Fe K-XANES spectroscopic study. American Mineralogist, 86(5-6):714–730, 2001. ISSN 1945-3027.
- Apted et al. (1985) MJ Apted, GA Waychunas, and GE Brown. Structure and specification of iron complexes in aqueous solutions determined by X-ray absorption spectroscopy. Geochimica et Cosmochimica Acta, 49(10):2081–2089, 1985. ISSN 0016-7037.
- Waychunas et al. (1983) Glenn A Waychunas, Michael J Apted, and Gordon E Brown. X-ray k-edge absorption spectra of fe minerals and model compounds: Near-edge structure. Physics and Chemistry of Minerals, 10(1):1–9, 1983. ISSN 1432-2021.
- Guda et al. (2021) Alexander A Guda, Sergey A Guda, Andrea Martini, AN Kravtsova, Alexander Algasov, Aram Bugaev, Stanislav P Kubrin, LV Guda, Petr Šot, and Jeroen A van Bokhoven. Understanding X-ray absorption spectra by means of descriptors and machine learning algorithms. npj Computational Materials, 7(1):203, 2021. ISSN 2057-3960.
- Combes et al. (1989) JM Combes, A Manceau, G Calas, and JY Bottero. Formation of ferric oxides from aqueous solutions: A polyhedral approach by X-ray absorption spectroscopy: I. Hydrolysis and formation of ferric gels. Geochimica et Cosmochimica Acta, 53(3):583–594, 1989. ISSN 0016-7037.
- Manceau and Combes (1988) A Manceau and JM Combes. Structure of mn and fe oxides and oxyhydroxides: A topological approach by exafs. Physics and Chemistry of Minerals, 15:283–295, 1988. ISSN 0342-1791.
- Parfitt et al. (1992) RL Parfitt, SJ Van der Gaast, and CW Childs. A structural model for natural siliceous ferrihydrite. Clays and Clay Minerals, 40:675–581, 1992. ISSN 0009-8604.
- Schwertmann and Fischer (1973) U Schwertmann and WR Fischer. Natural “amorphous” ferric hydroxide. Geoderma, 10(3):237–247, 1973. ISSN 0016-7061.
- Dilnesa et al. (2014) Belay Zeleke Dilnesa, Barbara Lothenbach, Guillaume Renaudin, Adrian Wichser, and Dmitrii Kulik. Synthesis and characterization of hydrogarnet . Cement and Concrete Research, 59:96–111, 2014.
- Furcas et al. (2022) Fabio E Furcas, Barbara Lothenbach, O Burkan Isgor, Shishir Mundra, Zhidong Zhang, and Ueli M Angst. Solubility and speciation of iron in cementitious systems. Cement and Concrete Research, 151:106620, 2022. ISSN 0008-8846.