Nanomechanical crystalline AlN resonators with high quality factors for quantum optoelectromechanics
Abstract
High- mechanical resonators are crucial for applications where low noise and long coherence time are required, as mirror suspensions, quantum cavity optomechanical devices, or nanomechanical sensors. Tensile strain in the material enables the use of dissipation dilution and strain engineering techniques, which increase the mechanical quality factor. These techniques have been employed for high- mechanical resonators made from amorphous materials and, recently, from crystalline materials such as InGaP, SiC, and Si. A strained crystalline film exhibiting substantial piezoelectricity expands the capability of high- nanomechanical resonators to directly utilize electronic degrees of freedom. In this work we realize nanomechanical resonators with up to made from tensile-strained -thick AlN, which is an epitaxially-grown crystalline material offering strong piezoelectricity. We demonstrate nanomechanical resonators that exploit dissipation dilution and strain engineering to reach a -product approaching at room temperature. We realize a novel resonator geometry, triangline, whose shape follows the Al-N bonds and offers a central pad that we pattern with a photonic crystal. This allows us to reach an optical reflectivity above 80% for efficient coupling to out-of-plane light. The presented results pave the way for quantum optoelectromechanical devices at room temperature based on tensile-strained AlN.
I Introduction
Engineering of tensile-strained materials has enabled rapid progress in realizing nanomechanical resonators with ever-higher quality factors [1]. The low mass and high quality factor of a nanomechanical resonator result in low thermal force noise, which enables measuring small forces as, e.g., required for the detection of single-proton spins [2] or gravity between small masses [3]. Furthermore, a high--product increases the number of coherent oscillations, which is essential for realizing quantum opto- or electromechanical devices [4] for the use in quantum technologies [5].
Nanomechanical resonators with record-high quality factors of [6] have been predominantly achieved in tensile-strained amorphous Si3N4, employing dissipation dilution, soft clamping, and strain engineering techniques [7, 8, 9, 10, 11]. These techniques have led to a variety of nanomechanical resonator geometries, including 2D phononic crystal (PnC)-shielded membranes [9], 1D PnC beams [10], hierarchically-clamped devices [12], and resonators optimized through machine learning methods [13, 14]. Recently, tensile-strained crystalline materials made from InGaP [15, 16, 17], SiC [18], or Si [19] have been investigated for high- mechanical resonators. The latter work demonstrated 1D PnC beams in Si with of at cryogenic temperatures [19]. Crystalline materials have fewer defects, which potentially leads to a larger intrinsic quality factor, and, thus, to an enhanced diluted quality factor. Furthermore, highly ordered materials, depending on their crystal structure, can offer additional functionality, such as electrical conductivity, piezoelectricity, or superconductivity. This would enable interfacing mechanical vibrations directly to electronic degrees of freedom [20, 21, 4] without requiring the deposition of additional materials on high- nanomechanical resonators [22, 23], which increases fabrication complexity and may decrease [8].
In this work, we demonstrate high- nanomechanical resonators made from tensile-strained AlN. This crystalline material is non-centrosymmetric, thus, pyro- and piezoelectric, and has so far been utilized in unstrained GHz mechanics [24, 25]. Moreover, AlN is widely used in ultraviolet photonics [26, 27] and can host defect centers [28] that act as single-photon sources. AlN is chemically stable [29] and provides a wide bandgap (6.2 eV at ) with a broad transparency window that covers the ultraviolet to mid-infrared range. Hence, AlN is free from two-photon absorption at telecom wavelengths [30], contrary to Si. These capabilities make AlN and in general III-nitrides suitable materials for realizing a hybrid platform for interfacing electrical, mechanical and optical degrees of freedom [4].
We realize AlN nanomechanical resonators with as high as and -product close to at room temperature. Mechanical resonators in crystalline III-nitrides have been demonstrated in unstrained AlN [31, 32, 33, 34] or compressively strained GaN [35], but these structures could not profit from dissipation dilution, soft clamping, or strain engineering techniques. Although there are examples of strained AlN resonators [36], no high- devices have been reported. In this work, we apply dissipation dilution, soft clamping, and strain engineering techniques to a -thick crystalline AlN film of residual tensile stress of grown on a Si(111) substrate [20]. We demonstrate high- nanomechanical resonators with different geometries: uniform beams, tapered 1D PnC beams, and hierarchically-clamped structures. We compare the experimental results with eigenfrequency simulations and dissipation dilution calculations of a prestressed crystalline material with hexagonal symmetry. We present a new resonator type, triangline, whose geometry has three-fold symmetry and follows the Al-N bonds in the crystal structure. Importantly, this hierarchically-clamped triangline provides a central pad that we pattern with a photonic crystal (PhC), which allows us to engineer the pad’s out-of-plane optical reflectivity [37, 38, 39, 40].
II Results
II.1 Fabrication
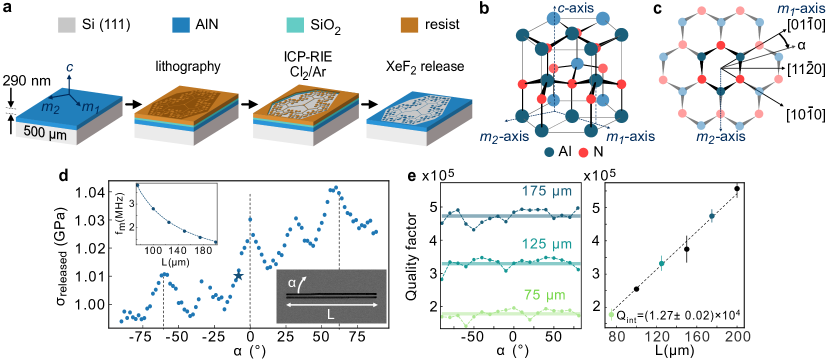
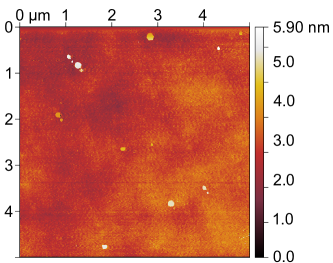
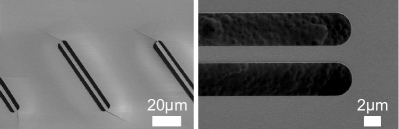
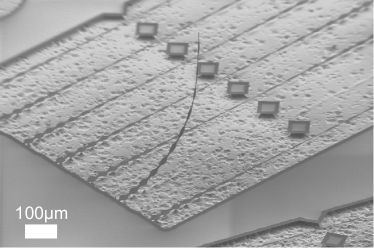
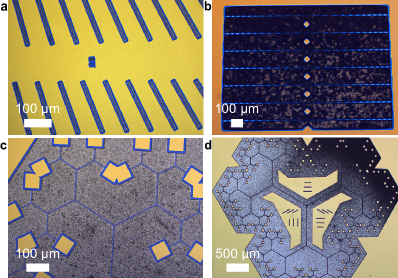
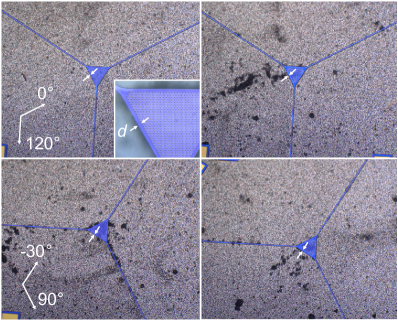
The fabrication process steps are summarized in Fig. 1a (details in Supplementary Information). The -thick wurzite AlN is grown by metal-organic vapour-phase epitaxy (MOVPE) on a (111)-oriented -thick Si wafer. The roughness of the grown film is (root mean square, AFM data in Supplementary Information). The resonator geometry is defined by electron-beam lithography. The exposed pattern is then transferred to the underlying AlN layer by ICP-RIE etching with a Cl2/Ar mixture using a SiO2 hard mask. Subsequently, the resist and hard mask are removed and in a final step the AlN resonators are released in a dry release step with XeF2. Such isotropic release allows the pattern to be independent from the substrate orientation, which is not possible with a KOH release etch of Si3N4 on a Si(100) wafer [12], but similar to a dry release etch of amorphous SiC [41] or Si3N4 [6] on Si. Furthermore, through the dry release process we achieve a high fabrication yield of above 90%. This is contrary to a wet release (e.g., KOH-based), which requires additional lithography, etching steps and critical point drying, to increase the membrane-substrate gap and ensure high fabrication yield for large area resonators [12]. The presented fabrication process allows the realization of a range of high- nanomechanical resonator geometries including, but not limited to, uniform beams (inset Fig. 1d), tapered 1D PnC beams (Fig. 2a, b), and hierarchically-clamped trianglines (Fig. 3a).
II.2 Material characterization
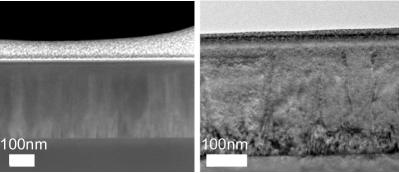
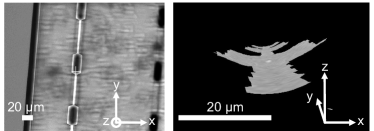
Wurtzite AlN belongs to the space group with a polar axis along the [001] direction, i.e., the -axis. We illustrate its crystal structure in Fig. 1b and Fig. 1c. The AlN crystal has a 19% lattice-mismatch with the silicon substrate underneath [42], thus, its atoms are displaced from their equilibrium positions resulting in an approximately -thick defect-rich layer at the interface of the AlN film and the Si substrate [43] (TEM images in Supplementary Information). The quality of the film improves further away from the substrate [44], while at the same time introducing a strain gradient.
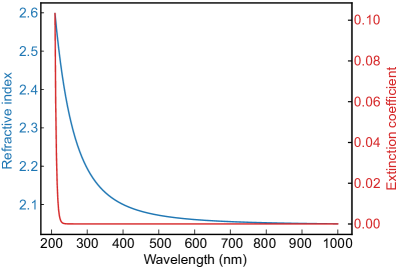
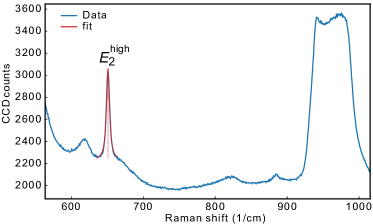
The AlN film has a thickness of and a refractive index of 2.1 in the telecom range, determined via ellipsometry (see Supplementary Information). We determine the strain by Raman measurements of the AlN phonon mode [45]. We observe at cm-1, which corresponds to an average residual stress of the AlN film, , of as targeted in the film growth (see Methods IV.3). For simplicity, we assume that the AlN crystal exhibits hexagonal symmetry (for details see Supplementary Information), which yields relations for the elastic constants as , and . Deformations in the -plane of the hexagonal crystal are then determined by two elastic constants only [46], making the model comparable to isotropic materials, like amorphous Si3N4.
To measure the released stress and evaluate the intrinsic mechanical quality factor, , we pattern beams of various lengths (75 to ) and rotation angles ( to +), as illustrated in the inset of Fig. 1d. The AlN beams have stress-dominated mechanical frequencies, , with the fundamental mode frequency given as [47]
| (1) |
where is the length of the beam and is the AlN density (parameters in Methods, Tab. 3). We measured and of the beams in high vacuum ( ) at room temperature using an optical interferometric position measurement setup (details in Methods IV.4). We determined Young’s modulus of the AlN film to be from measurements of the resonant frequencies of higher order modes of the beam [47] (see Supplementary Information). The released stress of the beams extracted from measurements of their fundamental mode frequencies using Eq. 1 is shown in Fig. 1d. The released stress is close to the expected value of = (with is the Poisson ratio). Instead of a constant released stress expected from a hexagonal symmetry, we observe a weak in-plane anisotropy. We obtain a small periodic stress variation with an amplitude of about . We attribute the -periodicity to the AlN crystal structure [48] and the additional -periodicity could be the result of crystal twinning [49] (for the discussion see Supplementary Information).
The quality factor of a strained high-aspect-ratio mechanical resonator is enhanced by the dilution factor, , over the intrinsic quality factor, , via [11]
| (2) |
While is a material property, inversely proportional to the delay between stress and strain, is engineered by the resonator geometry and depends on the linear and non-linear dynamic contributions to the elastic energy of specific mode shapes (see Methods for the explicit formulae).
We determine from measurements of of the long, thin strained beams. Their quality factor is limited by dissipation dilution and given as [50]
| (3) |
with , the stress parameter , and determined from Raman measurements of beams (see Supplementary Information). Fig. 1e shows for beams of various lengths and in-plane orientations. We obtain for the -thick AlN film by fitting the data to Eq. 3. We use this value of as input for calculating the expected of various mechanical resonator geometries from finite element model (FEM) simulations.
II.3 Tapered phononic crystal beams
Strained doubly-clamped beams exploit uniform stress for dissipation dilution, but they exhibit considerable bending at the clamping points leading to mechanical loss. Through the use of soft-clamped resonator designs [9, 10, 11], clamping-related bending losses can be eliminated. A straight-forward approach to implement soft clamping for a beam is to pattern it with a 1D PnC [10]. As a result, the -product of a defect mode in a PnC beam increases in comparison with uniform beams of similar frequency (see Fig. 2j).
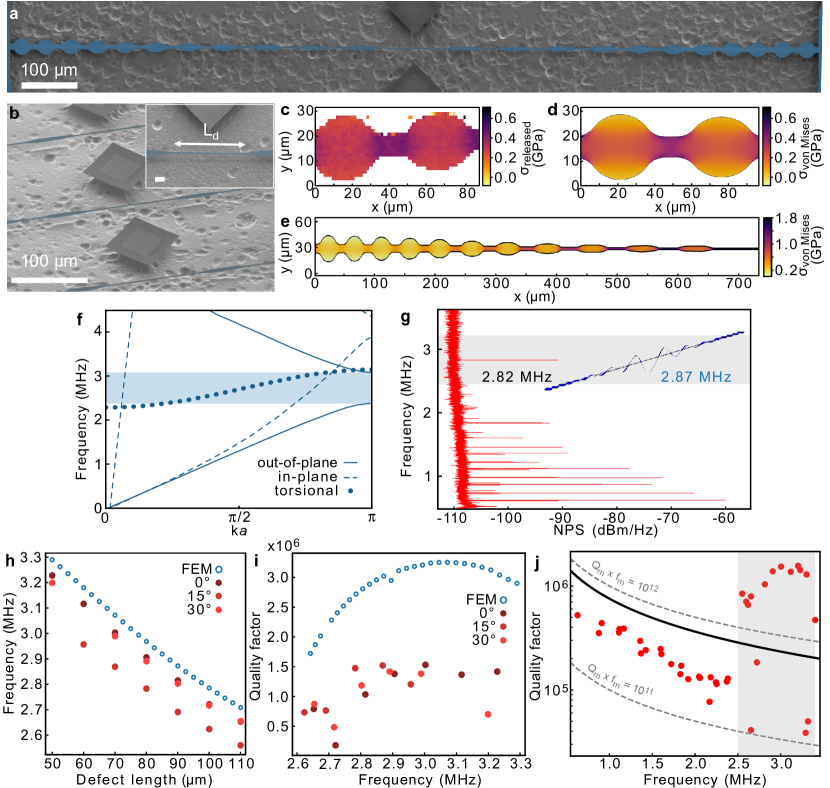
We pattern -long beams with a PnC. We additionally taper the width of the beam towards the center to co-localize a mechanical defect mode in the region of increased stress, which is a strain engineering method to further increase [10]. Fig. 2a, b show examples of fabricated devices.
The unit cell of the 1D PnC has a length at the tapered center and consists of a rectangular-shaped bridge of width and an ellipse with a long axis of and short axis . The sharp edges at their junction are rounded with a radius of . The rounded shapes are essential features as sharp corners that usually characterize these designs would lead to cracking of the highly stressed, brittle AlN film (see Supplementary Information for more details). This unit cell is repeated 11 times in both directions from the center defect. We upscale the width of both the bridge (to realize tapering) and ellipse of the unit cells towards the clamping points. The width of the iteration of the unit cell, scales as a Gaussian with (with and , ) [10]. At the same time we scale the length of the unit cell as to adapt the bandgap of each cell to the frequency of the defect mode [10].
Fig. 2f shows the band diagram for the unit cell (Supplementary Information shows band diagrams of additional unit cells). We can classify the mechanical modes in this band diagram with regards to their parity under transformations where , for example, . Such transformations applied to the displacement vector yield, for example, [51]. We observe a bandgap between 2.5 and for out-of-plane modes with symmetry. In-plane and torsional modes cross this bandgap, but these modes do not couple to the out-of-plane motion due to symmetry (see Supplementary Information for the simulated displacement of the modes and a description of their transformation under parity operations) [52].
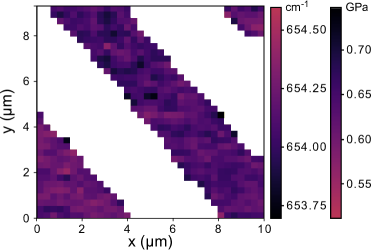
The defect is formed at the middle of the PnC beam through the insertion of an additional bridge of length between the unit cells, see Fig. 2b, such that the defect mode frequency is within the effective bandgap [10]. This allows for soft-clamping of the defect mode and, at the same time, focuses the stress through the tapering of the bridges at the center. We perform Raman measurements of a fabricated PnC beam to assess its stress distribution. Fig. 2c shows results for two unit cells near the clamping point. We observe a good match between the FEM simulated and measured and of the PnC beam for = , Fig. 2c-d and Fig. 2h. The measured residual stress of the unreleased AlN film next to the PnC is, however, the same as on other samples, i.e., = (inferred from Raman measurements). The discrepancy between the measured residual stress, , and the FEM assumed may be the result of inhomogeneous strain distribution of the AlN film, leading to partial stress relaxation and buckling of the ellipse regions in the PnC beam, thus, reducing locally its stress (see Supplementary Information).
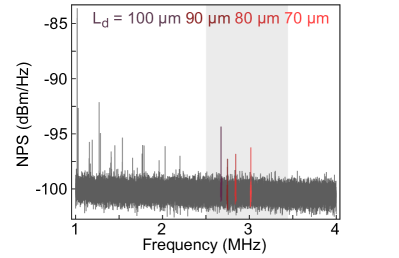
Fig. 2g shows a thermal noise displacement power spectrum (NPS) of a PnC beam with . The defect mode is clearly visible at , which is very close to the value obtained from FEM simulations. We summarize measurements of the defect mode frequency for PnC beams of different defect mode lengths and in-plane orientation in Fig. 2h (NPS of several beams are shown in Supplementary Information). The frequency of the defect mode decreases with increasing defect length , as expected from the FEM simulations, and is close to the simulated value. Furthermore, the defect mode frequency for the beam at orientation and are similar, while at is lower, see Fig. 2h. This observation is consistent with the in-plane angular dependence of of the uniform beams (Fig. 1d). Fig. 2i shows of the defect modes. We observe no systematic change in the quality factor with beam orientation, similar to the in-plane rotated uniform beams (Fig. 1e). While the trend of the measured versus defect mode frequency follows the trend of the FEM simulations, the absolute value is about a factor of two different. This difference may be the result of buckling of the ellipses and fabrication imperfections (see Supplementary Information), breaking the symmetry of localized defect modes and leading to mechanical dissipation through radiation loss into modes of other symmetry.
Fig. 2j shows of delocalized and localized modes of the PnC beams. We observe that mechanical modes within the defect mode frequency range of to exhibit an enhanced -product. We reach a maximal -product of up to Hz, which is larger than the one of uniform beams of similar frequency (solid line in Fig. 2j). This confirms the soft clamping of the defect mode through the strain-engineered PnC.
II.4 Hierarchically-clamped triangline resonators
Optomechanical experiments with a Fabry-Pérot-type cavity require efficient and lossless coupling of a mechanical resonator’s out-of-plane displacement to an optical beam. A mechanical resonator should then provide a non-absorbing, out-of-plane oscillating part with a sufficiently large area for accommodating an optical beam. This can be realized, for example, with trampoline-like resonators [53, 54, 17]. To increase their , a type of soft clamping based on hierarchical structures can be applied [55]. That has been demonstrated in Si3N4-based hierarchically-clamped trampolines [12] and trampoline-like geometries found by machine learning [14]. Further, the trampoline geometry typically realizes a high- for its fundamental mode, which is advantageous to use in certain quantum optomechanics protocols when nonlinear noise processes, such as thermal intermodulation noise [56], should be minimized. Finally, the central pad of a trampoline can be patterned with a PhC allowing to engineer its out-of-plane reflectivity [37, 53, 17].
A hierarchically-clamped trampoline consists of a central pad that is connected to four beams of length . Each of these beams branches with an angle into two subsequent segments, with such branching iterations in total towards the clamping points [55]. The length of subsequent segments () is with and segment width to maintain a uniform stress in the structure [55].
We first studied the effect of the branching angle on the -product of uniform-width beams in the crystalline AlN film. To this end, we fabricated beams with branching iteration and varied their branching angle (see Supplementary Information). We find that yields singly-branched beams with a large -product. At the same time, a geometry with this branching angle follows the in-plane crystal structure of AlN, advantageous for achieving homogeneous stress along all directions of the branched tethers, resulting in uniform stress in all branched segments [55].
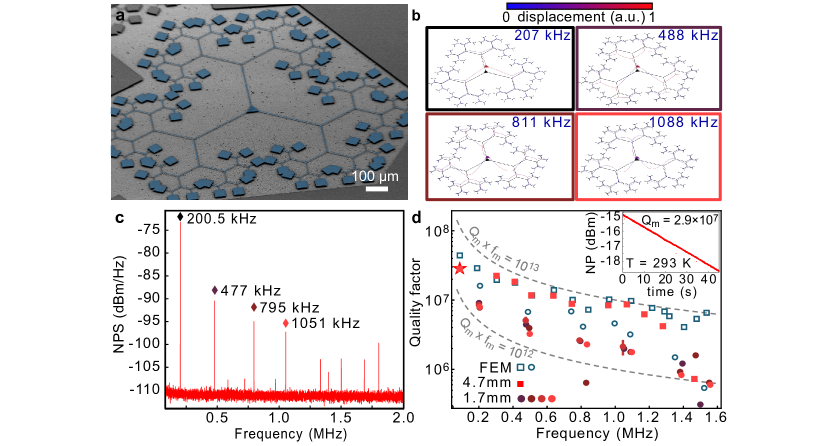
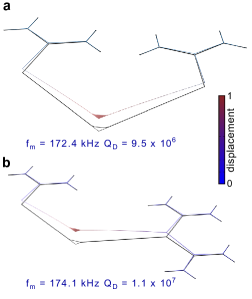
To follow the in-plane rotation symmetry of the crystal, we use a triangular-shaped central pad that is suspended with three tethers. Each of the tethers branches off times at into two segments (see Fig. 3a). We call this geometry triangline. When comparing this triangline with a hierarchically-clamped trampoline, we find that the expected and of these two structures are very similar (see Supplementary Information). An important advantage of the triangline geometry is that it enables a more economic use of the chip area, which allows us to increase the number of total branching iterations, and, thus, results in a larger .
We fabricated two generations of trianglines that differ in their branching iterations and initial beam lengths . Both generations have a central pad that is patterned with a PhC and has a side-length of . The pad is held by beams of constant width and . We round the sharp edges of the triangline with a radius of to avoid cracking during fabrication. The first generation of trianglines, denoted as short, has branching iterations and an initial beam length of . This yields a total tether-length between furthest clamping points of . We simulate the first four eigenmodes and eigenfrequencies of this triangline, which are shown in Fig. 3b. The eigenfrequencies experimentally inferred from the measured thermal noise displacement power spectrum (Fig. 3c) agree with FEM simulation results. We measured and of four devices and show the results in Fig. 3d. For the fundamental mode of the short triangline we find with , yielding a -product of Hz. We find that the FEM-predicted and are in a good agreement with the measured values. Hence, we conclude that is limited by intrinsic dissipation (gas damping is not limiting dissipation mechanism, see measurements in Supplementary Information).
To increase , we fabricate a second generation of trianglines, which we denote as long, with one more branching iteration, i.e., , and a longer initial beam length, , resulting in a total tether length of between furthest clamping points (see Supplementary Information). This triangline exploits to the best of our knowledge the largest number of branching iterations demonstrated to date for trampoline-like hierarchically-clamped resonators [12]. The longer tether length lowers the fundamental mode eigenfrequency to while improves up to (inset of Fig. 3d), yielding a -product of , which is larger than for the fundamental mode of the short triangline. For higher order modes, the -product reaches , entering the regime of coherent oscillations for quantum optomechanics experiments at room temperature (required [57]). For the long triangline, we find a good agreement between FEM simulated and experimentally observed and (Fig. 3d).
| Length () | () | m () | (aN/) | |||
| 1D | ||||||
| uniform beam | 200 | 1400 | 0.047 | |||
| Defect in 1D PnC | 80 | 3000 | 0.35 | |||
| 2D | ||||||
| PhC membrane | 180 | 2000 | 0.9 | |||
| Short triangline | 1700 | 200 | 1.22 | |||
| Long triangline | 4720 | 87 | 2.67 | |||
| Long triangline | 4720 | 1068 | 5.27 | 258.2 |
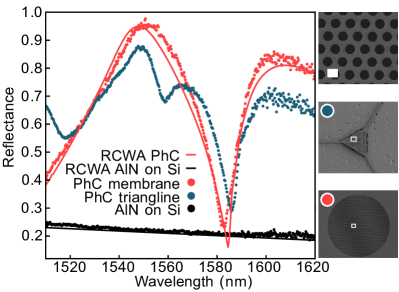
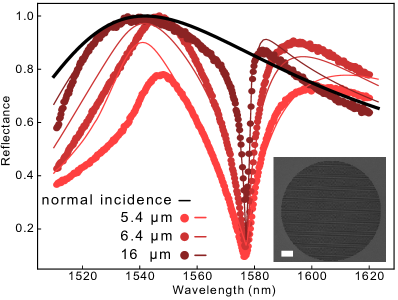
The optical reflectivity of an unpatterned AlN film is determined by its thickness and refractive index. For the -thick AlN film at a wavelength of the reflectivity is below 25% (see Fig. 4). To increase it, we pattern the central pad of the triangline with a PhC [37, 40], as shown in Fig. 4. We pattern a hexagonal PhC with lattice constant and hole radius into the AlN film to maximize its reflection of a normally-incident Gaussian beam at a wavelength of . The PhC parameters were obtained from simulations of the suspended film’s reflectivity using rigorous coupled-wave analysis (RCWA) [58] (see Supplementary Information).
We patterned first a fully-clamped circular diameter AlN membrane with a PhC and observe that its reflectance is increased to above 90%, see Fig. 4. The circular clamping guarantees a uniform connection of the membrane to its support, but lowers , see Tab. 1. We observe pronounced reflectivity dips at and . The first apparent dip originates from the Fano shape of the PhC reflectance. The second dip can be reproduced by RCWA simulations of the patterned -thick AlN film with an incident Gaussian beam of waist. We thus identify the dip at as coupling of the beam into a PhC guided resonance [38] (see Supplementary Information for further reflectance measurements with varying optical waist). We then patterned a PhC into the triangline’s central pad and observe that its reflectance reaches a value above 80% at . Thus, the reflectance of the triangline’s pad is drastically increased over the AlN film’s reflectivity, but is slightly lower than the reflectance of the PhC-patterned circular membrane. The radius of the PhC holes of the triangline and the circular membrane differs by . This causes a small shift of the overall Fano resonance to longer wavelengths. As a result, the PhC guided resonance appears now at and the minimum of the Fano resonance at . We also observe a reflectivity dip at . We identify this dip as the formation of an approximately -long low-finesse cavity between the PhC and the rough silicon substrate underneath. The overall lower reflectivity compared to the circular PhC membrane may be the result of the low-finesse cavity and the finiteness of the PhC lattice on the pad, which both influence the pad’s reflectivity. In future devices the reflectivity properties of the triangline’s PhC pad could be improved by using a larger pad size to minimize finite-size effects and to introduce an additional etch-stop layer on top of the Si substrate for realizing a high-finesse cavity between the PhC and the topmost underlying surface [59].
III Discussion
Tab. 1 summarizes the parameters of the soft-clamped nanomechanical resonators that we realized in -thick crystalline AlN. We calculated the thermal force noise to assess their performance in sensing applications. For example, with the fundamental mode of the long triangline we reach 29.2 aN/, which is similar to conventional Si3N4-trampolines [53, 54] or hierarchically-clamped Si3N4 trampolines [12].
| Si3N4 [60] | SiC [41] | Si[19] | SiC [18] | In0.43Ga0.57P[17] | AlN 111This work. | |
| crystallinity | amorphous | amorphous | diamond cubic | zinc blende | zinc blende | wurtzite |
| thickness (nm) | 20 | 71 | 14 | 337 | 73 | 290 |
| at | 1.99 | 2.56 | 3.48 | 2.56 | 3.15 | 2.12 |
| (GPa) | 1.14 | 0.76 | 1.53 0.11 | 0.62 | 0.47 | 1.43 |
| (GPa) | 250 | 223 | 169 | 400 | 80-120 | 270 |
| (%) | 0.46 | 0.34 | 0.85 0.06 | 0.15 | 0.49 | 0.36 |
| (GPa) | 0.87 | 0.62 | 1 | 0.51 | 0.3-0.5 | 1 |
| piezoelectricity, 222 Wurtzite crystal: uniaxial strain along the -axis . zinc blende: uniaxial strain along the direction with an additional contribution from another polar direction [61]. (-2) [61, 20] | - | - | - | -0.23 | -1.55 | |
| coupling coefficient, (%) [62] | - | - | - | 0.08 | 0.04 | 5.6 |
| relative permittivity, | 7-8 | 9.7 | 11.7 | 9.7 | 11.7 | 10 |
To put crystalline AlN into perspective with other materials used for high- nanomechanics, we summarize important material properties in Tab. 2. The residual stress of of the AlN film is similar to state-of-the-art strained crystalline Si or amorphous Si3N4. The AlN film’s of at room temperature is comparable to SiC or Si3N4 of similar thickness [63]. The of crystalline materials can, however, surpass the one of amorphous materials at cryogenic temperatures [64, 19]. The refractive index of AlN at telecom wavelengths is similar to that of Si3N4, but lower than for Si or InGaP. However, we demonstrated that the reflectance of the suspended AlN film can be vastly increased through patterning of a hexagonal PhC. Thanks to its bandgap of 6.2 eV, and wide transparency window from the deep ultraviolet to mid infrared, AlN is an appealing material for low-loss quantum optical devices [30]. The use of AlN for quantum optomechanics devices operating at cryogenic temperatures may therefore improve device performance that is currently hampered by heating due to optical absorption.
A major advantage of using crystalline compared to amorphous materials for nanomechanical resonators is their in-built functionality. For example, crystalline films can be conducting or superconducting, or can exhibit piezoelectricity, provided they lack inversion symmetry. Zincblende or wurtzite crystals like SiC, InGaP and AlN meet the latter requirement. AlN has the largest piezoelectric coupling coefficient [61] among these materials (see Tab. 2). This has already been exploited in AlN-based GHz nanomechanics, where mechanical excitations, phonons, have been interfaced with superconducting qubits [24, 25].
The presented triangline AlN nanomechanical resonators reached a -product close to Hz (see Tab. 1), sufficient to support a single quantum coherent oscillation at room temperature. We foresee multiple ways to increase device performance further by, for example, using other geometries, such as hexagonal polygon resonators [65], by reducing the thickness of the AlN film, or by operating at low temperatures. This could result in of up to and a -product of Hz (see Supplementary Information), similar to crystalline Si nanomechanical resonators [19], but then realized in a piezoelectric material. Therefore, nanomechanical resonators from piezoelectric, tensile-strained AlN films hold great promise for interfacing kHz or MHz phonons with superconducting circuits for cavity quantum optomechanics [22], direct piezoelectric read-out of AlN-based nanomechanical resonators for sensing applications [66], or coupling of optical, mechanical and electronic degrees of freedom in the same material system [4].
IV Methods
IV.1 Growth and fabrication details
The AlN film was grown with MOVPE (metal-organic vapour-phase epitaxy, AIXTRON AIX 200/4 RF-S) on a 2-inch -thick highly As-doped silicon (111) wafer. After a thin metallic Al deposition, the growth of AlN was performed in two regimes. First were grown at a high growth rate with a surface temperature of , , and a high V-III ratio of 2500. Then the main AlN layer was grown at and a low V-III ratio of 25 with a surface temperature of . During the cooling process, strain is introduced due to the thermal expansion coefficient mismatch between the silicon substrate and the AlN film in addition to tensile strain during growth [67].
We start the fabrication process by sputtering a SiO2 hard mask. Subsequently, we define the pattern of the mechanical resonator in electron-beam resist (UV-60). Then we transfer the pattern into the hard mask and AlN film in consequent ICP-RIE etching steps with CF4/CHF3 and Cl2/Ar mixtures, respectively. We strip the photoresist with NMP (Remover 1165), and the sample is cleaned with one minute HF etching. To release the structure we use XeF2 gas to selectively etch silicon.
IV.2 Simulations
IV.2.1 Finite element simulations
We use the solid mechanics interface of COMSOL Multiphysics for FEM simulations. First we find a stationary solution to determine the redistribution of . The material parameters used for the simulations are listed in Tab. 3. Then, we enter this static solution into the eigenfrequency solver. Finally, we extract the eigenfrequencies and the mechanical displacement field , which we use further in the evaluation of .
The dilution factor is given by [11]
| (4) |
where the time-averaged and are the linear and non-linear dynamic contributions to the elastic energy of a specific mode shape, respectively.
To calculate of a crystalline mechanical resonator of thickness we resort to the general relation between the components of the stress tensor and the strain tensor through the elasticity matrix , i.e., . We use this relation and calculate an expression for the time-averaged linear elastic energy ,
| (5) | ||||
where is the out-of-plane displacement and the integral covers the volume of the mechanical resonator geometry. For details with regards to this calculation we refer to the Supplementary Information.333We supply a short Mathematica script for these calculations on linear contribution to the elastic energy for an anisotropic material [71]. In particular, this treatment covers isotropic materials and crystals with cubic, hexagonal and orthorhombic crystal systems. We use Eq. 5 to calculate for a given eigenmode of the resonator obtained from the FEM simulations. The expression for the calculation of the time-averaged non-linear contribution is related to the total energy of the system and remains unchanged
| (6) |
where is the eigenfrequency of the particular eigenmode [69]. We also evaluate this expression for a given eigenmode in the FEM simulations. We can subsequently calculate the dilution factor with Eq. 4 and obtain .
We determine the motional mass as
| (7) |
where we integrate over the entire geometry with the displacement and the maximum displacement of that particular eigenmode.
| thickness, (nm) | 290 |
|---|---|
| density, (kg/m3) | 3255 |
| (GPa) | 1.4444Note, that differs for the PnC beam simulations and is . |
| (GPa) | 345 |
| (GPa) | 395 |
| (GPa) | 118 |
| (GPa) | 125 |
| (GPa) | 120 |
| (GPa) | 283 |
| 0.287 |
The values of the elastic constants are chosen from the measurements on AlN films [70] with the resulting Young’s modulus close to the one determined in this work, . It should be noted that the difference between the reference parameters [70] and the presented AlN film could be a reason for the small discrepancies of between the FEM simulation and the experiment.
IV.2.2 Reflectance
We use a rigorous coupled wave analysis (RCWA) solver, which is available as the Stanford Stratified Structure Solver () software package [58]. The focused Gaussian beam with a waist is reconstructed as a superposition of plane waves impinging on the PhC [38]. The value of the PhC parameters (, ) is determined after fabrication via analysis of SEM images. The radius of the PhC holes in the PhC pattern of a circular membrane is and in the case of the triangline it is . The small difference in results in the slightly different position of the guided mode at observed in Fig. 4.
IV.3 Raman spectroscopy
Residual stress and strain of the AlN film is evaluated by means of Raman scattering using a confocal Raman microscope at room temperature. A laser is used for excitation and was focused down by an objective lens with a magnification of 100 and a numerical aperture of 0.9, leading to an optical spot size of about . We verified that the Raman signal is power independent and, thus, not affected by a potential heating of the device. Note that the calculation that relates the wavelength of the Raman line to the stress and strain in the AlN film is outlined in the Supplementary Information.
IV.4 Interferometric characterization setup
The measurements of AlN resonators are performed at mbar and at room temperature, using optical interferometry driven by a tunable laser with a wavelength of 1550 nm, see Fig. 5.
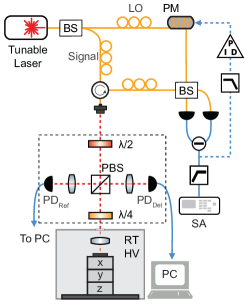
The laser beam is reflected off the sample inside a vacuum chamber, and we detect the resulting phase shift using a phase-locked homodyne detector and record its output signal with a spectrum analyzer (SA). The ring-down measurements are performed by resonantly driving the sample with a piezoelectric transducer, switching it off and then recording the decay of the signal.
To measure the reflectance of the samples, we adjust the polarization with a half-wave plate before the polarizing beam-splitter (PBS) and monitor the incoming laser power via a reference photodetector, . The output from is fed back to the laser to stabilize the laser power throughout the wavelength-sweep. After the PBS we insert a quarter-wave plate to detect the reflected intensity with the photodetector.
Acknowledgements.
We thank Nils Johan Engelsen for valuable discussions and comments on the manuscript. This work was supported by the Knut and Alice Wallenberg (KAW) Foundation through a Wallenberg Academy Fellowship (W.W.), the KAW project no. 2022.0090, and the Wallenberg Center for Quantum Technology (WACQT, A.C.), the Swedish Research Council (VR projects No. 2018-05061 and 2019-04946), the QuantERA project C’MON-QSENS!, and Chalmers’ Area of Advance Nano. H.P. acknowledges funding by the European Union under the project MSCA-PF-2022-OCOMM. MOVPE of AlN on Si was performed at Otto-von-Guericke-Univerrsity Magdeburg. The mechanical resonators were fabricated in the Myfab Nanofabrication Laboratory at Chalmers and analyzed in the Chalmers Materials Analysis Laboratory. Simulations were performed on resources provided by the National Academic Infrastructure for Supercomputing in Sweden (NAISS) partially funded by the Swedish Research Council through grant agreement no. 2022-06725.Data availability
Data underlying the results presented in this paper are available in the open-access Zenodo database: https://doi.org/10.5281/zenodo.10679216 [71].
Supplementary Material
Appendix A Material characterization
A.1 Transmission electron microscopy
We perform TEM imaging to verify the thickness and quality of the MOVPE-grown AlN film on Si (111). A large dislocation density is found in the interface layer between AlN and the Si substrate. Further away from the substrate, the AlN forms regions of dislocations and misoriented domains. However, the quality of AlN improves drastically with increasing AlN film thickness, as seen in the TEM image in Fig. S1.
A.2 Ellipsometry
A.3 Atomic force microscopy
We performed AFM measurements with an SPM Bruker Dimension 3100 in tapping mode at speed. The surface roughness of the AlN film prior to fabrication is (RMS) nm, which is comparable to the previously reported values of similarly grown MOCVD AlN films on Si(111) [73]. In Fig. S3 one can see a representative scan.
A.4 Elastic anisotropy
The elastic anisotropy of materials has a significant effect on their physical properties, such as deformation and crack propagation. In the following we provide equations in the case of plane stress for isotropic, cubic, hexagonal and orthorhombic cases. This is done to convert the results of Raman spectroscopy to the residual stress of the film and to derive the dissipation dilution factor. Then we show how to calculate uniaxial stress, which corresponds to measured stress of a suspended beam in Raman spectroscopy.
In the following the -axis coincides with the -axis of AlN and the , axes lie in the -plane.
A.4.1 General case
First, we take a general elasticity matrix which describes isotropic, cubic, hexagonal and orthorhombic cases:
| (S1) |
Then, in the case of a thin membrane of thickness , we obtain a plain stress condition, where the -components of the tensor are zero:
| (S2) |
Applying Eq. S2 to the stiffness matrix S1 leads to the following strain relations:
| (S3) |
A.4.2 Hexagonal symmetry
The elasticity matrix of the hexagonal crystal is described by 5 elastic constants (see Table III) [74]:
| (S4) |
and the Cauchy relation
| (S5) |
For the hexagonal crystal, Young’s modulus and Poisson’s ratio are isotropic in the plane perpendicular to the -axis.
A.4.3 Biaxial stress
The as-grown hexagonal membrane is under equi-biaxial stress, . Then the stress tensor can be derived from the matrix Eq. S4 as
| (S6) |
| (S7) |
For a thin membrane we apply the plane stress condition555 denote the stress and strain, respectively, for the case of plane stress in a membrane out of material with hexagonal symmetry, Eq. S2 (). Then one obtains the stress- and strain-component relationship for a hexagonal crystal as
| (S8) |
| (S9) |
which we use further to evaluate the residual stress of the AlN film on the Si substrate from Raman measurements.
A.4.4 Uniaxial stress
For uniaxial stress666 denotes the stress and strain, respectively, for the case of in a beam, , as in the case of the beam, vanishes and, hence, an elastic relaxation occurs. The resulting in-plane strain is expressed by the Poisson ratio and is defined by the elastic constants in Tab.III. The strain components are calculated as
| (S10) |
| (S11) |
| (S12) |
We observed in the experiment, is anisotropic, which would require us to lower the symmetry from hexagonal to trigonal and introduce to obtain -periodicity. This is expected, as wurtzite AlN is a hexagonal system, however, the 6-fold axis is absent. This means that if we rotate the AlN crystal around -axis by (top view Fig. 1b in the main text) aluminum atoms will be above nitrogen position and therefore the AlN crystal is not reproduced upon this transfomation. As predicted by Neumann’s Principle states [77]: “The symmetry of any physical property of a crystal must include the symmetry elements of the point group of the crystal”, hence one would anticipate the weak -plane anisotropy of . An important work [48] on GaN showed a strong crystallographic orientation dependence of the sliding properties with a periodicity of wear rate and friction coefficient. The anisotropy in friction comes from the energetic barriers derived from the crystalline structure that governs wear. Such wear tests are, in essence, the measure of the material change with application of a uniaxial force. Therefore, if the beam relaxes anisotropically this leads to anisotropic .
Nevertheless, in the stress, strain and FEM evaluation we assume hexagonal symmetry of AlN, as the anisotropy is weak and only 5 elastic constants are available in literature.
A.5 Raman spectroscopy
In the experiment we have access to the strained unreleased AlN film on Si (equi-biaxial case, Eq. S8) and released AlN beams (uniaxial case). Prior measurements we verify that the Raman spectrum doesn’t depend on the laser power. We start by measuring equi-biaxial strain and then link it to uniaxial strain in the beam.
In Fig. S4, one can see that the AlN film exhibits peak at 650.67 cm-1 and (TO) at 618 cm-1.
As the chemical bond length increases, while the force constant remains the same, the vibrational frequency decreases. In tensile-strained materials the Raman peak position is shifted to lower frequencies [73]. As the relaxed value of the AlN phonon frequency we take the bulk AlN crystal value of 657 cm-1 [78].
In the equi-biaxially strained case, a frequency shift is determined by the deformation potential constant as [45]
| (S13) |
where cm-1/GPa [73] for AlN and one can directly evaluate . Then it is possible to determine the in-plain strain using Eq. S9 and Eq. S8 to be and . The released stress of the beam is related to the residual stress as , which matches well with the fitted obtained from measurements of beams presented in the main text.
By mapping the fitted value of on the suspended beams we observe the local strain variation in suspended AlN.
In case of the uniform beam the released mode position remains constant, see Fig. S5. While with the width variation in the PnC beam, the strain is higher at the narrow parts and approaches the suspended uniform beam frequency, as can be seen in Fig. 2 in the main text. At the wide parts of the PnC beam, i.e., the elliptic wings, AlN is relaxed and the mode is at the bulk crystal value of 657 cm-1.
A.6 Young’s modulus determination
We used -long uniform beams to evaluate the Young’s modulus of the AlN film following the method presented in Ref. [47]. We measured higher-order mode frequencies () of the beams. Young’s modulus can then be obtained as
| (S14) |
where are the higher-order mode frequencies [47].
As crystalline materials demonstrate elastic anisotropy [17, 79], we performed measurements for beam in-plane orientations , , and .
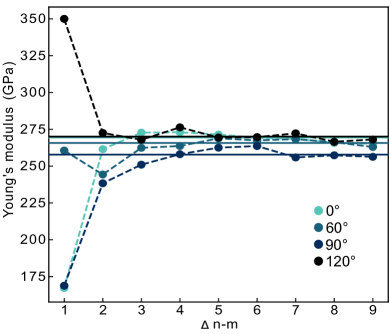
In Fig. S6 we observe and mean values of the Young’s modulus corresponding to -oriented beam and , , -oriented beams, respectively. This result highlights that the AlN film has 3-fold in-plane symmetry, meaning that a rotation of the crystal structure results in the same atomic arrangement as before the transformation. A in-plane rotation of AlN effectively has the same chain of Al-N bonds, resulting in the same elastic properties and therefore the value for Young’s modulus at and orientations.
Appendix B Dissipation dilution
To derive an expression for the dissipation dilution, we follow the approach that was outlined in Ref. [69]. In the theory of elasticity, which describes the mechanics of deformations, the displacement of every point in the membrane is defined through a displacement vector . The definition of strain777The indices run over , and . is
| (S15) |
where we have the linear and nonlinear contributions to the strain [69]. In most cases the material enters the plastic regime, before the nonlinear contributions become relevant. However, structures with reduced dimensions, such as nanomechanical resonators with a large aspect ratio, the linear contribution can be equal to zero while the nonlinear contribution is dominant [69]. The elastic energy that is stored in such a structure is given as [69]
| (S16) |
where refers to the stress tensor. Since we focus on the dynamics of the system, we separate the static deformation and the time-dependent displacement field [69]. One can apply this treatment to strain , stress and elastic energy generated through the acoustic field. We refer to the time-dependent term with [69] and the strain can be written as
| (S17) |
B.1 Anisotropic case
Now we apply a plain stress, Eq. S2, on a nanomechanical resonator of thickness with an elasticity matrix of a general form Eq. S1. Since we are only concerned with flexural membrane modes, the membrane is completely characterized through a slice at and [69]. In the neutral plane the distances between the points do not change upon small flexural deformations. This constrains the in-plane components of the displacement as
| (S18) |
When we insert Eq. S18 into Eq. S15, the general equation for the strain is
| (S19) |
where we can replace through its time-dependent part [69]. When we insert Eq. S19 in Eq. S16, integrate over the entire mechanical resonator, and take the time-average, we receive the result for in Eq. 5 in the main text. The non-linear contribution to the elastic energy is [69]
| (S20) |
With these two contributions we can calculate the dissipation dilution factor as [69]
| (S21) |
B.2 Isotropic case
For the isotropic case the stiffness matrix has the form:
| (S22) |
with .
When we replace the components in Eq. 5 with the components for the isotropic case, we regain the expression for [11]
| (S23) |
Appendix C Mechanical resonator characterization
C.1 Rounding corners
In strained AlN film, we observed crack formation similar to other crystalline material, like InGaP [17]. The concentration of stress in sharp corners leads to the formation of cracks along certain crystal directions. AlN shows -orientation of the cracks, as seen in Fig. S7. To overcome this, it suffices to make at least rounding of corners, which we implemented in all geometries.
AlN has a large residual stress in the film and tends to bend up if the suspended area is not strained, where it can partially relax. For instance, the trapezoid PnC pattern demonstrated strong buckling, see Fig. S8, and was prone to cracking if the corners were not rounded. Due to these undesired effects, we opted for elliptically-shaped forms in the unit cells of the 1D PnC beams.
The bending of free standing structures originates from the inhomogeneous strain in the grown AlN layers. One of the main contributions in such inhomogeneous strain comes from the defects at the interface between silicon and AlN film, which generate a more compressive strain component at the interface upon relaxation [20]. As a result cantilever-like structures bent up [20], as shown in Fig. S9.
We additionally show optical microscope images of suspended AlN nanomechanical resonators in Fig. S10.
C.2 1D PnC nanobeams: detailed FEM simulations and additional measurements
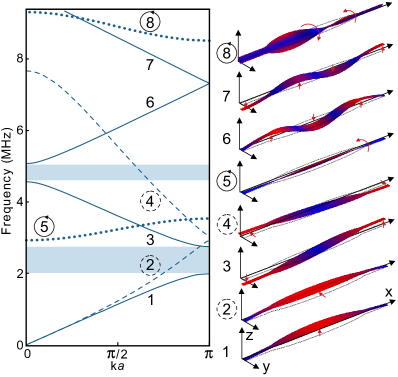
Fig. S11 shows the band diagram and mode shapes for a unit cell size of for . We categorize the mechanical displacement field of the different modes with regards to their symmetry under parity operations [51]. Here, , and refer to the coordinate the parity operation refers to. For instance, mode (1) and (3) transform under the parity operations as , while mode (2) transforms as . Modes that do not transform under the same parity operation do not interact unless the particular symmetry is broken. Therefore, the bandgap is created between modes (1) and (3), while mode (2) that crosses it transforms differently under parity transformations.
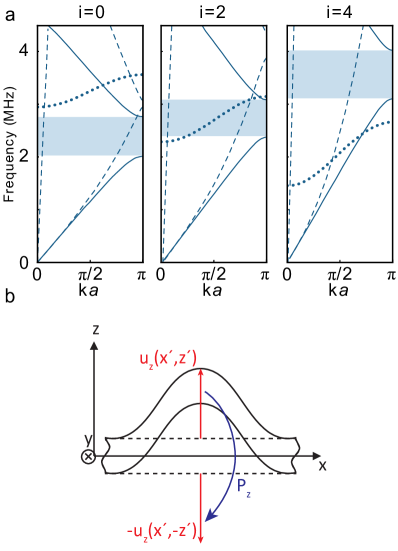
Fig. S12 shows band diagrams for three differently sized unit cells: has a size of , has a size of and has a size of . We observe that a mode that transforms under the parity transformation crosses the bandgap. When the symmetry with regards to the -axis is broken (e.g., through fabrication imperfections or buckling of the released devices), this mode could interact with the modes and reduce soft clamping, e.g., in the unit cell .
In Fig. S13 we display additional NPS spectra of four PnC beams with different defect lengths (70, 80, 90, ). As expected, the shorter the defect length, the larger the eigenfrequency of the defect mode. With the sweep of we obtain the defect mode crossing through the bandgap in Fig.2 in the main text.
C.3 Singly-branched nanobeams

We fabricated -long beams with one iteration of branching and investigated the and dependence on branching angle, , see Fig. S14. As seen in Fig. S14, the experimental values of follow closely FEM predictions with a maximum frequency around . While the FEM simulation predicts a maximum around , the experimental data shows a local maximum at and a global maximum at . The local maximum could be the result of the -periodicity of , which produces equal tension in the branched beams at . The global maximum at is expected according to the results of isotropic case [11]. We also plot the experimental -product in Fig. S14. We observe that the -product peaks at and , where the latter yields a slightly higher value.
We choose a branching angle of for fabricating the hierarchically-clamped traingline structures. This branching angle results in beam orientations that follow the -periodicity in , , at the same time it yields a large value.
C.4 Hierarchically-clamped triangline vs. trampoline resonators
We compare different trampoline-like geometries for the same central pad size. Specifically, we simulate a conventional trampoline (4 tethers) and the triangline (3 tethers) with the same prestress of the film ( = ), branching angle ( ), number of branching iterations (), constant width of the tether, and total tether-length of . We show the fundamental mode of the FEM simulations in Fig. S15. For this comparison we removed the PhC from the central pad. The mechanical frequency of the resonators varies only slightly in the FEM simulation, the trampoline’s = and triangline’s = . The mechanical quality factor is slightly higher for the triangline geometry: triangline has and the trampoline has .
Besides that the triangline with a branching angle of follows the in-plane crystal structure, it has the additional advantage of allowing to increase the number of branching iterations.
C.5 Optical reflectivity measurements
The central pad of the triangline is patterned with a hexagonal PhC. The same hexagonal PhC pattern was used for the -diameter circular membrane, Fig. S16. We varied the waist of the incident beam from 5 to and measured the reflectance of the patterned membrane. A lower reflectance is observed with a smaller beam waist due to higher oblique angles of incidence [81, 17]. In the main text, the reflectivity measurements were performed with a waist of a wavelength-tunable laser.
C.6 Trianglines orientation and filling with a PhC
We varied the in-plane orientation of the tethers of the triangline, (Fig. S17), to analyze how weak in-plane anisotropy of the elastic properties affect and . We find no major difference in nor , see Tab. 4. Furthermore, we varied the PhC area on the central -side-long pad, such that the distance of the PhC pattern to the edge, , changes from to . As can be seen in Tab. 4, in case of , the triangline is stiffer and exhibits a higher frequency.
| () | () | () | |
|---|---|---|---|
| 0 | 1.9 | 200.2 | |
| -30 | 1.9 | 200.7 | |
| 0 | 3.4 | 204.5 | |
| -30 | 3.4 | 204.9 |
C.7 Gas damping
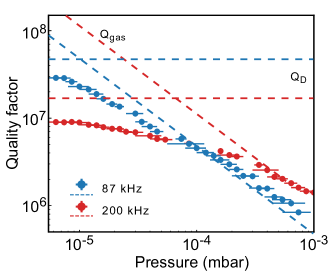
Fig. S18 shows the pressure dependence of the fundamental mode of trianglines. We observe that for pressures larger than the quality factor is pressure dependent and follows the prediction by viscous gas damping [82]:
| (S24) |
where is the molecular mass of the gas molecules, is the molar gas constant, and is the temperature of the gas. However, at pressures below , gas damping is not the limiting mechanism and we expect that the is limited by dissipation dilution.
C.8 Nanomechanical polygon resonators
A geometry to achieve high is a polygon-type resonator from Ref. [65]. For instance, for a six-sided polygon resonator the dilution factor of a sinusoidal standing wave in the perimeter beams of equal stress along all segments is given as [65]
| (S25) |
where is the ratio of the support length to the side-length of the polygon, is the ratio of the support width to the side-width of the polygon, is the perimeter mode order, and is the Poisson ratio.
The stress parameter of a uniform beam of length and thickness is . Then the fundamental perimeter mode of a hexagonal polygon with , reaches
| (S26) | ||||
| (S27) | ||||
| (S28) |
The same hexagon geometry can reach a of for a -thick AlN layer assuming that the material properties stay the same. With the eigenfrequency of the perimeter mode of we would obtain a -product of Hz.
References
- Sementilli et al. [2022] L. Sementilli, E. Romero, and W. P. Bowen, Nanomechanical dissipation and strain engineering, Advanced Functional Materials 32, 2105247 (2022).
- Eichler [2022] A. Eichler, Ultra-high-q nanomechanical resonators for force sensing, Materials for Quantum Technology 2, 043001 (2022).
- Westphal et al. [2021] T. Westphal, H. Hepach, J. Pfaff, and M. Aspelmeyer, Measurement of gravitational coupling between millimetre-sized masses, Nature 591, 225 (2021).
- Midolo et al. [2018] L. Midolo, A. Schliesser, and A. Fiore, Nano-opto-electro-mechanical systems, Nature nanotechnology 13, 11 (2018).
- Barzanjeh et al. [2022] S. Barzanjeh, A. Xuereb, S. Gröblacher, M. Paternostro, C. A. Regal, and E. M. Weig, Optomechanics for quantum technologies, Nature Physics 18, 15 (2022).
- Cupertino et al. [2023] A. Cupertino, D. Shin, L. Guo, P. G. Steeneken, M. A. Bessa, and R. A. Norte, Centimeter-scale nanomechanical resonators with low dissipation, arXiv preprint arXiv:2308.00611 10.48550/arXiv.2308.00611 (2023).
- Unterreithmeier et al. [2010] Q. P. Unterreithmeier, T. Faust, and J. P. Kotthaus, Damping of Nanomechanical Resonators, Physical Review Letters 105, 027205 (2010).
- Yu et al. [2012] P.-L. Yu, T. Purdy, and C. Regal, Control of material damping in high-Q membrane microresonators, Physical review letters 108, 083603 (2012).
- Tsaturyan et al. [2017] Y. Tsaturyan, A. Barg, E. S. Polzik, and A. Schliesser, Ultracoherent nanomechanical resonators via soft clamping and dissipation dilution, Nature nanotechnology 12, 776 (2017).
- Ghadimi et al. [2018] A. H. Ghadimi, S. A. Fedorov, N. J. Engelsen, M. J. Bereyhi, R. Schilling, D. J. Wilson, and T. J. Kippenberg, Elastic strain engineering for ultralow mechanical dissipation, Science 360, 764 (2018).
- Fedorov et al. [2019] S. A. Fedorov, N. J. Engelsen, A. H. Ghadimi, M. J. Bereyhi, R. Schilling, D. J. Wilson, and T. J. Kippenberg, Generalized dissipation dilution in strained mechanical resonators, Physical Review B 99, 054107 (2019).
- Bereyhi et al. [2022a] M. J. Bereyhi, A. Beccari, R. Groth, S. A. Fedorov, A. Arabmoheghi, T. J. Kippenberg, and N. J. Engelsen, Hierarchical tensile structures with ultralow mechanical dissipation, Nature Communications 13, 3097 (2022a).
- Shin et al. [2022] D. Shin, A. Cupertino, M. H. de Jong, P. G. Steeneken, M. A. Bessa, and R. A. Norte, Spiderweb nanomechanical resonators via bayesian optimization: inspired by nature and guided by machine learning, Advanced Materials 34, 2106248 (2022).
- Høj et al. [2021] D. Høj, F. Wang, W. Gao, U. B. Hoff, O. Sigmund, and U. L. Andersen, Ultra-coherent nanomechanical resonators based on inverse design, Nature communications 12, 5766 (2021).
- Cole et al. [2014] G. D. Cole, P.-L. Yu, C. Gärtner, K. Siquans, R. Moghadas Nia, J. Schmöle, J. Hoelscher-Obermaier, T. P. Purdy, W. Wieczorek, C. A. Regal, et al., Tensile-strained InxGa1-xP membranes for cavity optomechanics, Applied Physics Letters 104, 130788 (2014).
- Bückle et al. [2018] M. Bückle, V. C. Hauber, G. D. Cole, C. Gärtner, U. Zeimer, J. Grenzer, and E. M. Weig, Stress control of tensile-strained In1-xGaxP nanomechanical string resonators, Applied Physics Letters 113, 594332 (2018).
- Manjeshwar et al. [2023a] S. K. Manjeshwar, A. Ciers, F. Hellman, J. Bläsing, A. Strittmatter, and W. Wieczorek, High-Q trampoline resonators from strained crystalline InGaP for integrated free-space optomechanics, Nano Letters , 5076–5082 (2023a).
- Romero et al. [2020] E. Romero, V. M. Valenzuela, A. R. Kermany, L. Sementilli, F. Iacopi, and W. P. Bowen, Engineering the dissipation of crystalline micromechanical resonators, Physical Review Applied 13, 044007 (2020).
- Beccari et al. [2022] A. Beccari, D. A. Visani, S. A. Fedorov, M. J. Bereyhi, V. Boureau, N. J. Engelsen, and T. J. Kippenberg, Strained crystalline nanomechanical resonators with quality factors above 10 billion, Nature Physics 18, 436 (2022).
- Cimalla et al. [2007] V. Cimalla, J. Pezoldt, and O. Ambacher, Group iii nitride and sic based mems and nems: materials properties, technology and applications, Journal of Physics D: Applied Physics 40, S19 (2007).
- Brueckner et al. [2011] K. Brueckner, F. Niebelschuetz, K. Tonisch, C. Foerster, V. Cimalla, R. Stephan, J. Pezoldt, T. Stauden, O. Ambacher, and M. Hein, Micro-and nano-electromechanical resonators based on SiC and group iii-nitrides for sensor applications, Physica Status Solidi (a) 208, 357 (2011).
- Brubaker et al. [2022] B. M. Brubaker, J. M. Kindem, M. D. Urmey, S. Mittal, R. D. Delaney, P. S. Burns, M. R. Vissers, K. W. Lehnert, and C. A. Regal, Optomechanical ground-state cooling in a continuous and efficient electro-optic transducer, Physical Review X 12, 021062 (2022).
- Seis et al. [2022] Y. Seis, T. Capelle, E. Langman, S. Saarinen, E. Planz, and A. Schliesser, Ground state cooling of an ultracoherent electromechanical system, Nature Communications 13, 1507 (2022).
- O’Connell et al. [2010] A. D. O’Connell, M. Hofheinz, M. Ansmann, R. C. Bialczak, M. Lenander, E. Lucero, M. Neeley, D. Sank, H. Wang, M. Weides, et al., Quantum ground state and single-phonon control of a mechanical resonator, Nature 464, 697 (2010).
- Mirhosseini et al. [2020] M. Mirhosseini, A. Sipahigil, M. Kalaee, and O. Painter, Superconducting qubit to optical photon transduction, Nature 588, 599 (2020).
- Morkoç [2008] H. Morkoç, Handbook of Nitride Semiconductors and Devices (Wiley‐VCH, Weinheim, 2008).
- Kneissl and Rass [2016] M. Kneissl and J. Rass, III-Nitride Ultraviolet Emitters: Technology and Applications (Springer International, Cham, 2016).
- Xue et al. [2020] Y. Xue, H. Wang, N. Xie, Q. Yang, F. Xu, B. Shen, J.-j. Shi, D. Jiang, X. Dou, T. Yu, et al., Single-photon emission from point defects in aluminum nitride films, The Journal of Physical Chemistry Letters 11, 2689 (2020).
- Taylor and Lenie [1960] K. Taylor and C. Lenie, Some properties of aluminum nitride, Journal of the Electrochemical Society 107, 308 (1960).
- Liu et al. [2023] X. Liu, A. W. Bruch, and H. X. Tang, Aluminum nitride photonic integrated circuits: from piezo-optomechanics to nonlinear optics, Advances in Optics and Photonics 15, 236 (2023).
- Cleland et al. [2001] A. Cleland, M. Pophristic, and I. Ferguson, Single-crystal aluminum nitride nanomechanical resonators, Applied Physics Letters 79, 2070 (2001).
- Brueckner et al. [2005] K. Brueckner, C. Forster, K. Tonisch, V. Cimalla, O. Ambacher, R. Stephan, K. Blau, and M. Hein, Electromechanical resonances of sic and aln beams under ambient conditions, in 2005 European Microwave Conference, Vol. 3 (IEEE, 2005) pp. 4–pp.
- Pernice et al. [2012] W. H. P. Pernice, C. Xiong, C. Schuck, and H. Tang, High-Q aluminum nitride photonic crystal nanobeam cavities, Applied Physics Letters 100, 23786 (2012).
- Ghasemi Baboly et al. [2016] M. Ghasemi Baboly, S. Alaie, C. Reinke, I. El-Kady, and Z. C. Leseman, Ultra-high frequency, high Q/volume micromechanical resonators in a planar aln phononic crystal, Journal of Applied Physics 120, 143780 (2016).
- Sang et al. [2020] L. Sang, M. Liao, X. Yang, H. Sun, J. Zhang, M. Sumiya, and B. Shen, Strain-enhanced high q-factor gan micro-electromechanical resonator, Science and Technology of Advanced Materials 21, 515 (2020).
- Placidi et al. [2009] M. Placidi, J. Moreno, P. Godignon, N. Mestres, E. Frayssinet, F. Semond, and C. Serre, Highly sensitive strained AlN on Si (111) resonators, Sensors and Actuators A: Physical 150, 64 (2009).
- Fan and Joannopoulos [2002] S. Fan and J. D. Joannopoulos, Analysis of guided resonances in photonic crystal slabs, Physical Review B 65, 235112 (2002).
- Kini Manjeshwar et al. [2020] S. Kini Manjeshwar, K. Elkhouly, J. M. Fitzgerald, M. Ekman, Y. Zhang, F. Zhang, S. M. Wang, P. Tassin, and W. Wieczorek, Suspended photonic crystal membranes in algaas heterostructures for integrated multi-element optomechanics, Applied Physics Letters 116, 264001 (2020).
- Enzian et al. [2023] G. Enzian, Z. Wang, A. Simonsen, J. Mathiassen, T. Vibel, Y. Tsaturyan, A. Tagantsev, A. Schliesser, and E. S. Polzik, Phononically shielded photonic-crystal mirror membranes for cavity quantum optomechanics, Optics Express 31, 13040 (2023).
- Zhou et al. [2023] F. Zhou, Y. Bao, J. J. Gorman, and J. R. Lawall, Cavity optomechanical bistability with an ultrahigh reflectivity photonic crystal membrane, Laser & Photonics Reviews 17, 2300008 (2023).
- Xu et al. [2023] M. Xu, D. Shin, P. M. Sberna, R. van der Kolk, A. Cupertino, M. A. Bessa, and R. A. Norte, High-strength amorphous silicon carbide for nanomechanics, Advanced Materials , 2306513 (2023).
- Liu et al. [2003] R. Liu, F. Ponce, A. Dadgar, and A. Krost, Atomic arrangement at the aln/si (111) interface, Applied Physics Letters 83, 860 (2003).
- Mante et al. [2018] N. Mante, S. Rennesson, E. Frayssinet, L. Largeau, F. Semond, J. Rouvière, G. Feuillet, and P. Vennéguès, Proposition of a model elucidating the aln-on-si (111) microstructure, Journal of Applied Physics 123, 124215 (2018).
- Mastro et al. [2006] M. Mastro, C. Eddy Jr, D. Gaskill, N. Bassim, J. Casey, A. Rosenberg, R. Holm, R. Henry, and M. Twigg, MOCVD growth of thick AlN and AlGaN superlattice structures on Si substrates, Journal of crystal growth 287, 610 (2006).
- Callsen et al. [2014] G. Callsen, M. Wagner, J. Reparaz, F. Nippert, T. Kure, S. Kalinowski, A. Hoffmann, M. Ford, M. Phillips, R. Dalmau, et al., Phonon pressure coefficients and deformation potentials of wurtzite AlN determined by uniaxial pressure-dependent raman measurements, Physical Review B 90, 205206 (2014).
- Li et al. [2022] P. Li, J.-Y. Ou, G. Z. Mashanovich, and J. Yan, Tailorable stimulated brillouin scattering in a partially suspended aluminium nitride waveguide in the visible range, Optics Express 30, 27092 (2022).
- Klaß et al. [2022] Y. S. Klaß, J. Doster, M. Bückle, R. Braive, and E. M. Weig, Determining Young’s modulus via the eigenmode spectrum of a nanomechanical string resonator, Applied Physics Letters 121, 2834205 (2022).
- Zeng et al. [2017] G. Zeng, W. Sun, R. Song, N. Tansu, and B. A. Krick, Crystal orientation dependence of gallium nitride wear, Scientific Reports 7, 14126 (2017).
- Parsons [2003] S. Parsons, Introduction to twinning, Acta Crystallographica Section D: Biological Crystallography 59, 1995 (2003).
- Schmid et al. [2011] S. Schmid, K. Jensen, K. Nielsen, and A. Boisen, Damping mechanisms in high-Q micro and nanomechanical string resonators, Physical Review B 84, 165307 (2011).
- Safavi-Naeini and Painter [2010] A. H. Safavi-Naeini and O. Painter, Design of optomechanical cavities and waveguides on a simultaneous bandgap phononic-photonic crystal slab, Opt. Express 18, 14926 (2010).
- Tsaturyan [2019] Y. Tsaturyan, Ultracoherent Soft-Clamped Mechanical Resonators for Quantum Cavity Optomechanics, Ph.D. thesis, University of Copenhagen, Copenhagen (2019).
- Norte et al. [2016] R. A. Norte, J. P. Moura, and S. Gröblacher, Mechanical resonators for quantum optomechanics experiments at room temperature, Physical review letters 116, 147202 (2016).
- Reinhardt et al. [2016] C. Reinhardt, T. Müller, A. Bourassa, and J. C. Sankey, Ultralow-Noise SiN Trampoline Resonators for Sensing and Optomechanics, Physical Review X 6, 021001 (2016).
- Fedorov et al. [2020a] S. A. Fedorov, A. Beccari, N. J. Engelsen, and T. J. Kippenberg, Fractal-like mechanical resonators with a soft-clamped fundamental mode, Physical Review Letters 124, 025502 (2020a).
- Fedorov et al. [2020b] S. A. Fedorov, A. Beccari, A. Arabmoheghi, D. J. Wilson, N. J. Engelsen, and T. J. Kippenberg, Thermal intermodulation noise in cavity-based measurements, Optica 7, 1609 (2020b).
- Aspelmeyer et al. [2014] M. Aspelmeyer, T. J. Kippenberg, and F. Marquardt, Cavity optomechanics, Reviews of Modern Physics 86, 1391 (2014).
- Liu and Fan [2012] V. Liu and S. Fan, S4: A free electromagnetic solver for layered periodic structures, Computer Physics Communications 183, 2233 (2012).
- Manjeshwar et al. [2023b] S. K. Manjeshwar, A. Ciers, J. Monsel, H. Pfeifer, C. Peralle, S. M. Wang, P. Tassin, and W. Wieczorek, Integrated microcavity optomechanics with a suspended photonic crystal mirror above a distributed bragg reflector, Opt. Express 31, 30212 (2023b).
- Bereyhi et al. [2019] M. J. Bereyhi, A. Beccari, S. A. Fedorov, A. H. Ghadimi, R. Schilling, D. J. Wilson, N. J. Engelsen, and T. J. Kippenberg, Clamp-tapering increases the quality factor of stressed nanobeams, Nano letters 19, 2329 (2019).
- Hübner [1973] K. Hübner, Piezoelectricity in zincblende-and wurtzite-type crystals, physica status solidi (b) 57, 627 (1973).
- Rais-Zadeh et al. [2014] M. Rais-Zadeh, V. J. Gokhale, A. Ansari, M. Faucher, D. Théron, Y. Cordier, and L. Buchaillot, Gallium nitride as an electromechanical material, Journal of Microelectromechanical Systems 23, 1252 (2014).
- Villanueva and Schmid [2014] L. G. Villanueva and S. Schmid, Evidence of surface loss as ubiquitous limiting damping mechanism in sin micro-and nanomechanical resonators, Physical review letters 113, 227201 (2014).
- Tao et al. [2014] Y. Tao, J. M. Boss, B. Moores, and C. L. Degen, Single-crystal diamond nanomechanical resonators with quality factors exceeding one million, Nature communications 5, 3638 (2014).
- Bereyhi et al. [2022b] M. J. Bereyhi, A. Arabmoheghi, A. Beccari, S. A. Fedorov, G. Huang, T. J. Kippenberg, and N. J. Engelsen, Perimeter modes of nanomechanical resonators exhibit quality factors exceeding 10 9 at room temperature, Physical Review X 12, 021036 (2022b).
- Mahmoodi Nasrabadi et al. [2022] H. Mahmoodi Nasrabadi, M. Mahdavi, M. Soleymaniha, and S. Moheimani, High resolution atomic force microscopy with an active piezoelectric microcantilever, Review of Scientific Instruments 93, 2848972 (2022).
- Raghavan and Redwing [2004] S. Raghavan and J. M. Redwing, In situ stress measurements during the MOCVD growth of AlN buffer layers on (1 1 1) Si substrates, Journal of crystal growth 261, 294 (2004).
- Note [1] We supply a short Mathematica script for these calculations on linear contribution to the elastic energy for an anisotropic material [71].
- Fedorov [2021] S. Fedorov, Mechanical Resonators with High Dissipation Dilution in Precision and Quantum Measurements, Ph.D. thesis, EPFL, Lausanne (2021).
- Tsubouchi et al. [1981] K. Tsubouchi, K. Sugai, and N. Mikoshiba, Aln material constants evaluation and saw properties on AlN/Al2O3 and AlN/Si, in 1981 Ultrasonics Symposium (IEEE, 1981) pp. 375–380.
- Ciers et al. [2024] A. Ciers, A. Jung, J. Ciers, L. R. Nindito, H. Pfeifer, A. Dadgar, A. Strittmater, and W. Wieczorek, Data at 10.5281/zenodo.7992175 for: Nanomechanical crystalline aln resonators with high quality factors for quantum optoelectromechanics (2024).
- Pastrňák and Roskovcová [1966] J. Pastrňák and L. Roskovcová, Refraction index measurements on AlN single crystals, physica status solidi (b) 14, K5 (1966).
- Dai et al. [2016] Y. Dai, S. Li, Q. Sun, Q. Peng, C. Gui, Y. Zhou, and S. Liu, Properties of AlN film grown on Si (111), Journal of Crystal Growth 435, 76 (2016).
- Mouhat and Coudert [2014] F. Mouhat and F.-X. Coudert, Necessary and sufficient elastic stability conditions in various crystal systems, Physical review B 90, 224104 (2014).
- Note [2] denote the stress and strain, respectively, for the case of plane stress in a membrane out of material with hexagonal symmetry.
- Note [3] denotes the stress and strain, respectively, for the case of in a beam.
- Hartmann et al. [1984] E. Hartmann, C. A. Taylor, U. of Wales (Cardiff), and U. internationale de cristallographie. Commission on Crystallographic Teaching, An introduction to crystal physics, Vol. 18 (University College Cardiff Press Cardiff, Wales, 1984).
- Zhuang et al. [2004] D. Zhuang, J. Edgar, B. Liu, H. Huey, H. Jiang, J. Lin, M. Kuball, F. Mogal, J. Chaudhuri, and Z. Rek, Bulk AlN crystal growth by direct heating of the source using microwaves, Journal of crystal growth 262, 168 (2004).
- Hopcroft et al. [2010] M. A. Hopcroft, W. D. Nix, and T. W. Kenny, What is the young’s modulus of silicon?, Journal of microelectromechanical systems 19, 229 (2010).
- Note [4] The indices run over , and .
- Feng and Arakawa [1996] X.-P. Feng and Y. Arakawa, Off-plane angle dependence of photonic band gap in a two-dimensional photonic crystal, IEEE journal of quantum electronics 32, 535 (1996).
- Verbridge et al. [2008] S. S. Verbridge, R. Ilic, H. G. Craighead, and J. M. Parpia, Size and frequency dependent gas damping of nanomechanical resonators, Applied Physics Letters 93, 10.1063/1.2952762 (2008).