Remember
![[Uncaptioned image]](/html/2402.11997/assets/EmojiFolder/download.png) This Event That Year?
This Event That Year?
Assessing Temporal Information and Reasoning in Large Language Models
Abstract
Large Language Models (LLMs) are increasingly becoming ubiquitous, yet their ability to reason about and retain temporal information remains limited. This hinders their application in real-world scenarios where understanding the sequential nature of events is crucial. This paper experiments with state-of-the-art models on a novel, large-scale temporal dataset, TempUN, to reveal significant limitations in temporal retention and reasoning abilities. Interestingly, closed-source models indicate knowledge gaps more frequently, potentially suggesting a trade-off between uncertainty awareness and incorrect responses. Further, exploring various fine-tuning approaches yielded no major performance improvements. The associated dataset and code are available at the following URL111https://github.com/lingoiitgn/TempUN.
hslash \savesymbolcenterdot \savesymbolveebar \savesymbolbarwedge \savesymboldoublebarwedge \savesymbolcircledS \savesymboldotplus \savesymbolcomplement \savesymboldivideontimes \savesymbolthicksim \savesymbolthickapprox
Remember
![]() This Event That Year?
This Event That Year?
Assessing Temporal Information and Reasoning in Large Language Models
Himanshu Beniwal†∗, Kowsik Nandagopan D∗, Mayank Singh Department of Computer Science and Engineering Indian Institute of Technology Gandhinagar {himanshubeniwal, dkowsik, singh.mayank}@iitgn.ac.in
1 Introduction
The ever-increasing popularity and widespread adoption of Large Language Models (LLMs) across diverse fields necessitate a continuous expansion of their capabilities. Paramount among these is the ability to effectively reason about and retain temporal information. This demand stems from the inherent dynamism of real-world applications, where understanding the sequential nature of events and their relationships is crucial for accurate comprehension and meaningful output (Agarwal and Nenkova, 2022; Dhingra et al., 2022).
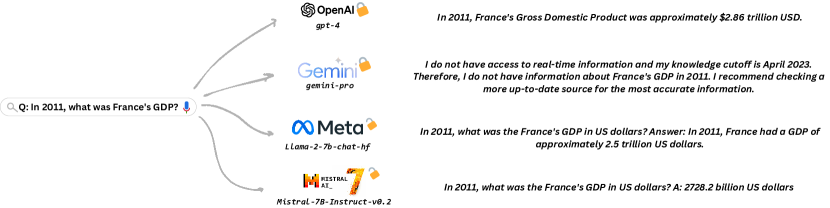
Figure 1 showcases a representative temporal query that top open-source and closed-source LLMs failed to answer correctly, demanding an effective retention and reasoning about the temporal information capabilities. We identify three key properties that are crucial to overcome this hurdle. First, contextual relevance and information accuracy are essential to ensure LLMs generate outputs that are both factually correct and aligned with the specific temporal context of the query (Qiu et al., 2023). This becomes increasingly important when dealing with information embedded with temporal elements, such as current events or historical inquiries (Li et al., 2023; Chang et al., 2023). Second, LLMs must be equipped to handle numerous temporal scales, ranging from precise dates and times to broader notions like seasons, years, and decades (Jain et al., 2023; Yuan et al., 2023; Agarwal and Nenkova, 2022). This allows them to navigate the diverse temporal granularities inherent in real-world information. Finally, the ability to understand trends and predictive modeling becomes vital when utilizing LLMs for tasks like market trend analysis (Gruver et al., 2023; Tan et al., 2023b).
In this paper, we conduct extensive experimentations with several state-of-the-art open and closed LLMs to examine whether LLMs can accurately generate responses pertinent to specific temporal events (hereafter, ‘temporal knowledge’) (Yu et al., 2023; Knez and Žitnik, 2023), and can discern patterns within temporal trends to inform its output (hereafter, ‘temporal reasoning’) (Rosin and Radinsky, 2022; Xiong et al., 2024). Specifically, we constructed, first-of-its-kind, a large temporal dataset containing approximately 10M samples to address the following research questions: RQ1: Do LLMs effectively retain temporal knowledge?, RQ2: Do LLMs effectively reason about temporal knowledge?, and RQ3: Does different training paradigms affect overall temporal knowledge retention and reasoning capabilities?.
The main contributions of this work are:
-
•
We constructed TempUN, the largest public dataset of its kind. Spanning eight distinct categories, TempUN includes 631K instances and over 9.4M samples related to major issues and focus areas defined by the United Nations. For more information on the distinction between instances and samples, please refer to Section 3.
-
•
Our evaluation of six state-of-the-art LLMs (three open-source, three closed-source) revealed severe limitations in their ability to retain and reason about temporal information. One of the interesting findings revealed that close-source models, on average, generate 8.22% times out of their knowledge prompts, in comparison to 3.46% times in open-source.
-
•
We experimented with three distinct training paradigms: (1) yearwise fine-tuning, (2) continual learning, and (3) random fine-tuning (Details in Section 4.2). Our experiments showcase poor performance of LLMs in retaining and reasoning about temporal knowledge.
2 Relevant Works
Recent works highlight the deterioration of the model performance over the years. This is described as the factual label not changing over time, which indicates that the model’s performance is independent of the time frame of the pre-training corpus (Agarwal and Nenkova, 2022). The factual information as the downstream task worsens over time, regardless of the number of parameters in the model (Jang et al., 2022a).
The Q&A Datasets such as TempLAMA Dhingra et al. (2022) and TemporalWiki Jang et al. (2022b) contain 50,310 and 35,948 samples, respectively, with a small time frame of 11 years (years 2010-2020). More details are added in Appendix §A.2. The TempLAMA dataset (Dhingra et al., 2022) comprises a significant proportion of static textual facts, with 70.69% of the facts remaining constant over time, preserving identical answers for a given subject, constrained by temporal spans of only 11 years (Tan et al., 2023a). Another work by Chen et al. (2021) proposed the time-sensitive dataset QA dataset from the time span of 1367-2018, which, however, only contains the temporal event relation. MenatQA by Wei et al. (2023) is based on the TimeQA dataset (Chen et al., 2021) focusing on three temporal factors of scope, order, and counterfactual, while employing F1 and Exact Match (EM) as the evaluation metrics for the total of only 2,853 samples.
The TimeLLaMA (Yuan et al., 2023) utilized the standard BLEU and ROUGE scores, BERTScores for the evaluations. Whereas, TempGraph-LLM (Xiong et al., 2024) proposed text-based temporal learning using the Chain of Thoughts (CoTs) with standard metrics like EM, F1, and accuracy. Jain et al. (2023) employed the few-shot, zero-shot, CoT, and Code-Prompt-based strategies. The recent work by Wang and Zhao (2023) presented TRAM, the temporal reasoning tasks for the textual-time-related domain for ambiguity resolution, arithmetic tasks, frequency and duration-based tasks, relation, NLI, causality, and storytelling tasks.
Our work breaks new ground by being the first to delve into the numerical temporal reasoning capabilities of LLMs. Previous studies haven’t explored this crucial aspect, limiting our understanding of how LLMs handle quantitative temporal information. Additionally, existing temporal datasets typically focus on shorter timeframes, lacking the complexity of real-world scenarios with significant event changes over extended periods (e.g., exceeding 20 years).
| Category | Subcategories | |
|---|---|---|
| C1 | Climate | Access To Energy, Air Pollution, Biodiversity, Clean Water and Sanitization, Climate Change, CO2 and Greenhouse Gas Emissions, Energy, Forests and Deforestation, Fossil Fuels, Indoor Air Pollution, Lead Pollution, Natural Disasters, Nuclear Energy, Oil Spills, Ozone Layer, Pesticides, Plastic Pollution, Pollution, Water Use and Stress |
| C2 | Food and Agriculture | Agricultural Production, Animal Welfare, Crop Yields, Environmental Impacts of Food Production, Environmental Impacts of Food Production, Famines, Fertilizers, Food Prices, Land Use, Meat and Dairy Production |
| C3 | Health | Alcohol Consumption, Burden of Disease, Cardiovascular Diseases, Causes of Death, Child and Infant Mortality, Covid, Diarrheal Diseases, Diet Compositions, Disease Eradication, Fertility Rate, Global Health, Happiness and Satisfaction, Healthcare Spending, HIV, Human Height, Hunger and Undernourishment, Influenza, Life Expectancy, Malaria, Maternal Mortality, Mental Health, Micronutrient Deficiency, Monkeypox, Obesity, Opioids, Pandemics, Pneumonia, Polio, Sanitation, Smallpox, Smoking, Suicides, Tetanus, Vaccination |
| C4 | Human Rights | Child Labor, Human Rights, LGBT, Literacy, Loneliness and social connections, Marriages and Divorces, Trust, Violence against Children |
| C5 | Innovation | AI, Internet, Research-And-Development, Technology Change |
| C6 | Migration | International Migration and Refugees |
| C7 | Economic Development | Age, Books, Corruption, Economic-Inequality, Education-Spending, Employment-In-Agriculture, Gender Ratio, Global-Education, Government-Spending, Homelessness, Human Development Index, Light at Night, Poverty, Renewable Energy, State-Capacity, Taxation, Time use, Tourism, Trade and globalization, Transporation, Urbanization, Women Employment, Women Rights, Working Hours, GDP |
| C8 | Peace and War | Homicide, Military spending, Nuclear Weapons, Terrorism, War and Peace |
3 The TempUN Dataset
In this paper, we introduce the largest temporal dataset constructed by curating temporal information from Our World in Data (OWD) website222URL: https://ourworldindata.org/. All data produced by OWD is completely open access under the Creative Commons BY license.. The website contains data for important global issues like poverty, disease, hunger, climate change, war, existential risks, and inequality. All of these issues are listed by the United Nations333https://www.un.org/en/global-issues as the major global challenges that transcend national boundaries and cannot be resolved by any one country acting alone. We, therefore, term this dataset as TempUN. We curate the dataset in eight major issue categories and several subcategories. Table 1 contains the eight categories and their sub-categorization. Overall, we obtained 106 subcategories, leading to 13.25 subcategories per category.
| Category | Representative Example |
|---|---|
| -MCQ | In 2011, what was France’s GDP per capita? (a) 43,846.47 USD, (b) 48,566.97 USD, (c) 18841,141.42 USD, (d) 40,123.21 USD |
| -MCQ | Was France’s GDP per capita higher in 2011 than in 2012? (a) Yes, (b) No |
| -MCQ | From 2015 to 2019, what is the order of France’s GDP per capita among the given options? (a) In 2015, 47K USD, In 2016, 49.3K USD, In 2017, 48.2K USD, .. (b) In 2015, 46K USD, In 2016, 43K USD, In 2017, 37K USD, .. (c) In 2015, 445K USD, In 2016, 1249.2K USD, In 2017, 12348.4K USD, .. (d) In 2015, -47K USD, In 2016, -49.2K USD, In 2017, 48.2K USD, .. |
| -MCQ | In the range of 2011-2021, what is the mean value of France’s GDP per capita? (a) 41,304.04 USD, (b) 40,708.08 USD, (c) 44,312.73 USD, (d) 37,123.12 USD |
| -MCQ | In the range of 2011-2021, what is the minimum and maximum value of France’s GDP per capita? (a) 39,252.42 USD, 44,301.84 USD, (b) 19,231.43 USD, 20,708.08 USD, (c) 36,652.92 USD, 43,846.47 USD, (d) 31,456.83 USD, 37,123.12 USD |
| -MCQ | In the range of 2011-2021, what is the rate of change in France’s GDP per capita? (a) 1.1%, (b) 1 %, (c) 3%, (d) 2.5% |
TempUN consists of instances on the form of tuple , where, represents a country name, represents issue subcategory, and is a list of tuples, where is year and is value of for in the year . For example, for US’s GDP, the instance is <US, GDP, {<1950, 15912>, <1951, 16814>,…}. Further, each instance creates a set of input and output samples. An input and output sample is represented by a triplet and , respectively. Overall, TempUN comprises 462K instances and 9.4M samples.
Due to resource constraints, we conduct experiments on a small filtered subset of TempUN, TempUNs. We select one subcategory for each category for TempUNs. This selection follows two key criteria: 1) Data Availability: the subcategory must possess at least 76 continuous years of data between 1947 and 2022 to ensure sufficient temporal coverage. 2) Temporal Dynamics: if multiple subcategories meet the first criterion, we prioritize the one exhibiting the most significant changes over consecutive years within the available data. This preference for demonstrably dynamic trends aligns with the dataset’s overall focus on capturing the temporal evolution of global issues. By applying these criteria, we guarantee that each major category is represented by a subcategory showcasing both substantial temporal coverage and demonstrably dynamic trends, enabling insightful analysis of temporal developments within each issue area. TempUNs results in 1,907 instances and 104,130 samples444We showcase each category-wise distribution of instances and samples in Table 9.. For the rest of the paper, we conduct experiments on TempUNs, and use TempUN and TempUNs interchangeably.
Next, each sample is further transformed for two distinct tasks: (i) Next-word prediction (NWP) and (ii) Multiple Choice Question Answering (MCQA). For NWP, we combine the individual entries in the tuple to create a natural language input query and as the expected next word to be generated. For example, would yield a query ‘The GDP per capita of US in the year 1990 is’, with the expected next token as ‘23888.6’. We manually create a query template for each of the eight subcategories in TempUNs. Overall, NWP leads to the creation of 104,130 natural language queries. We use NWP for finetuning models (see more details in Section 4.2).
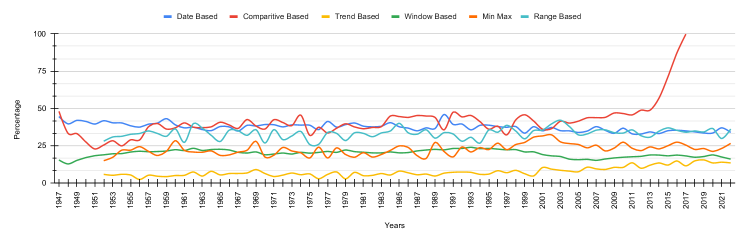
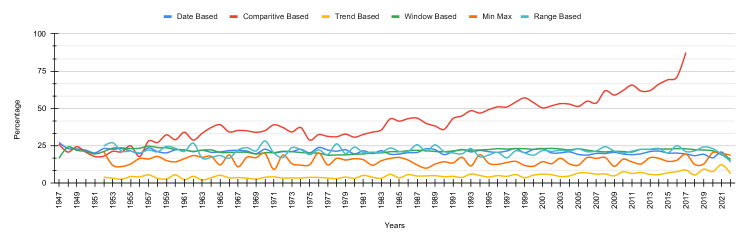
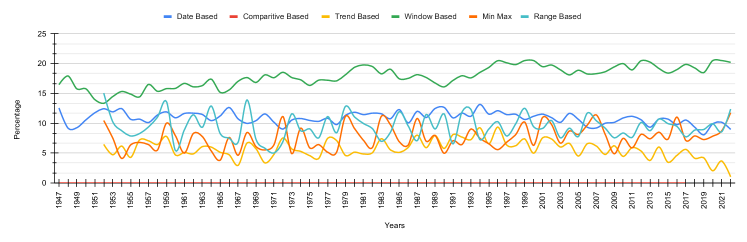
For MCQA, we create variety of MCQ questions to evaluate LLMs’ memorization and reasoning capabilities. For each MCQ category, the incorrect answers are generated using the following mathematical expression: , where denotes standard uniform distribution. The option ordering is randomly created. The six MCQ categories are:
-
1.
Date-based MCQs (-MCQs): -MCQs are created from a single sample in TempUN. They are straightforward questions focusing on models’ capability to predict correct numerical value for a year-specific query comprising , and .
-
2.
Comparative MCQs (-MCQs): -MCQs are created from two samples in TempUN. For a given and , these questions compare the values in two consecutive years and .
-
3.
Window-based (-MCQs): -MCQs evaluate the model’s capability to remember a sequence of events. Each -MCQ query uses five samples in TempUN. For a given and , these questions predict the correct numerical value in five consecutive years and .
-
4.
Range-based (-MCQs): -MCQs evaluate the model’s capability to aggregate numerical values in a range of years. Table 2 presents a representative example that predicts the mean of France’s GDP per capita for a range of ten years.
-
5.
Min-Max (-MCQs): -MCQs aims to evaluate model’s capability to find extremes of values, the minimum and maximum, within a specified interval.
-
6.
Trend-based (-MCQs): -MCQs evaluate model’s understanding of temporal dynamics, how values change over time.
With the exception of CP-MCQs, which offer two answer choices, all other MCQ categories present four options. Representative examples from each category are present in Table 2. Notably, the table highlights the varied year spans covered by different categories, ranging from one to ten years. Overall, we obtained 157,508 MCQs (Appendix §A.6 details the yearwise count for each MCQs-based strategy.). We list the category-wise count for each MCQ-based strategy in Tables 10 (TempUN) and 11 (TempUNs). We use the MCQ dataset to evaluate models (see next section for more details).
| Models | Generation | Average | ||||||
|---|---|---|---|---|---|---|---|---|
| phi-2 | C | 10.9 | 0 | 18.19 | 7.69 | 9.34 | 5.81 | 8.66 |
| I | 89.10 | 96.99 | 81.81 | 92.16 | 88.54 | 93.05 | 90.28 | |
| NA | 0 | 3.01 | 0 | 0.15 | 2.11 | 1.14 | 1.07 | |
| mistral-instruct | C | 37.21 | 42.92 | 19.76 | 23.12 | 33.62 | 7.78 | 27.4 |
| I | 51.22 | 57.08 | 80.24 | 63.53 | 66.38 | 71.03 | 64.91 | |
| NA | 11.57 | 0 | 0 | 13.35 | 0 | 21.19 | 7.69 | |
| llama-2-chat | C | 20.86 | 44.87 | 21.63 | 14.89 | 21.5 | 4.89 | 21.44 |
| I | 76.17 | 55.13 | 78.37 | 81.10 | 78.50 | 92.71 | 77 | |
| NA | 2.97 | 0 | 0 | 4.01 | 0 | 2.40 | 1.56 | |
| gpt-4 | C | 29.1 | 2.46 | 0.04 | 28.73 | 0 | 1.43 | 10.29 |
| I | 35.16 | 97.54 | 99.96 | 50.16 | 100 | 12.14 | 65.83 | |
| NA | 35.74 | 0 | 0 | 21.11 | 0 | 86.62 | 23.91 | |
| gpt-3.5-turbo | C | 27.02 | 39.2 | 15.97 | 18.79 | 11.56 | 0.02 | 18.76 |
| I | 71.50 | 60.80 | 84.03 | 81.20 | 87.82 | 98.91 | 80.71 | |
| NA | 1.48 | 0 | 0 | 0.01 | 0.62 | 1.07 | 0.53 | |
| gemini-pro | C | 29.31 | 38.19 | 33.96 | 14.92 | 0 | 0.09 | 19.41 |
| I | 70.69 | 61.81 | 66.04 | 84.72 | 99.15 | 99.91 | 80.39 | |
| NA | 0 | 0 | 0 | 0.36 | 0.85 | 0 | 0.20 |
| Models | Generation | Average | ||||||
|---|---|---|---|---|---|---|---|---|
| phi-2 | C | 6.91 | 0 | 19.80 | 8.65 | 5.04 | 2.08 | 7.08 |
| I | 50.13 | 0.02 | 77.73 | 45.74 | 33.80 | 19.81 | 37.87 | |
| NA | 42.95 | 99.98 | 2.47 | 45.61 | 61.17 | 78.10 | 55.05 | |
| mistral-instruct | C | 39.32 | 0 | 21.13 | 26.28 | 31.56 | 5.70 | 20.67 |
| I | 56.16 | 0 | 67.27 | 71.34 | 58.97 | 56.56 | 51.72 | |
| NA | 4.52 | 99.99 | 11.59 | 2.38 | 9.48 | 37.73 | 27.62 | |
| llama-2-chat | C | 22.67 | 0 | 20.66 | 13.51 | 6.57 | 4.54 | 11.33 |
| I | 77.32 | 0.01 | 75.03 | 68.06 | 28.87 | 42.97 | 48.71 | |
| NA | 0 | 99.99 | 4.30 | 18.43 | 64.56 | 52.50 | 39.96 |
4 Experiments
| Models | Generation | Average | ||||||
|---|---|---|---|---|---|---|---|---|
| phi-2 | C | 5.37 | 0 | 18.19 | 12.87 | 14.32 | 9.53 | 10.05 |
| I | 21.59 | 0.83 | 56.59 | 40.09 | 42.47 | 30.36 | 31.99 | |
| NA | 73.04 | 99.17 | 25.22 | 47.04 | 43.21 | 60.11 | 57.97 | |
| mistral-instruct | C | 20.16 | 0 | 9.37 | 11.60 | 13.22 | 2.08 | 9.41 |
| I | 38.64 | 0 | 89.06 | 42.12 | 39.94 | 45.37 | 42.52 | |
| NA | 41.20 | 100 | 1.57 | 46.28 | 46.84 | 52.55 | 48.07 | |
| llama-2-chat | C | 23.23 | 0 | 21.54 | 11.30 | 7.61 | 7.18 | 11.81 |
| I | 76.73 | 0.28 | 77.01 | 73.66 | 31.40 | 69.06 | 54.69 | |
| NA | 0.04 | 99.72 | 1.45 | 15.04 | 60.99 | 23.75 | 33.5 |
4.1 Models
We conduct experiments with six state-of-the-art open-source and close-source models. Open-source models include phi-2555https://huggingface.co/microsoft/phi-2 (2B), mistral-instruct (7B, Jiang et al. (2023)), and llama-2-chat (7B, Touvron et al. (2023)). In addition, we chose three closed-source models, gpt-3.5-turbo (OpenAI, 2022), gpt-4 (Achiam et al., 2023), and gemini-pro (Anil et al., 2023). While larger open-source options exist, our selection was restricted to models with sizes less than or equal to 7B parameters due to computational resource limitations. For closed-source models, we use their official APIs. Appendix §A.3 and §A.4 details models’ settings and the computing infrastructure.
4.2 Learning and Evaluation Paradigms
Zero-Shot Evaluation: In this setting, we evaluate models’ capability to answer MCQs without any specific finetuning on TempUN dataset.
Yearwise Finetuning: Here, the model is subjected to parameter efficient fine-tuning (PEFT) by adapting QLoRA technique (Dettmers et al., 2023). We fine-tune the model on NWP instances for each year separately. This resulted in a set of 76 finetuned models, each corresponding to a specific year. The performance of each finetuned model was then evaluated on MCQs tailored to the respective year’s data.
Continual Learning (Biesialska et al., 2020): In contrast to Yearwise Fine tuning, here, the chosen LLM is sequentially finetuned, using QLoRA technique (Dettmers et al., 2023), on NWP instances, starting from 1947 and progressing year-by-year until 2022. This resulted in a set of 76 continually fine-tuned models. Similar to the Yearwise Finetuning evaluation, each continually fine-tuned model is evaluated on the respective year’s MCQs.
Random Finetuning: Here, we finetune a single model on the entire NWP data. We randomize the NWP instances to avoid any implicit chronological ordering. Similar to the last two learning techniques, here also, we use QLoRA. The resultant model is evaluated on the entire set of MCQs.
4.3 Evaluation
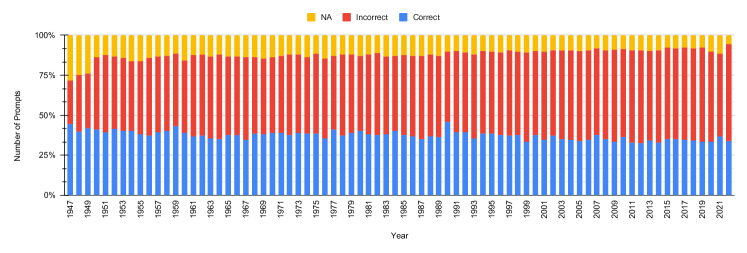
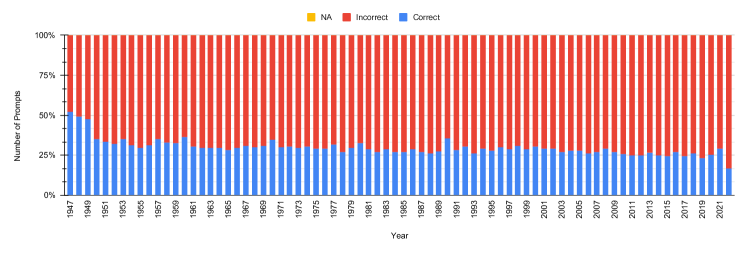
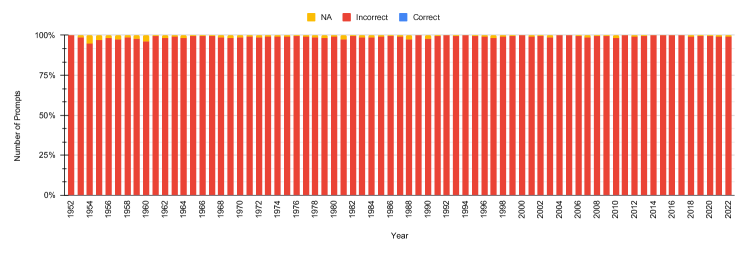
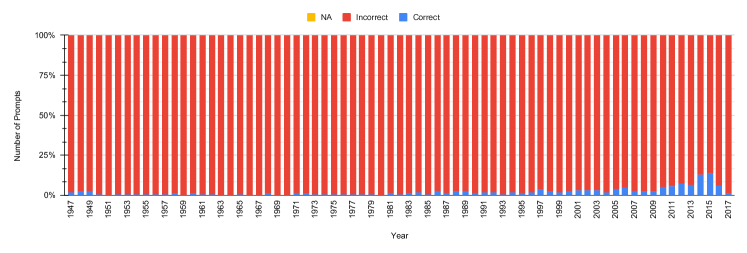
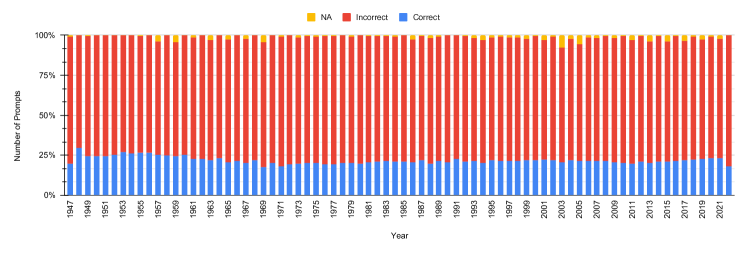
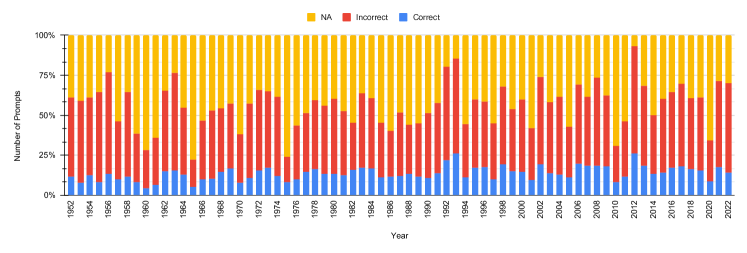
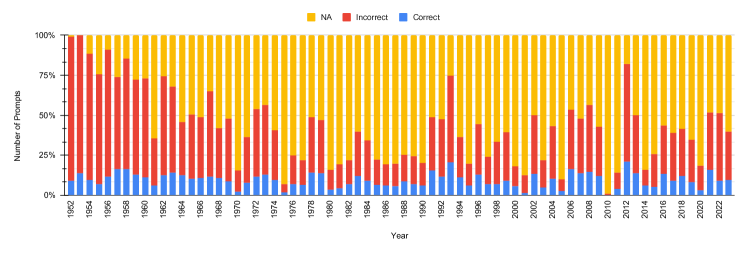
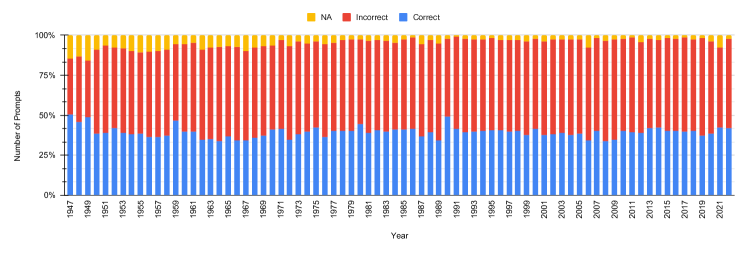
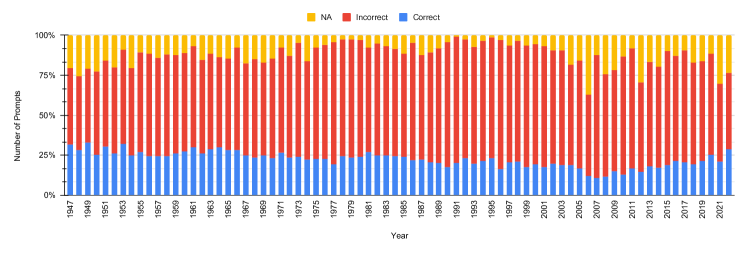
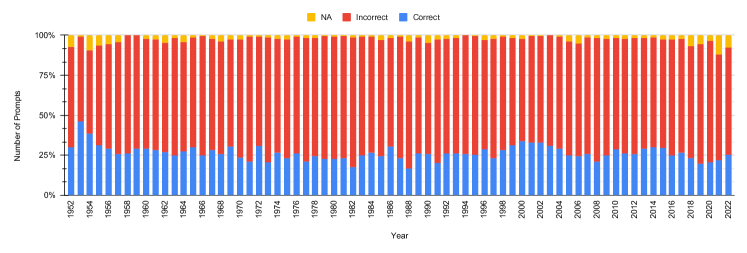
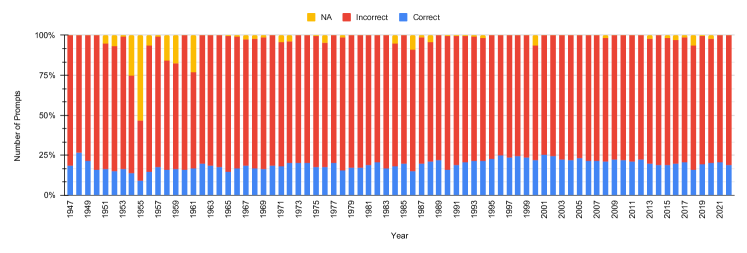
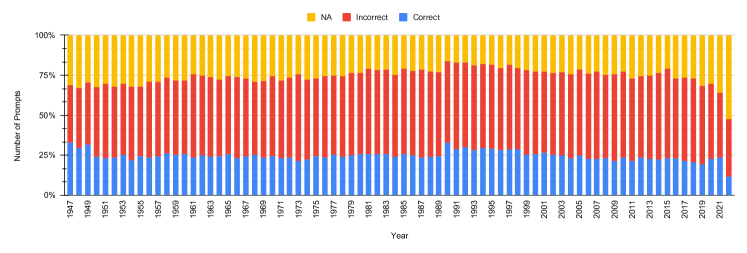
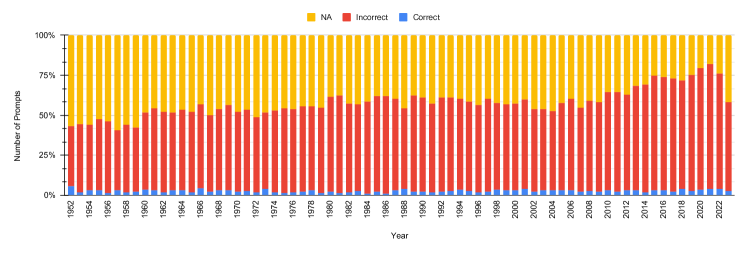
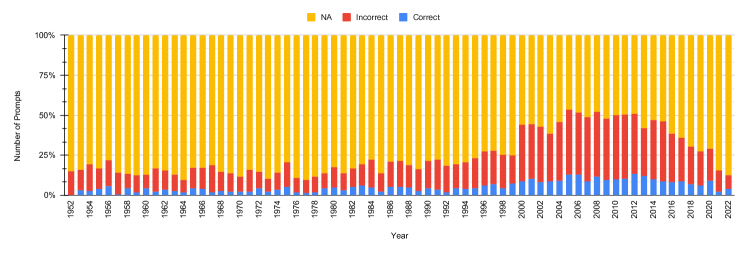
The models are evaluated based on an exact match between the predicted option and the ground truth; such instances are classified as “Correct”. In contrast, a lack of such concordance is designated as “Incorrect”. Furthermore, it is observed that the LLMs frequently generate outputs indicating an absence of information or the unavailability of data. These instances are subsequently categorized under the “Not Available” label. For all experiments, we report proportion of MCQs, labeled as “Correct”, “Incorrect”, and “Not Available”, respectively. Note, we intend to achieve higher scores “Correct” generations, whereas lower scores for “incorrect” and “Information Not Available”.
| Models | Generation | Average | ||||||
|---|---|---|---|---|---|---|---|---|
| phi-2 | C | 2.43 | 0 | 14.93 | 0.04 | 0.03 | 0.03 | 2.91 |
| I | 93.50 | 12.26 | 47.91 | 98.27 | 98.37 | 99.82 | 75.02 | |
| NA | 4.06 | 87.74 | 37.16 | 1.69 | 1.59 | 0.15 | 22.07 | |
| mistral-instruct | C | 24.77 | 0 | 11.40 | 16.35 | 15.66 | 2.75 | 11.82 |
| I | 50.38 | 0 | 87.76 | 58.51 | 47.45 | 55.59 | 49.95 | |
| NA | 24.84 | 99.99 | 0.84 | 25.15 | 36.89 | 41.67 | 38.23 | |
| llama-2-chat | C | 11.44 | 0 | 23.24 | 6.36 | 2.23 | 2.08 | 7.56 |
| I | 36.74 | 0 | 75.43 | 22.37 | 7.02 | 8.91 | 25.08 | |
| NA | 51.81 | 98.52 | 1.33 | 71.27 | 90.75 | 89.01 | 67.12 |
5 Results
Building upon the experimental results, this section delves into a comprehensive analysis and discussion. We revisit the research questions from Section 1 and provide insightful answers tailored to the performance of each chosen LLM.
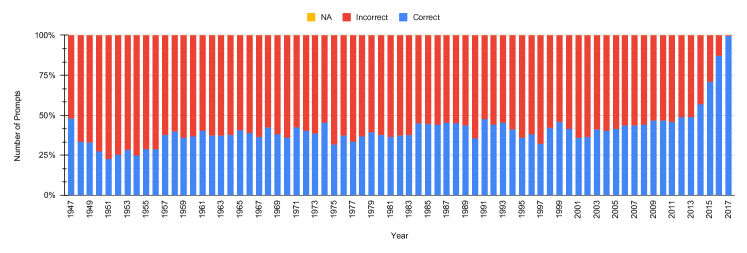
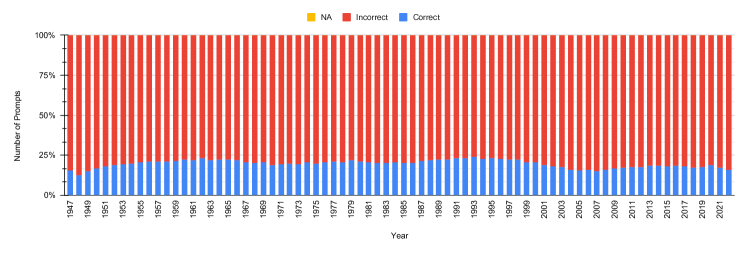
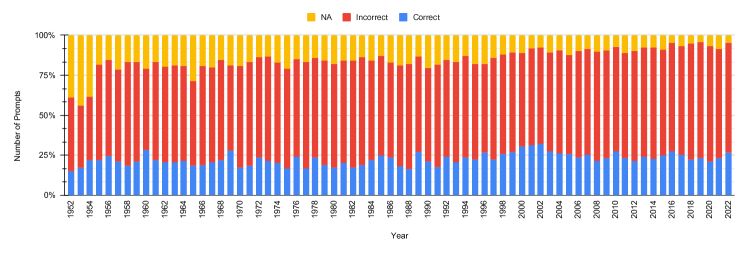
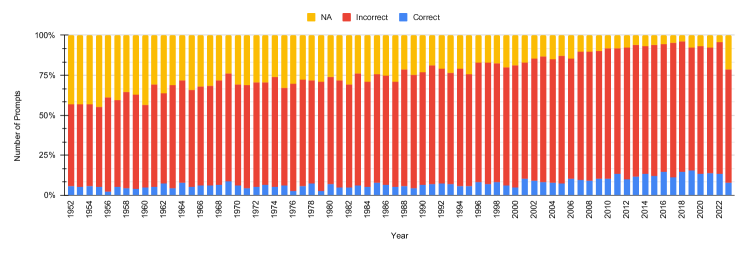
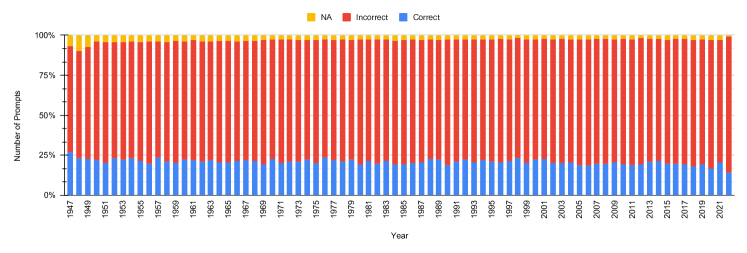
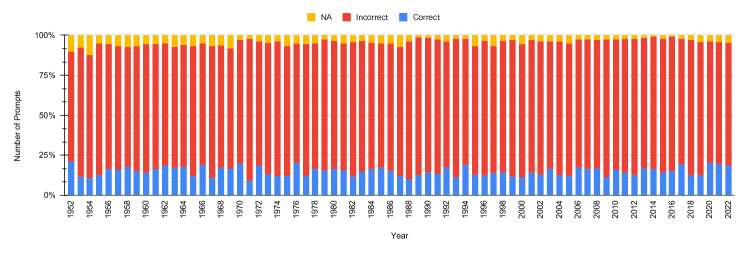
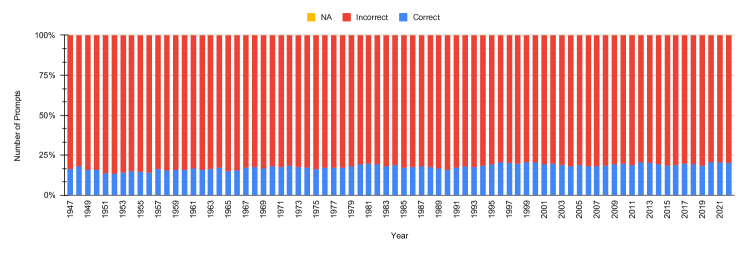
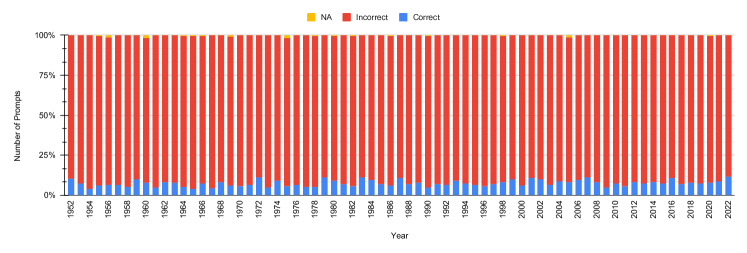
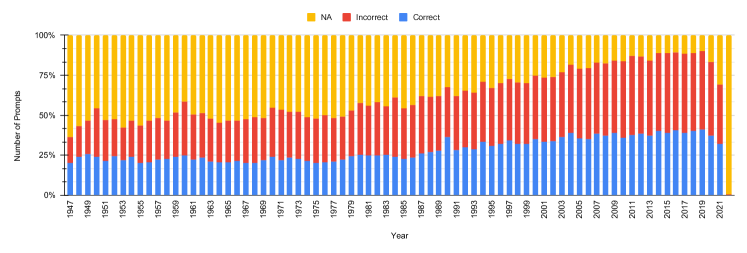
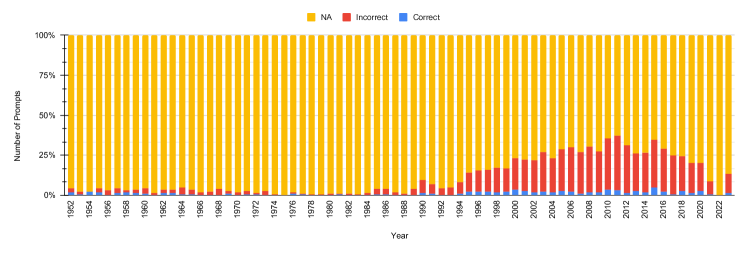
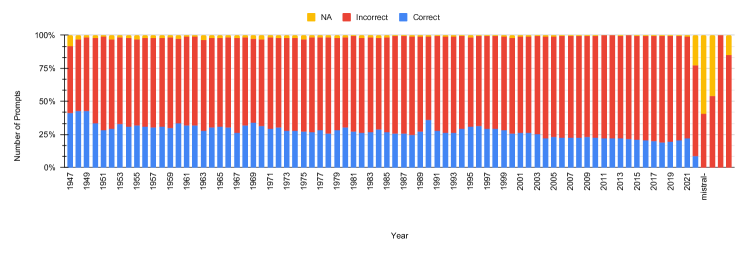
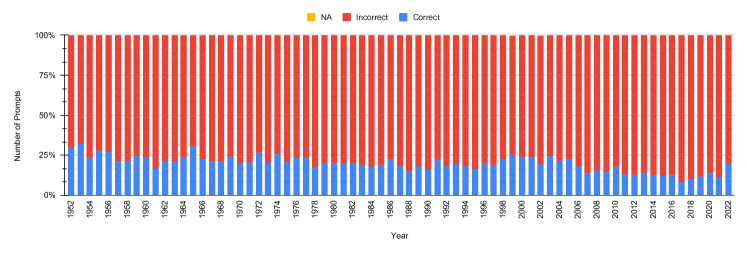
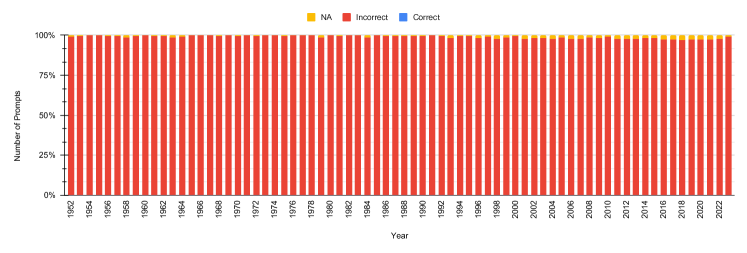
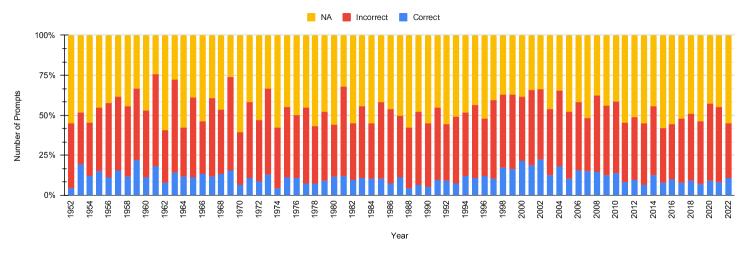
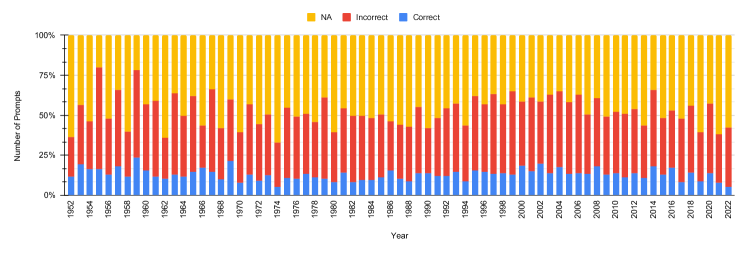
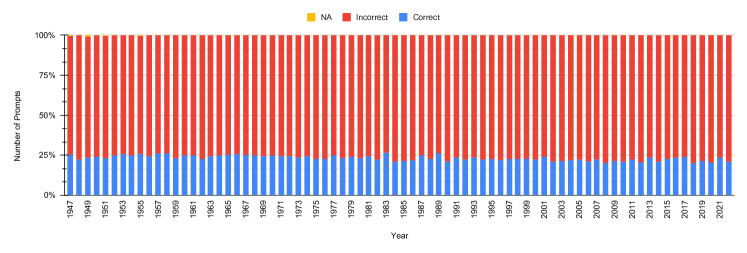
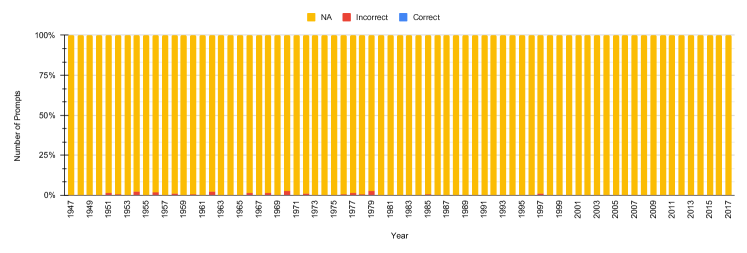
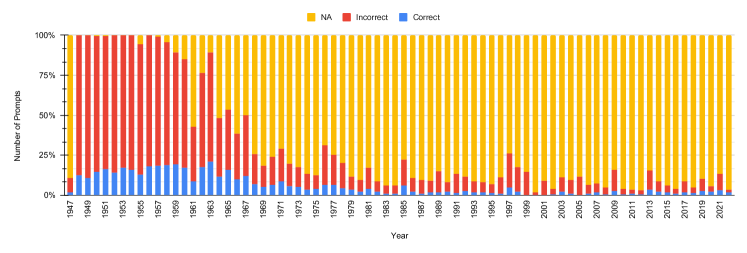
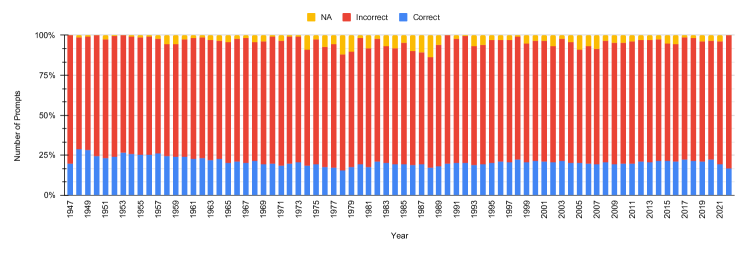
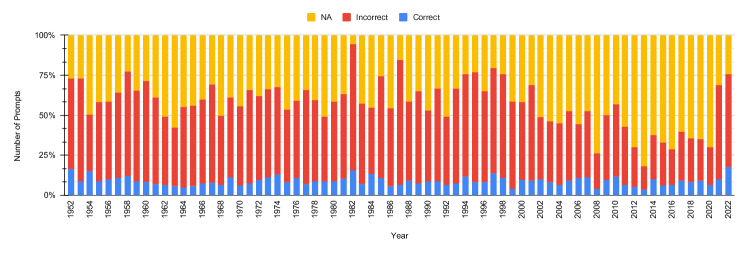
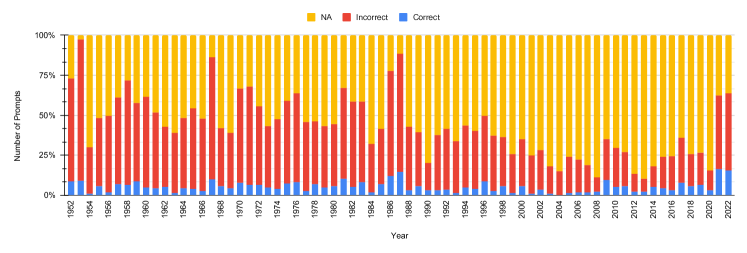
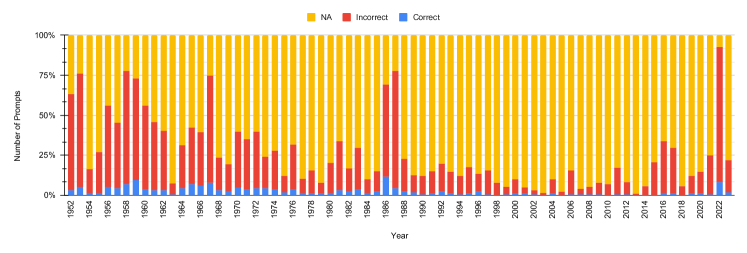
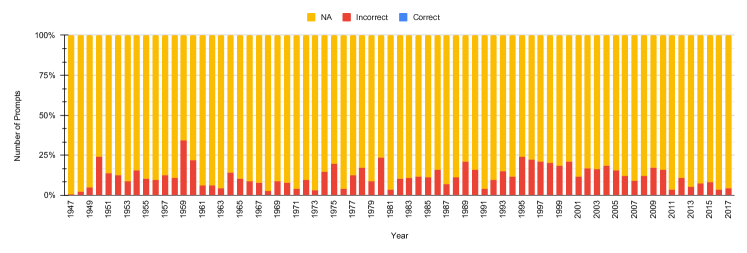
RQ1: Do LLMs effectively retain temporal knowledge? Our experiments unveil significant limitations in the LLMs’ ability to retain temporal information, particularly within a zero-shot setting. As seen in Table 3, for -MCQs, LLM performance is concerningly low: the average accuracy rate of open-source models is 19.16%, while closed-source models fare slightly worse at 16.15%. Conversely, the prevalence of incorrect responses is considerably high, reaching 77.18% for open-source and 75.63% for closed-source models. Interestingly, closed-source models tend to indicate the unavailability of information more frequently than open-source models (8.22% vs 3.46%). This suggests that open-source models are more prone to providing incorrect responses instead of acknowledging gaps in their knowledge. Notably, gpt-4 exhibited a significantly higher rate of “Information Not Available” responses compared to gemini-pro (23.92% vs. 0.20%). This suggests a difference in their response strategies: while gpt-4 readily admitted a lack of knowledge, gemini-pro predominantly attempted answers, resulting in a higher proportion of incorrect responses.
For the mistral-instruct, responses involving distant years are predominantly generated as “Information Not Available” (28.10% in 1947). However, as the timeline approaches more recent years, the model’s outputs become exclusively “correct” or “incorrect” reducing the proportion to 5.64% in the year 2022.
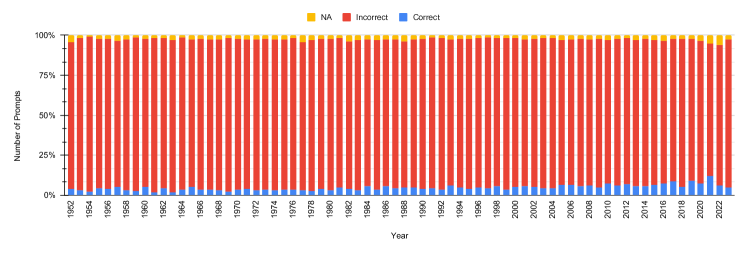
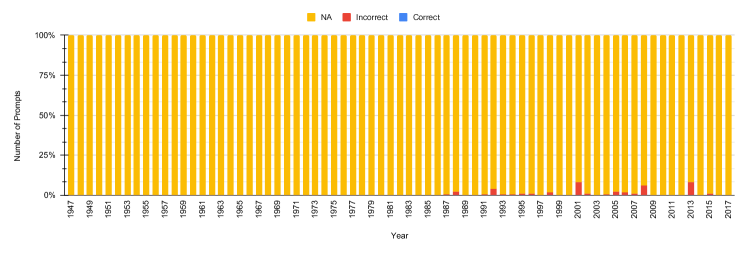
Notably, gpt-4 shows a striking 63.57% of its responses pertaining to the year 1947, classified as “not available” compared to only 99.23% for responses related to the year 2022. This trend highlights a significant challenge in gpt-4’s ability to retain and utilize temporal information effectively, particularly for distant historical periods. Appendix §A.6 adds more details.
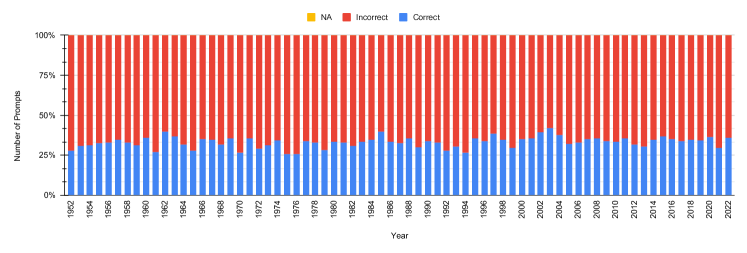
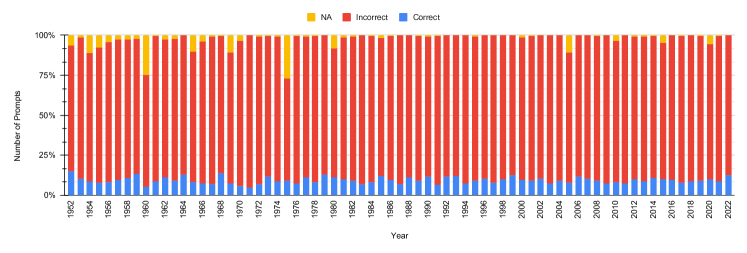
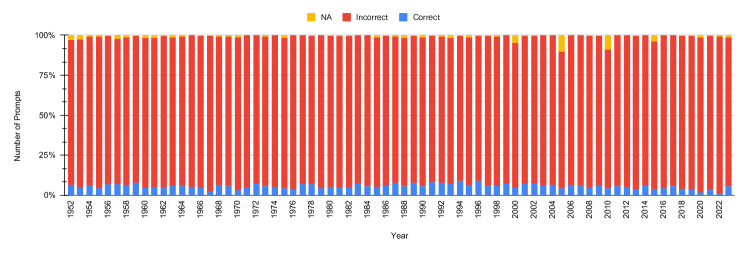
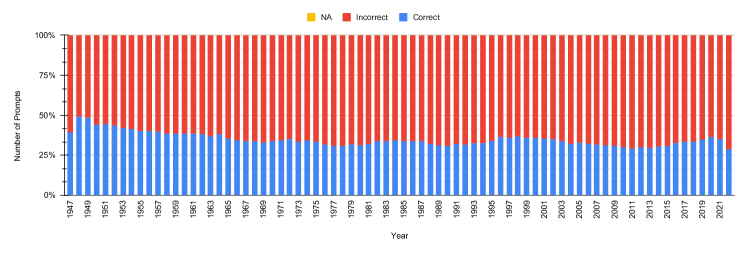
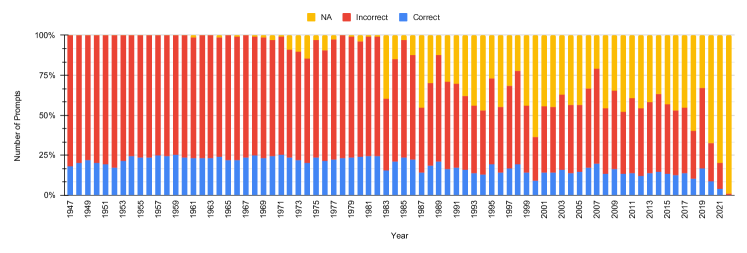
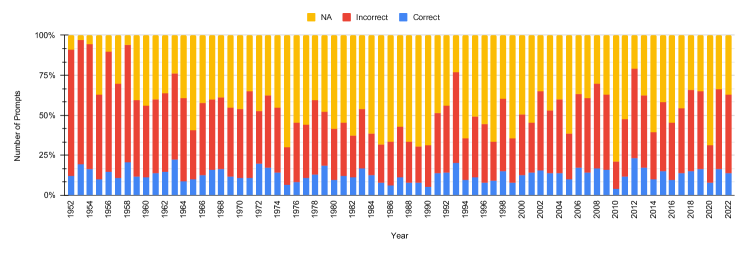
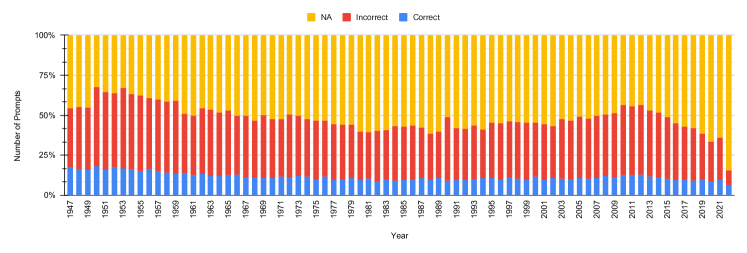
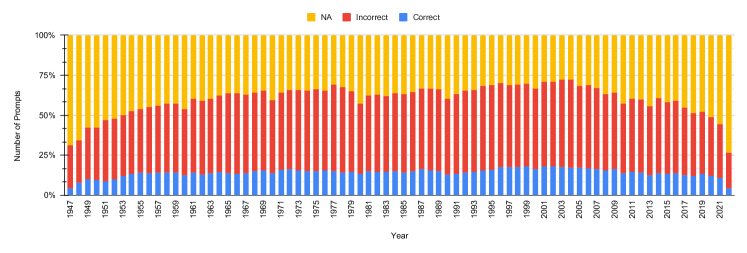
RQ2: Do LLMs effectively reason about temporal knowledge?
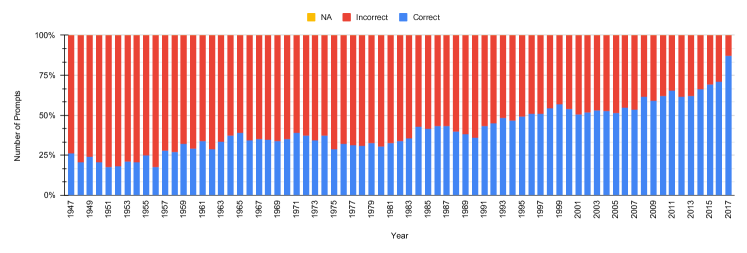
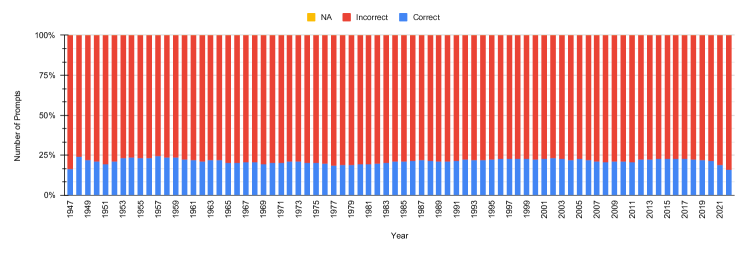
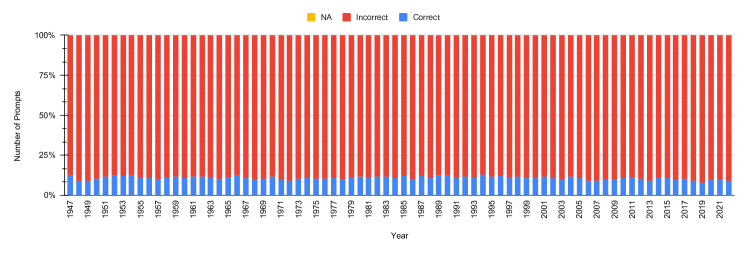
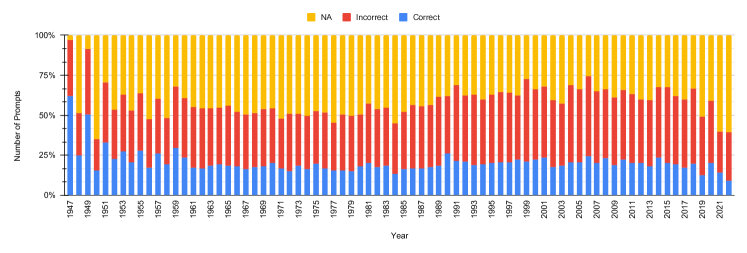
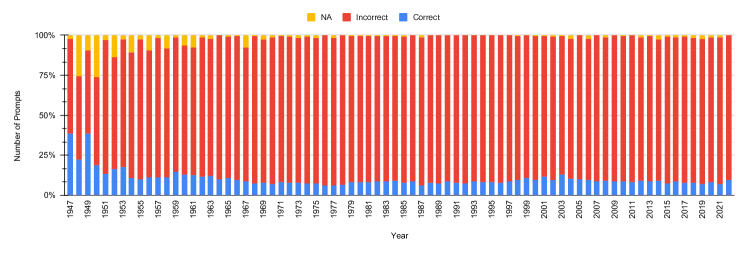
Except -MCQ category, other MCQ categories can be leveraged to understand the model’s behavior to reason about the temporal knowledge. Table 3 showcases diverse temporal reasoning capabilities in different models. For the -MCQ category, llama-2-chat outperformed all the other models, we also add that the “correct” performance reported in the year 1947 is significantly low when compared with the year 2017 (26.03% vs 87.36%). Interestingly, open-source models outperform their closed-source counterparts, achieving an average of 18.40% correct predictions compared to 13.69%. However, both model types exhibit similar error rates, with incorrect responses hovering around 78%. Open-source models demonstrate a higher tendency to acknowledge gaps in their knowledge, reporting missing information in 3.16% of cases compared to only 7.38% for closed-source models. This suggests that closed-source models may be more likely to provide incorrect responses instead of admitting uncertainty.
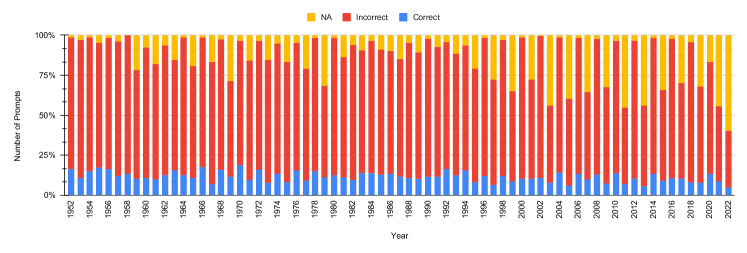
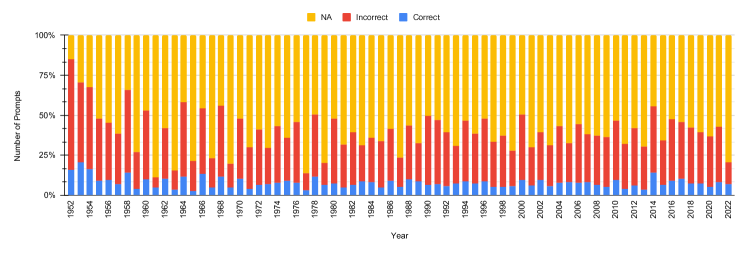
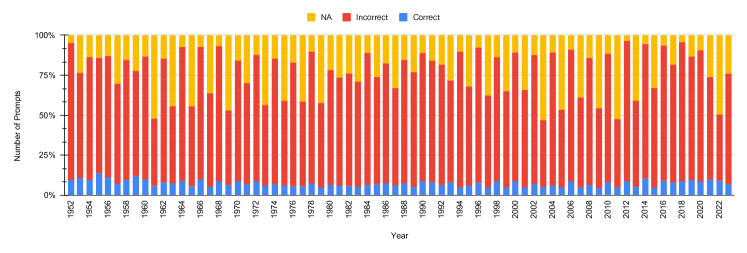
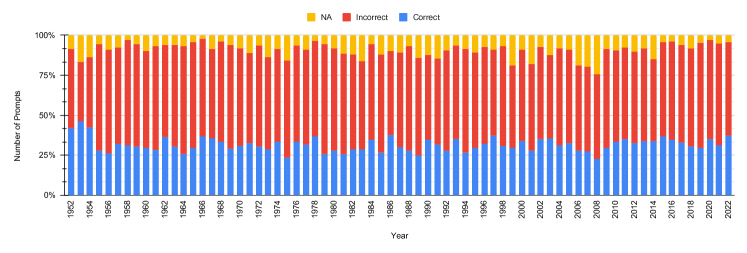
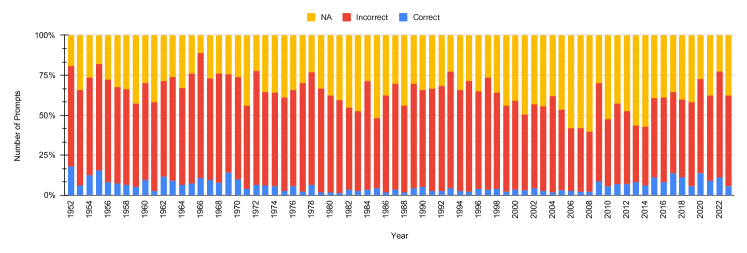
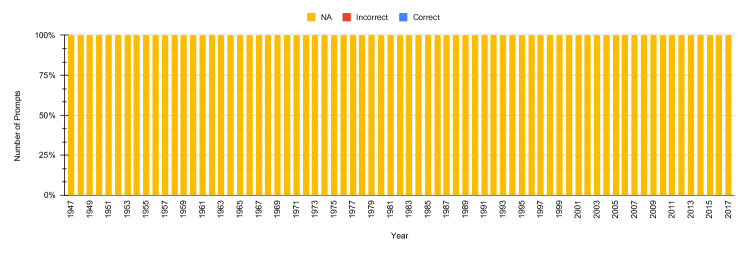
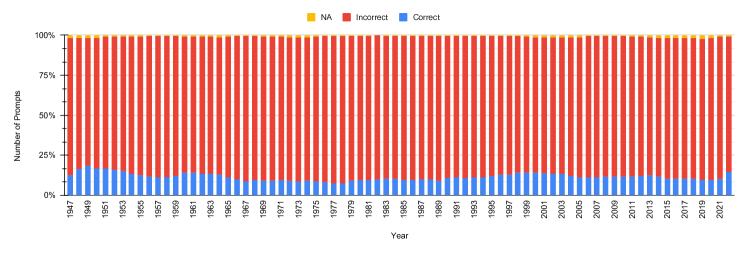
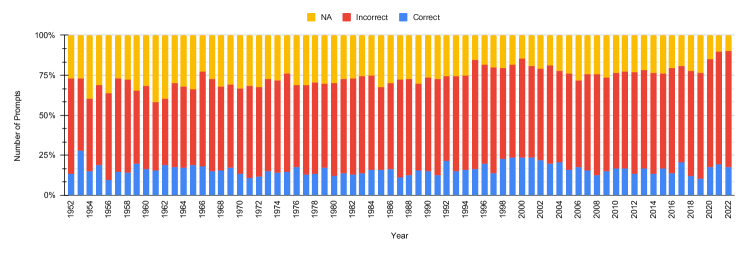
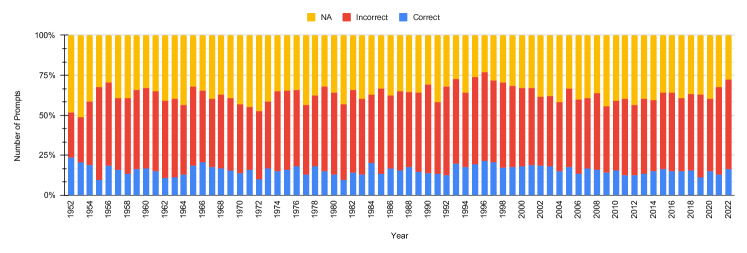
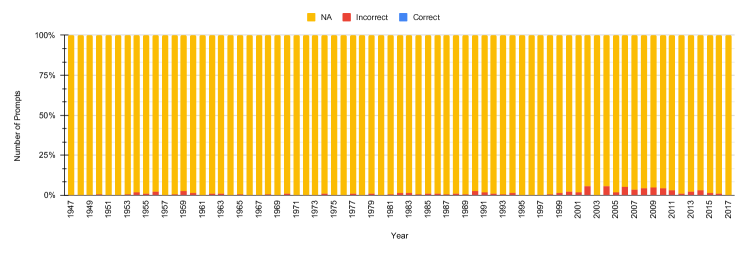
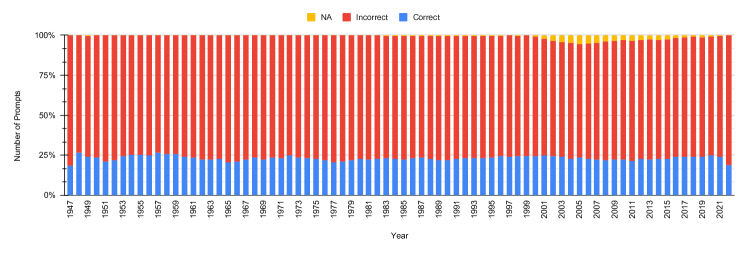
RQ3: Do different training paradigms affect overall temporal knowledge retention and reasoning capabilities? Compared to the zero-shot setting, all three fine-tuning paradigms (Yearwise Learning, Continual Learning, and Random Fine-tuning) presented in Tables 4, 5, and 6 significantly reduced the rate of incorrect generations for open-source models. However, this improvement came at the cost of a notable increase in “Information not available” responses. Interestingly, the proportion of correct generations showed a slight decrease compared to the zero-shot setting.
6 Conclusion and Future Directions
In this work, we identify a deficiency in LLMs concerning their ability to comprehend and process temporal information and reasoning. To address this gap, we introduce two variations of temporal-based datasets incorporating a numerical modality, which accounts for 83.87% of facts that undergo changes over time, TempUN and TempUNs. Our proposed dataset aims to facilitate the evaluation of temporal knowledge, enhancing their understanding and handling of time-sensitive numerical information. We propose six different metrics to evaluate the temporal information and reasoning. We also introduced three learning paradigms: Continual Learning, Yearwise Finetuning, and Random Finetuning. Our findings highlights that the current state-of-the-art LLMs tends to perform bad when the numerical-related temporal data is prompted. Future work will extend the dataset to include non-numerical modalities, covering a broader timespan and incorporating a higher percentage of facts that change over time, thereby enriching the models’ capacity for temporal reasoning.
Limitations
Our research emphasizes the limitations of LLMs in comprehending temporal knowledge and their inclination toward language acquisition rather than analyzing numerical trends. Our work encompasses historical data spanning from 10,000 BCE to 2100 years ago, comprising approximately 462K instances, leading to the creation of 9.4M temporal prompts. Due to computational constraints inherent in larger models, our experiments could only be conducted on a subset of the complete dataset, resulting in evaluations being carried out on 1,907 instances, constituting 104K samples spanning eight distinct categories. Our TempUN data covers the factual numerical data, and we plan to add the textual data in our future works. Adding to the future works, we plan to explore the different fine-tuning strategies, such as adapters, k-adapter, and others.
Ethics and Potential Risks
We have strictly adhered to the ethics and guidelines during the progress of our work. The data processing and preparation guidelines have been taken into consideration. The introduced data does NOT contain personal names, uniquely identifiable individuals, or offensive content. The data introduced solely contains the facts as listed on the OWD site.
Acknowledgements
This work is supported by the Prime Minister Research Fellowship (PMRF-1702154) to Himanshu Beniwal. Acknowledgment is extended to Dishant Patel, Hritik Ladia, Vamsi Srivathsa, Venkata Sriman, and Zeeshan Snehil Bhagat for their invaluable assistance during the experimental phase of this work. Special thanks are also due to Professor Nipun Batra and Zeel Patel for their support in fulfilling the computational requirements. A part of our work was supported by Microsoft’s Accelerate Foundation Models Research grant.
References
- Achiam et al. (2023) Josh Achiam, Steven Adler, Sandhini Agarwal, Lama Ahmad, Ilge Akkaya, Florencia Leoni Aleman, Diogo Almeida, Janko Altenschmidt, Sam Altman, Shyamal Anadkat, et al. 2023. Gpt-4 technical report. arXiv preprint arXiv:2303.08774.
- Agarwal and Nenkova (2022) Oshin Agarwal and Ani Nenkova. 2022. Temporal effects on pre-trained models for language processing tasks. Transactions of the Association for Computational Linguistics, 10:904–921.
- Anil et al. (2023) Rohan Anil, Sebastian Borgeaud, Yonghui Wu, Jean-Baptiste Alayrac, Jiahui Yu, Radu Soricut, Johan Schalkwyk, Andrew M Dai, Anja Hauth, et al. 2023. Gemini: a family of highly capable multimodal models. arXiv preprint arXiv:2312.11805.
- Biesialska et al. (2020) Magdalena Biesialska, Katarzyna Biesialska, and Marta R. Costa-jussà. 2020. Continual lifelong learning in natural language processing: A survey. In Proceedings of the 28th International Conference on Computational Linguistics, pages 6523–6541, Barcelona, Spain (Online). International Committee on Computational Linguistics.
- Chang et al. (2023) Yupeng Chang, Xu Wang, Jindong Wang, Yuan Wu, Linyi Yang, Kaijie Zhu, Hao Chen, Xiaoyuan Yi, Cunxiang Wang, Yidong Wang, et al. 2023. A survey on evaluation of large language models. ACM Transactions on Intelligent Systems and Technology.
- Chen et al. (2021) Wenhu Chen, Xinyi Wang, and William Yang Wang. 2021. A dataset for answering time-sensitive questions. In Thirty-fifth Conference on Neural Information Processing Systems Datasets and Benchmarks Track (Round 2).
- Dettmers et al. (2023) Tim Dettmers, Artidoro Pagnoni, Ari Holtzman, and Luke Zettlemoyer. 2023. Qlora: Efficient finetuning of quantized llms. arXiv preprint arXiv:2305.14314.
- Dhingra et al. (2022) Bhuwan Dhingra, Jeremy R. Cole, Julian Martin Eisenschlos, Daniel Gillick, Jacob Eisenstein, and William W. Cohen. 2022. Time-Aware Language Models as Temporal Knowledge Bases. Transactions of the Association for Computational Linguistics, 10:257–273.
- Gruver et al. (2023) Nate Gruver, Marc Finzi, Shikai Qiu, and Andrew Gordon Wilson. 2023. Large language models are zero-shot time series forecasters. arXiv preprint arXiv:2310.07820.
- Jain et al. (2023) Raghav Jain, Daivik Sojitra, Arkadeep Acharya, Sriparna Saha, Adam Jatowt, and Sandipan Dandapat. 2023. Do language models have a common sense regarding time? revisiting temporal commonsense reasoning in the era of large language models. In Proceedings of the 2023 Conference on Empirical Methods in Natural Language Processing, pages 6750–6774.
- Jang et al. (2022a) Joel Jang, Seonghyeon Ye, Changho Lee, Sohee Yang, Joongbo Shin, Janghoon Han, Gyeonghun Kim, and Minjoon Seo. 2022a. TemporalWiki: A lifelong benchmark for training and evaluating ever-evolving language models. In Proceedings of the 2022 Conference on Empirical Methods in Natural Language Processing, pages 6237–6250, Abu Dhabi, United Arab Emirates. Association for Computational Linguistics.
- Jang et al. (2022b) Joel Jang, Seonghyeon Ye, Changho Lee, Sohee Yang, Joongbo Shin, Janghoon Han, Gyeonghun Kim, and Minjoon Seo. 2022b. Temporalwiki: A lifelong benchmark for training and evaluating ever-evolving language models.
- Jiang et al. (2023) Albert Q Jiang, Alexandre Sablayrolles, Arthur Mensch, Chris Bamford, Devendra Singh Chaplot, Diego de las Casas, Florian Bressand, Gianna Lengyel, Guillaume Lample, Lucile Saulnier, et al. 2023. Mistral 7b. arXiv preprint arXiv:2310.06825.
- Knez and Žitnik (2023) Timotej Knez and Slavko Žitnik. 2023. Event-centric temporal knowledge graph construction: A survey. Mathematics, 11(23):4852.
- Li et al. (2023) Xingxuan Li, Liying Cheng, Qingyu Tan, Hwee Tou Ng, Shafiq Joty, and Lidong Bing. 2023. Unlocking temporal question answering for large language models using code execution.
- OpenAI (2022) OpenAI. 2022. Introducing chatgpt. https://openai.com/blog/chatgpt.
- Qiu et al. (2023) Yifu Qiu, Zheng Zhao, Yftah Ziser, Anna Korhonen, Edoardo M. Ponti, and Shay B. Cohen. 2023. Are large language models temporally grounded?
- Rosin and Radinsky (2022) Guy D. Rosin and Kira Radinsky. 2022. Temporal attention for language models. In Findings of the Association for Computational Linguistics: NAACL 2022, pages 1498–1508, Seattle, United States. Association for Computational Linguistics.
- Tan et al. (2023a) Qingyu Tan, Hwee Tou Ng, and Lidong Bing. 2023a. Towards benchmarking and improving the temporal reasoning capability of large language models. In Proceedings of the 61st Annual Meeting of the Association for Computational Linguistics (Volume 1: Long Papers), pages 14820–14835, Toronto, Canada. Association for Computational Linguistics.
- Tan et al. (2023b) Qingyu Tan, Hwee Tou Ng, and Lidong Bing. 2023b. Towards robust temporal reasoning of large language models via a multi-hop qa dataset and pseudo-instruction tuning. arXiv preprint arXiv:2311.09821.
- Touvron et al. (2023) Hugo Touvron, Thibaut Lavril, Gautier Izacard, Xavier Martinet, Marie-Anne Lachaux, Timothée Lacroix, Baptiste Rozière, Naman Goyal, Eric Hambro, Faisal Azhar, et al. 2023. Llama: Open and efficient foundation language models. arXiv preprint arXiv:2302.13971.
- Wang and Zhao (2023) Yuqing Wang and Yun Zhao. 2023. Tram: Benchmarking temporal reasoning for large language models. arXiv preprint arXiv:2310.00835.
- Wei et al. (2023) Yifan Wei, Yisong Su, Huanhuan Ma, Xiaoyan Yu, Fangyu Lei, Yuanzhe Zhang, Jun Zhao, and Kang Liu. 2023. MenatQA: A new dataset for testing the temporal comprehension and reasoning abilities of large language models. In Findings of the Association for Computational Linguistics: EMNLP 2023, pages 1434–1447, Singapore. Association for Computational Linguistics.
- Xiong et al. (2024) Siheng Xiong, Ali Payani, Ramana Kompella, and Faramarz Fekri. 2024. Large language models can learn temporal reasoning. arXiv preprint arXiv:2401.06853.
- Yu et al. (2023) Xinli Yu, Zheng Chen, and Yanbin Lu. 2023. Harnessing LLMs for temporal data - a study on explainable financial time series forecasting. In Proceedings of the 2023 Conference on Empirical Methods in Natural Language Processing: Industry Track, pages 739–753, Singapore. Association for Computational Linguistics.
- Yuan et al. (2023) Chenhan Yuan, Qianqian Xie, Jimin Huang, and Sophia Ananiadou. 2023. Back to the future: Towards explainable temporal reasoning with large language models. arXiv preprint arXiv:2310.01074.
Appendix A Appendix
A.1 Inferencing Models - Zeroshot Setting
To assess the model’s proficiency in processing numerical data, the identical sample was presented to various models with capacities exceeding 7 billion parameters, as illustrated in Figure 1. It was observed that contemporary, widely used models demonstrated a deficiency in relevant knowledge. This limitation became particularly evident when the prompt was slightly altered to include a temporal shift; the models tended to overestimate and generate responses that were not pertinent to the given context.
| Wikidata ID | Relation | Template | |
|---|---|---|---|
| 1 | P54 | member of sports team | <subject>plays for <object>. |
| 2 | P39 | position held | <subject>holds the position of <object>. |
| 3 | P108 | employer | <subject>works for <object>. |
| 4 | P102 | political party | <subject >is a member of the <object>. |
| 5 | P286 | head coach | <object>is the head coach of <subject>. |
| 6 | P69 | educated at | <subject>attended <object>. |
| 7 | P488 | chairperson | <object>is the chair of <subject>. |
| 8 | P6 | head of government | <object>is the head of the government of <sub.. |
| 9 | P127 | owned by | <subject>is owned by <object>. |
| Hyperparameter | Search Space |
|---|---|
| Batch Size | [8, 12, 16] |
| Epoch | [6 - 10] |
| Learning Rate | [2e-4, 2e-5, 2e-6] |
| Patience | [4] |
A.2 TempLAMA Dataset
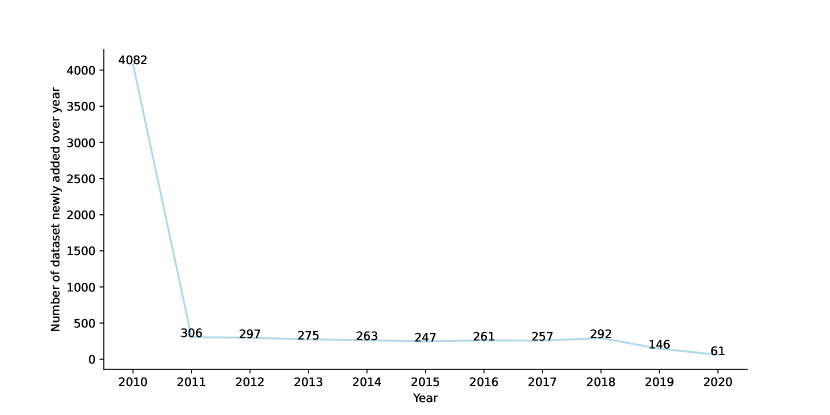
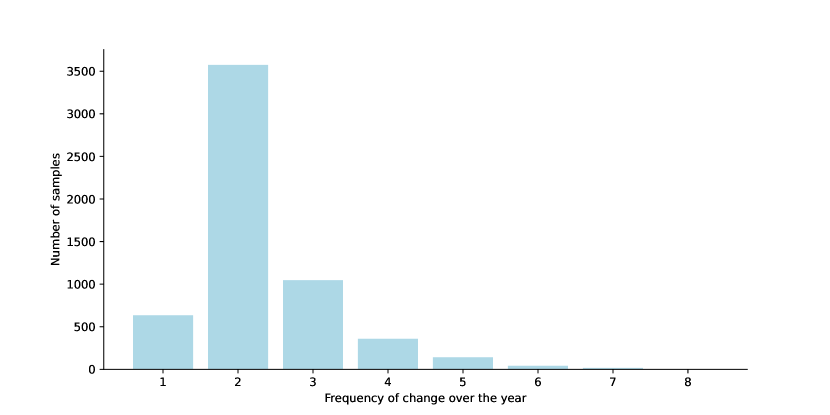
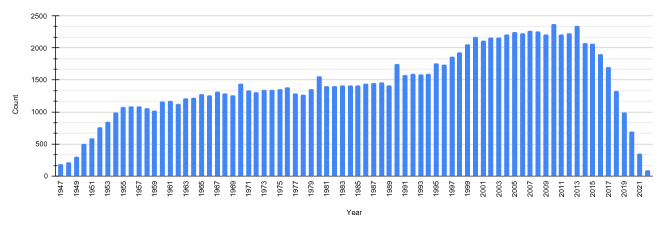
TempLAMA We also summarizes the previous available dataset: TempLAMA by Dhingra et al. (2022), which is a closed-book question-answering dataset. The dataset consists of events and 11 relations that change over the years. The dataset contains data for 11 years, 2010-2020. In the dataset, Valentino Rossi plays for _X_. a query changed only thrice over the year; in 2010, it was Yamaha Motor Racing then Ducati Motor Holding S.p.A. in 2011 and finally back to Yamaha Motor Racing from 2013 onwards. Figure 3 shows how frequently events changed over 11 years. We see that most of the events did not change frequently. In the dataset, each sample contains a subject (), relation () and objects () from years where there was a change. The TempLAMA dataset contains the nine different relations () that change over time. The list of each relation present and the template for each category in the dataset is available in Table 7. The Number of data samples newly added in each year is depicted in Figure 2.
A.3 Experimental Settings
In this section, we define the experimental configurations used to fine-tune the models.
While experimenting with the fine-tuning strategies, we use the following hyperparameters for all three close-source models: batch size (12), epoch (10), learning rate (2e-5), and patience (4), with the search space defined in Table 8.
A.4 Computational Resources
The experiments are carried out on four NVIDIA Tesla V100 32 GB. The estimated cost to cover the computational requirements for two months, computed over GCP is $9,460.78666The price for the VM is computed using the GCP Calculator: https://cloud.google.com/products/calculator. ($4,730.39-per month x 2 months). We utilized the official APIs for all of the close-source models.
| Categories | Subcategories | Instances | Samples | Instancess | Sampless |
|---|---|---|---|---|---|
| C: Climate | 19 | 95,289 | 1,778,631 | 244 | 17,928 |
| C: Food and Agriculture | 10 | 33,610 | 991,443 | 279 | 11,133 |
| C: Health | 34 | 245,330 | 5,684,312 | 260 | 18,599 |
| C: Human Rights | 8 | 3,132 | 7,142 | 190 | 5,373 |
| C: Innovation | 4 | 567 | 1,537 | 227 | 5,813 |
| C: Migration | 1 | 18,167 | 100,346 | 255 | 17,232 |
| C: Economic Development | 25 | 59,483 | 909,519 | 250 | 18,716 |
| C: Peace and War | 5 | 7,316 | 24,572 | 202 | 9,336 |
| Total | 106 | 462,894 | 9,497,502 | 1,907 | 104,130 |
A.5 TempUN Dataset
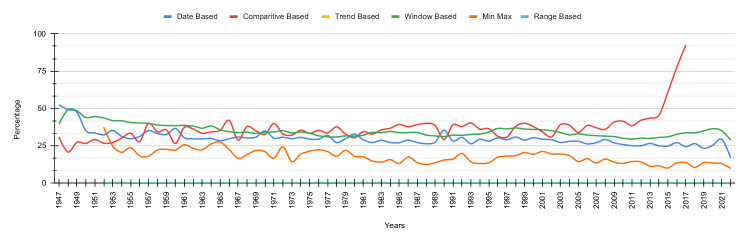
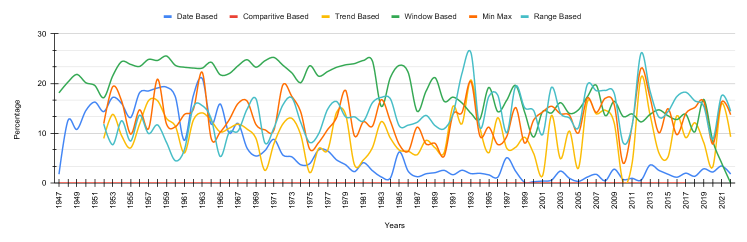
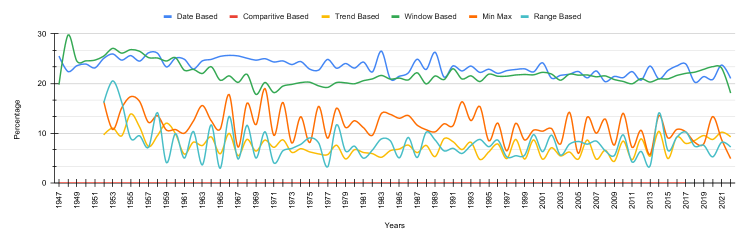
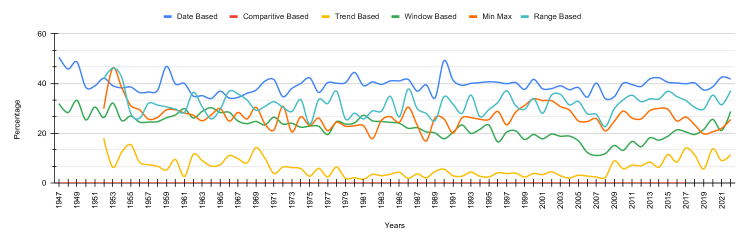
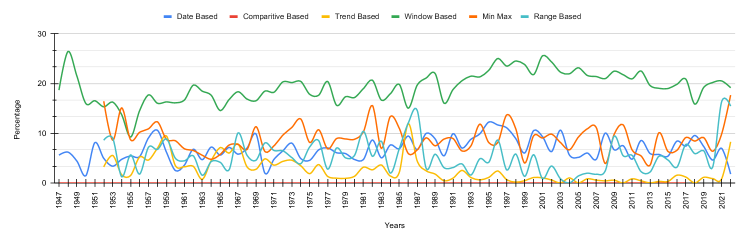
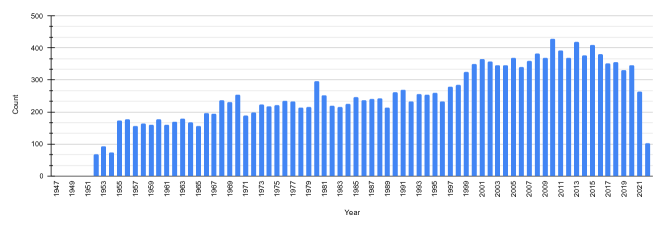
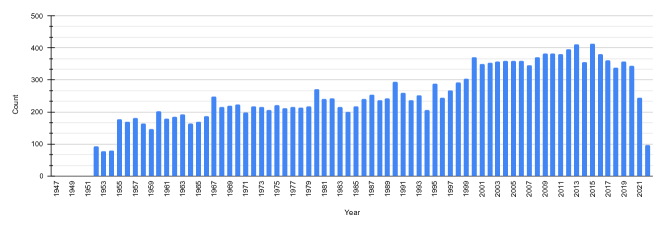
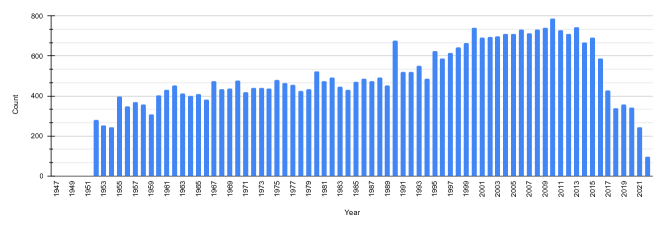
We further explain the categories as mentioned in Table 1; in Tables: 12 (Climate), 13 (Food and Agriculture), 14 (Health), 15 (Human Rights), 16 (Innovation and Technological Change), 17 (Migration), 18 (Poverty, Economic Development, and Community), and 19 (Peace and War). We highlight the yearwise count of MCQs in each MCQ-based strategy as: Figure 4 (), 5 (), 6 (), 7 (), 8 (), and 9 (). Overall, we also showcase the category-wise distribution for each strategy in Table 11. Apart from categories ‘C4’ and ‘C5’, all of the categories seem to have a higher number of MCQs.
A.6 MCQ-Based Strategy Yearwise Performance - Zero Shot Results
We highlight the poor temporal understanding of models:
- 1.
- 2.
- 3.
- 4.
- 5.
- 6.
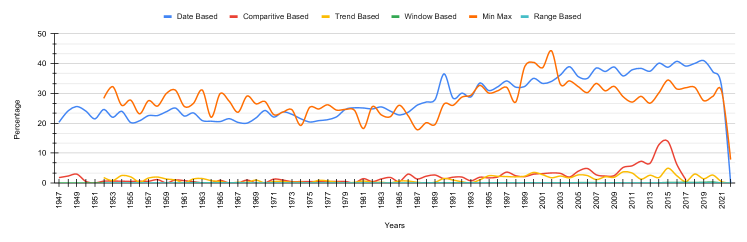
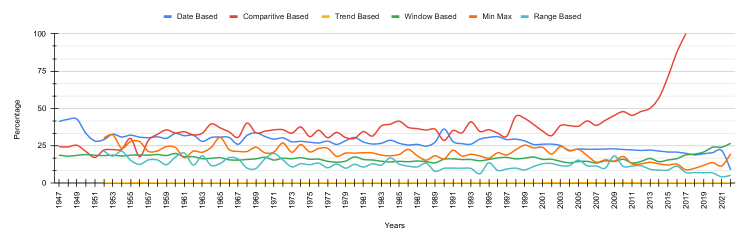
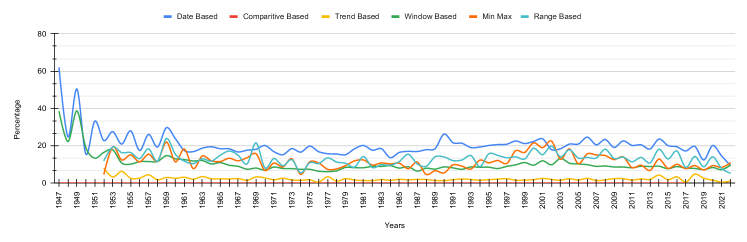
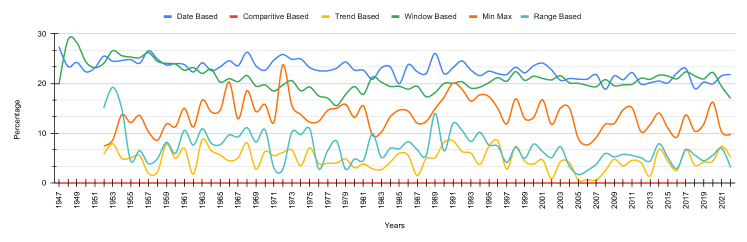
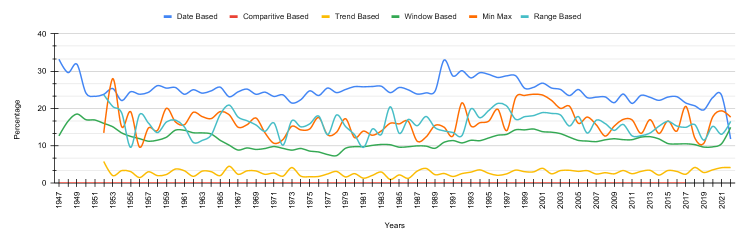
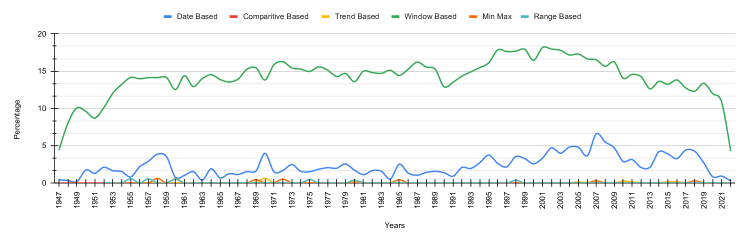
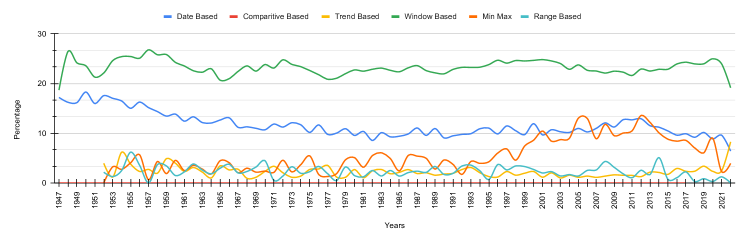
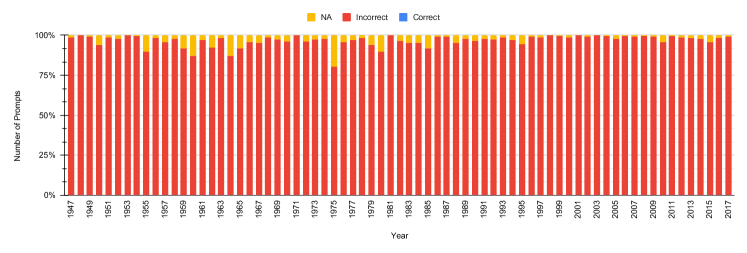
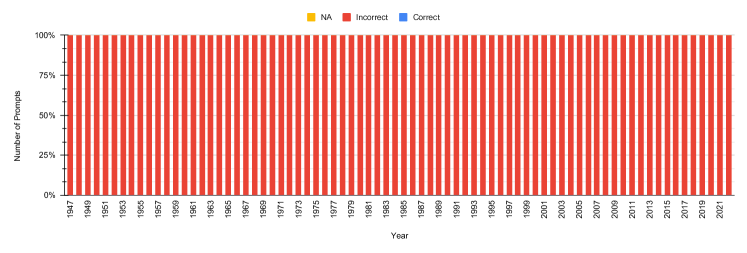
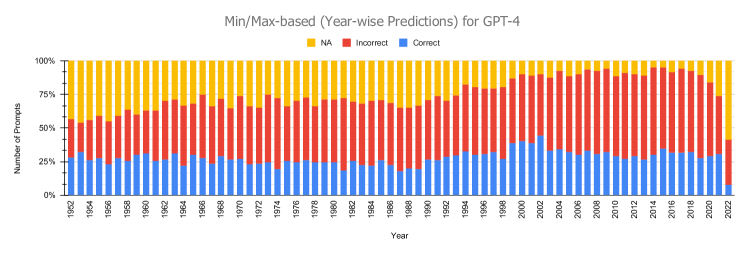
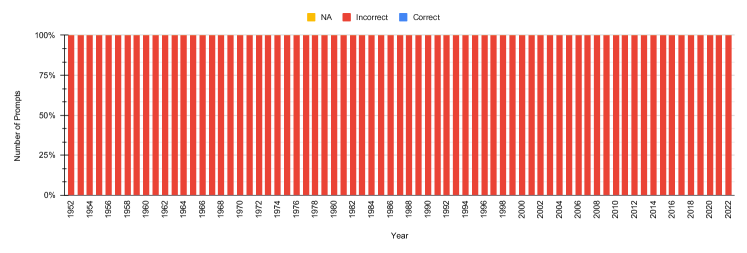
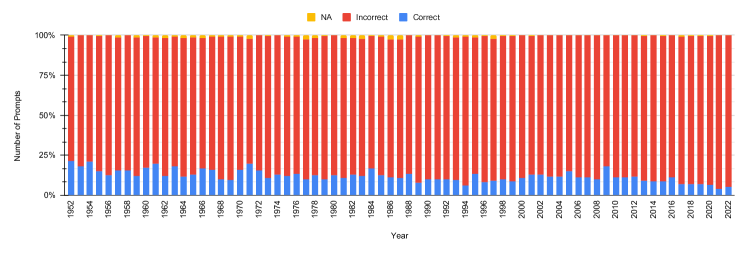
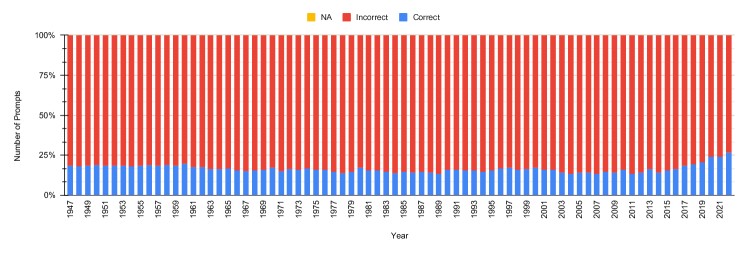
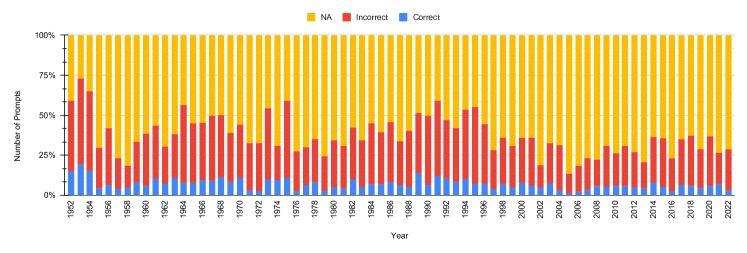
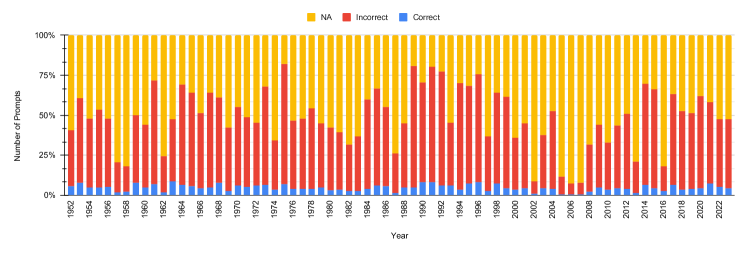
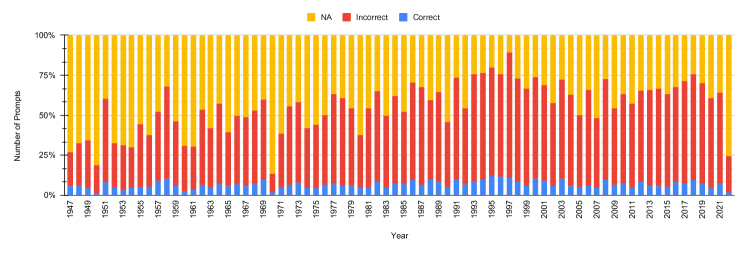
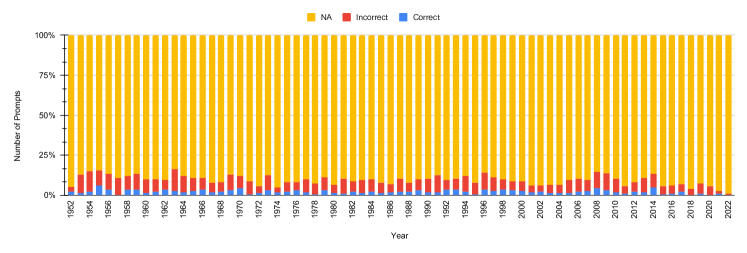
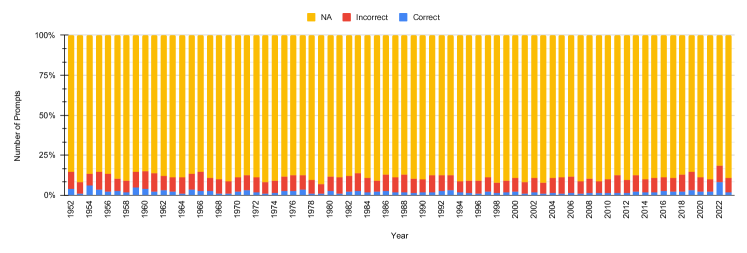
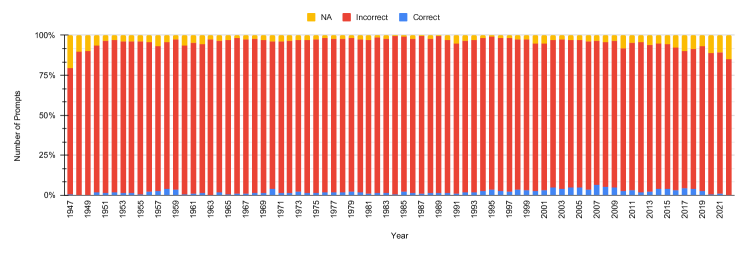
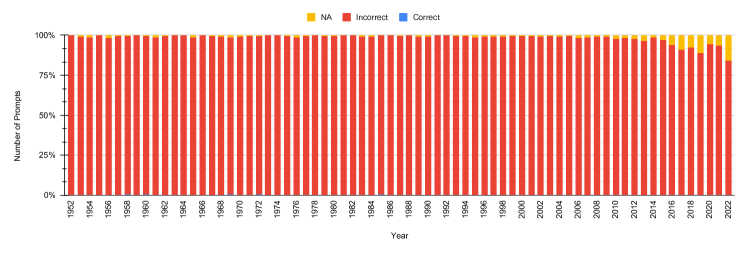
We can observe that all the models (Tables 20 to 55) show that the LLMs produce more incorrect results than the correct results. We show the combined plots for all six metrics: mistral-instruct (Figure 11), llama-2 (Figure 12), and phi-2 (Figure 13), gemini-pro (Figure 14), gpt-4 (Figure 15), and gpt-35-turbo (Figure 16). But gpt-4 (Figure 15) has shown date-base () and min-max () metric more yielding.
A.7 Continual Learning
We present the following figures for different open-source models, showing the yearwise performance when finetuned in continual learning paradigm for the “Correct”, “Incorrect”, and “Information Not Available” labels. We also show a compared version for all metrics in Figure 18 (phi-2), 17 (mistral-instruct), and 19 (llama-2-chat). We observe that the scores started decreasing as we proceed yearly for mistral-instruct.
- 1.
- 2.
- 3.
A.8 Yearwise Finetuning
A.9 Random Finetuning
We present the following figures for different open-source models, showing the yearwise performance when finetuned in random finetuning paradigm. We combinedly show all metrics in Figures 24 (phi-2), 23 (mistral-instruct), and 25 (llama-2-chat) for random-finetuning strategy.
- 1.
- 2.
- 3.
| Categories | ||||||
|---|---|---|---|---|---|---|
| C: Climate | 1,778,631 | 672,993 | 603,882 | 603,882 | 603,882 | 603,876 |
| C: Food and Agriculture | 991,443 | 236,665 | 213,328 | 213,328 | 213,328 | 213,328 |
| C: Health | 5,684,312 | 1,891,152 | 1,739,273 | 1,739,273 | 1,739,273 | 1,739,273 |
| C: Human Rights | 7,142 | 5,939 | 1,328 | 1,328 | 1,328 | 1,328 |
| C: Innovation | 1,537 | 1,247 | 384 | 384 | 384 | 384 |
| C: Migration | 100,346 | 100,023 | 24,116 | 24,116 | 24,116 | 24,116 |
| C: Economic Development | 909,519 | 402,217 | 305,373 | 305,373 | 305,373 | 305,373 |
| C: War | 24,572 | 15,347 | 11,215 | 11,215 | 11,215 | 11,215 |
| Total | 9,497,502 | 3,325,583 | 2,898,899 | 2,898,899 | 2,898,899 | 2,898,893 |
| Categories | ||||||
|---|---|---|---|---|---|---|
| C: Climate | 17,928 | 2,440 | 2,440 | 732 | 732 | 732 |
| C: Food and Agriculture | 11,133 | 2,617 | 2,495 | 769 | 769 | 769 |
| C: Health | 18,599 | 2,579 | 2,570 | 771 | 771 | 771 |
| C: Human Rights | 5,373 | 1,823 | 1,778 | 559 | 559 | 559 |
| C: Innovation | 5,813 | 2,198 | 2,176 | 657 | 657 | 657 |
| C: Migration | 17,232 | 2,550 | 2,550 | 765 | 765 | 765 |
| C: Economic Development | 18,716 | 2,500 | 2,500 | 750 | 750 | 750 |
| C: War | 9,336 | 1,801 | 1,759 | 531 | 531 | 531 |
| Total | 104,130 | 18,508 | 18,268 | 5,534 | 5,534 | 5,534 |
| Categories | # of instances |
|---|---|
| Access To Energy | 2,088 |
| Air Pollution | 6,424 |
| Biodiversity | 12,108 |
| Clean Water and Sanitization | 34,214 |
| Climate Change | 251 |
| CO2 and Greenhouse Gas Emissions | 30,785 |
| Energy | 11,483 |
| Forests and Deforestation | 5,030 |
| Fossil Fuels | 2,532 |
| Indoor Air Pollution | 2,712 |
| Lead Pollution | 1,114 |
| Natural Disasters | 5,210 |
| Nuclear Energy | 730 |
| Oil Spills | 30 |
| Ozone Layer | 763 |
| Pesticides | 1,435 |
| Plastic Pollution | 3,008 |
| Pollution | 5,827 |
| Water Use and Stress | 2,136 |
| Total | 127,880 |
| Categories | # of instances |
|---|---|
| Agricultural Production | 9,087 |
| Animal Welfare | 3,313 |
| Crop Yields | 9,199 |
| Environmental Impacts of Food Production | 1,638 |
| Environmental Impacts of Food Production (Food and Agriculture) | 1,276 |
| Famines | 943 |
| Fertilizers | 4,091 |
| Food Prices | 2,762 |
| Land Use | 12,134 |
| Meat and Dairy Production | 12,628 |
| Total | 57,071 |
| Categories | # of instances |
| Alcohol Consumption | 9,494 |
| Burden of Disease | 6,956 |
| Cardiovascular Diseases | 9,623 |
| Causes of Death | 52,430 |
| Child and Infant Mortality | 22,176 |
| Covid | 10,744 |
| Diarrheal Diseases | 14,312 |
| Diet Compositions | 12,825 |
| Eradication of Diseases | 7,133 |
| Fertility Rate | 2,330 |
| Global Health | 3,276 |
| Happiness and Satisfaction | 396 |
| Healthcare Spending | 3,568 |
| HIV | 21,602 |
| Human Height | 2,855 |
| Hunger and Undernourishment | 4,694 |
| Influenza | 11,013 |
| Life Expectancy | 18,227 |
| Malaria | 4,886 |
| Maternal Mortality | 3,936 |
| Mental Health | 8,490 |
| Micronutrient Deficiency | 2,659 |
| Monkeypox | 1,353 |
| Obesity | 7,806 |
| Opioids | 11,468 |
| Pandemics | 4,224 |
| Pneumonia | 2,400 |
| Polio | 2,021 |
| Sanitation | 4,647 |
| Smallpox | 273 |
| Smoking | 5,429 |
| Suicides | 6,374 |
| Tetanus | 2,391 |
| Vaccination | 10,195 |
| Total | 292,206 |
| Categories | # of instances |
|---|---|
| Child Labor | 605 |
| Human Rights | 10,566 |
| LGBT | 647 |
| Literacy | 1,375 |
| Loneliness and social connections | 478 |
| Marriages and divorces | 901 |
| Trust | 598 |
| Violence against Children | 1,530 |
| Total | 16,700 |
| Categories | # of instances |
|---|---|
| Artificial-Intelligence | 3,883 |
| Internet | 1,991 |
| Research-And-Development | 2,973 |
| Technology change | 792 |
| Total | 9,639 |
| Categories | # of instances |
|---|---|
| International Migration and Refugees | 36,226 |
| Total | 36,226 |
| Categories | # of instances |
|---|---|
| Age | 3,048 |
| Books | 109 |
| Corruption | 2,228 |
| Economic-Inequality | 7,592 |
| Education-Spending | 845 |
| Employment-In-Agriculture | 3,382 |
| Gender Ratio | 4,783 |
| Global-Education | 15,933 |
| Government-Spending | 1,393 |
| Homelessness | 18 |
| Human Development Index | 2,624 |
| Light at Night | 12 |
| Poverty | 8,969 |
| Renewable Energy | 3,322 |
| State-Capacity | 4,298 |
| Taxation | 1,350 |
| Time use | 167 |
| Tourism | 3,058 |
| Trade and globalization | 7,073 |
| Transportation | 717 |
| Urbanization | 4,804 |
| Women Employment | 3,304 |
| Women Rights | 5,573 |
| Working Hours | 260 |
| GDP | 1 |
| Total | 84,863 |
| Categories | # of instances |
|---|---|
| Homicide | 16,959 |
| Military spending | 1,689 |
| Nuclear-Weapons | 75 |
| Terrorism | 9,823 |
| War and Peace | 30 |
| Total | 28,576 |
| Category | Correctly Answered | Incorrectly Answered | Not Answered |
|---|---|---|---|
| C: Climate | 40.7 | 17.56 | 41.74 |
| C: Food and Agriculture | 23.25 | 71.5 | 5.25 |
| C: Health | 41.39 | 58.35 | 0.26 |
| C: Human Rights | 28.85 | 45.26 | 25.89 |
| C: Innovation | 30.45 | 68.6 | 0.95 |
| C: Migration | 36.83 | 59.99 | 3.18 |
| C: Economic Development | 45.86 | 53.99 | 0.15 |
| C: Peace and War | 31.22 | 48.37 | 20.4 |
| Total | 37.21 | 51.22 | 11.57 |
| Category | Correctly Answered | Incorrectly Answered | Not Answered |
|---|---|---|---|
| C: Climate | 47.25 | 52.75 | 0.0 |
| C: Food and Agriculture | 52.24 | 47.76 | 0.0 |
| C: Health | 15.82 | 84.18 | 0.0 |
| C: Human Rights | 61.0 | 39.0 | 0.0 |
| C: Innovation | 28.53 | 71.47 | 0.0 |
| C: Migration | 65.49 | 34.51 | 0.0 |
| C: Economic Development | 13.76 | 86.24 | 0.0 |
| C: Peace and War | 70.13 | 29.87 | 0 |
| Total | 42.92 | 57.08 | 0.0 |
| Category | Correctly Answered | Incorrectly Answered | Not Answered |
|---|---|---|---|
| C: Climate | 6.84 | 93.16 | 0.0 |
| C: Food and Agriculture | 10.74 | 89.26 | 0.0 |
| C: Health | 25.49 | 74.51 | 0.0 |
| C: Human Rights | 18.11 | 81.89 | 0.0 |
| C: Innovation | 19.72 | 80.28 | 0.0 |
| C: Migration | 36.35 | 63.65 | 0.0 |
| C: Economic Development | 22.16 | 77.84 | 0.0 |
| C: Peace and War | 16.37 | 83.63 | 0 |
| Total | 19.76 | 80.24 | 0.0 |
| Category | Correctly Answered | Incorrectly Answered | Not Answered |
|---|---|---|---|
| C: Climate | 19.39 | 9.26 | 71.35 |
| C: Food and Agriculture | 13.03 | 85.09 | 1.88 |
| C: Health | 17.98 | 81.67 | 0.35 |
| C: Human Rights | 20.58 | 52.98 | 26.43 |
| C: Innovation | 31.43 | 68.57 | 0.0 |
| C: Migration | 28.9 | 69.02 | 2.08 |
| C: Economic Development | 26.2 | 70.48 | 3.32 |
| C: Peace and War | 29.62 | 68.33 | 2.05 |
| Total | 23.12 | 63.53 | 13.35 |
| Category | Correctly Answered | Incorrectly Answered | Not Answered |
|---|---|---|---|
| C: Climate | 23.57 | 76.43 | 0.0 |
| C: Food and Agriculture | 30.42 | 69.58 | 0.0 |
| C: Health | 37.12 | 62.88 | 0.0 |
| C: Human Rights | 19.01 | 80.99 | 0.0 |
| C: Innovation | 36.12 | 63.88 | 0.0 |
| C: Migration | 34.27 | 65.73 | 0.0 |
| C: Economic Development | 43.24 | 56.76 | 0.0 |
| C: Peace and War | 44.06 | 55.94 | 0 |
| Total | 33.62 | 66.38 | 0.0 |
| Category | Correctly Answered | Incorrectly Answered | Not Answered |
|---|---|---|---|
| C: Climate | 22.83 | 15.61 | 61.56 |
| C: Food and Agriculture | 9.54 | 84.45 | 6.01 |
| C: Health | 1.91 | 95.06 | 3.04 |
| C: Human Rights | 7.54 | 82.56 | 9.9 |
| C: Innovation | 8.13 | 89.2 | 2.67 |
| C: Migration | 5.1 | 64.08 | 30.82 |
| C: Economic Development | 2.76 | 77.92 | 19.32 |
| C: Peace and War | 3.35 | 56.57 | 40.08 |
| Total | 7.73 | 70.71 | 21.56 |
| Category | Correctly Answered | Incorrectly Answered | Not Answered |
|---|---|---|---|
| C: Climate | 7.25 | 92.75 | 0.0 |
| C: Food and Agriculture | 12.47 | 87.51 | 0.02 |
| C: Health | 9.9 | 90.1 | 0.0 |
| C: Human Rights | 13.68 | 86.32 | 0.0 |
| C: Innovation | 4.8 | 95.2 | 0.0 |
| C: Migration | 15.54 | 84.46 | 0.0 |
| C: Economic Development | 11.27 | 88.73 | 0.0 |
| C: Peace and War | 10.96 | 89.04 | 0 |
| Total | 10.9 | 89.1 | 0.0 |
| Category | Correctly Answered | Incorrectly Answered | Not Answered |
|---|---|---|---|
| C: Climate | 0.0 | 100.0 | 0.0 |
| C: Food and Agriculture | 0.0 | 99.92 | 0.08 |
| C: Health | 0.0 | 100.0 | 0.0 |
| C: Human Rights | 0.0 | 97.59 | 2.41 |
| C: Innovation | 0.0 | 100.0 | 0.0 |
| C: Migration | 0.0 | 100.0 | 0.0 |
| C: Economic Development | 0.0 | 85.88 | 14.12 |
| C: Peace and War | 0 | 91.23 | 8.77 |
| Total | 0.0 | 96.99 | 3.01 |
| Category | Correctly Answered | Incorrectly Answered | Not Answered |
|---|---|---|---|
| C: Climate | 19.39 | 80.61 | 0.0 |
| C: Food and Agriculture | 19.32 | 80.68 | 0.0 |
| C: Health | 12.53 | 87.47 | 0.0 |
| C: Human Rights | 22.83 | 77.17 | 0.0 |
| C: Innovation | 17.92 | 82.08 | 0.0 |
| C: Migration | 18.27 | 81.73 | 0.0 |
| C: Economic Development | 14.56 | 85.44 | 0.0 |
| C: Peace and War | 23.88 | 76.12 | 0 |
| Total | 18.19 | 81.81 | 0.0 |
| Category | Correctly Answered | Incorrectly Answered | Not Answered |
|---|---|---|---|
| C: Climate | 4.14 | 95.86 | 0.0 |
| C: Food and Agriculture | 6.09 | 93.91 | 0.0 |
| C: Health | 2.3 | 97.7 | 0.0 |
| C: Human Rights | 13.39 | 86.61 | 0.0 |
| C: Innovation | 8.41 | 91.59 | 0.0 |
| C: Migration | 12.43 | 87.57 | 0.0 |
| C: Economic Development | 5.44 | 93.72 | 0.84 |
| C: Peace and War | 12.39 | 87.21 | 0.4 |
| Total | 7.69 | 92.16 | 0.15 |
| Category | Correctly Answered | Incorrectly Answered | Not Answered |
|---|---|---|---|
| C: Climate | 10.7 | 87.42 | 1.89 |
| C: Food and Agriculture | 8.5 | 91.14 | 0.36 |
| C: Health | 1.28 | 98.72 | 0.0 |
| C: Human Rights | 17.89 | 82.11 | 0.0 |
| C: Innovation | 6.53 | 93.47 | 0.0 |
| C: Migration | 11.88 | 88.12 | 0.0 |
| C: Economic Development | 8.08 | 83.56 | 8.36 |
| C: Peace and War | 13.42 | 79.65 | 6.94 |
| Total | 9.34 | 88.54 | 2.11 |
| Category | Correctly Answered | Incorrectly Answered | Not Answered |
|---|---|---|---|
| C: Climate | 1.11 | 98.89 | 0.0 |
| C: Food and Agriculture | 2.89 | 97.11 | 0.0 |
| C: Health | 11.21 | 88.79 | 0.0 |
| C: Human Rights | 2.02 | 96.01 | 1.97 |
| C: Innovation | 6.07 | 92.97 | 0.97 |
| C: Migration | 11.96 | 88.04 | 0.0 |
| C: Economic Development | 5.24 | 90.28 | 4.48 |
| C: Peace and War | 3.81 | 93.63 | 2.56 |
| Total | 5.79 | 93.04 | 1.17 |
| Category | Correctly Answered | Incorrectly Answered | Not Answered |
|---|---|---|---|
| C: Climate | 27.04 | 57.96 | 15.0 |
| C: Food and Agriculture | 14.9 | 85.02 | 0.08 |
| C: Health | 18.97 | 80.93 | 0.1 |
| C: Human Rights | 25.18 | 74.61 | 0.2 |
| C: Innovation | 19.73 | 78.87 | 1.39 |
| C: Migration | 22.21 | 76.83 | 0.95 |
| C: Economic Development | 19.23 | 80.75 | 0.01 |
| C: Peace and War | 18.82 | 79.88 | 1.3 |
| Total | 20.86 | 76.17 | 2.97 |
| Category | Correctly Answered | Incorrectly Answered | Not Answered |
|---|---|---|---|
| C: Climate | 47.09 | 52.91 | 0.0 |
| C: Food and Agriculture | 52.54 | 47.46 | 0.0 |
| C: Health | 12.76 | 87.24 | 0.0 |
| C: Human Rights | 40.43 | 59.57 | 0.0 |
| C: Innovation | 68.06 | 31.94 | 0.0 |
| C: Migration | 63.69 | 36.31 | 0.0 |
| C: Economic Development | 13.72 | 86.28 | 0.0 |
| C: Peace and War | 69.52 | 30.48 | 0 |
| Total | 44.87 | 55.13 | 0.0 |
| Category | Correctly Answered | Incorrectly Answered | Not Answered |
|---|---|---|---|
| C: Climate | 23.81 | 76.19 | 0.0 |
| C: Food and Agriculture | 16.31 | 83.69 | 0.0 |
| C: Health | 24.2 | 75.8 | 0.0 |
| C: Human Rights | 23.45 | 76.55 | 0.0 |
| C: Innovation | 24.17 | 75.83 | 0.0 |
| C: Migration | 15.65 | 84.35 | 0.0 |
| C: Economic Development | 23.2 | 76.8 | 0.0 |
| C: Peace and War | 23.88 | 76.12 | 0 |
| Total | 21.63 | 78.37 | 0.0 |
| Category | Correctly Answered | Incorrectly Answered | Not Answered |
|---|---|---|---|
| C: Climate | 10.16 | 68.98 | 20.86 |
| C: Food and Agriculture | 8.3 | 91.58 | 0.12 |
| C: Health | 14.05 | 85.95 | 0.0 |
| C: Human Rights | 17.49 | 80.48 | 2.02 |
| C: Innovation | 12.82 | 87.13 | 0.05 |
| C: Migration | 20.43 | 72.43 | 7.14 |
| C: Economic Development | 19.76 | 80.24 | 0.0 |
| C: Peace and War | 17.06 | 82.89 | 0.06 |
| Total | 14.89 | 81.1 | 4.01 |
| Category | Correctly Answered | Incorrectly Answered | Not Answered |
|---|---|---|---|
| C: Climate | 19.1 | 80.9 | 0.0 |
| C: Food and Agriculture | 13.91 | 86.09 | 0.0 |
| C: Health | 17.82 | 82.18 | 0.0 |
| C: Human Rights | 31.66 | 68.34 | 0.0 |
| C: Innovation | 25.69 | 74.31 | 0.0 |
| C: Migration | 21.29 | 78.71 | 0.0 |
| C: Economic Development | 24.32 | 75.68 | 0.0 |
| C: Peace and War | 21.77 | 78.23 | 0 |
| Total | 21.5 | 78.5 | 0.0 |
| Category | Correctly Answered | Incorrectly Answered | Not Answered |
|---|---|---|---|
| C: Climate | 2.17 | 93.2 | 4.63 |
| C: Food and Agriculture | 0.64 | 97.8 | 1.56 |
| C: Health | 4.16 | 95.41 | 0.43 |
| C: Human Rights | 5.46 | 92.63 | 1.91 |
| C: Innovation | 4.0 | 95.36 | 0.64 |
| C: Migration | 9.02 | 87.45 | 3.53 |
| C: Economic Development | 8.28 | 89.32 | 2.4 |
| C: Peace and War | 5.34 | 90.51 | 4.15 |
| Total | 4.88 | 92.75 | 2.38 |
| Category | Correctly Answered | Incorrectly Answered | Not Answered |
|---|---|---|---|
| C: Climate | 70.05 | 29.95 | 0 |
| C: Food and Agriculture | 3.34 | 96.66 | 0 |
| C: Health | 27.36 | 72.64 | 0 |
| C: Human Rights | 42.84 | 57.16 | 0 |
| C: Innovation | 19.96 | 80.04 | 0 |
| C: Migration | 18.72 | 81.28 | 0 |
| C: Economic Development | 16.39 | 83.61 | 0 |
| C: Peace and War | 29.48 | 70.52 | 0 |
| Total | 29.31 | 70.69 | 0 |
| Category | Correctly Answered | Incorrectly Answered | Not Answered |
|---|---|---|---|
| C: Climate | 43.73 | 56.27 | 0 |
| C: Food and Agriculture | 53.88 | 46.12 | 0 |
| C: Health | 12.45 | 87.55 | 0 |
| C: Human Rights | 46.02 | 53.98 | 0 |
| C: Innovation | 28.53 | 71.47 | 0 |
| C: Migration | 62.67 | 37.33 | 0 |
| C: Economic Development | 15.04 | 84.96 | 0 |
| C: Peace and War | 46.09 | 53.91 | 0 |
| Total | 38.19 | 61.81 | 0 |
| Category | Correctly Answered | Incorrectly Answered | Not Answered |
|---|---|---|---|
| C: Climate | 63.2 | 36.8 | 0 |
| C: Food and Agriculture | 15.87 | 84.13 | 0 |
| C: Health | 29.96 | 70.04 | 0 |
| C: Human Rights | 29.7 | 70.3 | 0 |
| C: Innovation | 33.69 | 66.31 | 0 |
| C: Migration | 26.04 | 73.96 | 0 |
| C: Economic Development | 42.36 | 57.64 | 0 |
| C: Peace and War | 29.11 | 70.89 | 0 |
| Total | 33.96 | 66.04 | 0 |
| Category | Correctly Answered | Incorrectly Answered | Not Answered |
|---|---|---|---|
| C: Climate | 40.82 | 59.18 | 0 |
| C: Food and Agriculture | 6.01 | 93.99 | 0 |
| C: Health | 19.49 | 79.53 | 0.97 |
| C: Human Rights | 11.25 | 87.57 | 1.18 |
| C: Innovation | 18.98 | 80.93 | 0.09 |
| C: Migration | 12.24 | 87.76 | 0 |
| C: Economic Development | 13.72 | 86.28 | 0 |
| C: Peace and War | 8.75 | 90.22 | 1.02 |
| Total | 16.8 | 82.84 | 0.36 |
| Category | Correctly Answered | Incorrectly Answered | Not Answered |
|---|---|---|---|
| C: Climate | 0 | 99.96 | 0.04 |
| C: Food and Agriculture | 0 | 100 | 0 |
| C: Health | 0 | 100 | 0 |
| C: Human Rights | 0 | 99.55 | 0.45 |
| C: Innovation | 0 | 99.95 | 0.05 |
| C: Migration | 0 | 100 | 0 |
| C: Economic Development | 0 | 94.24 | 5.76 |
| C: Peace and War | 0 | 99.89 | 0.11 |
| Total | 0 | 99.15 | 0.85 |
| Category | Correctly Answered | Incorrectly Answered | Not Answered |
|---|---|---|---|
| C: Climate | 0 | 100 | 0 |
| C: Food and Agriculture | 0 | 100 | 0 |
| C: Health | 0.16 | 99.84 | 0 |
| C: Human Rights | 0.11 | 99.89 | 0 |
| C: Innovation | 0.05 | 99.95 | 0 |
| C: Migration | 0.16 | 99.84 | 0 |
| C: Economic Development | 0.16 | 99.84 | 0 |
| C: Peace and War | 0.11 | 99.89 | 0 |
| Total | 0.09 | 99.91 | 0 |
| Category | Correctly Answered | Incorrectly Answered | Not Answered |
|---|---|---|---|
| C: Climate | 30.35 | 5.56 | 64.09 |
| C: Food and Agriculture | 14.37 | 38.8 | 46.82 |
| C: Health | 54.22 | 39.24 | 6.53 |
| C: Human Rights | 4.99 | 4.91 | 90.1 |
| C: Innovation | 33.05 | 65.8 | 1.15 |
| C: Migration | 25.62 | 40.48 | 33.9 |
| C: Economic Development | 26.27 | 60.41 | 13.33 |
| C: Peace and War | 17.76 | 17.44 | 64.8 |
| Total | 29.1 | 35.16 | 35.74 |
| Category | Correctly Answered | Incorrectly Answered | Not Answered |
|---|---|---|---|
| C: Climate | 0.37 | 99.63 | 0 |
| C: Food and Agriculture | 0.11 | 99.89 | 0 |
| C: Health | 5.16 | 94.84 | 0 |
| C: Human Rights | 0.22 | 99.78 | 0 |
| C: Innovation | 9.87 | 90.13 | 0 |
| C: Migration | 2.51 | 97.49 | 0 |
| C: Economic Development | 0.52 | 99.48 | 0 |
| C: Peace and War | 0.67 | 99.33 | 0 |
| Total | 2.46 | 97.54 | 0 |
| Category | Correctly Answered | Incorrectly Answered | Not Answered |
|---|---|---|---|
| C: Climate | 0 | 100 | 0 |
| C: Food and Agriculture | 0.08 | 99.92 | 0 |
| C: Health | 0 | 100 | 0 |
| C: Human Rights | 0 | 100 | 0 |
| C: Innovation | 0.14 | 99.86 | 0 |
| C: Migration | 0 | 100 | 0 |
| C: Economic Development | 0.08 | 99.92 | 0 |
| C: Peace and War | 0.06 | 99.94 | 0 |
| Total | 0.04 | 99.96 | 0 |
| Category | Correctly Answered | Incorrectly Answered | Not Answered |
|---|---|---|---|
| C: Climate | 44.63 | 8.81 | 46.56 |
| C: Food and Agriculture | 15.39 | 75.99 | 8.62 |
| C: Health | 56.85 | 41.09 | 2.06 |
| C: Human Rights | 22.95 | 31.44 | 45.61 |
| C: Innovation | 31.34 | 68.24 | 0.41 |
| C: Migration | 20.31 | 54.31 | 25.37 |
| C: Economic Development | 15.92 | 80.88 | 3.2 |
| C: Peace and War | 17.51 | 31.04 | 51.45 |
| Total | 28.73 | 50.16 | 21.11 |
| Category | Correctly Answered | Incorrectly Answered | Not Answered |
|---|---|---|---|
| C: Climate | 0 | 100 | 0 |
| C: Food and Agriculture | 0 | 100 | 0 |
| C: Health | 0 | 100 | 0 |
| C: Human Rights | 0 | 100 | 0 |
| C: Innovation | 0 | 100 | 0 |
| C: Migration | 0 | 100 | 0 |
| C: Economic Development | 0 | 100 | 0 |
| C: Peace and War | 0 | 100 | 0 |
| Total | 0 | 100 | 0 |
| Category | Correctly Answered | Incorrectly Answered | Not Answered |
|---|---|---|---|
| C: Climate | 3.24 | 0.82 | 95.94 |
| C: Food and Agriculture | 0 | 0.16 | 99.84 |
| C: Health | 0.54 | 12.57 | 86.89 |
| C: Human Rights | 0.06 | 0.06 | 99.89 |
| C: Innovation | 6.3 | 70.77 | 22.93 |
| C: Migration | 0.55 | 5.88 | 93.57 |
| C: Economic Development | 0.72 | 5.12 | 94.16 |
| C: Peace and War | 0.06 | 0.57 | 99.37 |
| Total | 1.45 | 11.91 | 86.64 |
| Category | Correctly Answered | Incorrectly Answered | Not Answered |
|---|---|---|---|
| C: Climate | 70.81 | 28.12 | 1.07 |
| C: Food and Agriculture | 28.21 | 71.31 | 0.48 |
| C: Health | 28.8 | 70.92 | 0.27 |
| C: Human Rights | 24.9 | 71.3 | 3.8 |
| C: Innovation | 25.34 | 74.47 | 0.19 |
| C: Migration | 7.56 | 92.17 | 0.27 |
| C: Economic Development | 8.63 | 86.38 | 4.99 |
| C: Peace and War | 12.96 | 86.46 | 0.58 |
| Total | 27.02 | 71.5 | 1.48 |
| Category | Correctly Answered | Incorrectly Answered | Not Answered |
|---|---|---|---|
| C: Climate | 47.09 | 52.91 | 0 |
| C: Food and Agriculture | 52.43 | 47.57 | 0 |
| C: Health | 11.98 | 88.02 | 0 |
| C: Human Rights | 40.43 | 59.57 | 0 |
| C: Innovation | 30.85 | 69.15 | 0 |
| C: Migration | 66.27 | 33.73 | 0 |
| C: Economic Development | 15.2 | 84.8 | 0 |
| C: Peace and War | 52.25 | 47.75 | 0 |
| Total | 39.2 | 60.8 | 0 |
| Category | Correctly Answered | Incorrectly Answered | Not Answered |
|---|---|---|---|
| C: Climate | 21.35 | 78.65 | 0 |
| C: Food and Agriculture | 1.32 | 98.68 | 0 |
| C: Health | 15.99 | 84.01 | 0 |
| C: Human Rights | 30.03 | 69.97 | 0 |
| C: Innovation | 13.01 | 86.99 | 0 |
| C: Migration | 14.71 | 85.29 | 0 |
| C: Economic Development | 13 | 87 | 0 |
| C: Peace and War | 24.79 | 75.21 | 0 |
| Total | 15.97 | 84.03 | 0 |
| Category | Correctly Answered | Incorrectly Answered | Not Answered |
|---|---|---|---|
| C: Climate | 42.66 | 57.34 | 0 |
| C: Food and Agriculture | 7.7 | 92.3 | 0 |
| C: Health | 18.91 | 81.09 | 0 |
| C: Human Rights | 11.92 | 88.08 | 0 |
| C: Innovation | 22.75 | 77.21 | 0.05 |
| C: Migration | 7.92 | 92.08 | 0 |
| C: Economic Development | 20.92 | 79.04 | 0.04 |
| C: Peace and War | 16.03 | 83.97 | 0 |
| Total | 18.79 | 81.2 | 0.01 |
| Category | Correctly Answered | Incorrectly Answered | Not Answered |
|---|---|---|---|
| C: Climate | 17.25 | 82.25 | 0.49 |
| C: Food and Agriculture | 9.24 | 89.72 | 1.04 |
| C: Health | 13.31 | 85.53 | 1.17 |
| C: Human Rights | 10.63 | 89.37 | 0 |
| C: Innovation | 12.13 | 87.42 | 0.45 |
| C: Migration | 7.45 | 91.69 | 0.86 |
| C: Economic Development | 15.96 | 83.88 | 0.16 |
| C: Peace and War | 7.62 | 92.33 | 0.06 |
| Total | 11.56 | 87.81 | 0.63 |
| Category | Correctly Answered | Incorrectly Answered | Not Answered |
|---|---|---|---|
| C: Climate | 0 | 100 | 0 |
| C: Food and Agriculture | 0 | 100 | 0 |
| C: Health | 0 | 99.61 | 0.39 |
| C: Human Rights | 0 | 100 | 0 |
| C: Innovation | 0.05 | 94.58 | 5.38 |
| C: Migration | 0 | 99.96 | 0.04 |
| C: Economic Development | 0.04 | 97.4 | 2.56 |
| C: Peace and War | 0.11 | 99.83 | 0.06 |
| Total | 0.02 | 98.92 | 1.06 |