Measurement of the thermal accommodation coefficient of helium on crystalline silicon at low-temperatures
Abstract
Proposals for next-generation gravitational wave observatories include cryogenically cooled 200-kg test mass mirrors suspended from pendulums and made of a crystalline material such as crystalline silicon. During operation of the observatories, these mirrors undergo heating due to the absorption of laser radiation of up to a watt. Low noise cooling techniques need to be developed. Low-pressure helium exchange gas at 5 K might contribute to the challenging task. Here, we report the measurement of the helium accommodation coefficient , which is the probability that a helium atom thermalises with a surface at a given temperature when reflected from it. We find for temperatures K, which increases the cooling power compared to recently used assumptions. The idea of free molecular flow helium gas cooling is thus supported and might find application in some observatory concepts.
-
February 2024
-
All figures and pictures by the authors under a CC BY 4.0 license
1 Introduction
The first observation of gravitational waves (GW) [1] marked the beginning of a new chapter in astronomy and cosmology, as gravitational wave detection offers a new way to study the universe alongside traditional telescope observations. Fast-forward to today, several improvements to the detectors [2, 3, 4] have been implemented. These sensitivity improvements contributed to many more event detections, thereby providing valuable information about the number density of black holes [5], the gravitational wave background [6], and an independently derived value of the rate at which the universe is expanding (Hubble constant ) [7].
With next-generation interferometers [8, 9, 10, 11, 12, 13, 14], further improvements in the sensitivity are targeted. With the detection of weaker signals, we can potentially gain knowledge about gravity, the structure of spacetime, supernovae, compact binary systems long before they merge, and cosmic inflation. To this end, the design plans consider cooling the laser mirrors and test masses of space-time (TMs), which are of the order of 100 kg and suspended as pendulums, to cryogenic temperatures. On the one hand, this is aimed at suppressing thermal noise, which is currently limiting in the range from 40 Hz to 100 Hz [15, 16]. On the other hand, this might enable higher light powers [11] thereby reducing shot noise, which is limiting above 100 Hz.
Today the Japanese KAGRA observatory [17, 4], which began initial observations in Feb 2020 [18], will finally exploit mirrors cooled to about 20 K. The designs of the European Einstein Telescope and LIGO Voyager incorporate cryo-cooling as well. The ET pathfinder project is currently evaluating different cryogenic configurations for the Einstein Telescope [19, 20] aiming at either 123 K or 18 K.
The mirrors in the arm cavities are suspended on meter-scale, thin wires, behaving like the well-understood harmonic oscillator: Disturbances above the resonance frequency are significantly reduced in amplitude. However, this excellent mechanical isolation comes with the drawback of substantial thermal isolation, as thin wires only conduct a very limited amount of heat. To reduce quantum shot noise, interferometric detectors need to use high-power lasers, which heat up mirror coatings and substrates. This thermal noise partially limits future observatories.
In a previous article [21], we proposed cooling the mirrors of a gravitational wave detector with a 5 K-helium gas at low pressure in the molecular flow regime. We showed that the momentum transfer results in an additional mirror displacement noise that is proportional to , where is the GW frequency. We concluded that gas cooling is particularly suitable for observatories aiming to detect events in the kilohertz range, such as the Neutron Star Extreme Matter Observatory (NEMO) [11].
The effectiveness of gas cooling depends on the thermal accommodation coefficient , which represents the fraction of the incident gas particles that thermalize with the TM. Its value depends on the type of gas, surface material, and temperature. For helium, has been measured at room temperature [22]. At 20 K, has been estimated, based on measurements with glass, platinum, and nickel surfaces [23]. Here, we measure the thermal accommodation coefficient of helium on crystalline silicon between 11 K and 30 K.
2 Heat transfer in gases
The heat transfer of gases confined in a volume is dependent on the mean free path compared to the wall-to-wall distance . The Knudsen number defines three regimes: viscous flow (), free molecular (), and transitional flow in between.
2.1 Gas cooling in the viscous flow regime
At ambient pressures, the presence of molecular collisions and momentum transfer between gas molecules almost always dominate the behavior of gases. This regime of gas dynamics is called viscous flow or continuous flow. Here, the heat transfer of gas between two identical, parallel plates of area , separated by distance is given by
| (1) |
with the temperature-dependent thermal conductivity of the gas , and temperature difference of the plates .
For , wall-molecule-interactions start to influence heat transfer. For , gas molecules rarely collide with each other, leading to more frequent thermal energy transfers with the walls.
2.2 Gas cooling in the free molecular flow regime
The heat transfer in the free molecular flow is additionally influenced by the surface material. The energy accommodation coefficient accumulates these properties in a probability: Complete thermal equilibration at every molecule-surface interaction translates to , no thermal exchange at any interaction translates to [23]. This coefficient is dependent on the gas type and surface material, and varies with temperature.
With the assumption of the colder plate satisfying , the gas cooling power in the free molecular flow regime is given by [24]:
| (2) |
with energy accommodation coefficient of the hot surface , mass of a gas molecule , gas pressure at the colder surface , and area of a single plate . For copper surfaces and temperatures significantly below 10 K, the accommodation coefficient is close to unity [23].
3 Setup for measuring
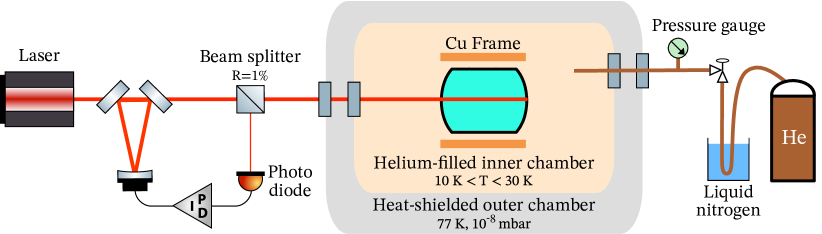
A cylindrical, crystalline silicon test mass was placed inside an indium-sealed, vacuum chamber with a wall temperature of 10 K or less and adjustable helium pressure. A laser enabled us to deposit a known, tunable amount of heat energy in the test mass. To reach cryogenic temperatures, the aforementioned inner chamber is mounted to a cold plate inside a bigger outer chamber, which could be pumped to pressures below mbar. A thermal shield surrounded the inner chamber to reduce radiative heating. This setup (shown in more detail in Figure 1) enabled us to reach silicon surface temperatures of 11 to 30 K, which covers most of the suggested cryogenic detector designs mentioned in the introduction.
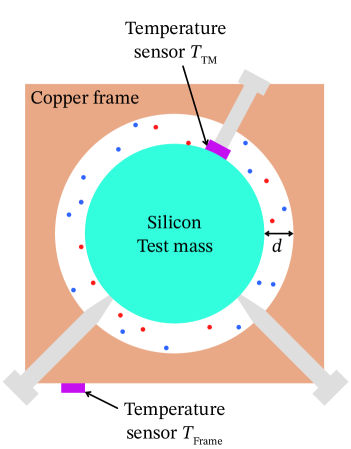
We used a crystalline silicon cylinder made with the Czochralski technique [25] that was cut to have a diameter of () cm and a length of () cm. The test mass was held inside a polished copper frame almost fully enclosing it. The frame was fabricated to be equidistant to all silicone surfaces. This controlled distance of 2 mm is necessary to ensure compatibility with the free molecular flow regime requirement. Differences in thermal expansion of copper and silicon are insignificant [26, 27]. Six polytetrafluoroethylene (PTFE) screws with pointy tips held the test mass in the center of the frame. PTFE is known for its low thermal conductivity [28]. Thermal sensors were mounted to the test mass and the frame to measure their respective temperatures. Without any additional heat load, the test mass could be cooled to 7 K with similar frame temperatures.
Both chambers had optical ports. These allowed pointing a laser beam at wavelength 1064 nm onto the test mass. A capillary thermally anchored over a length of around 80 cm to the heat shield connects the inner chamber to the gas handling at room temperature. The in-going laser power was held stable by a control loop with long-term stability. Additionally, this control loop allowed us to automatically heat the test mass to a desired temperature. Once the system reached equilibrium, data was collected for up to 30 minutes, where the following equation connects optical heating power and gas cooling power :
| (3) |
where contains any remaining heat flow channels. is proportional to the input laser power. The light-power calibration is described in section 4.3. The value of is dependent on the gas pressure, and in the case of molecular flow: the accommodation coefficient. is discussed in section 4.4. A front view of the system in the inner chamber is shown in Figure 2.
4 Measurement of the thermal accommodation coefficient
4.1 Pressure measurement
The experiment operated in three gas pressure regimes: no-gas (), gas in molecular flow () and gas in viscous flow (). During individual measurements, helium inlet valve was closed; hence the pressure was static. The first and last regimes are needed for calibration: Measurement without gas allows for the determination of any unwanted heat flux (see section 4.4). Gas-cooling power in viscous flow is known (see equation 1) and enables a precise calibration of the applied heating power (see section 4.3). With that, cooling power in molecular flow is proportional to one last unknown: the accommodation coefficient.
At the state of planning, no commercial pressure sensor for cryogenic temperatures was available to us. As a workaround, we connected the inner chamber via a capillary to a gas-type independent pressure gauge outside the cryostat. This capillary introduced a small heat bridge and therefore limited the minimum achievable temperature. Due to the thermomolecular pressure difference effect, a correction to the pressure readout needed to be applied. Given that the gas in the capillary was in molecular flow, the pressure readout in the warm region at temperature could be measured and translated to the pressure inside the cryostat at temperature with:
| (4) |
At temperatures of 8 K, the pressure inside the inner chamber was approximately six times lower than at the pressure gauge. The required room temperature measurements added another small uncertainty of 3–4 % to the determined accommodation coefficients.
For a gas-type independent readout, we used a commercially available capacitive pressure transmitter. By design, these pressure gauges have the smallest uncertainty at the upper end of their sensitivity range. Consequently, we operated the experiment between and during molecular flow measurements. In testing, we found that zeroing of the sensor every 48 hours is necessary as the readout value drifted. Zeroing had to be executed at low pressures, in our case at mbar. Hence, the gas filled part of the experiment outside the cryostat gets pumped and flushed with fresh helium every two days. This had the added benefit that we ensured high-level purity of helium at all times.
4.2 Temperature measurement
Temperatures of the test mass () and surrounding frame () were read out with negative temperature coefficient (NTC) resistor sensors. The manufacturer claims readout error of 4 mK between 4 K to 10 K and 8 mK between 10 K to 20 K. A sensor (model Cernox 1070 HT sensor in CU package) was attached to the copper frame. Thermal grease and a hand-tight brass screw ensured good thermal contact. The cylindrical test mass was thermally well insulated from the cold copper. Its sensor (model Cernox 1070 HT sensor in SD package) may not be fixed to a flat surface, as laser light would heat it up if placed on one end of the cylinder. We chose a sensor assembled in a 3 mm 2 mm rectangular package with about 1 mm height. A PTFE screw with bad thermal conductance pressed the flat surface of the sensor onto the curved test mass (see Figure 2).
The temperature sensor controller unit applied temperature-dependent excitation current to each sensor to read out their electrical resistance. The readout showed only the voltage drop over the sensor, as we used a four-wire scheme making wire resistance irrelevant. The controller converted voltage readout to temperature with a manufacturer-provided calibration. A small electrical self-heating at each sensor was technically unavoidable. This heating was notable at the test mass sensor, as it was highly insulated from the cold plate of the cryostat. The electrical self-heating power was temperature-dependent, as with changing sensor resistance, the electrical current is also changing.
In the no-gas (molecular flow) [viscous flow] regime, we observed stable temperature readout differences between test mass and frame sensor of 757 mK (36 mK) [31 mK]. These differences were measured when all optical accesses to the test mass were blocked and no heat load other than sensor heating was present at the test mass. This showed a strong dependence of the temperature differences on gas pressure. Gas was exchanging heat between the test mass sensor and both the frame and test mass. Several numerical and experimental tests after the experiment run revealed that the readout of the test mass sensor has a high dependence on the specific mounting procedure and gas pressure. We suspect a heat accumulation inside the sensor, which was most notable in the no gas configuration, as the helium greatly increases the thermal contact between resistor and test mass surface. To compensate, we subtracted test mass temperature readings by above-mentioned values in dependence of the gas regime. At the same time, we continued with a systematic uncertainty equally to the subtracted amount. This fact had an influence on our no-gas calibration measurements determining , and the large uncertainty on temperature measurements during the calibration can be seen Figure 3 right. Error propagation dictated higher uncertainties in the accommodation coefficient for experiment configurations at temperatures below 14 K.
4.3 Calibration of the absorbed optical power
A laser of wavelength 1064 nm deposited an adjustable and stable amount of thermal energy inside the test mass.
The end surfaces of the cylinder were polished and coated. For this experiment, it is irrelevant if the light is absorbed in the coatings or the bulk. COMSOL Multiphysics simulations have shown that the temperature inside the test mass is always nearly uniform, due to the high thermal conduction of silicon.
A beam splitter split off 1 % of laser light just before the vacuum chamber which we guided onto a photodiode. The photovoltage provided feedback to a pre-mode-cleaner to compensate for thermal drifts in the laser system and therefore to ensure a stable heating power.
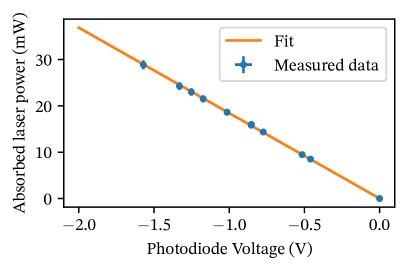
We determined the exact amount of optical heating applied to the test mass . Measuring incoming, reflected, and transmitted optical power proved to be nearly impossible, especially as the test mass does not form a cavity and optical scattering far off the laser axis occurred. The test mass position could not be adjusted in its position or angle once the vacuum chamber was closed (see Figure 1). However, we correlated the photovoltage (used to stabilize laser power) to the actual light power absorbed in the test mass. The cooling performance of helium is well known in the regime of viscous flow (see equation 1). If we assume viscous cooling dominates and the test mass temperature is constant, we can directly calibrate photovoltage with . The results of this calibration are shown in Figure 3 (left).
4.4 Unwanted heat flux
We could not mount our test mass in such a way, that it was thermally fully decoupled from its environment, and cooling channels apart from gas-cooling remained. Our test mass was held in place by screws with low thermal conductivity, but nevertheless, some Milliwatts were cooled by conduction through these. An upper limit for heating power by thermal conduction through screws of diameter , temperature dependent thermal conductivity of teflon [28], and length is given by [29]:
| (5) |
Contact resistance and pointy tips reduced the actual conductivity.
Other thermal channels included radiation cooling to the copper frame, sensor self-heating, and radiation heating from the cryostat’s heat shield (77 K). For our measurements with helium in the free molecular flow regime, the sum of all discommoding heat flux channels needed to be determined, to not miscalculate gas-cooling efficiency and hence the accommodation coefficient.
4.5 Extracting the accommodation coefficient
Accommodation coefficients were measured with gas pressures in the molecular flow regime. From equation 3 we have
| (6) |
with the free molecular flow cooling power . Rearranging equation 2 yields
| (7) |
with , the gas pressure around the test mass , surface area of the test mass , molar mass of Helium , and Boltzmann constant .
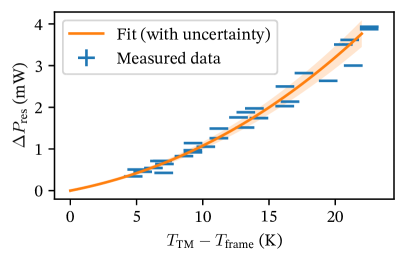
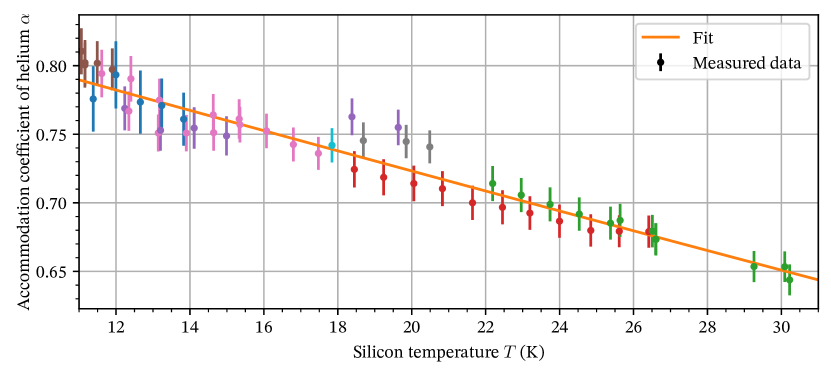
Evaluating the above equation for different laser input powers yields the accommodation for different silicon temperatures. Measured data points alongside a fit are shown in Figure 4.
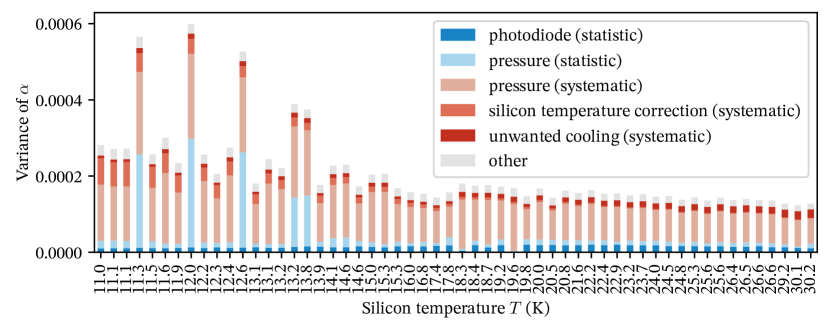
Uncertainties in our measurements of the accommodation coefficient are dominated by a systematic error in the pressure readout, which is given by the technical limitations of the gauge. A detailed breakdown of all uncertainties is shown in Figure 5.
5 Conclusion
We have designed and executed an experiment for determination of the helium accommodation coefficient at cryogenic temperatures. We covered the silicon temperature of 18 K, where silicon has a zero thermal expansion coefficient resulting in negligible thermo-elastic thermal noise in GW observatories [30]. The accommodation coefficient for helium on silicon cryogenic test masses has values greater than 0.7 below 20 K. Notably, for 18 K we found .
Our conceptual setup of using a heat exchange gas to cool suspended test mass mirror in future GW observatories [21], assumed an accommodation coefficient of 0.6. This work shows that for silicon temperatures of 18 K gas cooling is approximately 23 % more efficient than previously discussed. In the context of optimizing ground-based interferometric detectors like the Einstein Telescope, this study highlights the potential benefits of incorporating gas cooling as an additional tool in the design process. By reducing building costs or increasing sensitivity and robustness, such a system could contribute to advancing our ability to detect gravitational waves.
The potential of gas cooling in third-generation gravitational wave detectors is increased, and the consideration of implementing this technique should be continued, especially for mirror masses greater than 200 kg or detectors targeting signal frequencies above a few hundreds of hertz.
Acknowledgements
References
- [1] B. P. Abbott et al. “Observation of Gravitational Waves from a Binary Black Hole Merger” In Phys. Rev. Lett. 116 American Physical Society, 2016, pp. 061102 DOI: 10.1103/PhysRevLett.116.061102
- [2] J. Aasi, B. P. Abbott, R. Abbott, T. Abbott, M. R. Abernathy, K. Ackley, C. Adams, T. Adams, P. Addesso and R. X. Adhikari “Advanced ligo” In Classical and quantum gravity 32.7 IOP Publishing, 2015, pp. 074001
- [3] F. Acernese, M. Agathos, K. Agatsuma, D. Aisa, N. Allemandou, A. Allocca, J. Amarni, P. Astone, G. Balestri and G. Ballardin “Advanced Virgo: a second-generation interferometric gravitational wave detector” In Classical and Quantum Gravity 32.2 IOP Publishing, 2014, pp. 024001
- [4] T. Akutsu et al. “KAGRA: 2.5 generation interferometric gravitational wave detector” In Nature Astronomy 3.1, 2019, pp. 35–40 DOI: 10.1038/s41550-018-0658-y
- [5] J. Gais, K. K. Y. Ng, E. Seo, K. W. K. Wong and T. G. F. Li “Inferring the Intermediate-mass Black Hole Number Density from Gravitational-wave Lensing Statistics” In The Astrophysical Journal Letters 932.1, 2022, pp. L4 DOI: 10.3847/2041-8213/ac7052
- [6] G. Agazie et al. “The NANOGrav 15 yr Data Set: Evidence for a Gravitational-wave Background” In The Astrophysical Journal Letters 951.1 The American Astronomical Society, 2023, pp. L8 DOI: 10.3847/2041-8213/acdac6
- [7] The LIGO Scientific Collaboration and The VirgoΩCollaboration, The 1M2H Collaboration, The Dark Energy Camera GW-EM Collaboration and the DESΩCollaboration, The DLT40 Collaboration, The Las Cumbres Observatory Collaboration, The VINROUGE Collaboration and The MASTER Collaboration “A gravitational-wave standard siren measurement of the Hubble constant” In Nature 551.7678, 2017, pp. 85–88 DOI: 10.1038/nature24471
- [8] M. Abernathy, F. Acernese, P. Ajith, B. Allen, P. Amaro Seoane, N. Andersson, S. Aoudia, P. Astone, B. Krishnan and L. Barack “Einstein gravitational wave Telescope conceptual design study” EGO, 2011
- [9] ET Steering Committee Editorial Team “Einstein Telescope Design Report Update 2020”, 2020
- [10] D. Reitze et al. “Cosmic Explorer: The U.S. Contribution to Gravitational-Wave Astronomy beyond LIGO” https://baas.aas.org/pub/2020n7i035 In Bulletin of the AAS 51.7, 2019
- [11] K. Ackley et al. “Neutron Star Extreme Matter Observatory: A kilohertz-band gravitational-wave detector in the global network” In Publications of the Astronomical Society of Australia 37 Cambridge University Press, 2020, pp. e047 DOI: 10.1017/pasa.2020.39
- [12] R.X. Adhikari, K. Arai, A. F. Brooks and C. Wipf “A cryogenic silicon interferometer for gravitational-wave detection” In Classical and Quantum Gravity 37.16 IOP Publishing, 2020, pp. 165003 DOI: 10.1088/1361-6382/ab9143
- [13] John Miller, Lisa Barsotti, Salvatore Vitale, Peter Fritschel, Matthew Evans and Daniel Sigg “Prospects for doubling the range of Advanced LIGO” In Phys. Rev. D 91 American Physical Society, 2015, pp. 062005 DOI: 10.1103/PhysRevD.91.062005
- [14] Rana X. Adhikari, Aidan Brooks, Brett Shapiro, David McClelland, Eric K. Gustafson, Valery Mitrofanov, Koji Arai, Christopher Wipf and Edgard Bonilla “LIGO Voyager Upgrade: Design Concept”, 2023 URL: https://docs.ligo.org/voyager/voyagerwhitepaper/main.pdf
- [15] A. Buikema, C. Cahillane, G. L. Mansell, C. D. Blair, R. Abbott, C. Adams, R. X. Adhikari, A. Ananyeva, S. Appert and K. Arai “Sensitivity and performance of the Advanced LIGO detectors in the third observing run” In Physical Review D 102.6 APS, 2020, pp. 062003
- [16] F. Acernese, T. Adams, K. Agatsuma, L. Aiello, A. Allocca, A. Amato, S. Antier, N. Arnaud, S. Ascenzi and P. Astone “Advanced Virgo Status” In Journal of Physics: Conference Series 1342.1, 2020, pp. 012010 IOP Publishing
- [17] Kentaro Somiya “Detector configuration of KAGRA – the Japanese cryogenic gravitational-wave detector” In Classical and Quantum Gravity 29.12 IOP Publishing, 2012, pp. 124007
- [18] T. Akutsu et al. “Overview of KAGRA: Detector design and construction history” In Progress of Theoretical and Experimental Physics 2021.5, 2020, pp. 05A101 DOI: 10.1093/ptep/ptaa125
- [19] The ETpathfinder Team “ETpathfinder Design Report”, 2020
- [20] A. Utina et al. “ETpathfinder: a cryogenic testbed for interferometric gravitational-wave detectors” In Classical and Quantum Gravity 39.21, 2022, pp. 215008 DOI: 10.1088/1361-6382/ac8fdb
- [21] Christoph Reinhardt, Alexander Franke, Jörn Schaffran, Roman Schnabel and Axel Lindner “Gas cooling of test masses for future gravitational-wave observatories” In Classical and Quantum Gravity 38, 2021 DOI: 10.1088/1361-6382/ac18bc
- [22] Wayne M. Trott, Jaime N. Castañeda, John R. Torczynski, Michael A. Gallis and Daniel J. Rader “An experimental assembly for precise measurement of thermal accommodation coefficients” In Review of Scientific Instruments 82.3, 2011, pp. 035120 DOI: 10.1063/1.3571269
- [23] R.J. Corruccini “Gaseous heat conduction at low pressures and temperatures” In Vacuum 7-8, 1959, pp. 19–29 DOI: https://doi.org/10.1016/0042-207X(59)90766-3
- [24] Tamas I Gombosi and Atmo Gombosi “Gaskinetic theory” Cambridge University Press, 1994
- [25] Jan Czochralski “Ein neues Verfahren zur Messung der Kristallisationsgeschwindigkeit der Metalle” In Zeitschrift für physikalische Chemie 92.1 Oldenbourg Wissenschaftsverlag, 1918, pp. 219–221
- [26] N. J. Simon, E. S. Drexler and R. P. Reed “Properties of copper and copper alloys at cryogenic temperatures. Final report” In National Institute of Standards and Technology, 1992 DOI: 10.2172/5340308
- [27] C. A. Swenson “Recommended Values for the Thermal Expansivity of Silicon from 0 to 1000 K” In Journal of Physical and Chemical Reference Data 12.2, 1983, pp. 179–182 DOI: 10.1063/1.555681
- [28] Yeon Choi and Dong Lak Kim “Thermal property of insulating material at cryogenic temperature” In Journal of Mechanical Science and Technology 26, 2012 DOI: 10.1007/s12206-012-0528-y
- [29] Jack Ekin “Experimental Techniques for Low-Temperature Measurements: Cryostat Design, Material Properties and Superconductor Critical-Current Testing” Oxford University Press, 2006 DOI: 10.1093/acprof:oso/9780198570547.001.0001
- [30] Sheila Rowan, Robert L. Byer, Martin M. Fejer, Roger K. Route, Gianpietro Cagnoli, David R.M. Crooks, James Hough, Peter H. Sneddon and Walter Winkler “Test mass materials for a new generation of gravitational wave detectors” In Gravitational-Wave Detection 4856 SPIE, 2003, pp. 292 –297 International Society for OpticsPhotonics DOI: 10.1117/12.459019
- [31] J. D. Hunter “Matplotlib: A 2D graphics environment” In Computing in Science & Engineering 9.3 IEEE COMPUTER SOC, 2007, pp. 90–95 DOI: 10.1109/MCSE.2007.55
- [32] Eric O. Lebigot “Uncertainties: a Python package for calculations with uncertainties”, http://pythonhosted.org/uncertainties/