Polarization and Multiwavelength Observations of Mrk 501 Reveal Polarization Variability across Different Energies and Fluxes
Abstract
Mrk 501 is a prototypical high-synchrotron-peaked blazar (HBL) and serves as one of the primary targets for the Imaging X-ray Polarimetry Explorer (IXPE). In this study, we report X-ray polarization measurements of Mrk 501 based on six IXPE observations. The 99% confidence detection of X-ray polarization is obtained in four out of six observations in the entire energy band (2–8 keV) of IXPE, with a maximum polarization degree () of and a polarization angle () of at a confidence level of . During the other two observations, the source only exhibits the 99% confidence detection of X-ray polarization within an energy bin of 1 keV. Interestingly, both the second and sixth IXPE observations present energy-dependent variability in X-ray polarization, which is also observed in our optical spectropolarimetry. The chromatic behavior of and the consistent values of across different frequencies, along with the agreement between and jet position angle, strongly support the interpretation of the energy-stratified model with shock-accelerated particles in the jet of Mrk 501. Additionally, the possibility of the presence of a global helical magnetic field in the jet of Mrk 501 is discussed.
1 Introduction
Blazars are a subclass of active galactic nuclei (AGNs), including BL Lacertae objects (BL Lacs) and flat-spectrum radio quasars (FSRQs). Their broadband spectral energy distributions (SEDs) generally exhibit a bimodal pattern; the first hump in the infrared–optical–ultraviolet and even X-ray bands is thought to be from the synchrotron emission of relativistic electrons in the jet, while the origin of the second bump in MeV–GeV–TeV bands remains subject to debate, usually attributed to the inverse-Compton (IC) scattering process of relativistic electrons (e.g., Maraschi et al., 1992; Ghisellini et al., 1996; Sikora et al., 2009; Zhang et al., 2012, 2014, 2015; Yan et al., 2014). Based on the peak frequency of their synchrotron radiation component, blazars are typically categorized into three groups: low-synchrotron-peaked blazars (LBLs; Hz), intermediate-synchrotron-peaked blazars (IBLs; Hz), and high-synchrotron-peaked blazars (HBLs; Hz) (Abdo et al., 2010a). Relativistic jets of blazars serve as ideal sites for particle acceleration, where particles can be accelerated through shocks, stochastic processes, and magnetic reconnection (see Matthews et al., 2020 for a review). Through the measurements of linear polarization, one can determine the degree of order of the magnetic field and its average direction relative to the jet axis, thereby probing both radiation and acceleration mechanisms of the high-energy particles in jets (e.g., Liodakis et al., 2022).
Previous polarization measurements are limited to the optical band and longer wavelengths. The emergence of a new, superluminal component from the radio core of BL Lacertae is revealed by Very Long Baseline Array (VLBA) observations around the time of a TeV -ray flare, while MOJAVE images demonstrate the polarization changes of the radio core before and after the TeV -ray flare (Arlen et al., 2013). The optical polarization changes accompanying -ray flares have been observed in several blazars (Abdo et al., 2010b; Jorstad et al., 2010, 2013; Casadio et al., 2015; Ahnen et al., 2017a; Zhang et al., 2018). The polarization variability patterns observed in radio and optical bands for blazars suggest the presence of an ordered magnetic field, which can be attributed to the compression and amplification by shocks or the existence of a helical magnetic field (Lyutikov et al., 2005; Hovatta et al., 2012; Casadio et al., 2015; Tavecchio et al., 2020; Matthews et al., 2020). The launch of the Imaging X-Ray Polarimetry Explorer (IXPE; Weisskopf, 2022) enables polarimetry measurements of blazars in the 2–8 keV band. The X-ray polarimetry measurements are crucial, as X-ray emission is associated with higher-energy electrons and probes properties in closer proximity to the acceleration site.
Mrk 501, one of the nearest GeV–TeV BL Lacs (redshift ; Ulrich et al., 1975), has been widely studied in multiwavelength observations over the past few decades. During its observation period from April 1997 to June 1999 by BeppoSAX, the peak frequency of the synchrotron emission component shifted from 100 keV back to 0.5 keV, accompanied by a decrease in flux (Tavecchio et al., 2001; Zhang et al., 2013). Significant spectral variability was observed in the 0.1–150 keV band between September 1996 and October 2001, with X-ray spectra well described by a log-parabolic law function across all flux states (Massaro et al., 2004). In addition to variations in the X-ray band, significant flux changes have also been detected in other bands (e.g., Quinn et al., 1996; Shukla et al., 2015; Ahnen et al., 2017b; Abdalla et al., 2019). Mrk 501 is a typical HBL and also the first blazar observed by IXPE (Liodakis et al., 2022).
In this paper, we present IXPE polarimetry measurements of Mrk 501, along with simultaneous optical polarimetry and spectral and temporal observations in multiple bands. Polarization observations and data analysis are described in Section 2, and the results are reported in Section 3. Section 4 provides a discussion and our conclusions. Throughout, km s-1 Mpc-1, , and are adopted.
2 Polarization Observations and Data Analysis
2.1 IXPE
Mrk 501 was observed by IXPE six times between 2022 March 8 and 2023 April 16 (UTC dates are used throughout this paper), with the net exposure time ranging from ks to ks, as listed in Table 1. We proceed coordinates correction to the publicly available Level-2 event files, which store polarization information in the form of Stokes parameters (, , and ) photon-by-photon, to remove the detector pointing misalignment. Based on the onboard calibration data111https://bitbucket.org/ixpesw/pi_corr_caldb/src/master/, we proceed the energy correction to all three detector units (DUs) for the first two observations using the task in the IXPE internal software (Baldini et al., 2022), customized for IXPE data analysis and simulations. The source region is defined as a circle centered on the radio position of Mrk 501 with a radius of 60′′, while the background region is identified as an annulus with inner and outer radii of 120′′ and 270′′, respectively. This strategy is applied to all six IXPE observations of Mrk 501.
We first estimate the polarization using a model-independent method with the software . Photons from both the source and background regions are extracted using the task. The polarization is calculated using the PCUBE algorithm within the task. We generate polarization cubes for each of the three DUs to extract information such as normalized Stokes parameters ( and ), minimum detectable polarization at 99% significance (MDP99), X-ray polarization degree (), X-ray polarization angle (), and their corresponding uncertainties in the 2–8 keV band. The estimated polarization parameters from all three DUs for each IXPE observation are given in Table 1.
If significant polarization is observed (), we cross-check the polarization parameters using spectropolarimetric analysis with (Arnaud et al., 1999) in the HEASoft (v.6.30.1) package. We generate Stokes-parameter spectra for both the source and background using the PHA1, PHA1Q, and PHA1U algorithms, which convert the , , and Stokes parameters of photons into OGIP-compliant pulse-height analyzer (PHA) files (three Stokes parameter spectra per three DUs). The , , and spectra are rebinned using the task in FTOOL, requiring a minimum of 20 counts per spectral channel for the spectra. A constant energy bin of 0.2 keV is applied to both the and spectra. The spectropolarimetric fitting is performed using statistics. We simultaneously fit 3 , , and spectra using an absorbed single power-law model with a constant polarization of the form () within . Only the Galactic photoelectric absorption is considered in the model, where the neutral hydrogen column density is fixed at the Galactic value along the line of sight toward Mrk 501, cm-2 (HI4PI Collaboration et al., 2016). The power-law function is
| (1) |
where is the scale parameter of photon energy and is the photon spectral index (Massaro et al., 2004). The polarization model , assuming constant polarization parameters within the operating energy range, has two free parameters, and . The results of the spectropolarimetric fitting are also presented in Table 1.
2.2 Kast Optical Spectropolarimetry
We follow the methodology outlined by Patra et al. (2022a) for observations and data reduction. We conducted six rounds of spectropolarimetry between 2022 April and 2022 November, using the polarimetry mode of the Kast double spectrograph (Kast) mounted on the Shane 3 m telescope at Lick Observatory222https://www.lickobservatory.org/.
Each night, we took 600 s exposures at retarder-plate angles of , , , and to calculate the Stokes parameters and . These observations were done under low-airmass conditions (), enabling us to align the slit north–south (at a position angle of ) on all nights. Since Kast does not have an atmospheric dispersion compensator, either observing at low airmass or aligning the slit along the parallactic angle is crucial (see Filippenko, 1982).
Depending on their observability on a given night, we also observed unpolarized standard stars HD 212311, HD 154892, and HD 57702 on all nights, finding an average Stokes and of %, confirming low instrumental polarization. In the polarizance test, we found that the Kast spectropolarimeter had a polarimetric response exceeding 99.5% across the relevant wavelength range 4600–9000 Å. Furthermore, our observations of two high-polarization standard stars (chosen among HD 183143, HD 245310, HD 204827, HD 154445, HD 155528, and HD 43384) on each night demonstrated that the measured fractional polarization and position angle were consistent within 0.1% and (respectively) compared to references, affirming the instrument’s accuracy and stability over time (Schmidt et al., 1992; Wolff et al., 1996).
The intensity-normalized Stokes parameters and were used to calculate the fractional polarization
| (2) |
and the polarization position angle
| (3) |
It is worth noting that tends to favor higher polarization owing to its positive definiteness, especially in the low signal-to-noise ratio (S/N) regime. To counter this bias, we followed the approach outlined by Wang et al. (1997) to determine the debiased polarization as
| (4) |
where represents the uncertainty in and is the Heaviside step function. For additional details into the polarization calculation, see Patra et al. (2022a) and Patra et al. (2022b).
3 Results
3.1 Polarization in the 2–8 keV Band
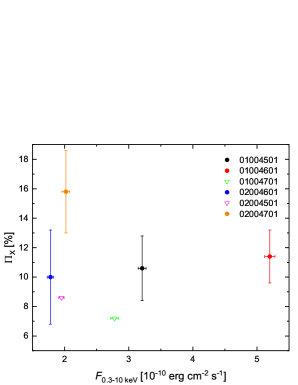
We conducted a systematic analysis of the observational data obtained from Mrk 501 using IXPE in order to investigate the X-ray polarization of the source. Of the six observations, four showed a detection of polarization with a confidence level exceeding 99% across the entire energy band (2–8 keV) covered by IXPE. These observations indicated that was higher than their corresponding MDP99 values, as listed in Table 1. However, only the second and sixth observations exhibited the estimated polarization degrees at a confidence level exceeding 5. Specifically, for these two observations, we found with at a confidence level of 6.1 and with at a confidence level of 5.2, respectively. Moreover, represents the highest polarization degree detected by IXPE in the 2–8 keV band for Mrk 501. Although the polarization degree estimated for the fourth IXPE observation () exceeds its MDP99 value (9.8%), the confidence level of is , as is the case for the third and fifth observations by IXPE.
In general, the estimated polarization degrees for the four IXPE observations (with ) do not show evident variability given their uncertainties, as displayed in Figure 1 and Table 1. Moreover, the derived values of demonstrate a decreasing trend from the first to the sixth observations. The values of obtained during the first, second, and fourth IXPE observations are consistent with the jet position angle of Mrk 501 within their uncertainties, where the jet position angle of was determined through VLBA imaging at 43 GHz (Weaver et al., 2022). However, it is slightly smaller than the jet position angle for the sixth IXPE observation.
3.2 Optical Polarization
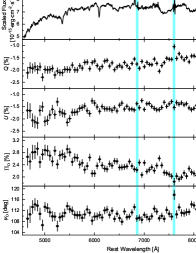
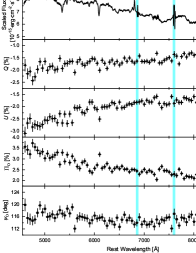
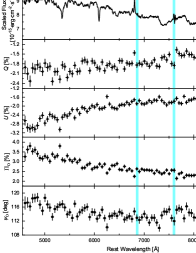
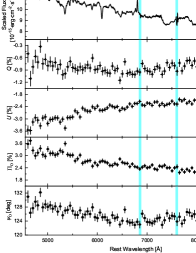
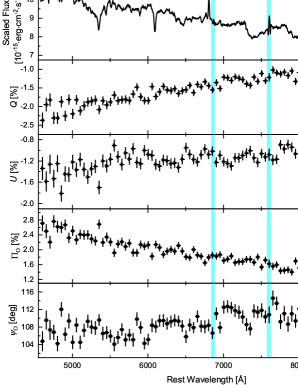
Using Kast, we performed six optical spectropolarimetric observations of Mrk 501 that were quasisimultaneous with the IXPE observations, as described in Section 2.2. The scaled flux density, Stokes parameter , Stokes parameter , polarization degree , and polarization angle are presented in Figure 2 (and Figure 5 in the Appendix), where and were rebinned with a bin size of 50 Å to calculate and . It is evident that the absolute values of both and exhibit a decreasing trend with increasing wavelength. Particularly noteworthy is the clear decrease in the value of as wavelength increases; however, no correlation between the variation of and wavelength was observed. Each of these spectropolarimetric observations consistently demonstrates a reduction in polarization degree with increasing wavelength.
Except for the observation on 2022 July 21, the derived values of and from the other five Kast epochs are approximately consistent, as presented in Table 3 in the Appendix. All values are below 5%, while all values align with the jet position angle of Mrk 501 (Weaver et al., 2022) within their uncertainties. The derived values of and obtained from the observation on 2022 July 21 are notably smaller than others. It is uncertain whether this discrepancy reflects polarization variation or is a result of inadequate observational data.
The observations of Mrk 501 in the optical band are well known to be significantly influenced by the starlight in its host galaxy (Urry et al., 1999, 2000; Falomo et al., 2000; Scarpa et al., 2000). The starlight is commonly considered to be unpolarized. In order to obtain the intrinsic optical polarization degree , we have corrected for the depolarization effect caused by the host galaxy using a procedure described in the Appendix. However, owing to the lack of contemporaneous optical observations, we were only able to apply this correction to the estimated polarization degree on 2022 April 1, which was quasisimultaneous with the second IXPE observation. Our analysis yielded an intrinsic optical polarization degree of with . Our findings are consistent with the previously reported values of and as presented by Liodakis et al. (2022).
3.3 Energy-Dependent Variability of Polarization
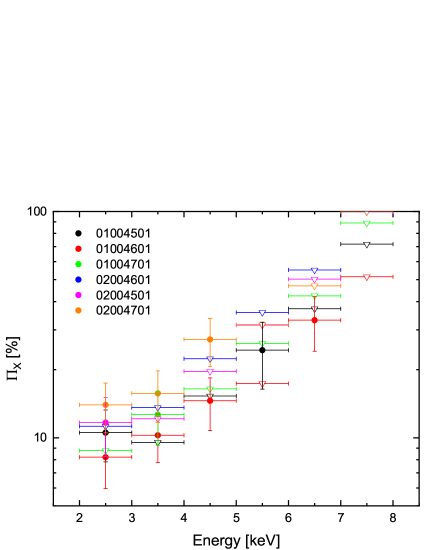
To investigate the energy-dependent variations in polarization, we further estimated the polarization degree for each 1 keV energy bin in the six IXPE observations, as illustrated in Figure 3 and given in Table 1. For the third and fifth IXPE observations, no polarization with was detected in the 2–8 keV band. However, the source exhibited confidence detection of polarization in the 3–4 keV band for the third observation and in the 2–3 keV band for the fifth observation: (MDP) and (MDP). Conversely, although slightly exceeds MDP, indicating detectable polarization in the 2–8 keV band during the fourth IXPE observation, no confidence detection of polarization was observed across any energy bin.
Interestingly, energy-dependent variability of X-ray polarization was observed in the second and sixth IXPE observations. The value of increases along with the rise in energy, as depicted in Figure 3. The highest polarization degree within the 1 keV energy range is in the 6–7 keV band at a confidence level of 3.3, and in the 4–5 keV band at a confidence level of 3.8 for the second and sixth IXPE observations, respectively. A similar feature was also found in optical spectropolarimetric observations, as described in Section 3.2. The chromatic behavior of , with and consistent polarization angles in three bands, has been reported for Mrk 501 (Liodakis et al., 2022) and other HBLs (Di Gesu et al., 2022; Middei et al., 2023).
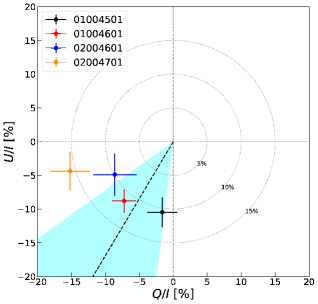
As there are no other simultaneous optical polarization observations available for subsequent IXPE observations, a comparison between the values of and cannot be made. However, quasisimultaneous radio observations at 43 GHz were conducted during the third, fourth, and sixth IXPE observations and reported on the website333http://www.bu.edu/blazars/VLBAproject.html. Comparing with the X-ray polarization parameters, is higher than while the polarization angles remain consistent in both bands, as displayed in Figure 4. The chromatic behavior of with similar across different frequencies depicted in Figure 4, along with consistent values between and jet position angle, impeccably supports the interpretation of the energy-stratified model with shock-accelerated particles (Liodakis et al., 2022; Di Gesu et al., 2022; Middei et al., 2023).
3.4 Flux-Dependent Variability of Polarization
The second IXPE pointing captured a relatively high-flux state of the source, as illustrated in Figure 4. In contrast, the first and third IXPE observations revealed moderate-flux states. Notably, the last three IXPE observations coincided with a period of historically low X-ray flux for Mrk 501. No discernible correlation between and is observed (Figure 6 in the Appendix), likely indicating that the polarization is independent of the flux state. It is well known that Mrk 501 is a typical HBL and emission in the 2–8 keV band stems from the synchrotron radiation. Therefore, serves as an indicator of magnetic-field ordering of the X-ray emission region.
There is no variation of observed as the X-ray flux increases, which may suggest that particles are injected into a region with stable magnetic-field properties (Di Gesu et al., 2022). During the third and fifth IXPE pointings, although there is no polarization detected in the entire energy band of IXPE, there is a 99% confidence detection of polarization within the 1 keV energy bin. This observation possibly indicates the presence of a global, like helical magnetic-field structure, commonly found in BL Lacs (Marscher & Jorstad, 2021). It could be attributed to this global magnetic-field structure that significant or suggestive polarization is detected in all IXPE observations. When plasma crosses a shock, the magnetic field becomes more ordered by compression or amplification in the shock, and thus significant polarization is detected.
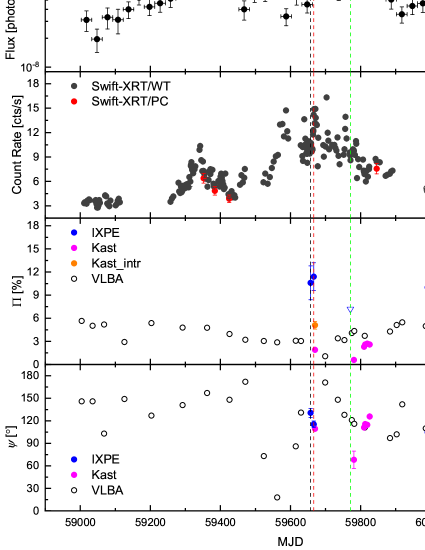
3.5 Temporal Multiwavelength Variations
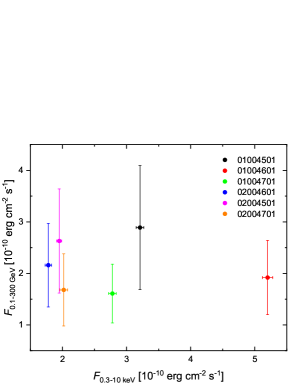
Long-term light curves at multiple wavelengths are presented in Figure 4, including the -ray flux from Fermi-LAT and the count rate from Swift-XRT, along with the polarization degree and polarization angle acquired through observations conducted with IXPE, Kast, and the VLBA. Mrk 501 demonstrates evident variability both in X-rays and -rays. However, no significant correlation between fluxes in the GeV and X-ray bands is observed during the IXPE pointings (Figure 6 in the Appendix). In accordance with a HBL scenario, under the framework of a one-zone leptonic radiation model, it is expected that emission in the two bands originates from distinct radiation mechanisms of electrons at different energy levels: high-energy electrons contribute to X-rays through the synchrotron process while low-energy electrons account for -rays via the inverse-Compton process (Tavecchio et al., 1998).
By utilizing the quasisimultaneous data from IXPE, Kast, and the VLBA, a clearly chromatic behavior of , along with consistent values of in the X-ray, optical, and radio bands, is displayed in Figure 4. We question the accuracy of the derived value of on 2022 July 21 based on the Kast observation since the VLBA observation on 2022 July 22 yields . Apart from this discrepancy, the derived values of in all three bands exhibit consistency. Additionally, a tendency of smooth rotation of is presented, likely suggesting the presence of a global helical magnetic field.
4 Discussion and Conclusions
We analyzed six IXPE observations of Mrk 501 to estimate the X-ray polarization. Out of these, only four observations exhibited 99% confidence detection of polarization in the entire energy band (2–8 keV) of IXPE. Among them, the highest polarization degree of with was observed at a confidence level of 5.2 in the six IXPE observations. During each of the six IXPE observations, we calculated for every 1 keV energy bin to investigate any energy-dependent variability of the X-ray polarization. Interestingly, we observed clear variations in as a function of energy during both the second and sixth observations. Furthermore, similar behavior was observed in our optical spectropolarimetry obtained using the Kast double spectrograph on the Shane 3 m telescope at Lick Observatory: higher polarization degrees were measured at higher frequencies. Additionally, quasisimultaneous observations carried out with IXPE, Kast, and the VLBA at 43 GHz revealed that , with consistent polarization angles across all three bands. These findings provide strong support for an energy-stratified model for Mrk 501 (Liodakis et al., 2022; Di Gesu et al., 2022; Middei et al., 2023).
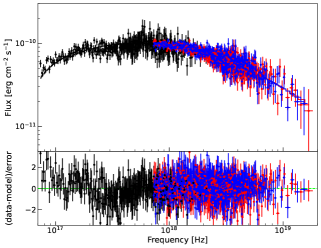
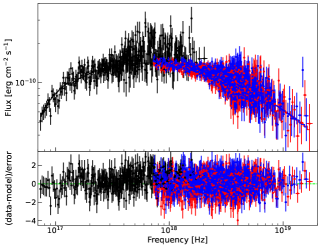
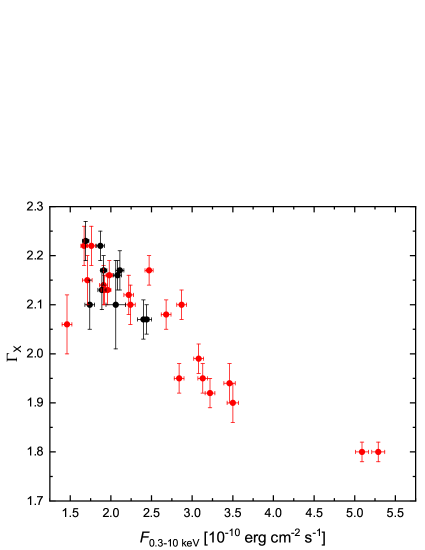
The XRT spectra of Mrk 501 can be fitted with a power-law function; however, when combining the XRT and NuSTAR spectra, a log-parabola model was required (Table 2 and Figure 7 in the Appendix). The presence of a curved X-ray spectrum is commonly observed in synchrotron-dominated HBLs (e.g., Massaro et al., 2004; Giommi et al., 2021; Middei et al., 2022, 2023). During the first two IXPE observations of Mrk 501, we obtained with the XRT observations and the joint analysis of XRT and NuSTAR data; however, during the remaining four IXPE observations, exceeded 2. This suggests that there was a shift in the peak frequency of the synchrotron emission component as previously observed (Tavecchio et al., 2001; Zhang et al., 2013), demonstrating a tendency toward harder when brighter behavior within the XRT band (Figure 8 in the Appendix). Similar behavior was also observed during IXPE observations of Mrk 421 (Di Gesu et al., 2022) and PKS 2155–304 (Hu et al., 2023). It is generally interpreted as the injection of high-energy electrons by a shock (Kirk et al., 1998; Di Gesu et al., 2022).
Except for the sixth IXPE observation, the values of are coincident with the jet position angle within uncertainties, and the polarization angles obtained from quasisimultaneous observations in radio, optical, and X-ray bands also exhibited agreement. These results support shock acceleration as the likely dominant particle acceleration mechanism in the jet of Mrk 501 during the IXPE observations (see also Liodakis et al., 2022). A hint of polarization angle rotation is observed in the IXPE data — a decrease in . Considering long-term VLBA observations at 43 GHz, a smooth rotation of is clearly evident. Furthermore, based on limited available data, we suspect that this rotation of occurs synchronously across radio, optical, and X-ray bands.
Recently, an orphan optical polarization swing was observed in PG 1553+113 between two IXPE observation intervals, which could be caused by turbulence (Middei et al., 2023). Furthermore, the rotation of in X-rays was first detected in another typical HBL, Mrk 421; however, no evident rotation of was found at either radio or optical bands during the IXPE observation. This rotation was attributed to a helical magnetic structure in the jet of Mrk 421 (Di Gesu et al., 2023). We speculate that a global helical magnetic field exists in the jet of Mrk 501. As a result of this coherent ordering of the magnetic field, detectable polarization consistently manifested itself in the X-ray emission from Mrk 501 throughout all IXPE observations, albeit occasionally confined to a narrow energy range.
References
- Abazajian et al. (2009) Abazajian, K. N., Adelman-McCarthy, J. K., Agüeros, M. A., et al. 2009, ApJS, 182, 543, doi: 10.1088/0067-0049/182/2/543
- Abdalla et al. (2019) Abdalla, H., Aharonian, F., Ait Benkhali, F., et al. 2019, ApJ, 870, 93, doi: 10.3847/1538-4357/aaf1c4
- Abdo et al. (2010a) Abdo, A. A., Ackermann, M., Ajello, M., et al. 2010a, ApJ, 710, 1271, doi: 10.1088/0004-637X/710/2/1271
- Abdo et al. (2010b) —. 2010b, Nature, 463, 919, doi: 10.1038/nature08841
- Abdollahi et al. (2022) Abdollahi, S., Acero, F., Baldini, L., et al. 2022, ApJS, 260, 53, doi: 10.3847/1538-4365/ac6751
- Ahnen et al. (2017a) Ahnen, M. L., Ansoldi, S., Antonelli, L. A., et al. 2017a, A&A, 603, A29, doi: 10.1051/0004-6361/201629960
- Ahnen et al. (2017b) —. 2017b, A&A, 603, A31, doi: 10.1051/0004-6361/201629540
- Arlen et al. (2013) Arlen, T., Aune, T., Beilicke, M., et al. 2013, ApJ, 762, 92, doi: 10.1088/0004-637X/762/2/92
- Arnaud et al. (1999) Arnaud, K., Dorman, B., & Gordon, C. 1999, XSPEC: An X-ray spectral fitting package, Astrophysics Source Code Library, record ascl:9910.005. http://ascl.net/9910.005
- Baldini et al. (2022) Baldini, L., Bucciantini, N., Lalla, N. D., et al. 2022, SoftwareX, 19, 101194, doi: 10.1016/j.softx.2022.101194
- Ballet et al. (2023) Ballet, J., Bruel, P., Burnett, T. H., Lott, B., & The Fermi-LAT collaboration. 2023, arXiv e-prints, arXiv:2307.12546, doi: 10.48550/arXiv.2307.12546
- Brown et al. (2013) Brown, T. M., Baliber, N., Bianco, F. B., et al. 2013, PASP, 125, 1031, doi: 10.1086/673168
- Burrows et al. (2005) Burrows, D. N., Hill, J. E., Nousek, J. A., et al. 2005, Space Sci. Rev., 120, 165, doi: 10.1007/s11214-005-5097-2
- Casadio et al. (2015) Casadio, C., Gómez, J. L., Jorstad, S. G., et al. 2015, ApJ, 813, 51, doi: 10.1088/0004-637X/813/1/51
- Di Gesu et al. (2022) Di Gesu, L., Donnarumma, I., Tavecchio, F., et al. 2022, ApJ, 938, L7, doi: 10.3847/2041-8213/ac913a
- Di Gesu et al. (2023) Di Gesu, L., Marshall, H. L., Ehlert, S. R., et al. 2023, Nature Astronomy, 7, 1245, doi: 10.1038/s41550-023-02032-7
- Falomo et al. (2000) Falomo, R., Scarpa, R., Treves, A., & Urry, C. M. 2000, ApJ, 542, 731, doi: 10.1086/317044
- Filippenko (1982) Filippenko, A. V. 1982, PASP, 94, 715, doi: 10.1086/131052
- Gehrels et al. (2004) Gehrels, N., Chincarini, G., Giommi, P., et al. 2004, ApJ, 611, 1005, doi: 10.1086/422091
- Ghisellini et al. (1996) Ghisellini, G., Maraschi, L., & Dondi, L. 1996, A&AS, 120, 503
- Giommi et al. (2021) Giommi, P., Perri, M., Capalbi, M., et al. 2021, MNRAS, 507, 5690, doi: 10.1093/mnras/stab2425
- Harrison et al. (2013) Harrison, F. A., Craig, W. W., Christensen, F. E., et al. 2013, ApJ, 770, 103, doi: 10.1088/0004-637X/770/2/103
- HI4PI Collaboration et al. (2016) HI4PI Collaboration, Ben Bekhti, N., Flöer, L., et al. 2016, A&A, 594, A116, doi: 10.1051/0004-6361/201629178
- Hovatta et al. (2012) Hovatta, T., Lister, M. L., Aller, M. F., et al. 2012, AJ, 144, 105, doi: 10.1088/0004-6256/144/4/105
- Hovatta et al. (2016) Hovatta, T., Lindfors, E., Blinov, D., et al. 2016, A&A, 596, A78, doi: 10.1051/0004-6361/201628974
- Hu et al. (2023) Hu, X.-K., Yu, Y.-W., Zhang, J., et al. 2023, arXiv e-prints, arXiv:2312.01755, doi: 10.48550/arXiv.2312.01755
- Jorstad et al. (2010) Jorstad, S. G., Marscher, A. P., Larionov, V. M., et al. 2010, ApJ, 715, 362, doi: 10.1088/0004-637X/715/1/362
- Jorstad et al. (2013) Jorstad, S. G., Marscher, A. P., Smith, P. S., et al. 2013, ApJ, 773, 147, doi: 10.1088/0004-637X/773/2/147
- Kirk et al. (1998) Kirk, J. G., Rieger, F. M., & Mastichiadis, A. 1998, A&A, 333, 452, doi: 10.48550/arXiv.astro-ph/9801265
- Liodakis et al. (2022) Liodakis, I., Marscher, A. P., Agudo, I., et al. 2022, Nature, 611, 677, doi: 10.1038/s41586-022-05338-0
- Lyutikov et al. (2005) Lyutikov, M., Pariev, V. I., & Gabuzda, D. C. 2005, MNRAS, 360, 869, doi: 10.1111/j.1365-2966.2005.08954.x
- Maraschi et al. (1992) Maraschi, L., Ghisellini, G., & Celotti, A. 1992, ApJ, 397, L5, doi: 10.1086/186531
- Marscher & Jorstad (2021) Marscher, A. P., & Jorstad, S. G. 2021, Galaxies, 9, 27, doi: 10.3390/galaxies9020027
- Massaro et al. (2004) Massaro, E., Perri, M., Giommi, P., & Nesci, R. 2004, A&A, 413, 489, doi: 10.1051/0004-6361:20031558
- Matthews et al. (2020) Matthews, J. H., Bell, A. R., & Blundell, K. M. 2020, New A Rev., 89, 101543, doi: 10.1016/j.newar.2020.101543
- Middei et al. (2022) Middei, R., Giommi, P., Perri, M., et al. 2022, MNRAS, 514, 3179, doi: 10.1093/mnras/stac1185
- Middei et al. (2023) Middei, R., Perri, M., Puccetti, S., et al. 2023, ApJ, 953, L28, doi: 10.3847/2041-8213/acec3e
- Nilsson et al. (2007) Nilsson, K., Pasanen, M., Takalo, L. O., et al. 2007, A&A, 475, 199, doi: 10.1051/0004-6361:20077624
- Patra et al. (2022a) Patra, K. C., Lu, W., Brink, T. G., et al. 2022a, MNRAS, 515, 138, doi: 10.1093/mnras/stac1727
- Patra et al. (2022b) Patra, K. C., Yang, Y., Brink, T. G., et al. 2022b, MNRAS, 509, 4058, doi: 10.1093/mnras/stab3136
- Quinn et al. (1996) Quinn, J., Akerlof, C. W., Biller, S., et al. 1996, ApJ, 456, L83, doi: 10.1086/309878
- Scarpa et al. (2000) Scarpa, R., Urry, C. M., Padovani, P., Calzetti, D., & O’Dowd, M. 2000, ApJ, 544, 258, doi: 10.1086/317199
- Schmidt et al. (1992) Schmidt, G. D., Elston, R., & Lupie, O. L. 1992, AJ, 104, 1563, doi: 10.1086/116341
- Shukla et al. (2015) Shukla, A., Chitnis, V. R., Singh, B. B., et al. 2015, ApJ, 798, 2, doi: 10.1088/0004-637X/798/1/2
- Sikora et al. (2009) Sikora, M., Stawarz, Ł., Moderski, R., Nalewajko, K., & Madejski, G. M. 2009, ApJ, 704, 38, doi: 10.1088/0004-637X/704/1/38
- Stroh & Falcone (2013) Stroh, M. C., & Falcone, A. D. 2013, ApJS, 207, 28, doi: 10.1088/0067-0049/207/2/28
- Tavecchio et al. (2020) Tavecchio, F., Landoni, M., Sironi, L., & Coppi, P. 2020, MNRAS, 498, 599, doi: 10.1093/mnras/staa2457
- Tavecchio et al. (1998) Tavecchio, F., Maraschi, L., & Ghisellini, G. 1998, ApJ, 509, 608, doi: 10.1086/306526
- Tavecchio et al. (2001) Tavecchio, F., Maraschi, L., Pian, E., et al. 2001, ApJ, 554, 725, doi: 10.1086/321394
- Tody (1986) Tody, D. 1986, in Society of Photo-Optical Instrumentation Engineers (SPIE) Conference Series, Vol. 627, Instrumentation in astronomy VI, ed. D. L. Crawford, 733, doi: 10.1117/12.968154
- Ulrich et al. (1975) Ulrich, M. H., Kinman, T. D., Lynds, C. R., Rieke, G. H., & Ekers, R. D. 1975, ApJ, 198, 261, doi: 10.1086/153603
- Urry et al. (1999) Urry, C. M., Falomo, R., Scarpa, R., et al. 1999, ApJ, 512, 88, doi: 10.1086/306763
- Urry et al. (2000) Urry, C. M., Scarpa, R., O’Dowd, M., et al. 2000, ApJ, 532, 816, doi: 10.1086/308616
- Wang et al. (1997) Wang, L., Wheeler, J. C., & Höflich, P. 1997, ApJ, 476, L27, doi: 10.1086/310495
- Weaver et al. (2022) Weaver, Z. R., Jorstad, S. G., Marscher, A. P., et al. 2022, ApJS, 260, 12, doi: 10.3847/1538-4365/ac589c
- Weisskopf (2022) Weisskopf, M. 2022, in AAS/High Energy Astrophysics Division, Vol. 54, AAS/High Energy Astrophysics Division, 301.01
- Wolff et al. (1996) Wolff, M. J., Nordsieck, K. H., & Nook, M. A. 1996, AJ, 111, 856, doi: 10.1086/117833
- Yan et al. (2014) Yan, D., Zeng, H., & Zhang, L. 2014, MNRAS, 439, 2933, doi: 10.1093/mnras/stu146
- Zhang et al. (2018) Zhang, H.-M., Zhang, J., Lu, R.-J., et al. 2018, Research in Astronomy and Astrophysics, 18, 040, doi: 10.1088/1674-4527/18/4/40
- Zhang et al. (2012) Zhang, J., Liang, E.-W., Zhang, S.-N., & Bai, J. M. 2012, ApJ, 752, 157, doi: 10.1088/0004-637X/752/2/157
- Zhang et al. (2014) Zhang, J., Sun, X.-N., Liang, E.-W., et al. 2014, ApJ, 788, 104, doi: 10.1088/0004-637X/788/2/104
- Zhang et al. (2015) Zhang, J., Xue, Z.-W., He, J.-J., Liang, E.-W., & Zhang, S.-N. 2015, ApJ, 807, 51, doi: 10.1088/0004-637X/807/1/51
- Zhang et al. (2013) Zhang, J., Zhang, S.-N., & Liang, E.-W. 2013, ApJ, 767, 8, doi: 10.1088/0004-637X/767/1/8
| Method444The methods used to estimate the polarization. “I” indicates model-independent polarimetry using the software , while “II” indicates spectropolarimetric fitting using . Note that spectropolarimetric fitting is only performed when the derived value of with the software exceeds MDP99. | OBSID555The unique identification number specifying the IXPE observation: “A” for 01004501 with exposure of 104,004 s, “B” for 01004601 with exposure of 86,634 s, “C” for 01004701 with exposure of 97,239 s, “D” for 02004601 with exposure of 94,749 s, “E” for 02004501 with exposure of 102,368 s, and “F” for 02004701 with exposure of 94,775 s. | Date666The start time of the IXPE observation. | MDP99 | MDP99 | MDP99 | MDP99 | MDP99 | MDP99 | MDP99 | ||||||||
| (%) | (°) | (%) | (%) | (%) | (%) | (%) | (%) | (%) | (%) | (%) | (%) | (%) | (%) | (%) | |||
| 2–8 keV | 2–3 keV | 3–4 keV | 4–5 keV | 5–6 keV | 6–7 keV | 7–8 keV | |||||||||||
| I | A | 2022.03.08 | 6.8 | 8.3 | 9.5 | 15.3 | 24.3 | 37.2 | 71.7 | ||||||||
| B | 2022.03.27 | 5.3 | 6.8 | 7.5 | 11.6 | 17.4 | 27.1 | 51.5 | |||||||||
| C | 2022.07.09 | 7.2 | 8.8 | 10.3 | 16.4 | 26.2 | 42.4 | 89.0 | |||||||||
| D | 2023.02.12 | 9.8 | 11.6 | 13.6 | 22.4 | 35.8 | 55.2 | 100.0 | |||||||||
| E | 2023.03.19 | 8.6 | 10.3 | 12.1 | 19.7 | 31.6 | 50.2 | 99.8 | |||||||||
| F | 2023.04.16 | 8.7 | 10.5 | 12.3 | 19.7 | 31.6 | 47.0 | 100.0 | |||||||||
| II | A | 2022.03.08 | |||||||||||||||
| B | 2022.03.27 | ||||||||||||||||
| C | 2022.07.09 | ||||||||||||||||
| D | 2023.02.12 | ||||||||||||||||
| E | 2023.03.19 | ||||||||||||||||
| F | 2023.04.16 | ||||||||||||||||
Appendix A Multiwavelength Observations and Data Analysis
A.1 Optical
A.1.1 Las Cumbres Observatory Global Telescope
Mrk 501 was observed twice in the band with exposure of 50 s using the 1 m telescopes with Sinistro cameras in the Las Cumbres Observatory Global Telescope (LCOGT; Brown et al., 2013) network during the second IXPE observation. The raw images were automatically corrected for flat-field and bias effects upon completion of the observations, resulting in the acquisition of two cleaned images. Aperture photometry was carried out following standard routines in the IRAF 777http://ast.noao.edu/data/software/ package (Tody, 1986), using the task. Photometric calibration was performed using the seventh data release of the Sloan Digital Sky Survey (SDSS DR7; Abazajian et al., 2009), and we converted the -band magnitudes into the band by applying the transformation equations described in the SDSS DR7 algorithms website 888https://classic.sdss.org/dr7/algorithms/sdssUBVRITransform.php. The aperture radius was set to 1.5 FWHM (full width at half-maximum intensity) of each individual LCOGT observation. Results of the photometry are presented in Table 4. Note that these data are corrected for Galactic extinction using the Galactic Extinction Calculator999https://ned.ipac.caltech.edu/forms/calculator.html.
A.1.2 Intrinsic Optical Polarization Degree
The intrinsic optical polarization degree was estimated by (Hovatta et al., 2016), where is the total flux density and is the flux density of the host galaxy. Since the working wavelength range of Kast is close to the band ( = 6500 Å, FWHM = 1300 Å), we used the -band data obtained from the LCOGT network to provide an approximate estimation of with the photometry aperture radius and FWHM of the source according to the strategy described by Nilsson et al. (2007). The values of FWHM for both of the LCOGT observations are also listed in Table 4.
The estimated flux density of the host galaxy is mJy and the average total flux density of Mrk 501 is mJy. We therefore obtained with . The effective wavelength range of Kast should be noted as not strictly equivalent to the band, which may result in a potential inaccuracy in estimating the value of . However, our findings are consistent with the reported values of and by Liodakis et al. (2022). Owing to the absence of contemporaneous optical photometry for estimating of Mrk 501, we are unable to apply this correction to the other five spectropolarimetry results.
A.2 X-rays
A.2.1 Swift-XRT
The X-ray Telescope (XRT; Burrows et al., 2005) onboard the Neil Gehrels Swift Observatory (Swift; Gehrels et al., 2004) has long been monitoring Mrk 501. During IXPE observations, XRT performed 21 observations of Mrk 501 in the Windowed Timing (WT) readout mode, which are considered in this work. The data are processed using the XRTDAS software package (v.3.7.0), developed by the ASI Space Science Data Center (SSDC) and released by the NASA High Energy Astrophysics Science Archive Research Center (HEASARC) in the HEASoft package. The calibration files from XRT CALDB (version 20220803) are used within the task to calibrate and clean the event files. Events for the spectral analysis are selected from a circle centered on the brightest pixel with a radius of 20 pixels (), while the background is estimated using an annulus with inner and outer radii of 30 pixels () and 45 pixels (). The ancillary response files (ARFs), which are used to correct the point-spread function (PSF) losses and CCD defects, are generated using the task with the cumulative exposure maps. The spectra are grouped to ensure a minimum of 20 counts per bin, and then fitted in with an absorbed single power-law model, as shown in Equation 1. In this analysis, we only consider Galactic absorption and fix the neutral hydrogen column density at its Galactic value, similar to what is done in IXPE spectropolarimetric analysis. We adopt the minimization technique for all spectral analysis. The best-fit parameters are presented in Table 2.
To investigate the X-ray flux state of Mrk 501 during IXPE observations, we obtained the X-ray light curve taken from a long-term Swift monitoring program of Fermi -ray sources101010https://www.swift.psu.edu/monitoring/ (Stroh & Falcone, 2013). The data considered background subtraction, PSF, and pile-up effect corrections, as depicted in Figure 4. Note that the observation of Mrk 501 in this program was conducted until 2022 November 8. Therefore, we estimate the count rate value using our data analysis; refer to the dark-gray open circle in Figure 4.
A.2.2 NuSTAR
NuSTAR has two multilayer-coated telescopes, FPMA and FPMB (Harrison et al., 2013). It provides an observational energy band of 3–79 keV, with a spectral resolution of keV. During the first two IXPE observations, NuSTAR observed Mrk 501. We process the raw data using the script in NuSTAR Data Analysis Software (v.2.1.2) to obtain calibrated and cleaned files. Source data are extracted from a circle centered on the brightest pixel with a radius of , while the background is estimated using an annulus with inner and outer radii of and . The spectra are grouped to ensure at least 20 counts per bin, and the spectral analysis is performed using the minimization technique. The package of NuSTAR data analysis is used to produce the spectra, and the standard NuSTAR response matrices and effective area files are employed for spectral fits. The log-parabola model with one absorption component provides better fits to the spectra than the single power-law model. The log-parabola function is
| (A1) |
where is the curvature parameter (Massaro et al., 2004). The neutral hydrogen column density is fixed at the Galactic value as done in the IXPE spectropolarimetric analysis. Details of the best-fit parameters are presented in Table 2.
A.3 -ray Data
Mrk 501 has been reported to be associated with the -ray source 4FGL J1653.8+3945 in the Fermi-LAT latest source catalog (4FGL-DR4; Abdollahi et al., 2022; Ballet et al., 2023). The latest Pass 8 data, covering a period of 15 yr (from 2008 August 4 to 2023 September 30), were downloaded from the Fermi Science Support Center for our analysis. The events in the energy range of 0.1–300 GeV from a region of interest (ROI) centered on the radio position (R.A. = , decl. = ; J2000) of Mrk 501 with a radius of 15 were considered. Data analysis was performed using the publicly available software 111111https://fermi.gsfc.nasa.gov/ssc/data/analysis/software/ (v.2.2.0). The instrument response function of was used. A zenith angle cut of 90 was set to avoid -ray contamination caused by Earth’s limb. All -ray sources listed in the 4FGL-DR4 within the ROI were added to the XML model for spectral analysis. The spectral parameters of all sources lying within 6 were kept free, while the parameters of those sources lying beyond 6 were fixed to their 4FGL-DR4 values. The normalization parameters of the Galactic diffuse component (gll_iem_v07.fits) and the isotropic emission (iso_P8R3_SOURCE_V3_v1.txt) were kept free.
The spectrum of Mrk 501 in the 0.1–300 GeV band is well described by a log-parabola model, yielding a photon spectral index and a curvature parameter . The yr average flux of the Fermi-LAT observations is erg cm-2 s-1 with TS = 42519.6, as given in Table 5. The long-term -ray light curve was extracted with a time bin of 30 days, as illustrated in Figure 4. Additionally, we conducted an analysis on the Fermi-LAT data corresponding to two weeks for each IXPE observation, as presented in Table 5 and Figure 6.
| OBSID | Date | Exposure | Mode/InstrumentaaWT represents the readout mode of Swift-XRT, while FPMA and FPMB represent the two multilayer-coated telescopes of NuSTAR. | FluxbbFlux is calculated in the 0.3–10 keV band for Swift-XRT data and in the 3–79 keV band for NuSTAR data. | /dof | ||
|---|---|---|---|---|---|---|---|
| (s) | (10-10 erg cm-2 s-1) | ||||||
| 00096029008 | 2022.03.08 | 844 | WT | 0 | 219/222 | ||
| 00096029009 | 2022.03.08 | 944 | WT | 0 | 256/233 | ||
| 00011184179 | 2022.03.09 | 994 | WT | 0 | 267/228 | ||
| 00011184180 | 2022.03.09 | 1030 | WT | 0 | 232/236 | ||
| 00011184181 | 2022.03.10 | 1084 | WT | 0 | 223/213 | ||
| 00011184182 | 2022.03.10 | 1005 | WT | 0 | 274/232 | ||
| 00011184188 | 2022.03.28 | 975 | WT | 0 | 309/288 | ||
| 00011184189 | 2022.03.29 | 1010 | WT | 0 | 355/301 | ||
| 00011184223 | 2022.07.10 | 904 | WT | 0 | 196/209 | ||
| 00011184224 | 2022.07.11 | 802 | WT | 0 | 213/193 | ||
| 00096558013 | 2023.02.13 | 929 | WT | 0 | 200/158 | ||
| 00015411021 | 2023.02.14 | 923 | WT | 0 | 171/154 | ||
| 00096558014 | 2023.02.14 | 896 | WT | 0 | 112/154 | ||
| 00015411036 | 2023.03.19 | 1093 | WT | 0 | 225/185 | ||
| 00015411038 | 2023.03.20 | 1462 | WT | 0 | 249/212 | ||
| 00015411039 | 2023.03.20 | 1110 | WT | 0 | 231/186 | ||
| 00015411051 | 2023.04.17 | 616 | WT | 0 | 168/139 | ||
| 00015411052 | 2023.04.17 | 775 | WT | 0 | 80/81 | ||
| 00015411053 | 2023.04.17 | 1141 | WT | 0 | 242/189 | ||
| 00015411054 | 2023.04.18 | 825 | WT | 0 | 152/139 | ||
| 00015411055 | 2023.04.18 | 818 | WT | 0 | 116/100 | ||
| 00015411056 | 2023.04.19 | 844 | WT | 0 | 152/128 | ||
| 00015411057 | 2023.04.20 | 774 | WT | 0 | 219/179 | ||
| 00015411058 | 2023.04.21 | 290 | WT | 0 | 62/44 | ||
| 00015411059 | 2023.04.22 | 949 | WT | 0 | 195/180 | ||
| 00015411060 | 2023.04.23 | 930 | WT | 0 | 100/110 | ||
| 00015411061 | 2023.04.24 | 937 | WT | 0 | 167/160 | ||
| 00015411062 | 2023.04.25 | 924 | WT | 0 | 187/163 | ||
| 00015411063 | 2023.04.26 | 1063 | WT | 0 | 218/163 | ||
| 00015411064 | 2023.04.28 | 1300 | WT | 0 | 177/189 | ||
| 00015411065 | 2023.05.01 | 954 | WT | 0 | 159/172 | ||
| 60701032002 | 2022.03.09 | 19724 | FPMA | 373/394 | |||
| 19548 | FPMB | 393/381 | |||||
| 19636 | FPMA+FPMB | 778/778 | |||||
| XRT+FPMA+FPMB | 1199/1092 | ||||||
| 60702062004 | 2022.03.27 | 20297 | FPMA | 487/481 | |||
| 20143 | FPMB | 435/473 | |||||
| 20220 | FPMA+FPMB | 944/957 | |||||
| XRT+FPMA+FPMB | 1268/1247 |
| Date | ||||||
|---|---|---|---|---|---|---|
| (%) | (°) | (%) | (°) | (%) | (°) | |
| 2022.04.01 | ||||||
| 2022.07.21 | ||||||
| 2022.08.19 | ||||||
| 2022.08.22 | ||||||
| 2022.08.28 | ||||||
| 2022.09.04 |
| Date | Band | Exposure | FWHM | Magnitude | Flux Density |
|---|---|---|---|---|---|
| (s) | (arcsec) | (mJy) | |||
| 2022.03.27 | 50 | 2.6 | |||
| 2022.03.28 | 50 | 2.5 |
| Date | Flux | TS | ||
|---|---|---|---|---|
| (10-11 erg cm-2 s-1) | ||||
| 2008.08.04–2023.09.30 | 42519.6 | |||
| 2022.03.02–2022.03.16 | 0.012$*$$*$footnotemark: | 91.0 | ||
| 2022.03.21–2022.04.04 | 0.012$*$$*$footnotemark: | 144.2 | ||
| 2022.07.03–2022.07.17 | 0.012$*$$*$footnotemark: | 115.3 | ||
| 2023.02.06–2023.02.20 | 0.012$*$$*$footnotemark: | 124.1 | ||
| 2023.03.13–2023.03.27 | 0.012$*$$*$footnotemark: | 154.6 | ||
| 2023.04.10–2023.04.24 | 0.012$*$$*$footnotemark: | 109.0 |