Exciton–photocarrier interference in mixed lead-halide-perovskite nanocrystals
Abstract
The use of semiconductor nanocrystals in scalable quantum technologies requires characterization of the exciton coherence dynamics in an ensemble of electronically isolated crystals in which system-bath interactions are nevertheless strong. In this communication, we identify signatures of Fano-like interference between excitons and photocarriers in the coherent two-dimensional photoluminescence excitation spectral lineshapes of mixed lead-halide perovskite nanocrystals in dilute solution. Specifically, by tuning the femtosecond-pulse spectrum, we show such interference in an intermediate coupling regime, which is evident in the coherent lineshape when simultaneously exciting the exciton and the free-carrier band at higher energy. We conclude that this interference is an intrinsic effect that will be consequential in the quantum dynamics of the system and will thus dictate decoherence dynamics, with consequences in their application in quantum technologies.
I Introduction
In condensed matter, the role of the noisy bath in dissipating the coherence induced by system-light interactions is of fundamental significance in dictating the optical properties of materials. The bath is often understood to imply electron-phonon coupling [1], dielectric fluctuations in a noisy thermal environment [2], or inter-particle Coulomb scattering [3, 4], for example; here we consider the effect of interference of multiple close-lying optical states, which can be an intrinsic source of decoherence arising from the specific electronic structure of the material. There are several examples of inter-excitonic coherence in II-VI colloidal quantum dots [5, 6, 7]. For example, Cassette et al. measured the coherent superposition of heavy-hole and light-hole excitons in \ceCdSe nanoplates [8]. Quantifying these types of inter-state coherent coupling is particularly important in the development of materials for quantum technologies, where the goal is to harness and manipulate electronic coherence in photoexcitations [7, 9]. The implementation of semiconductor nanocrystals (NCs), specifically in a quantum confinement regime (quantum dots, in which the crystal dimension is smaller than the exciton Bohr radius), in quantum-technological applications, such as single-photon sources and photonic quantum simulation, is of high contemporary interest [10, 11, 12]. Significantly, the coherence time of emitted photons in single metal-halide perovskite NCs has been determined to be in the order of picoseconds, comparable to the radiative lifetime [10], leading to single-photon emission in a quantum regime. In these contexts, it is important to understand the complex quantum dynamics to both minimize decoherence, and to exploit scattering mechanisms as a handle of nonlinear interactions in matter [13].
A tool of choice to measure decoherence dynamics is coherent nonlinear spectroscopy, but such reports in perovskite NCs are scarce [14, 15, 16], in contrast to the case of II-VI semiconductor quantum dots [5, 17, 8]. In the latter systems, the photophysics involves discrete and well-resolved excited-state resonances [18]. Based on incoherent nonlinear spectroscopy, Butkus et al. demonstrated that in pure metal-halide perovskite cubic NCs, strong quantum confinement signatures manifest in transient absorption lineshapes only when the edge length is smaller than nm [19].As a consequence, they concluded the spectral signatures of metal-halide perovskite NCs with size nm resemble those of the bulk semiconductor. More recently, the synthesis of monodisperse spheroidal perovskite NCs results in well-resolved higher energy excitonic signatures for crystal sizes of 10 nm [20, 21].
In this communication, we measure the coherent nonlinear response of mixed-lead-halide perovskite NCs utilizing coherent two-dimensional photoluminescence excitation spectroscopy (2D-PLE). The NCs used in this study do not exhibit strong quantum confinement effects. Their photophysical characteristics are akin to their bulk counterparts. However, the major difference lies in the reduced defect density. We have previously observed that the 2D-PLE technique fails to unambiguously measure the coherent response in bulk perovskite films, due to the incoherent mixing of photo-generated population operating in the defect-limited regime, see Ref.s 22, 23. Such incoherent contributions are effectively negated in NCs due to a substantial reduction in defect density, as evidenced by the intensity independent, and high photoluminescence quantum yield as well as by intensity independent PL dynamics. This ensures that we can reliably retrieve the true coherent nonlinear response of the material through 2D-PLE.
We present evidence of coherent coupling between an exciton state and the free-carrier continuum via lineshape analysis of the complex coherent spectrum as a function of excitation energy. The nonlinear optical lineshape is well described by a model for Fano-like interference introduced by Finkelstein et al [24]. We posit that this is a general effect in the quantum dynamics of semiconductor NCs near the quantum confinement regime, where the exciton resonance and the edge of the free-carrier band are nearly degenerate.
II Results and Discussion
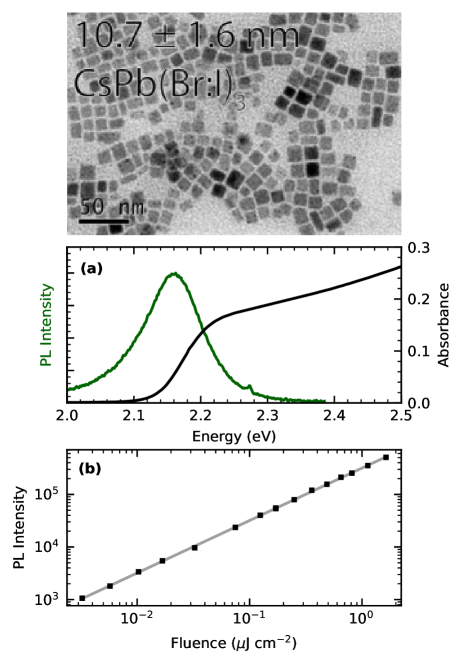
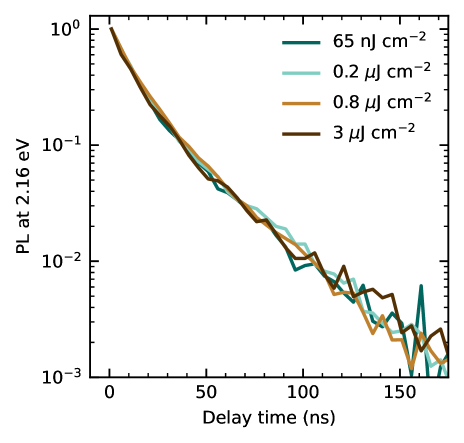
We studied CsPb(Br:I)3 NCs with an average edge length of nm, determined by transmission electronic microscopy (TEM, Fig. 1). This size is slightly above that for quantum confinement [25], placing this sample in a weak to intermediate confinement regime [19, 26]. Accordingly, the absorption spectrum shows a spectral lineshape of the bulk semiconductor (Fig. 1(a)). The photoluminescence intensity scales linearly with excitation density, over two orders of magnitude, as shown in Fig. 1(b). The PL decay dynamics are also intensity-independent, albeit having a multi-exponential behavior possibly due to intrinsic sample inhomogeneity. These observations indicate the recombination process is predominantly radiative with negligible contribution from defects. Importantly, the PL response is linear, and any nonlinearity measured through 2D-PLE, over the same fluence range (Fig. 1(b)), is entirely due to the coherent response of the material. This is also confirmed by the coherent response analysis shown in the SI and developed in previous work [23].
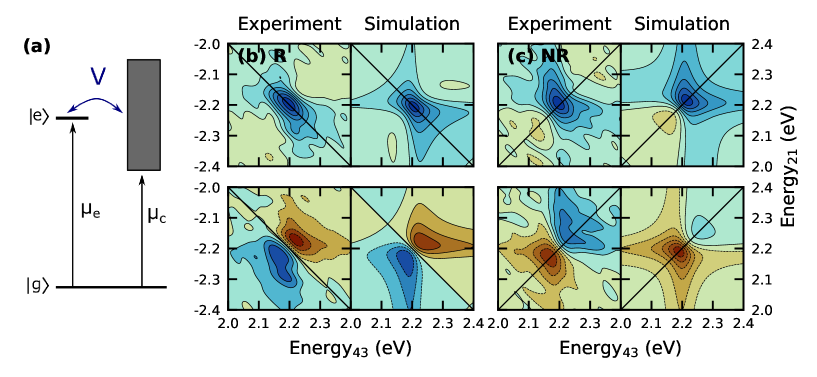
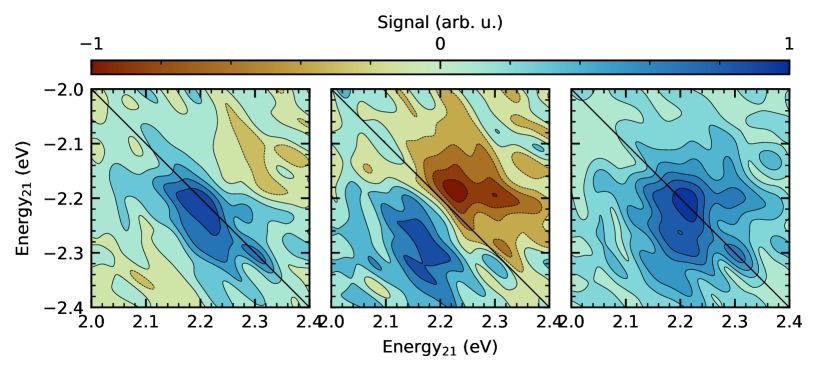
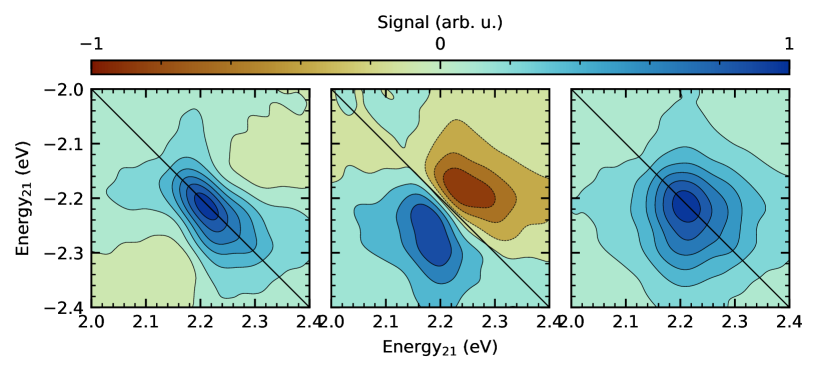
We performed 2D-PLE measurements in a dilute solution of CsPb(Br:I)3 NCs at room temperature and analyzed the measured lineshapes in the context of a Fano interference model (Fig. 2(a)). For a single excitonic transition, we expect the real component of the rephasing spectrum to be symmetric along the anti-diagonal and the diagonal. In the real part of the rephasing 2D-PLE spectrum (Fig. 2(b), top left), we observe an asymmetry along the diagonal, and at higher energies. The asymmetry is also observed, in distinct form, in the imaginary components and the non-rephasing spectrum (Fig. 2(c), bottom right). Similar asymmetric two-dimensional spectral lineshapes have been theoretically predicted [24] and experimentally observed in a variety of material systems [27, 28, 29]. Fundamentally, it is attributed to the Fano interference between a discrete excited state and a continuum of states that energetically overlap. While this phenomenon is more common in the context of photonics and plasmonics [30, 31], in the case of semiconductors presence of overlapping electronic excited states is suggested to lead to a similar scenario. More precisely, here we interpret the spectral lineshape as the result of Fano-like interference of the discrete excitonic state and the free-carrier continuum band.
In this context, Finkelstein et al. derived analytical expressions for the two-dimensional coherent Fano-profiles [32, 24, 33]. The Fano Hamiltonian, equation (1), describes the scenario for a discrete transition to state with energy () coherently coupled to a continuum of states {} with energies {} with a coupling constant :
| (1) | ||||
where represents the ground-state wavevector with energy .
The expression for the rephasing response for the ground-state bleach contribution (), obtained for the Hamiltonian described in equation (1), is shown in equation (2), 111We have ignored the population time dependence in equation (2) as we do not explore that variable in this work, however, the original derivations in ref. 24 include such dependence. which assumes impulsive light-matter interactions, and also assumes that the continuum parameters are independent of energy:
| (2) |
where with and corresponding to the dephasing of the discrete and continuum states, and are the dimensionless energy variables represented in Fig. 2. The parameter is the asymmetry factor grouping together the parameters associated with the discrete and continuum-state coupling, and are the transition dipole moments for the discrete and continuum states, respectively, and is the density of states in the continuum. Note that for very large () the Lorentzian lineshape is recovered. The corresponding non-rephasing response () reads as:
| (3) |
In the non-rephasing spectra, both axes are given by and in the rephasing spectra the y-axis, which in the convention used in this work is the “pump” energy, is given by . The expressions for the stimulated emission pathways can be found in the original text [24] and the Supporting Information.
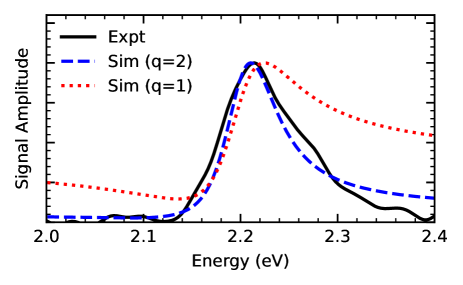
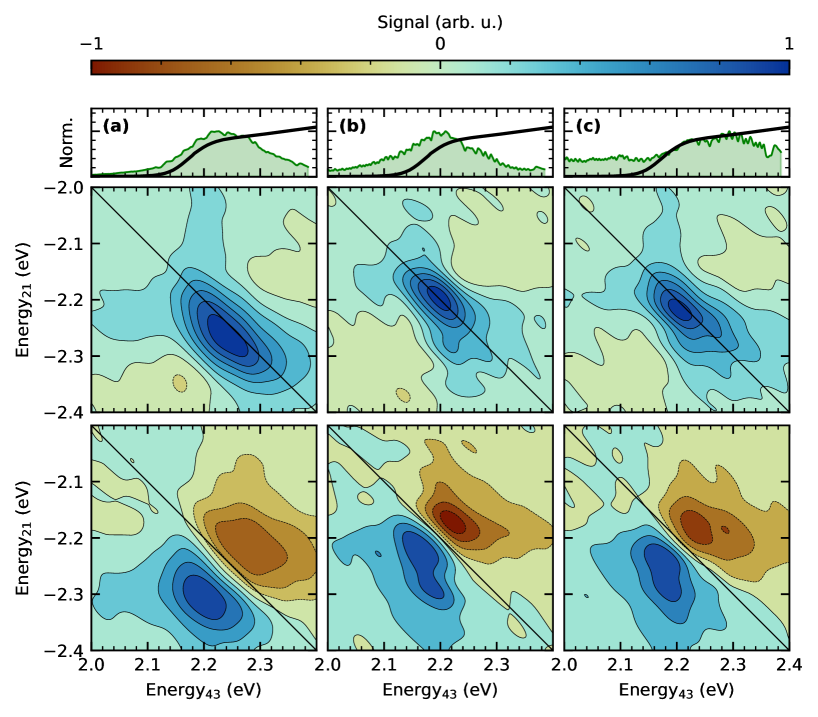
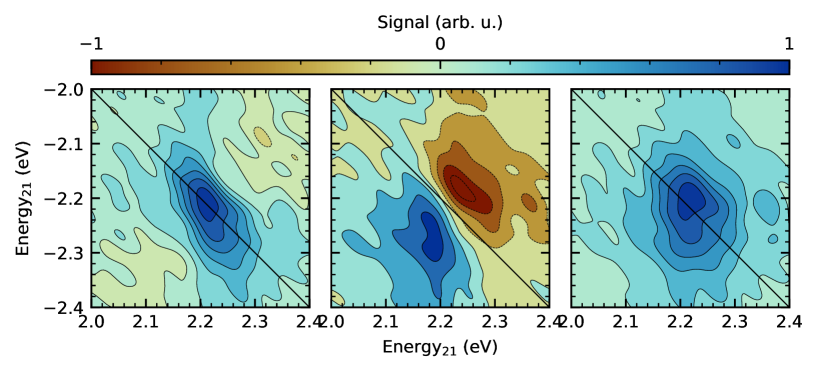
The simulated nonlinear lineshapes agree well with the experimental lineshapes. Here, we considered the ground-state bleach and stimulated emission pathways, 222The excited-state pathways are not considered in this work as we do not observe any indication in the experimental data. To the interested reader, the derived expressions can be found in ref. 33. and set eV, eV and (Fig. 2). Coherent nonlinear spectroscopy of metal halide perovskites has been performed and reported by several groups [14, 15, 36]. Interestingly, these earlier works do not report any asymmetry in the spectral lineshapes. We highlight that most of the analysis so far has been performed on the total correlation spectrum, which is the cumulative sum of the rephasing and non-rephasing components. In the present case, while we observe a distinct Fano-like lineshape in the rephasing and non-rephasing components, it is less evident in the absorptive components of the total correlation spectrum, consistent with the previous reports. A closer inspection of the diagonal cut of the total absorptive spectrum, shown in Fig. 3 reveals a clear symmetry. We also show the simulated spectra obtained using equations (2), (3), (5) and (4), and considering two coupling parameters set at and . The moderate exciton-continuum coupling defined by accurately resembles the experimental spectrum. In fact, from linear spectroscopy, where Fano-profiles are usually identified, it would not have been possible to assign coherent exciton-carrier coupling in this system due to the subtlety of the effect under the coupling conditions reflected by this analysis.
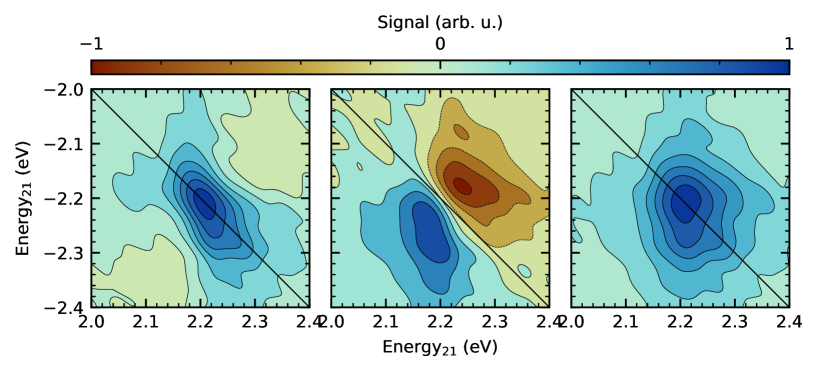
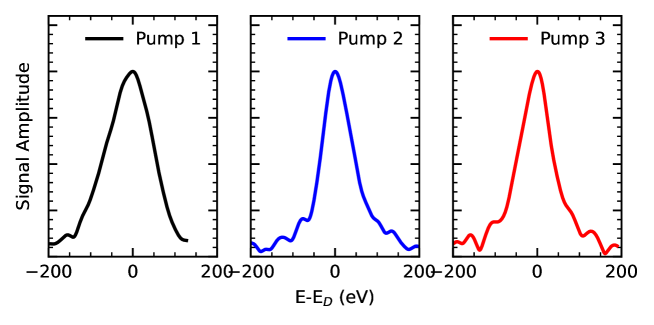
To further substantiate the Fano interference of exciton and carrier continuum, we analyze the nonlinear spectra obtained with three distinct laser excitation spectra (Fig. 4). We show the cases for (i) a laser spectrum that excites resonantly the free-carrier band only (Fig. 4.a), (ii) a redshifted spectrum that excites the exciton and a part of the continuum close to the optical edge, and (iii) a broadband excitation pulse covering both the previous conditions. When pumping primarily the free-carrier band, we observe a spectrum expected of a continuum, which is inhomogeneously broadened, and importantly, without any signatures of Fano interference. Under condition (ii), we observe the signatures of the Fano-interference as the discrete state is also coherently excited, which, we suggest, interferes with the continuum of free carriers. To discard the case of two independent transitions (not interfering) that spectrally overlap, the third condition excites, with a broad spectrum, the band-edge and the high energy free-band states of the nanocrystals. Note that when exciting two distinct transitions, the laser spectrum enhances the nonlinear responses from transitions resonant to it. We do not observe a significant change in the line shape supporting the interpretation that the asymmetric lineshape is caused by the interaction of the exciton at the band-edge and the free-carriers band that are coherently excited. The pure dephasing width (), estimated from the full-width half max (FWHM) of the anti-diagonal cut of the absolute rephasing component () at 2.25 eV, is meV. Under conditions (ii) and (iii) and meV at 2.2 eV, respectively.
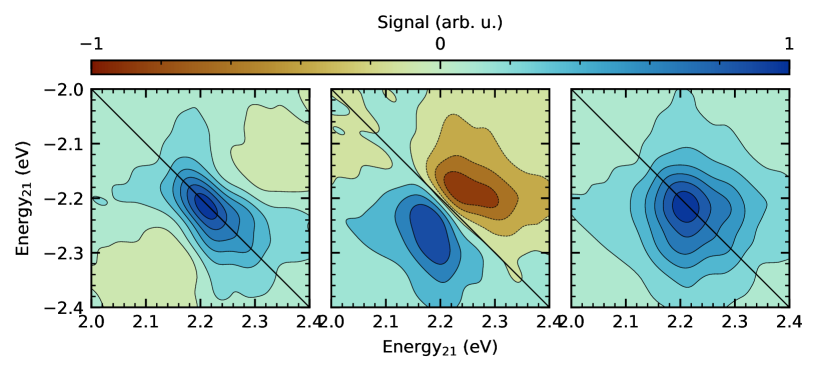
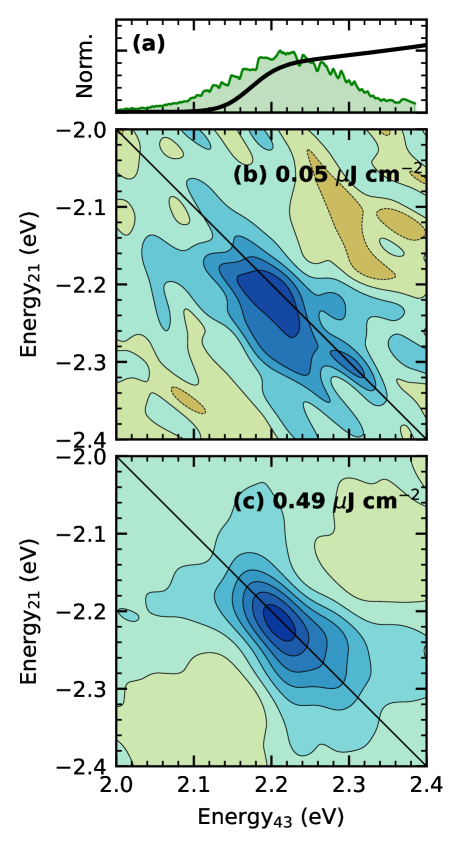
As perovskite NCs have a shallow defect distribution within the band edge [37], we performed intensity-dependent experiments with the idea that if the discrete state observed in the nonlinear lineshape corresponds to a shallow defect, we would see an intensity-dependent nonlinear lineshape. We do not observe a significant shift in the energies or spectra lineshape in the fluence range probed. However, when comparing the spectra measured at the lowest fluence (0.05 J cm-2) with a spectrum measured at four times the power, we note that there are unresolved dynamics that lead to an asymmetry along the anti-diagonal in the lineshape. We believe these dynamics correspond to relaxation population dynamics, which have been studied previously in nanocrystals [15] and are not the main subject of this communication. We show the complete spectra in the Supplementary information (Fig. S4-8).
III Summary and outlook
In this communication, we have presented analysis of two-dimensional spectral response of colloidal nanocrystals of metal halide perovskites. Typically, the optical absorption spectra of these moderately confined nanocrystals are rationalized within the Elliott formalism with distinct excitonic resonances below the bandedge. The nonlinear optical spectra discussed in this manuscript however manifest lineshapes that are indicative of coherent coupling between the exciton and free carrier continuum. Within the spirit of the Fano model of coupling of a discrete state and a continuum, and based on our observation, the optical excitations here must be perceived as mixed quantum states of excitons and free carriers.
Fano-interference necessitates an energetic overlap of the discrete state and the continuum. The exciton, inherently distinct from the continuum by its binding energy, typically is however well separated. The necessary energetic overlap thus requires a significant spectral broadening of these states. Although the polydispersity of the sample may cause the broadening in the excitonic line’s linewidth due to its inhomogeneity, we believe that this will not induce Fano interference. This phenomenon relies on coherence, and in solutions, inter-dot coherent coupling is anticipated to be minimal. Alternatively, we consider that the broadening is a result of thermal dephasing due to strong electron-phonon coupling.
Interestingly, one can expect that the presence of Fano interactions further adds to the exciton dephasing and acts as a source of decoherence. Kuznetsova et al. discussed the effect of disorder in the homogeneous linewidth utilizing a Fano interference [38]. Broido et al. [39] also report a similar scenario in GaAs/AlxGa1-xAs quantum wells, where broadening of the excitonic features is induced by the Coulomb interactions of overlapping continuum of states [40].
Acknowledgements.
CSA acknowledges funding from the Government of Canada (Canada Excellence Research Chair CERC-2022-00055) and the Institut Courtois, Faculté des arts et des sciences, Université de Montréal (Chaire de Recherche de l’Institut Courtois). ARSK acknowledges start-up funds from Wake Forest University, funding from the Center for Functional Materials, and funding from the Office of Research and Sponsored Programs at Wake Forest University. ERG and CSA acknowledge support from the National Science Foundation (DMR-2019444: Science and Technology Center for Integration of Modern Optoelectronic Materials on Demand).Author Declarations
Conflicts of Interest
The authors have no conflicts to disclose.
Author Contributions
QA and LM synthesized and characterized the materials discussed in this manuscript. ARSK collected the 2D-PLE data and ERG carried out the primary analysis and modelling. ARSK and CSA led the intellectual conceptualization and co-supervised the project, and are corresponding co-authors. All co-authors contributed to the redaction of the manuscript.
Data Availability
The data that support the findings of this study are available from the corresponding co-authors upon reasonable request.
References
References
- Rudin et al. [1990] S. Rudin, T. L. Reinecke, and B. Segall, Phys. Rev. B 42, 11218 (1990).
- Grégoire et al. [2017a] P. Grégoire, E. Vella, M. Dyson, C. M. Bazán, R. Leonelli, N. Stingelin, P. N. Stavrinou, E. R. Bittner, and C. Silva, Phys. Rev. B 95, 180201 (2017a).
- Li et al. [2006] X. Li, T. Zhang, C. N. Borca, and S. T. Cundiff, Phys. Rev. Lett. 96, 057406 (2006).
- Srimath Kandada et al. [2020] A. R. Srimath Kandada, H. Li, F. Thouin, E. R. Bittner, and C. Silva, J. Chem. Phys. 153, 164706 (2020).
- Turner et al. [2012] D. B. Turner, Y. Hassan, and G. D. Scholes, Nano Lett. 12, 880 (2012).
- Caram et al. [2014] J. R. Caram, H. Zheng, P. D. Dahlberg, B. S. Rolczynski, G. B. Griffin, A. F. Fidler, D. S. Dolzhnikov, D. V. Talapin, and G. S. Engel, J. Phys. Chem. Lett. 5, 196 (2014).
- Collini et al. [2019] E. Collini, H. Gattuso, L. Bolzonello, A. Casotto, A. Volpato, C. N. Dibenedetto, E. Fanizza, M. Striccoli, and F. Remacle, J. Phys. Chem. C 123, 31286 (2019).
- Cassette et al. [2015] E. Cassette, R. D. Pensack, B. Mahler, and G. D. Scholes, Nat. Commun. 6, 6086 (2015).
- Kagan et al. [2021] C. R. Kagan, L. C. Bassett, C. B. Murray, and S. M. Thompson, Chem. Rev. 121, 3186 (2021).
- Utzat et al. [2019] H. Utzat, W. Sun, A. E. K. Kaplan, F. Krieg, M. Ginterseder, B. Spokoyny, N. D. Klein, K. E. Shulenberger, C. F. Perkinson, M. V. Kovalenko, and M. G. Bawendi, Science 363, 1068 (2019).
- Tao et al. [2022] R. Tao, K. Peng, L. Haeberlé, Q. Li, D. Jin, G. R. Fleming, S. Kéna-Cohen, X. Zhang, and W. Bao, Nat. Mater. 21, 761 (2022).
- Chen et al. [2022] Y. Chen, D. Sharp, A. Saxena, H. Nguyen, B. M. Cossairt, and A. Majumdar, Adv. Quantum Technol. 5, 2100078 (2022).
- Chang et al. [2014] D. E. Chang, V. Vuletić, and M. D. Lukin, Nat. Photonics 8, 685 (2014).
- Seiler et al. [2019] H. Seiler, S. Palato, C. Sonnichsen, H. Baker, E. Socie, D. P. Strandell, and P. Kambhampati, Nat. Commun. 10, 4962 (2019).
- Yu et al. [2021] B. Yu, L. Chen, Z. Qu, C. Zhang, Z. Qin, X. Wang, and M. Xiao, J. Phys. Chem. Lett. 12, 238 (2021).
- Liu et al. [2021] A. Liu, D. B. Almeida, L. G. Bonato, G. Nagamine, L. F. Zagonel, A. F. Nogueira, L. A. Padilha, and S. T. Cundiff, Sci. Adv. 7, eabb3594 (2021).
- Protesescu et al. [2015a] L. Protesescu, S. Yakunin, M. I. Bodnarchuk, F. Krieg, R. Caputo, C. H. Hendon, R. X. Yang, A. Walsh, and M. V. Kovalenko, Nano Lett. 15, 3692 (2015a).
- Bawendi et al. [1990] M. G. Bawendi, M. L. Steigerwald, and L. E. Brus, Annu. Rev. Phys. Chem. 41, 477 (1990).
- Butkus et al. [2017] J. Butkus, P. Vashishtha, K. Chen, J. K. Gallaher, S. K. K. Prasad, D. Z. Metin, G. Laufersky, N. Gaston, J. E. Halpert, and J. M. Hodgkiss, Chem. Mater. 29, 3644 (2017).
- Akkerman et al. [2022] Q. A. Akkerman, T. P. T. Nguyen, S. C. Boehme, F. Montanarella, D. N. Dirin, P. Wechsler, F. Beiglböck, G. Rainò, R. Erni, C. Katan, J. Even, and M. V. Kovalenko, Science 377, 1406 (2022).
- Barfüßer et al. [2022] A. Barfüßer, S. Rieger, A. Dey, A. Tosun, Q. A. Akkerman, T. Debnath, and J. Feldmann, Nano Lett. 22, 8810 (2022).
- Grégoire et al. [2017b] P. Grégoire, A. R. Srimath Kandada, E. Vella, C. Tao, R. Leonelli, and C. Silva, J. Chem. Phys. 147, 114201 (2017b).
- Bargigia et al. [2022] I. Bargigia, E. Gutiérrez-Meza, D. A. Valverde-Chávez, S. R. Marques, A. R. Srimath Kandada, and C. Silva, J. Chem. Phys. 157 (2022).
- Finkelstein-Shapiro et al. [2016] D. Finkelstein-Shapiro, F. Poulsen, T. Pullerits, and T. Hansen, Phys. Rev. B 94, 205137 (2016).
- Protesescu et al. [2015b] L. Protesescu, S. Yakunin, M. I. Bodnarchuk, F. Krieg, R. Caputo, C. H. Hendon, R. X. Yang, A. Walsh, and M. V. Kovalenko, Nano Lett. 15, 3692 (2015b).
- Zhao et al. [2020] Q. Zhao, A. Hazarika, L. T. Schelhas, J. Liu, E. A. Gaulding, G. Li, M. Zhang, M. F. Toney, P. C. Sercel, and J. M. Luther, ACS Energy Lett. 5, 238 (2020).
- Gandman et al. [2017] A. Gandman, R. Mackin, B. Cohn, I. V. Rubtsov, and L. Chuntonov, J. Phys. Chem. Lett. 8, 3341 (2017).
- Roeding and Brixner [2018] S. Roeding and T. Brixner, Nat. Commun. 9, 2519 (2018).
- Rojas-Gatjens et al. [2024] E. Rojas-Gatjens, D. O. Tiede, K. A. Koch, C. Romero-Perez, J. F. Galisteo-López, M. E. Calvo, H. Míguez, and A. R. S. Kandada, JPhys Materials 7, 025002 (2024).
- Miroshnichenko et al. [2010] A. E. Miroshnichenko, S. Flach, and Y. S. Kivshar, Rev. Mod. Phys. 82, 2257 (2010).
- Luk’yanchuk et al. [2010] B. Luk’yanchuk, N. I. Zheludev, S. A. Maier, N. J. Halas, P. Nordlander, H. Giessen, and C. T. Chong, Nat. Mater. 9, 707 (2010).
- Finkelstein-Shapiro et al. [2015] D. Finkelstein-Shapiro, I. Urdaneta, M. Calatayud, O. Atabek, V. Mujica, and A. Keller, Phys. Rev. Lett. 115, 113006 (2015).
- Finkelstein-Shapiro et al. [2018] D. Finkelstein-Shapiro, T. Pullerits, and T. Hansen, J. Chem. Phys. 148, 184201 (2018).
- Note [1] We have ignored the population time dependence in equation (2) as we do not explore that variable in this work, however, the original derivations in ref. 24 include such dependence.
- Note [2] The excited-state pathways are not considered in this work as we do not observe any indication in the experimental data. To the interested reader, the derived expressions can be found in ref. 33.
- Brosseau et al. [2023] P. Brosseau, A. Ghosh, H. Seiler, D. Strandell, and P. Kambhampati, J. Chem. Phys. 159, 184711 (2023).
- Akkerman et al. [2018] Q. A. Akkerman, G. Rainò, M. V. Kovalenko, and L. Manna, Nat. Mater. 17, 394 (2018).
- Kuznetsova et al. [2010] I. Kuznetsova, N. Gőgh, J. Förstner, T. Meier, S. T. Cundiff, I. Varga, and P. Thomas, Phys. Rev. B 81, 075307 (2010).
- Broido et al. [1988] D. A. Broido, E. S. Koteles, C. Jagannath, and J. Y. Chi, Phys. Rev. B 37, 2725 (1988).
- Broido and Yang [1990] D. A. Broido and S.-R. E. Yang, Phys. Rev. B 42, 11051 (1990).
Supplementary Material
Exciton–photocarrier interference in mixed lead-halide-perovskite nanocrystals
Esteban Rojas-Gatjens, Quinten Akkerman, Liberato Manna, Ajay Ram Srimath Kandada, Carlos Silva-Acuña
S1 Experimental Methods
a \ceCsPbX3 (X = Br:I) NC synthesis and purification
Lead(II) bromide (\cePbBr2, 99.999% trace metals basis), lead(II) iodide (\cePbI2, 99.999% trace metals basis), cesium carbonate (\ceCs2CO3, reagentPlus, 99%), octadecene (ODE, technical grade, 90%), oleylamine (OLAM, 70%) and oleic acid (OA, 90%) were purchased from Sigma-Aldrich. Toluene (TOL, anhydrous, 99.8%) was purchased from Carlo Erba reagents. All chemicals were used without any further purification. \ceCsPbX3 (X = Br:I) NCs were synthesized as described by Protesescu et al. with minor adaptations [17]. In a typical synthesis, 0.2 mmol of \cePbX2 (36 mg \cePbBr2 with 46 mg \cePbI2 for the CsPb(Br:I)3 NCs), 5 mL of ODE, 0.5 mL of OA and 0.5 mL of OLAM were loaded in a 25 mL 3-neck flask and dried under a vacuum for 1 h at 120 oC. After degassing, the temperature was raised to 180 oC and a mixture of 0.6 mL of ODE with 0.4 mL of previously synthesized Cs-oleate (0.4 g of \ceCs2CO3 degassed in 15 mL of ODE and 1.75 mL of OA at 150 oC) was swiftly injected. Immediately after the injection, the NC solution was quickly cooled down to room temperature with an ice bath, and centrifugated for 15 min at 40,000 rpm. The purified re-dispersed in TOL and stored in a glovebox.
b Transmission electron microscopy (TEM)
Conventional TEM observations were carried out using a JEOL JEM 1011 microscope equipped with a thermionic gun operating at 100 kV of accelerating voltage. Samples were prepared by dropping washed and diluted (in TOL) NC solutions onto carbon-coated 200-mesh copper grids with subsequent solvent evaporation.
c Coherent two-dimensional photoluminescence excitation spectroscopy
The 2D-PLE measurements reported in this manuscript were measured as described in detail in a previous publication [2]. A four-pulse sequence is generated by two Mach-Zehnder interferometers (MZI) nested in an outer MZI, with each inner MZI equipped with acousto-optic modulators that modulate the relative phase of the variably-delayed pulse pair at a distinct kHz frequency. This pulse sequence is derived from a non-collinear optical parametric amplifier (Light Conversion Orpheus-N-3H, 600 nm, 80 nm band-with), pumped by the output of a regenerative amplifier (Light Conversion Pharos, 600 kHz, 1030 nm, 220 fs). An adaptive pulse shaper (BioPhotonics Solutions FemtoJock-P) pre-compresses the pulse to reach the transform limit at the sample position ( fs). The four collinear pulses generated by this arrangement were directed to the sample solution prepared according to the procedure above, and the spectrally-integrated photoluminescence (PL) intensity was used to construct the two-dimensional action (excitation) spectrum. The integrated signal was demodulated in a lock-in amplifier using a reference waveform with frequency at a side band of the modulation frequencies of the relative phase of pulses 1 and 2 (produced in one of the inner MZI) and that of pulses 3 and 4 (produced in the other internal MZI). This allows the construction of the two-dimensional coherence decay function at the variable time axes between pulses 1 and 2, and between pulses 3 and 4, at a fixed population waiting time (delay between the sequence of pulses 1, 2 and pulses 3, 4). Fourier transformation about the two coherence variable time axes produces the two-dimensional coherent function. We direct the reader to the Supplemental Material document of reference 2 for further detail.
S2 Supporting data and analysis
a Incoherent mixing analysis
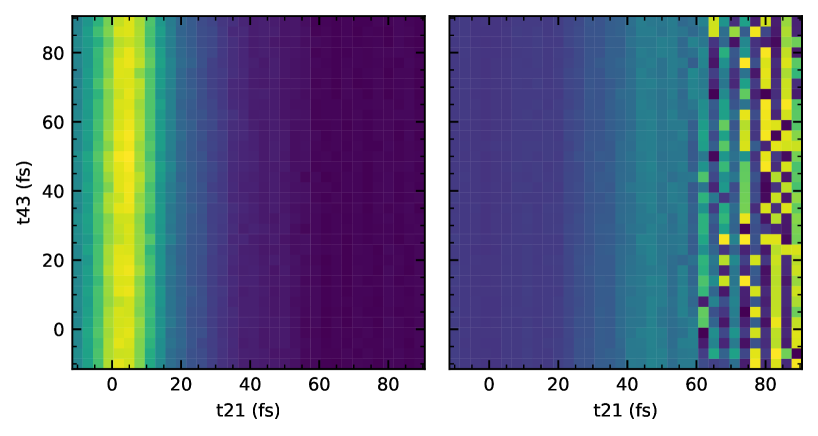
We follow the discussion from Ref. 23. We can identify incoherent mixing by analyzing the linear response. The linear response is collected by demodulating the at a frequency where is the modulation frequency of the individual pulses. In the absence of incoherent nonlinearities in the material response, usually caused by exciton-exciton annihilation and trap-assisted recombination, the only contribution comes from the linear population response. As a consequence, the linear signal obtained by demodulating is dependent only on the delay but no . Incoherent mixing will cause the linear signal to depend both on and . In the experimental data (S2), we do not observe a dependence on suggesting that the signal is not dominated by incoherent contributions.
b Fano model
For the sake of completeness, we include here the expression derived by Finkelstein et al [24] for the rephasing and non-rephasing components corresponding to stimulated emission.
| (4) |
| (5) |
c Complementary analysis, laser spectrum dependence
d Power dependence 2D spectra