Modeling the amplification of epidemic spread by misinformed populations
)
Abstract
Understanding how misinformation affects the spread of disease is crucial for public health, especially given recent research indicating that misinformation can increase vaccine hesitancy and discourage vaccine uptake. However, it is difficult to investigate the interaction between misinformation and epidemic outcomes due to the dearth of data-informed holistic epidemic models. Here, we propose an epidemic model that incorporates a large, mobility-informed physical contact network as well as the distribution of misinformed individuals across counties derived from social media data. Our model allows us to simulate and estimate various scenarios to understand the impact of misinformation on epidemic spreading. Using this model, we estimate that misinformation could have led to 47 million additional COVID-19 infections in the U.S. in a worst-case scenario.
Social factors, such as information sharing, play a crucial role in shaping the dynamics and epidemiology of infectious diseases12, 5. For instance, a population’s willingness to adopt public health measures (or lack thereof) largely determines their successes or failures30, 4. A population’s behavioral response to outbreaks can be influenced by mass media, as witnessed during the 2009 H1N1 influenza pandemic36, or by social media and the anti-vaccination movement1, 22, 10, 13.
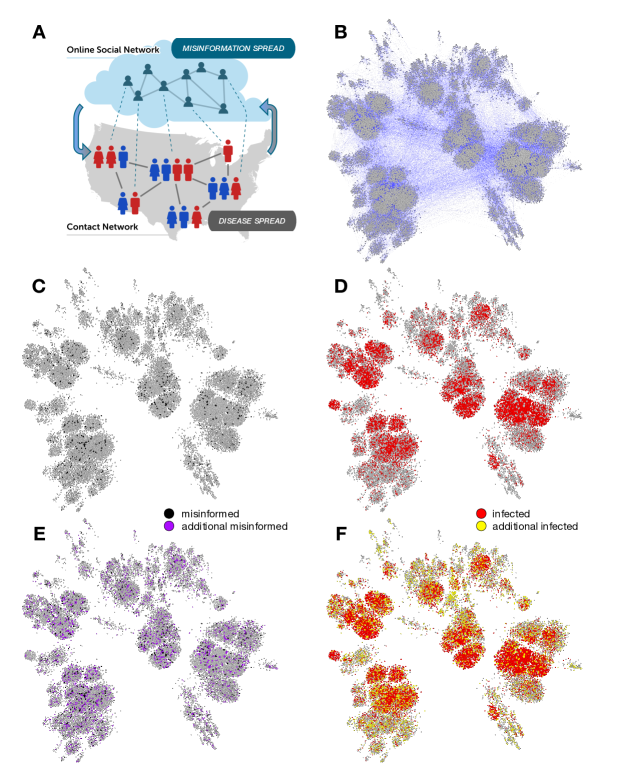
In particular, misinformation spreading on social networks has been linked to poor compliance with COVID-19 public health guidance41. Greater exposure to unreliable news articles about COVID-19 vaccines has been linked to an increase in vaccine hesitancy and a decrease in vaccination rates at both state and county levels in the United States38, 35. Exposure to online misinformation has also been shown to increase vaccine hesitancy in laboratory experiments29. This is particularly detrimental during vaccination campaigns as clusters of individuals adopting anti-vaccination opinions can make it challenging for a population to reach herd immunity16, 43. Proper management of epidemic crises in the modern age thus requires the understanding of the complex relationship between the spread of (mis)information through online social networks and the spread of disease through physical contact networks (Fig. 1).
While previous agent-based simulations have shown that misinformation may impede the suppression of epidemics in various ways46, 32, 37, 9, there is a growing need to integrate real-world data to strengthen the connections between simulation results and real-world outcomes. Social media can provide valuable data sources for this purpose6, 47.
We address this challenge by proposing a data-informed epidemic model that takes both the distribution of misinformed individuals and a physical mobility network into account. Using this data, we augment the Susceptible-Infected-Recovered (SIR) model to account for a subpopulation of “misinformed” individuals, who do not heed expert public health guidance. We explore how this group can affect the larger, ordinary population using both a mean-field approximation, which assumes all individuals have an equal chance of interacting, and a multi-level agent-based simulation based on two large, data-informed network: a social network where misinformation spreads and a contact network where the disease can propagate. A contact network of approximately 20 million nodes is constructed by leveraging large-scale Twitter data, county-level voting records, and cellphone mobility data. We incorporate theoretically extreme values of the parameter responsible for the epidemic transmission to evaluate best- and worst-case scenarios about the impact of misinformed individuals on the spread of disease and obtain quantitative bounds on the harm caused by misinformation.
Results
In our model, as in the standard SIR modeling framework2, a parameter describes the average number of infected individuals generated by an infected individual in a time unit. Infected individuals recover with rate . We extend this epidemic model to account for misinformed and ordinary subpopulations. We utilize six compartments to capture the three stages of SIR for each subpopulation. The fractions of individuals in the susceptible, infected, and recovered compartments are denoted by , , and respectively for the ordinary group; and by , , and for the misinformed group.
Ordinary individuals are considered to be well-informed about public health guidelines, while misinformed individuals, having been exposed to untrustworthy information, are assumed to be less likely to follow recommended behaviors, such as social distancing, mask-wearing, and vaccination, thereby increasing the risk of infection for themselves and others. We therefore define two distinct parameters and for ordinary and misinformed susceptibles, respectively. We model the risky behavior of the misinformed group by setting . The recovery rate is identical for both subpopulations. We refer to this as the Susceptible Misinformed Infected Recovered (SMIR) model.
Mean-field simulations
The mean-field approach assumes that an infected individual can transmit disease to any susceptible individual. With this assumption, we derive the model’s mean-field system of equations (see Methods) and explore parameter values for which epidemic spread occurs. We denote the proportions of ordinary and misinformed individuals as and , respectively. An initial proportion of the population is infected, split evenly between the ordinary and misinformed groups. Thus, we initialize the compartments with , , , , and .
The effects of varying the transmission and recovery parameters are predictable (see Supplementary Information): lower and higher “flatten the curve” and reduce the negative outcomes of an infection. Based on these explorations we set and such that the basic reproduction number to ensure epidemic spread. Next we focus on the effects of varying the misinformed subpopulation’s level of risk and the degree of homophily within the network.
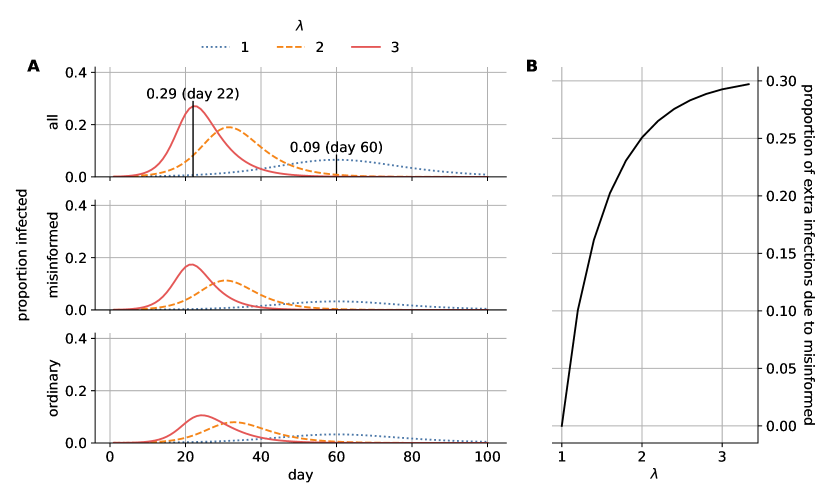
To explore the effects of risky behaviors by misinformed individuals, let us assume two equally-sized subpopulations () and introduce the scaling factor . Fig. 2 illustrates the increasing negative impact of the misinformed subpopulation on the disease-spreading dynamics as becomes larger. The social cost associated with the more risky behaviors by the misinformed group is passed on to the whole network. For example, when , peak infection for the entire population is reached 38 days earlier than in the case (day 22 vs. 60; Fig. 2A), leading to an additional 29.2% of the population becoming infected (Fig. 2B).
Let us explore the effect of homophily among the ordinary and misinformed subpopulation networks. Homophily means that infected individuals are more likely to interact with (and infect) susceptibles from the same subpopulation (ordinary or misinformed) than the other group. The degree of homophily is modeled by a parameter . When , individuals are equally likely to interact within and across groups (no homophily), whereas is the case when homophily is strongest and the subpopulations do not interact with each other (see Methods for details).
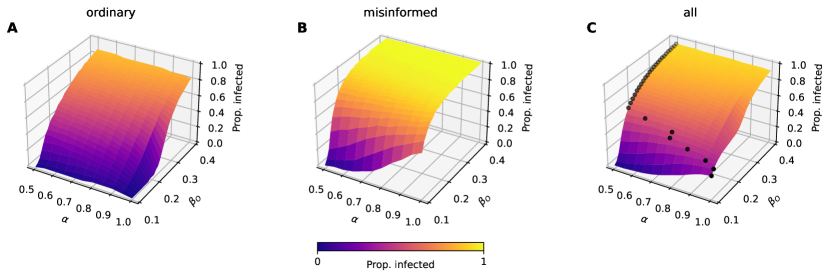
Fig. 3 illustrates the effects of homophily () for different levels of ordinary transmission (). For less infectious disease (low ), increasing homophily significantly harms the misinformed group (Fig. 3B): the infection remains confined within this group. There is no discernible effect on the ordinary population as long as the two groups interact; when they do not (), we observe a sharp reduction in infections (Fig. 3A). For , peak infection scenarios coincide with intermediate homophily levels, as indicated by the black dots in Fig. 3C 33. Under these conditions, while increased homophily decreases infections in the general populace, it significantly worsens outcomes for the misinformed group (compare Fig. 3B and C). As increases further, while nearly the entire misinformed population becomes infected regardless of (Fig. 3B), high homophily shields the full population (Fig. 3C): ordinary individuals have a lower risk of becoming infected through interactions with misinformed individuals. In summary, homophily offers greater protection to the ordinary group by isolating misinformed communities, which suffer a greater disease burden, exacerbating health disparities 42, 45.
Agent-based simulations
To examine the influence of misinformation within a more realistic epidemic framework, we utilize a multi-level model. Our approach combines an empirically derived information network with a contact network calibrated with real-world data, as illustrated in Fig. 4. Information diffusion is modeled by leveraging a large set of users of a popular social media platform and epidemic simulations are subsequently conducted on contact networks populated with misinformed individuals.
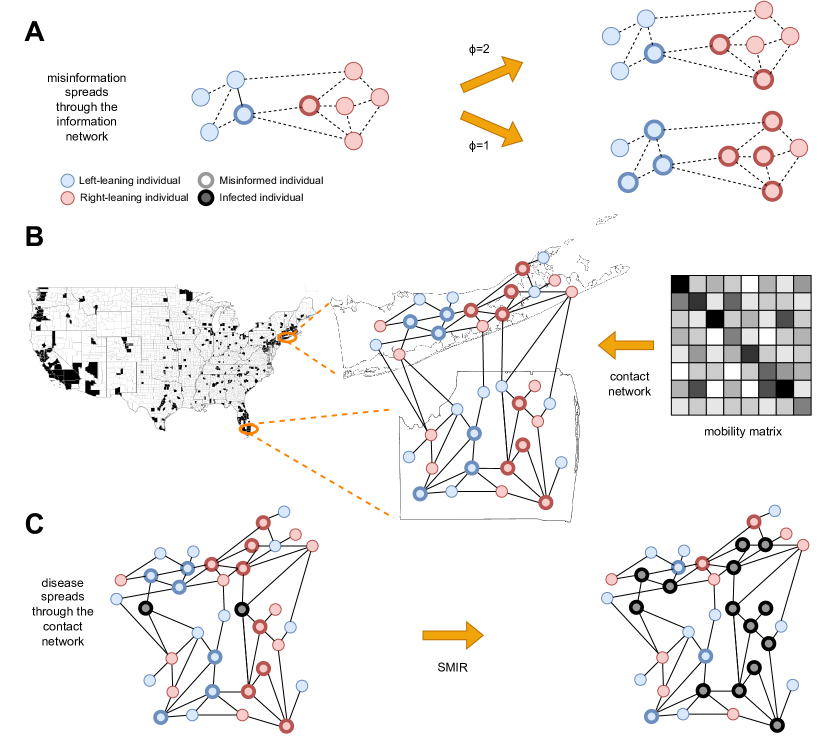
We leverage a large collection of English-language discussions taking place on Twitter about COVID-19 vaccines19. From approximately nine months of this data (Jan. 4–Sep. 30, 2021), we geolocate over 2 million U.S. users who shared almost 26 million tweets and focus on accounts in 341 U.S. counties containing more than 200 Twitter users each. We also infer an account’s political alignment and whether they shared any likely misinformation (see Methods). Twitter is not representative of the U.S. population, and people also access information in other ways, such as traditional media and word of mouth. However, this empirical social network serves as a data-informed proxy for a large, realistic network through which people share information about the disease.
With this data, we build a directed and weighted information diffusion network, in which an edge indicates that retweeted times. We simulate the spread of misinformation on this network, as illustrated in Fig. 4A. Accounts that share or reshare posts containing misinformation are considered misinformed. These accounts function as the initial seeds from which misinformation proliferates to the wider network. Not all users actively participate in content sharing, with only about half of U.S. Twitter users, for instance, engaging in this activity34. But even without active sharing, exposure to misinformation can still influence individual behavior29.
To account for users who may be misinformed through exposure, we employ a single-step linear threshold opinion-spreading process23. This is a simple way to model complex contagion15, 49, 31, according to which individuals require multiple exposures to misinformation before they become misinformed themselves. Let a linear threshold represent the minimum number of misinformed friends needed for an ordinary node to become misinformed. If the total number of misinformed friends of is greater than or equal to , is marked as misinformed (). The remaining nodes are marked as ordinary susceptibles (). We can interpret as a measure of “resilience” to misinformation; as it increases, individuals require more exposure to misinformation to be converted to the misinformed group. Note that since we explore the full range of values, the following results are unaffected whether the threshold is defined based on the number of users or the number of retweets.
Fig. 5A shows how influences the number of misinformed individuals within the retweet network. With strong resilience (), exposure to misinformation does not have much effect and few nodes are converted to the misinformed group. Conversely, when resilience to misinformation is very low (as in the simple contagion case ), all nodes exposed to a misinformation-containing post are converted to the misinformed group. Through this process, empirically observed misinformation-sharing behavior leads to information networks with misinformed subpopulations of varying sizes based on different values.
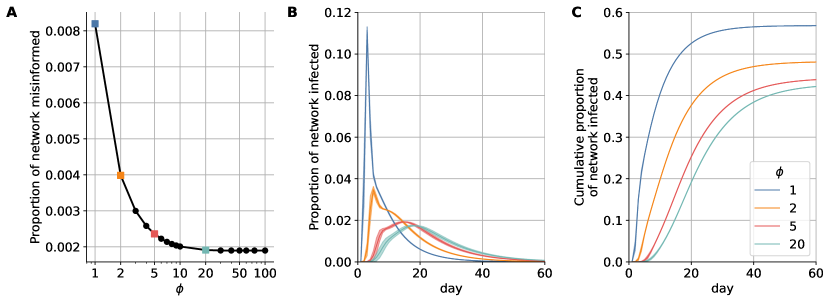
We generate contact networks for different thresholds () to compare the impact of misinformed subpopulations of different sizes. Given a threshold and the corresponding information network, we aim to construct a physical contact network containing empirically calibrated misinformed subpopulations (Fig. 4B). The process begins by selecting a sample of individuals from each county within the information network. As party affiliation has been identified as a risk factor associated with excess mortality during the COVID-19 pandemic25, county samples are constructed to match the percentage of Republicans and Democrats who voted in the 2020 U.S. presidential election. For each county, we add the sampled nodes to the physical network marked as misinformed () or ordinary susceptible (), based on their label within the retweet network. Sampling with replacement allows us to select individuals such that the overall proportions of Republicans and Democrats match the voting records. A 10% sample leads to million nodes. A network based on a much smaller sample is illustrated in Fig. 1B. This process captures empirical measurements of the ideological split, relative population size, and quantity of misinformed individuals in each county. We add contact network edges by leveraging cell phone mobility data that provides the probability of an individual traveling within and between counties. See Methods for details.
Disease-spreading dynamics on a contact network are simulated using an agent-based version of SMIR (Fig. 4C). Two critical parameters affecting these dynamics are the density of the contact network, captured by its average degree , and the transmission probability (note that ). Mitigation measures such as social distancing decrease , while those such as masking and vaccination decrease . A simple way to model the combined effects of misinformation on these behaviors is to set , a high value corresponding to the average number of daily contacts prior to the COVID-19 pandemic28, and explore a wide range of transmission probabilities to capture worst- and best-case scenarios. To this end, we model the refusal of any mitigation measures by selecting the maximum value for misinformed individuals. In contrast, we model the adoption of several mitigation measures by selecting an extremely small value for ordinary individuals. These values illustrate two theoretically extreme scenarios. The former portrays a realistic number of interactions during non-pandemic times, accompanied by high transmission rates due to the absence of preventive measures, such as social distancing, mask-wearing, or vaccinations. The latter demonstrates decreased daily interactions and reduced transmission rates resulting from the implementation of these preventive measures. Using the empirically calibrated contact networks in conjunction with these extreme parameters, the simulation approach allows us to bound the best- and worst-case scenarios in a data-informed manner (see Methods for more information).
The worst-case effect of the misinformed subpopulation size on the daily incidence of infection (illustrated in Fig. 1C-F on a small network) is quantified in Fig. 5B on a large network (10% sample). A heavily misinformed population () corresponds to an additional 9% of the population being infected at peak time (a six-fold increase) compared to a population following expert guidance in the best-case scenario (). The peak also occurs approximately two weeks earlier. The cumulative effect of a heavily misinformed population is also significant, with an additional 14% of the population infected over the course of the epidemic — a 32% relative increase (Fig. 5C). We repeated this analysis for different sample sizes and found that the main results are robust (see Supplementary Information).
Discussion
This work presents large-scale simulations based on an epidemic model that accounts for a subpopulation of misinformed individuals, informed by real-world data. Such an approach answers calls from the literature to anchor models in empirical data6, 47, allowing us to explore realistic potential outcomes. While we know that exposure to online health misinformation is associated with risky behaviors such as vaccine hesitancy and refusal35, our model further links these behaviors by a misinformed population to an accelerated spread of disease.
By deriving the mean-field system of equations for the novel SMIR model and exploring its dynamics, we demonstrate how the risky behaviors of misinformed individuals can adversely impact those following public health guidelines, worsening outcomes for the entire population. Additionally, increasing homophily can benefit the overall population by protecting ordinary citizens; however, it may also lead to higher infection rates within the misinformed subpopulation.
Agent-based simulations of the SMIR model let us study the epidemic on empirically calibrated contact networks, which provide more realistic scenarios compared to the mean-field approach. The model estimates that, in the worst-case scenario, a heavily misinformed population can amplify the peak of the infection by a factor of six and accelerate it by two weeks. This would result in an additional 14% of the population becoming infected — nearly 47 million Americans based on recent U.S. Census data48. The corresponding price tag of vaccine misinformation would be over $143B, using estimated health care costs associated with COVID-19 in the U.S.3.
These results provide an alarming quantitative bound on the harm of exposure to online vaccine misinformation. They should provide public health authorities as well as social media platforms with heightened motivation to curb vaccine misinformation, despite the difficulties posed by social media design11.
We acknowledge certain limitations in our approach. While individual beliefs and behaviors may vary over time, our model simplifies the scenario by dichotomizing individuals into misinformed and ordinary subpopulations and assuming constant transmission rates. We also assume uniform resilience to misinformation for all individuals during the information diffusion process, although this attribute likely differs across individuals. Future directions could involve more sophisticated models to account for these heterogeneities. For instance, cognitive models of misinformation acceptance7 could be incorporated into the simulation with misinformation exposure data collected from social media. Such integration would enable the transition of individuals from ordinary to misinformed susceptible states throughout the simulation, allowing for a simultaneous examination of opinion and disease dynamics. Some theoretical models have already explored similar approaches and obtained results that align with our findings32, 46. Additional extensions of the model could account for a feedback loop whereby witnessing local infections could drive changes in behaviors equivalent to the transition of individuals out of the misinformed population.
Methods
SMIR model.
For both the ordinary and misinformed subpopulations, the Susceptible Misinformed Infected Recovered (SMIR) model replicates the standard SIR compartments, denoted as // and //, respectively. While SMIR adopts distinct transmission parameters for the misinformed and ordinary groups ( and , respectively), the mean-field approach assumes that infected individuals from either group () can potentially infect anyone in the susceptible populations. The mean-field model is governed by the following system of equations:
| (1) |
To account for homophily, we modify the term in Eq. 1 to account for increased (decreased) contacts within (across) groups, according to the parameter . When homophily does not play a role (), there is an equal probability of interacting with either subpopulation’s infected group. We thus obtain:
| (2) |
We initialize the simulation by randomly marking nodes as infected in both the misinformed and ordinary groups, where .
Twitter and derived data.
Twitter posts in the CoVaxxy dataset19 were collected in real time via the stream/filter endpoint of the Twitter Application Programming Interface (API). To capture the online discourse surrounding COVID-19 vaccines in English, a comprehensive set of English-language keywords was carefully curated. Beginning with the initial seeds of “covid” and “vaccine,” a snowball sampling technique20 was used to identify co-occurring relevant keywords in December 202019. The resulting list contained almost 80 keywords, available online18. To confirm the relevance of the collected tweets to the topic of vaccines, we examined the coverage obtained by incrementally adding keywords, starting with the most common ones. Over 90% of the tweets in 2021 contained at least one of the three most common keywords: “vaccine,” “vaccination,” or “vaccinate.” To infer the location of accounts, we used the Carmen Python library21 that leverages self-reported location metadata within user profiles (embedded in tweets). As an account’s location may change over time (captured across multiple tweets), we utilize the most recent location. We geolocate 2,047,800 users residing in all 50 U.S. states, who shared a total of 25,806,856 tweets by mapping self-reported locations to U.S. counties. The information network is constructed from accounts in 341 counties that contain more than 200 Twitter users each. Political alignment is estimated using a third-party list of annotated news sources40, 39. It is averaged across all the sources shared by each account. Nodes with an estimated alignment greater (smaller) than zero are considered Republican (Democrat). We infer the political alignment of some additional accounts, who did not share links to news sources, using a label-propagation algorithm17 on the retweet network. If all of a node’s neighbors have political alignment scores, its score is estimated using the weighted average of its neighbors, with weights based on retweets. The process is iterated until each node without a score has at least one neighbor without a score. Misinformation is defined at the source level. Tweets containing links to articles from a list of low-credibility sources compiled by NewsGuard (score below 60) are labeled as spreading misinformation. This approach is common practice and has been validated in the literature35, 24, 8, 27, 44.
Contact network edges.
To construct edges in our contact network, we utilize SafeGraph cell-phone mobility data50, which contains information on the number of people residing in over 200K Census-Block-Groups (CBG) who visited 4.3M Points-of-Interest (POI) in the United States. This data has been widely employed to study human mobility patterns during the COVID pandemic. We used the average daily number of individuals moving during 2019, as a reference for business-as-usual mobility, and aggregated all CBGs and POIs at the county level. This aggregation results in a county-by-county matrix , where each element represents the average daily number of individuals in county moving to county or vice versa. We then normalized to obtain the average probability of individuals in counties and coming into contact, and multiplied by the total number of edges to obtain the expected number of connections between individuals in counties and : where the sum is over all county pairs and is the total number of edges. Next, we create a physical contact network with nodes by following a procedure akin to a stochastic block model26 used to generate networks with localized communities. For each pair of distinct locations and , we draw edges between random pairs of nodes in and . Additionally, we draw edges among random pairs of individuals within the same location , representing homogeneous mixing within each county. At the end of the process, the network has the target average degree . We use and show how this parameter affects the infections in Supplementary Information.
Simulation details.
Agent-based SMIR simulations are initiated by randomly selecting 100 misinformed nodes and designating them as infected. The disease spreading dynamics are then simulated for 100 steps, which correspond to days. To align with COVID-19 dynamics, we utilize the CDC’s recommended quarantine period of 5 days as our recovery period14 (). Each simulation is repeated ten times, and the average outcome is reported.
Data and code availability.
Code and data are available in a public repository (github.iu.edu/NaN-team/bounding-misinfo-impact-on-disease-spread).
Acknowledgments
We are grateful to Yuan Yuan, Marco Ajelli, Alessio Brina, and Brea Perry for helpful discussions. This work was supported in part by the Swiss National Science Foundation (grant 209250), the National Science Foundation (grants 1927425 and 1927418), the Army Research Office (contract W911NF-21-1-0194), the European Union (NextGenerationEU project PNRR-PE-AI FAIR), the Italian Ministry of Education (PRIN PNRR grant CODE prot. P2022AKRZ9 and PRIN grant DEMON prot. 2022BAXSPY), Knight Foundation, and Craig Newmark Philanthropies.
Ethics
This study, focusing on public data, poses minimal risk to human subjects. Consequently, the Indiana University Institutional Review Board has exempted it from review (protocol number 1102004860). All data collection and analysis adhered to Twitter’s terms of service.
References
- Allen et al. 2023 J. N. L. Allen, D. J. Watts, and D. Rand. Quantifying the Impact of Misinformation and Vaccine-Skeptical Content on Facebook. PsyArXiv, Oct. 2023. URL https://doi.org/10.31234/osf.io/nwsqa.
- Anderson and May 1991 R. M. Anderson and R. M. May. Infectious diseases of humans: dynamics and control. Oxford university press, 1991.
- Bartsch et al. 2020 S. M. Bartsch, M. C. Ferguson, J. A. McKinnell, K. J. O’Shea, P. T. Wedlock, S. S. Siegmund, and B. Y. Lee. The Potential Health Care Costs And Resource Use Associated With COVID-19 In The United States. Health Affairs, 39(6):927–935, 2020. doi: 10.1377/hlthaff.2020.00426. URL https://doi.org/10.1377/hlthaff.2020.00426.
- Bauch and Galvani 2013 C. T. Bauch and A. P. Galvani. Social Factors in Epidemiology. Science, 342(6154):47–49, Oct. 2013. URL https://doi.org/10.1126/science.1244492.
- Bavel et al. 2020 J. J. V. Bavel, K. Baicker, P. S. Boggio, V. Capraro, A. Cichocka, M. Cikara, M. J. Crockett, A. J. Crum, K. M. Douglas, J. N. Druckman, J. Drury, O. Dube, N. Ellemers, E. J. Finkel, J. H. Fowler, M. Gelfand, S. Han, S. A. Haslam, J. Jetten, S. Kitayama, D. Mobbs, L. E. Napper, D. J. Packer, G. Pennycook, E. Peters, R. E. Petty, D. G. Rand, S. D. Reicher, S. Schnall, A. Shariff, L. J. Skitka, S. S. Smith, C. R. Sunstein, N. Tabri, J. A. Tucker, S. v. d. Linden, P. v. Lange, K. A. Weeden, M. J. A. Wohl, J. Zaki, S. R. Zion, and R. Willer. Using social and behavioural science to support COVID-19 pandemic response. Nat Hum Behav, 4:460–471, May 2020. URL https://doi.org/10.1038/s41562-020-0884-z.
- Bedson et al. 2021 J. Bedson, L. A. Skrip, D. Pedi, S. Abramowitz, S. Carter, M. F. Jalloh, S. Funk, N. Gobat, T. Giles-Vernick, G. Chowell, J. R. de Almeida, R. Elessawi, S. V. Scarpino, R. A. Hammond, S. Briand, J. M. Epstein, L. Hébert-Dufresne, and B. M. Althouse. A review and agenda for integrated disease models including social and behavioural factors. Nat Hum Behav, 5:834–846, July 2021. URL https://doi.org/10.1038/s41562-021-01136-2.
- Borukhson et al. 2022 D. Borukhson, P. Lorenz-Spreen, and M. Ragni. When Does an Individual Accept Misinformation? An Extended Investigation Through Cognitive Modeling. Comput Brain Behav, 5(2):244–260, June 2022. URL https://doi.org/10.1007/s42113-022-00136-3.
- Bovet and Makse 2019 A. Bovet and H. A. Makse. Influence of fake news in Twitter during the 2016 US presidential election. Nature communications, 10(1):7, 2019. URL https://doi.org/10.1038/s41467-018-07761-2.
- Brainard and Hunter 2019 J. Brainard and P. R. Hunter. Misinformation making a disease outbreak worse: outcomes compared for influenza, monkeypox, and norovirus. SIMULATION, 96(4):365–374, Nov. 2019. URL https:/doi.org/10.1177/0037549719885021.
- Broniatowski et al. 2018 D. A. Broniatowski, A. M. Jamison, S. Qi, L. AlKulaib, T. Chen, A. Benton, S. C. Quinn, and M. Dredze. Weaponized health communication: Twitter bots and russian trolls amplify the vaccine debate. American Journal of Public Health, 108(10):1378–1384, 2018. doi: 10.2105/AJPH.2018.304567. URL https://doi.org/10.2105/AJPH.2018.304567.
- Broniatowski et al. 2023 D. A. Broniatowski, J. R. Simons, J. Gu, A. M. Jamison, and L. C. Abroms. The efficacy of Facebook’s vaccine misinformation policies and architecture during the COVID-19 pandemic. Science Advances, 9(37):eadh2132, 2023. doi: 10.1126/sciadv.adh2132. URL https://www.science.org/doi/abs/10.1126/sciadv.adh2132.
- Buckee et al. 2021 C. Buckee, A. Noor, and L. Sattenspiel. Thinking clearly about social aspects of infectious disease transmission. Nature, 595:205–213, July 2021. URL https://doi.org/10.1038/s41586-021-03694-x.
- Burki 2019 T. Burki. Vaccine misinformation and social media. The Lancet Digital Health, 1(6):e258–e259, 2019. URL https://doi.org/10.1016/S2589-7500(19)30136-0.
- Centers for Disease Control and Prevention 2023 Centers for Disease Control and Prevention. Isolation and Precautions for People with COVID-19, 2023. URL https://www.cdc.gov/coronavirus/2019-ncov/your-health/isolation.html. Accessed 2023-06-27.
- Centola 2010 D. Centola. The spread of behavior in an online social network experiment. Science, 329(5996):1194–1197, 2010.
- Chan et al. 2021 H.-W. Chan, C. P.-Y. Chiu, S. Zuo, X. Wang, L. Liu, and Y.-y. Hong. Not-so-straightforward links between believing in COVID-19-related conspiracy theories and engaging in disease-preventive behaviours. Humanit Soc Sci Commun, 8(104):1–10, May 2021. URL https://doi.org/10.1057/s41599-021-00781-2.
- Conover et al. 2011 M. Conover, B. Gonçalves, J. Ratkiewicz, A. Flammini, and F. Menczer. Predicting the political alignment of twitter users. In Proceedings of 3rd IEEE Conference on Social Computing (SocialCom), pages 192–199, 2011. doi: 10.1109/PASSAT/SocialCom.2011.34.
- DeVerna et al. 2021a M. R. DeVerna, F. Pierri, B. T. Truong, J. Bollenbacher, D. Axelrod, N. Loynes, C. Torres-Lugo, K.-C. Yang, F. Menczer, and J. Bryden. CoVaxxy Tweet IDs dataset. Zenodo, Feb. 2021a. URL https://doi.org/10.5281/zenodo.7752586.
- DeVerna et al. 2021b M. R. DeVerna, F. Pierri, B. T. Truong, J. Bollenbacher, D. Axelrod, N. Loynes, C. Torres-Lugo, K.-C. Yang, F. Menczer, and J. Bryden. CoVaxxy: A Collection of English-Language Twitter Posts About COVID-19 Vaccines. In Proceedings of the International AAAI Conference on Web and Social Media, volume 15, pages 992–999, 2021b. URL https://doi.org/10.1609/icwsm.v15i1.18122.
- Di Giovanni et al. 2022 M. Di Giovanni, F. Pierri, C. Torres-Lugo, and M. Brambilla. VaccinEU: COVID-19 vaccine conversations on Twitter in French, German and Italian. In Proceedings of the International AAAI Conference on Web and Social Media, volume 16, pages 1236–1244, 2022. URL https://doi.org/10.1609/icwsm.v16i1.19374.
- Dredze et al. 2013 M. Dredze, M. J. Paul, S. Bergsma, and H. Tran. Carmen: A twitter geolocation system with applications to public health. In Proc. AAAI Workshop on Expanding the Boundaries of Health Informatics Using AI (HIAI), volume 23, page 45, 2013.
- Gallotti et al. 2020 R. Gallotti, F. Valle, N. Castaldo, P. Sacco, and M. De Domenico. Assessing the risks of ‘infodemics’ in response to COVID-19 epidemics. Nature Human Behaviour, 4(12):1285–1293, 2020. doi: 10.1038/s41562-020-00994-6. URL https://doi.org/10.1038/s41562-020-00994-6.
- Granovetter 1978 M. Granovetter. Threshold Models of Collective Behavior. American Journal of Sociology, May 1978. URL https://doi.org/10.1086/226707.
- Grinberg et al. 2019 N. Grinberg, K. Joseph, L. Friedland, B. Swire-Thompson, and D. Lazer. Fake news on Twitter during the 2016 US presidential election. Science, 363(6425):374–378, 2019. URL https://doi.org/10.1126/science.aau2706.
- Jacob Wallace 2023 P. Jacob Wallace. Excess Death Rates for Republican and Democratic Registered Voters in Florida and Ohio During the COVID-19. JAMA Intern Med, July 2023. URL https://jamanetwork.com/article.aspx?doi=10.1001/jamainternmed.2023.1154.
- Karrer and Newman 2011 B. Karrer and M. E. Newman. Stochastic blockmodels and community structure in networks. Physical Review E, 83(1):016107, 2011. URL https://doi.org/10.1103/PhysRevE.83.016107.
- Lazer et al. 2018 D. M. Lazer, M. A. Baum, Y. Benkler, A. J. Berinsky, K. M. Greenhill, F. Menczer, M. J. Metzger, B. Nyhan, G. Pennycook, D. Rothschild, et al. The science of fake news. Science, 359(6380):1094–1096, 2018. URL https://doi.org/10.1126/science.aao2998.
- Liu et al. 2021 C. Y. Liu, J. Berlin, M. C. Kiti, E. Del Fava, A. Grow, E. Zagheni, A. Melegaro, S. M. Jenness, S. B. Omer, B. Lopman, and K. Nelson. Rapid Review of Social Contact Patterns During the COVID-19 Pandemic. Epidemiology, 32(6), 2021. doi: 10.1097/EDE.0000000000001412. URL https://doi.org/10.1097/EDE.0000000000001412.
- Loomba et al. 2021 S. Loomba, A. de Figueiredo, S. J. Piatek, K. de Graaf, and H. J. Larson. Measuring the impact of COVID-19 vaccine misinformation on vaccination intent in the UK and USA. Nature Human Behavior, 2021. URL https://doi.org/10.1038/s41562-021-01056-1.
- Mitze et al. 2020 T. Mitze, R. Kosfeld, J. Rode, and K. Wälde. Face masks considerably reduce COVID-19 cases in Germany. Proc Natl Acad Sci U.S.A, 117(51):32293–32301, Dec. 2020. doi: 10.1073/pnas.2015954117. URL https://doi.org/10.1073/pnas.2015954117.
- Mønsted et al. 2017 B. Mønsted, P. Sapieżyński, E. Ferrara, and S. Lehmann. Evidence of complex contagion of information in social media: An experiment using Twitter bots. PLoS ONE, 12(9):e0184148, 2017.
- Mumtaz et al. 2022 N. Mumtaz, C. Green, and J. Duggan. Exploring the Effect of Misinformation on Infectious Disease Transmission. Systems, 10(2):50, Apr. 2022. URL https:/doi.org/10.3390/systems10020050.
- Nematzadeh et al. 2014 A. Nematzadeh, E. Ferrara, A. Flammini, and Y.-Y. Ahn. Optimal network modularity for information diffusion. Phys. Rev. Lett., 113:088701, 2014. doi: 10.1103/PhysRevLett.113.088701. URL https://doi.org/10.1103/PhysRevLett.113.088701.
- Odabaş 2022 M. Odabaş. 5 facts about Twitter ‘lurkers’. Pew Research Center, 2022. URL https://www.pewresearch.org/fact-tank/2022/03/16/5-facts-about-twitter-lurkers.
- Pierri et al. 2022 F. Pierri, B. L. Perry, M. R. DeVerna, K.-C. Yang, A. Flammini, F. Menczer, and J. Bryden. Online misinformation is linked to early COVID-19 vaccination hesitancy and refusal. Sci Rep, 12(5966):1–7, 2022. URL https://doi.org/10.1038/s41598-022-10070-w.
- Poletti et al. 2011 P. Poletti, M. Ajelli, and S. Merler. The effect of risk perception on the 2009 H1N1 pandemic influenza dynamics. PLOS One, 6(2):e16460, 2011. URL https://doi.org/10.1371/journal.pone.0016460.
- Prandi and Primiero 2020 L. Prandi and G. Primiero. Effects of misinformation diffusion during a pandemic. Appl Network Sci, 5(1):1–20, Dec. 2020. URL https:/doi.org/10.1007/s41109-020-00327-6.
- Rathje et al. 2022 S. Rathje, J. K. He, J. Roozenbeek, J. J. Van Bavel, and S. van der Linden. Social media behavior is associated with vaccine hesitancy. PNAS Nexus, 1(4), 2022. URL https://doi.org/10.1093/pnasnexus/pgac207.
- Robertson 2018 R. Robertson. Partisan Bias Scores for Web Domains. Harvard Dataverse, 2018. URL https://doi.org/10.7910/DVN/QAN5VX.
- Robertson et al. 2023 R. E. Robertson, S. Jiang, K. Joseph, L. Friedland, D. Lazer, and C. Wilson. Auditing Partisan Audience Bias within Google Search. Proc ACM Hum.-Comput Interact, 2(CSCW):1–22, 2023. URL https://doi.org/10.1145/3274417.
- Roozenbeek et al. 2020 J. Roozenbeek, C. R. Schneider, S. Dryhurst, J. Kerr, A. L. J. Freeman, G. Recchia, A. M. van der Bles, and S. van der Linden. Susceptibility to misinformation about COVID-19 around the world. R Soc Open Sci, 7(10):201199, Oct. 2020. URL https://doi.org/10.1098/rsos.201199.
- Rostila 2010 M. Rostila. Birds of a feather flock together — and fall ill? Migrant homophily and health in Sweden. Sociol Health Illn, 32(3):382–399, Mar. 2010. URL https://doi.org/10.1111/j.1467-9566.2009.01196.x.
- Salathé and Khandelwal 2011 M. Salathé and S. Khandelwal. Assessing Vaccination Sentiments with Online Social Media: Implications for Infectious Disease Dynamics and Control. PLoS Comput Biol, 7(10):e1002199, Oct. 2011. doi: https://doi.org/10.1371/journal.pcbi.1002199.
- Shao et al. 2018 C. Shao, G. L. Ciampaglia, O. Varol, K.-C. Yang, A. Flammini, and F. Menczer. The spread of low-credibility content by social bots. Nature communications, 9(1):1–9, 2018. URL https://doi.org/10.1038/s41467-018-06930-7.
- Smith and Christakis 2008 K. P. Smith and N. A. Christakis. Social networks and health. Annu. Rev. Sociol, 34:405–429, 2008. URL https://doi.org/10.1146/annurev.soc.34.040507.134601.
- Sontag et al. 2022 A. Sontag, T. Rogers, and C. A. Yates. Misinformation can prevent the suppression of epidemics. J R Soc Interface, 19(188):20210668, Mar. 2022. URL https://doi.org/10.1098/rsif.2021.0668.
- Sooknanan and Comissiong 2020 J. Sooknanan and D. M. G. Comissiong. Trending on Social Media: Integrating Social Media into Infectious Disease Dynamics. Bull Math Biol, 82(7):1–11, July 2020. URL https://doi.org/10.1007/s11538-020-00757-4.
- United States Census Bureau 2023 United States Census Bureau. Population Clock, Nov. 2023. URL https://www.census.gov/popclock. [Online; accessed 6. Nov. 2023].
- Weng et al. 2013 L. Weng, F. Menczer, and Y.-Y. Ahn. Virality prediction and community structure in social networks. Sci. Rep., 3(2522), 2013. doi: 10.1038/srep02522. URL http://dx.doi.org/10.1038/srep02522.
- Yuan et al. 2023 Y. Yuan, E. Jahani, S. Zhao, Y.-Y. Ahn, and A. S. Pentland. Implications of COVID-19 vaccination heterogeneity in mobility networks. Communications Physics, 6(1):206, 2023.
Supplementary information
Appendix 1 Mean-field SMIR model
Let us denote the proportions of misinformed and ordinary individuals as and , respectively. A proportion of the population is initially infected, split evenly between the ordinary and misinformed groups. Thus, during the initial state, we have initial values for each compartment: , , , , and .
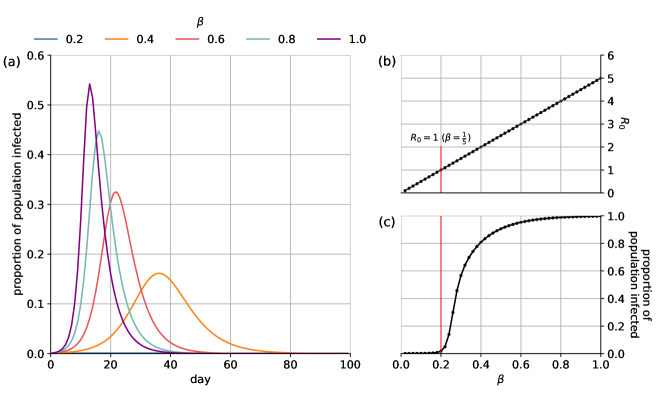
To identify a suitable base value for the transmission rate among ordinary susceptibles, we begin by exploring the scenario with no misinformed individuals (), setting and varying the transmission parameter in the range . As is typical of SIR dynamics, Fig. S1 shows that lower values delay and lower the infection peak — the so-called “flattening of the curve.” Lower also decreases the total proportion of the population that becomes infected at any point during the epidemic, while higher values increase this proportion. These dynamics are tied to the basic reproduction number : the disease spreading dynamics only reach epidemic levels when , such that an infected individual infects more than one other person on average. This happens when . As increases, the infection spreads more quickly, the peak infection day occurs sooner, and the proportion of the population that is ultimately infected increases.
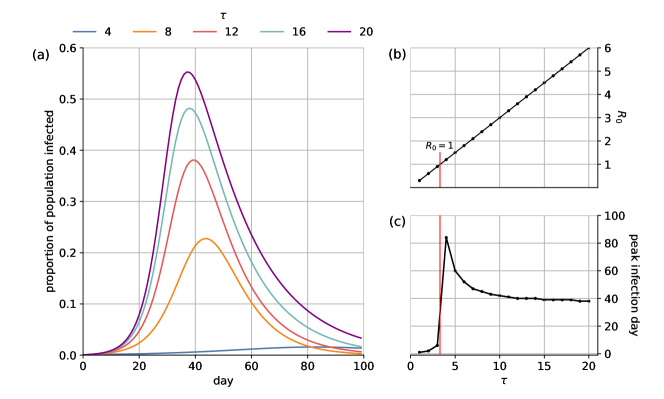
We now explore the effect of the recovery rate, again in the scenario with no misinformation or homophily, by setting and varying the recovery period between 1 and 20 days. Fig. S2 shows that when , and the disease does not reach epidemic proportions. At this level, the epidemic takes a long time to reach its peak (80 days). Increasing means that individuals remain infected longer, so the population gets infected faster and the peak infection is reached more rapidly. We set () in the main text to align with quarantine recommendations from the CDC14. With this value and , the dynamics are at epidemic levels ().
Appendix 2 Robustness analyses
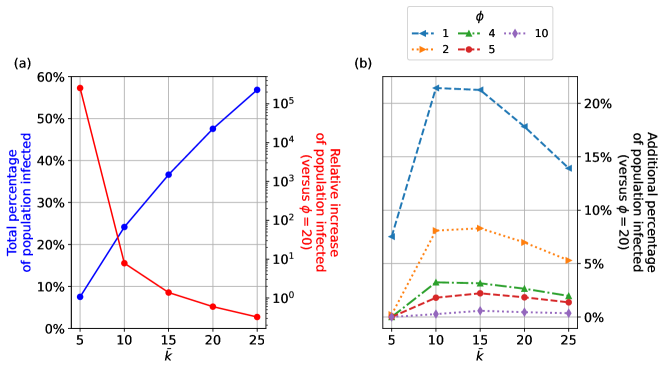
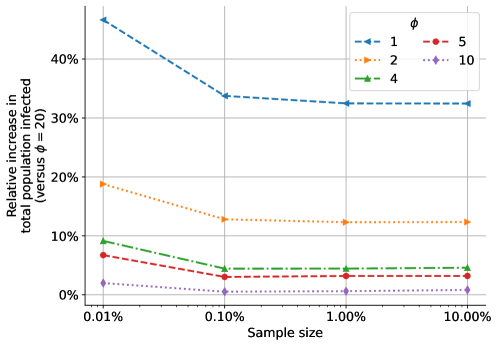
To test the robustness of the main results (Fig. 5C) with respect to the sample size used to construct the contact network, all simulations were rerun after generating contact networks based on the different sampling percentages between 0.01% and 10%. Fig. S3 shows the relative increase in the percentage of the population that becomes infected as a function of the linear threshold , using the best-case scenario in which the fewest nodes in the network are misinformed as the baseline. We observe a substantial decrease in the effect of misinformation as the sampling size grows to 1%. However, sample sizes above 1% return nearly identical results. We conclude that using a sample size of 10% (as reported in the main text) is sufficient to rule out any size-induced bias.
We also investigate the impact of the contact network density () on infection dynamics, as illustrated in Fig. S4 for . We consider this range because represents pre-pandemic daily social contacts while represents COVID-19 lockdown conditions28. As expected, Fig. S4(a) demonstrates that higher leads to increased infections through the population, since the higher contact density provides more opportunities for transmission. But while a larger percentage of the overall population is infected, the relative effect of misinformed individuals decreases. This is because, at higher values, the infected population is already substantial even in the low-misinformation () baseline. The combined effect of these two opposing trends, as shown in Fig. S4(b), is that the additional percentage of infected individuals relative to the scenario reaches a maximum for some intermediate . Fig. S4(b) also shows that, consistent with our primary findings, larger (misinformed resilience) results in a smaller infected population. In our main analysis we focus on and model an effective reduction of contacts, resulting for example from social distancing or lockdowns, by decreasing the parameter.