A Survey for Radio Emission from White Dwarfs in the VLA Sky Survey
Abstract
Radio emission has been detected from tens of white dwarfs, in particular in accreting systems. Additionally, radio emission has been predicted as a possible outcome of a planetary system around a white dwarf. We searched for 3 GHz radio continuum emission in 846,000 candidate white dwarfs previously identified in Gaia using the Very Large Array Sky Survey (VLASS) Epoch 1 Quick Look Catalogue. We identified 13 candidate white dwarfs with a counterpart in VLASS within 2". Five of those were found not to be white dwarfs in follow-up or archival spectroscopy, whereas seven others were found to be chance alignments with a background source in higher-resolution optical or radio images. The remaining source, WDJ204259.71+152108.06, is found to be a white dwarf and M-dwarf binary with an orbital period of 4.1 days and long-term stochastic optical variability, as well as luminous radio and X-ray emission. For this binary, we find no direct evidence of a background contaminant, and a chance alignment probability of only per cent. However, other evidence points to the possibility of an unfortunate chance alignment with a background radio and X-ray emitting quasar, including an unusually poor Gaia DR3 astrometric solution for this source. With at most one possible radio emitting white dwarf found, we conclude that strong ( mJy) radio emission from white dwarfs in the 3 GHz band is virtually nonexistent outside of interacting binaries.
keywords:
white dwarfs – radio continuum: general1 Introduction
White dwarf stars are the most common remnant of stellar evolution, with over two billion of them predicted to exist in our Galaxy (Nelemans et al., 2001). Thanks to the precise data from the Gaia data release 3, around 1.3 million white dwarf candidates have been identified (Gentile Fusillo et al., 2021), 359,000 with high confidence. The abundance of white dwarfs compared to other stellar fossils stems from the fact that all stars with masses below 7–10.6 M⊙ become white dwarfs (Woosley & Heger, 2015; Lauffer et al., 2018) and, due to the steepness of the initial-mass function (e.g. Kroupa, 2001; Padoan & Nordlund, 2002), that corresponds to the vast majority of stars (%). This makes them excellent laboratories for studying stellar evolution.
Around a quarter of white dwarfs are found in binary systems (Toonen et al., 2017), and a fraction of those are observed to be accreting from cool main sequence companions. These accreting white dwarfs are called cataclysmic variables (CVs, see Warner, 1995, for a thorough review). Cataclysmic variables are classified into different types depending on the observed properties of their light curves, as well as on the strength of the white dwarf’s magnetic field. For weak or absent magnetic fields ( MG), the mass transferred from the companion will form an accretion disk. Instabilities in this disk can lead to changes in the mass transfer rate, leading to strong outbursts during which the observed optical magnitude can increase by two orders of magnitude on timescales of weeks to decades. Systems that exhibit this are called dwarf-novae. Systems with high mass transfer rates where outbursts are not observed are called nova-likes (e.g. Dubus et al., 2018). For some CVs, brightness changes of over six magnitudes are observed, which are attributed to a thermonuclear explosion on the surface of the white dwarf; these are called classical novae. When the white dwarf’s magnetic field is strong, the accretion disk will be either fully suppressed (polars, MG), or truncated at the white dwarf magnetosphere (intermediate polars, or IPs, MG), and accretion will follow the magnetic field lines and occur at the magnetic pole.
Radio emission is commonly observed in CVs, in particular for magnetic systems (e.g., Barrett et al., 2020), but has also been reported for non-magnetic systems (Coppejans et al., 2015, 2016; Ridder et al., 2023). In contrast, radio emission in the absence of accretion seems to be a rare feature of white dwarfs and has only been detected in two types of systems: magnetic propellers and binary white dwarf pulsars. In both cases, the white dwarf has a relatively close binary companion but no transferred material reaches the white dwarf surface. Only two systems of each kind are known. In the magnetic propellers—AE Aquarii (AE Aqr; Patterson, 1979; Bookbinder & Lamb, 1987) and LAMOST J024048.51+195226.9 (J0240+1952; Thorstensen, 2020; Pretorius et al., 2021; Pelisoli et al., 2022)—mass is being transferred towards the white dwarf from the companion, but the material is then flung out by the white dwarf’s magnetic field in synchrotron-emitting blobs (Bastian et al., 1988; Meintjes & Venter, 2005). In the binary white dwarf pulsars—AR Scorpii (Marsh et al., 2016) and J191213.72441045.1 (J19124410; Pelisoli et al., 2023; Schwope et al., 2023)—both the spectral features and the observed light curves suggest an absence of steady accretion. The proposed explanation is that these systems are experiencing a detached phase due to transfer of angular momentum from the white dwarf spin onto the orbit (Schreiber et al., 2021). For binary white dwarf pulsars, we observe pulsed radio emission that varies over the spin period of the white dwarf as the white dwarf receives an injection of electrons when its magnetic field sweeps past the companion. Different locations for the exact origin of the emission have been proposed, including the magnetosphere (Takata et al., 2017; Potter & Buckley, 2018), the white dwarf surface (du Plessis et al., 2022), and the surface or coronal loops of the M-dwarf companion (Katz, 2017). For J19124410, the radio pulses are remarkably narrow, in contrast with the broad pulses observed for AR Sco, and resemble neutron star pulsar features, suggesting that beamed synchrotron emission is perhaps being observed directly from the white dwarf magnetic pole.
The observed behaviour of these radio-emitting white dwarfs, and in particular of J19124410, raises the question of whether rapidly spinning magnetic white dwarfs could produce pulsar-like radio emission, driven by the spin-down of the magnetic dipole (e.g. Harayama et al., 2013). Another possibility for producing radio emission from white dwarfs is with orbiting planets: planets may induce a current, driven by the white dwarf magnetic field and producing electron-cyclotron maser emission, in analogy with the Jupiter–Io interaction (Li et al., 1998; Willes & Wu, 2004, 2005). This list of possible mechanisms for producing radio emission from white dwarf is not necessarily comprehensive, and there could be others not yet proposed or considered.
With these possibilities in mind, in this work we searched for radio counterparts to the white dwarf candidates catalogued by Gentile Fusillo et al. (2021) in the Very Large Array Sky Survey (VLASS) Epoch 1 Quick Look Catalogue (Gordon et al., 2020, 2021). We inspected images of each matched source to exclude chance alignments with background sources. Follow-up optical observations for sources where the radio emission matched the position of the white dwarf were carried out primarily with the Goodman Spectrograph (Clemens et al., 2004) on the 4.1 m Southern Astrophysical Research (SOAR) telescope, and with the fast photometers ULTRACAM (Dhillon et al., 2007), mounted at the 3.5-m ESO New Technology Telescope (NTT), and ULTRASPEC (Dhillon et al., 2014) at the 2.4-m Thai National Telescope (TNT).
2 Gaia DR3 White Dwarf Candidates in the VLASS Quick-Look Catalog
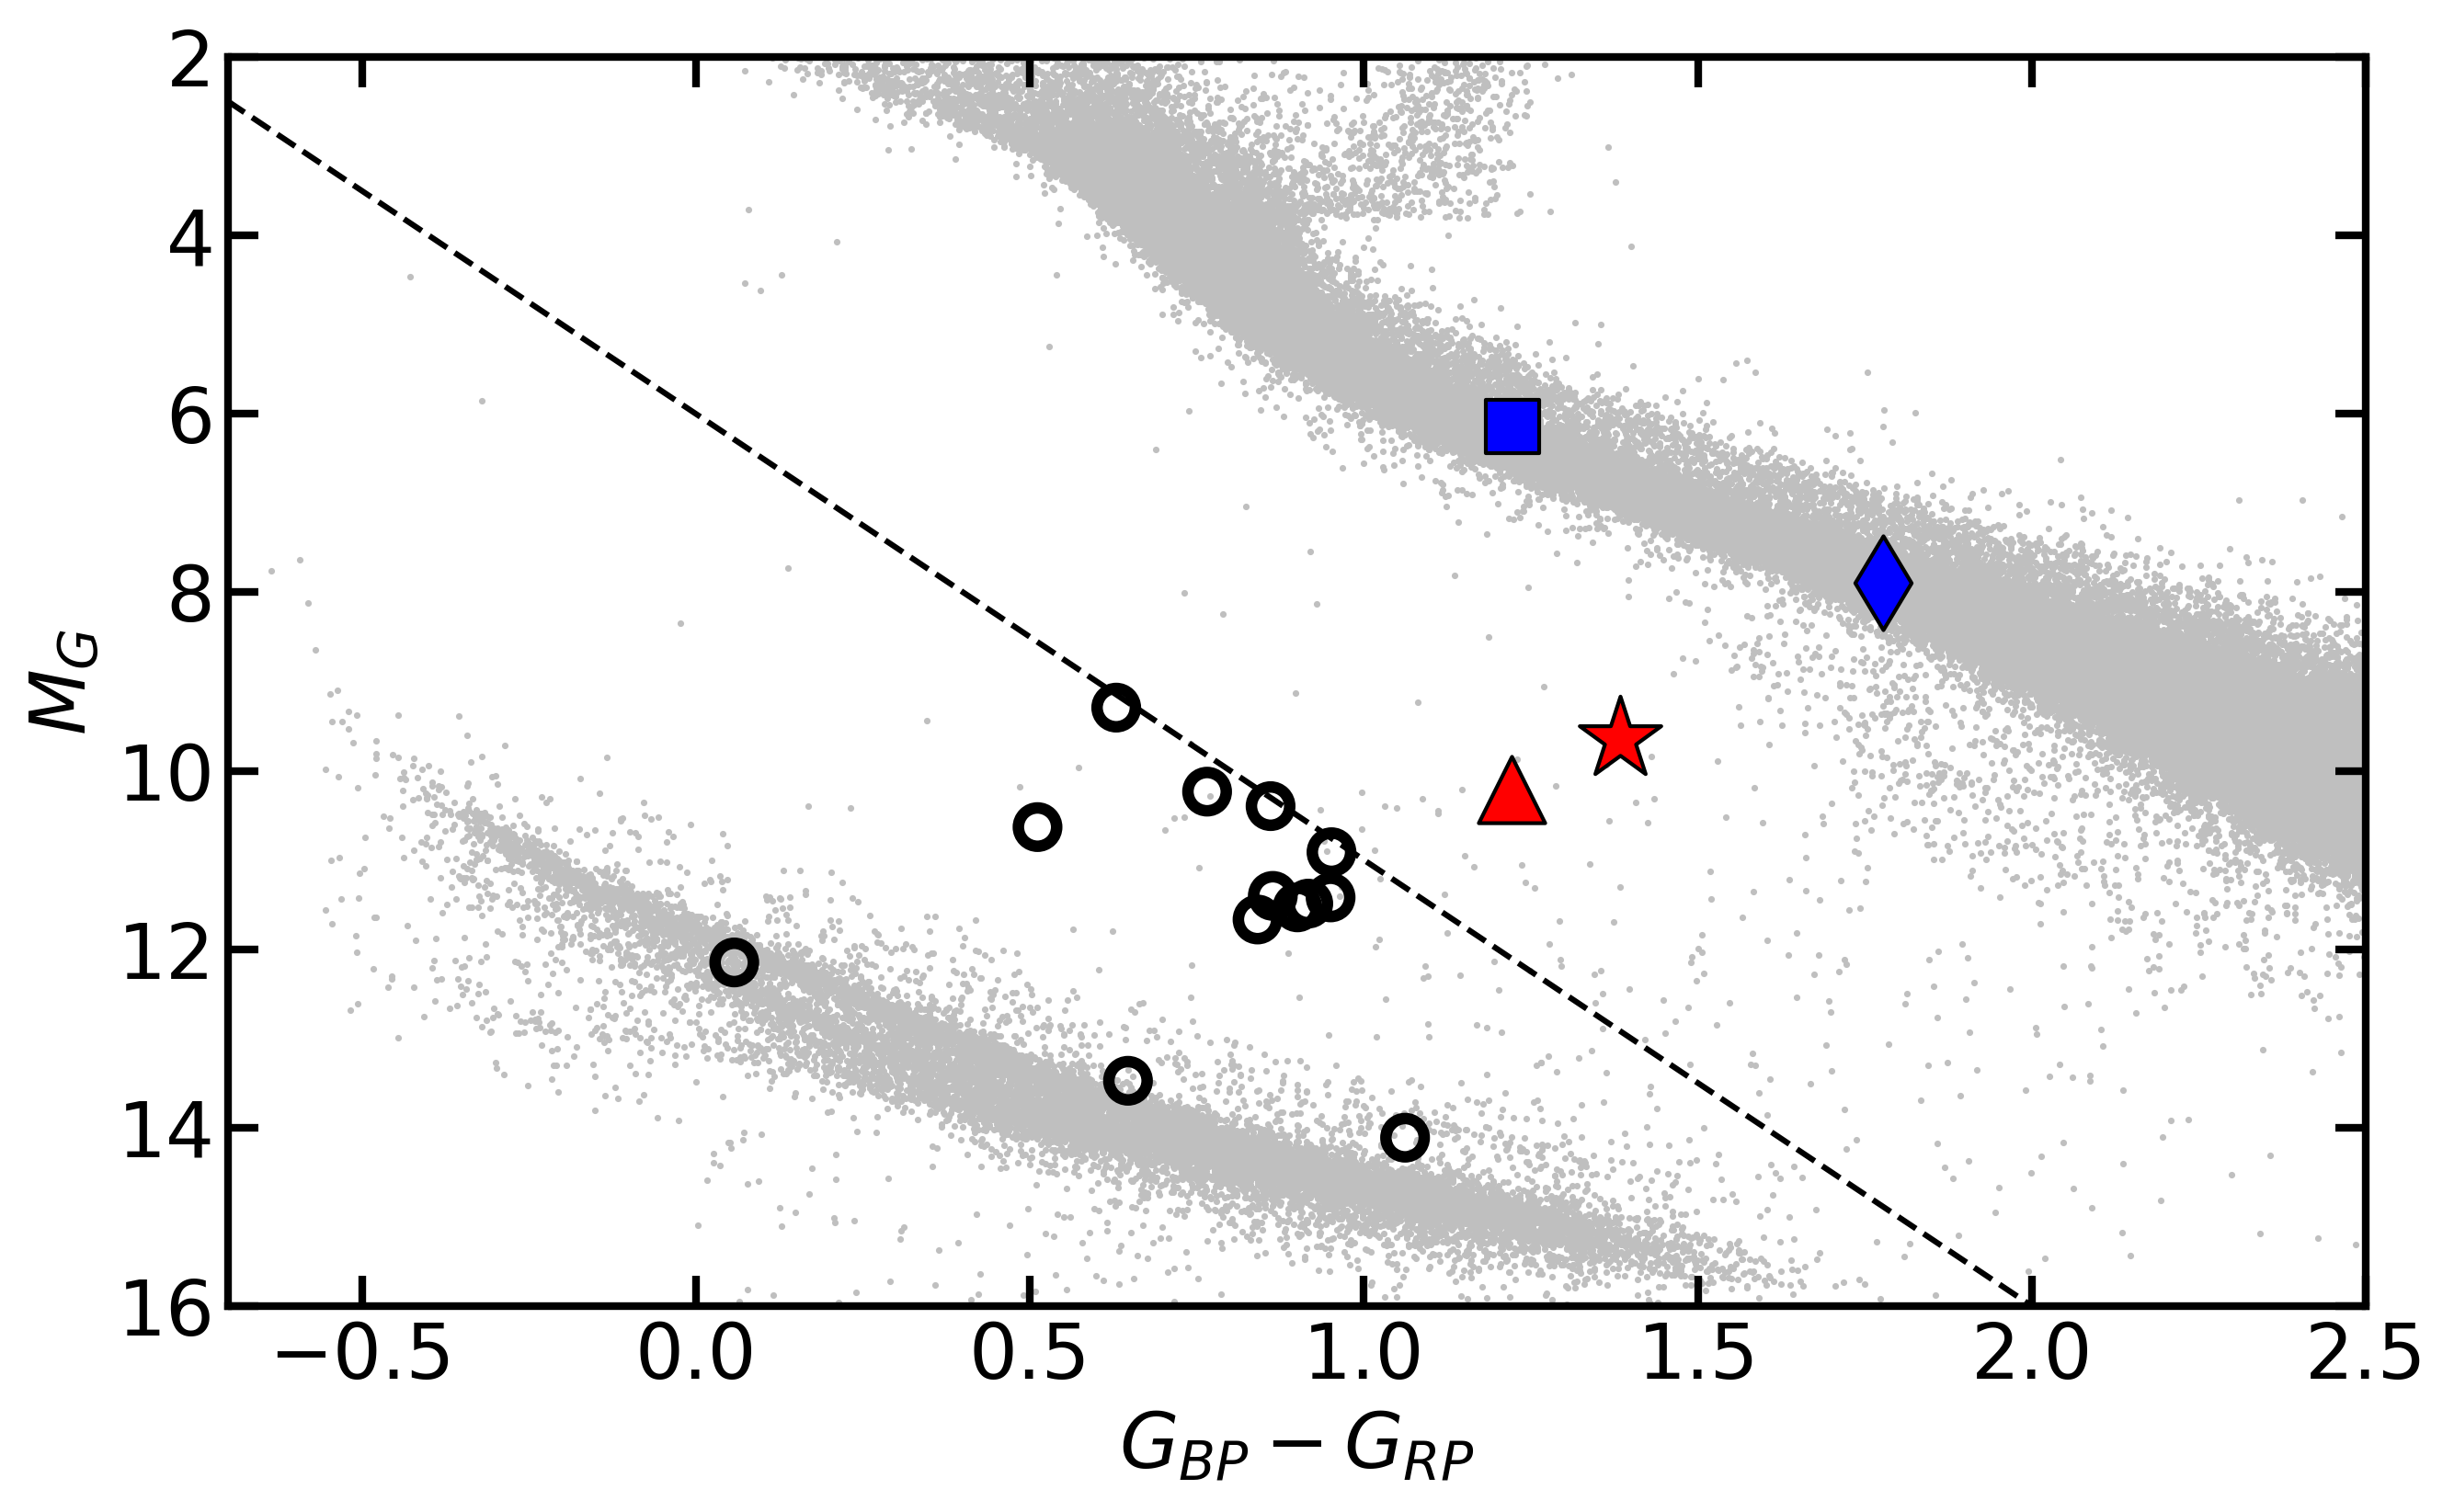
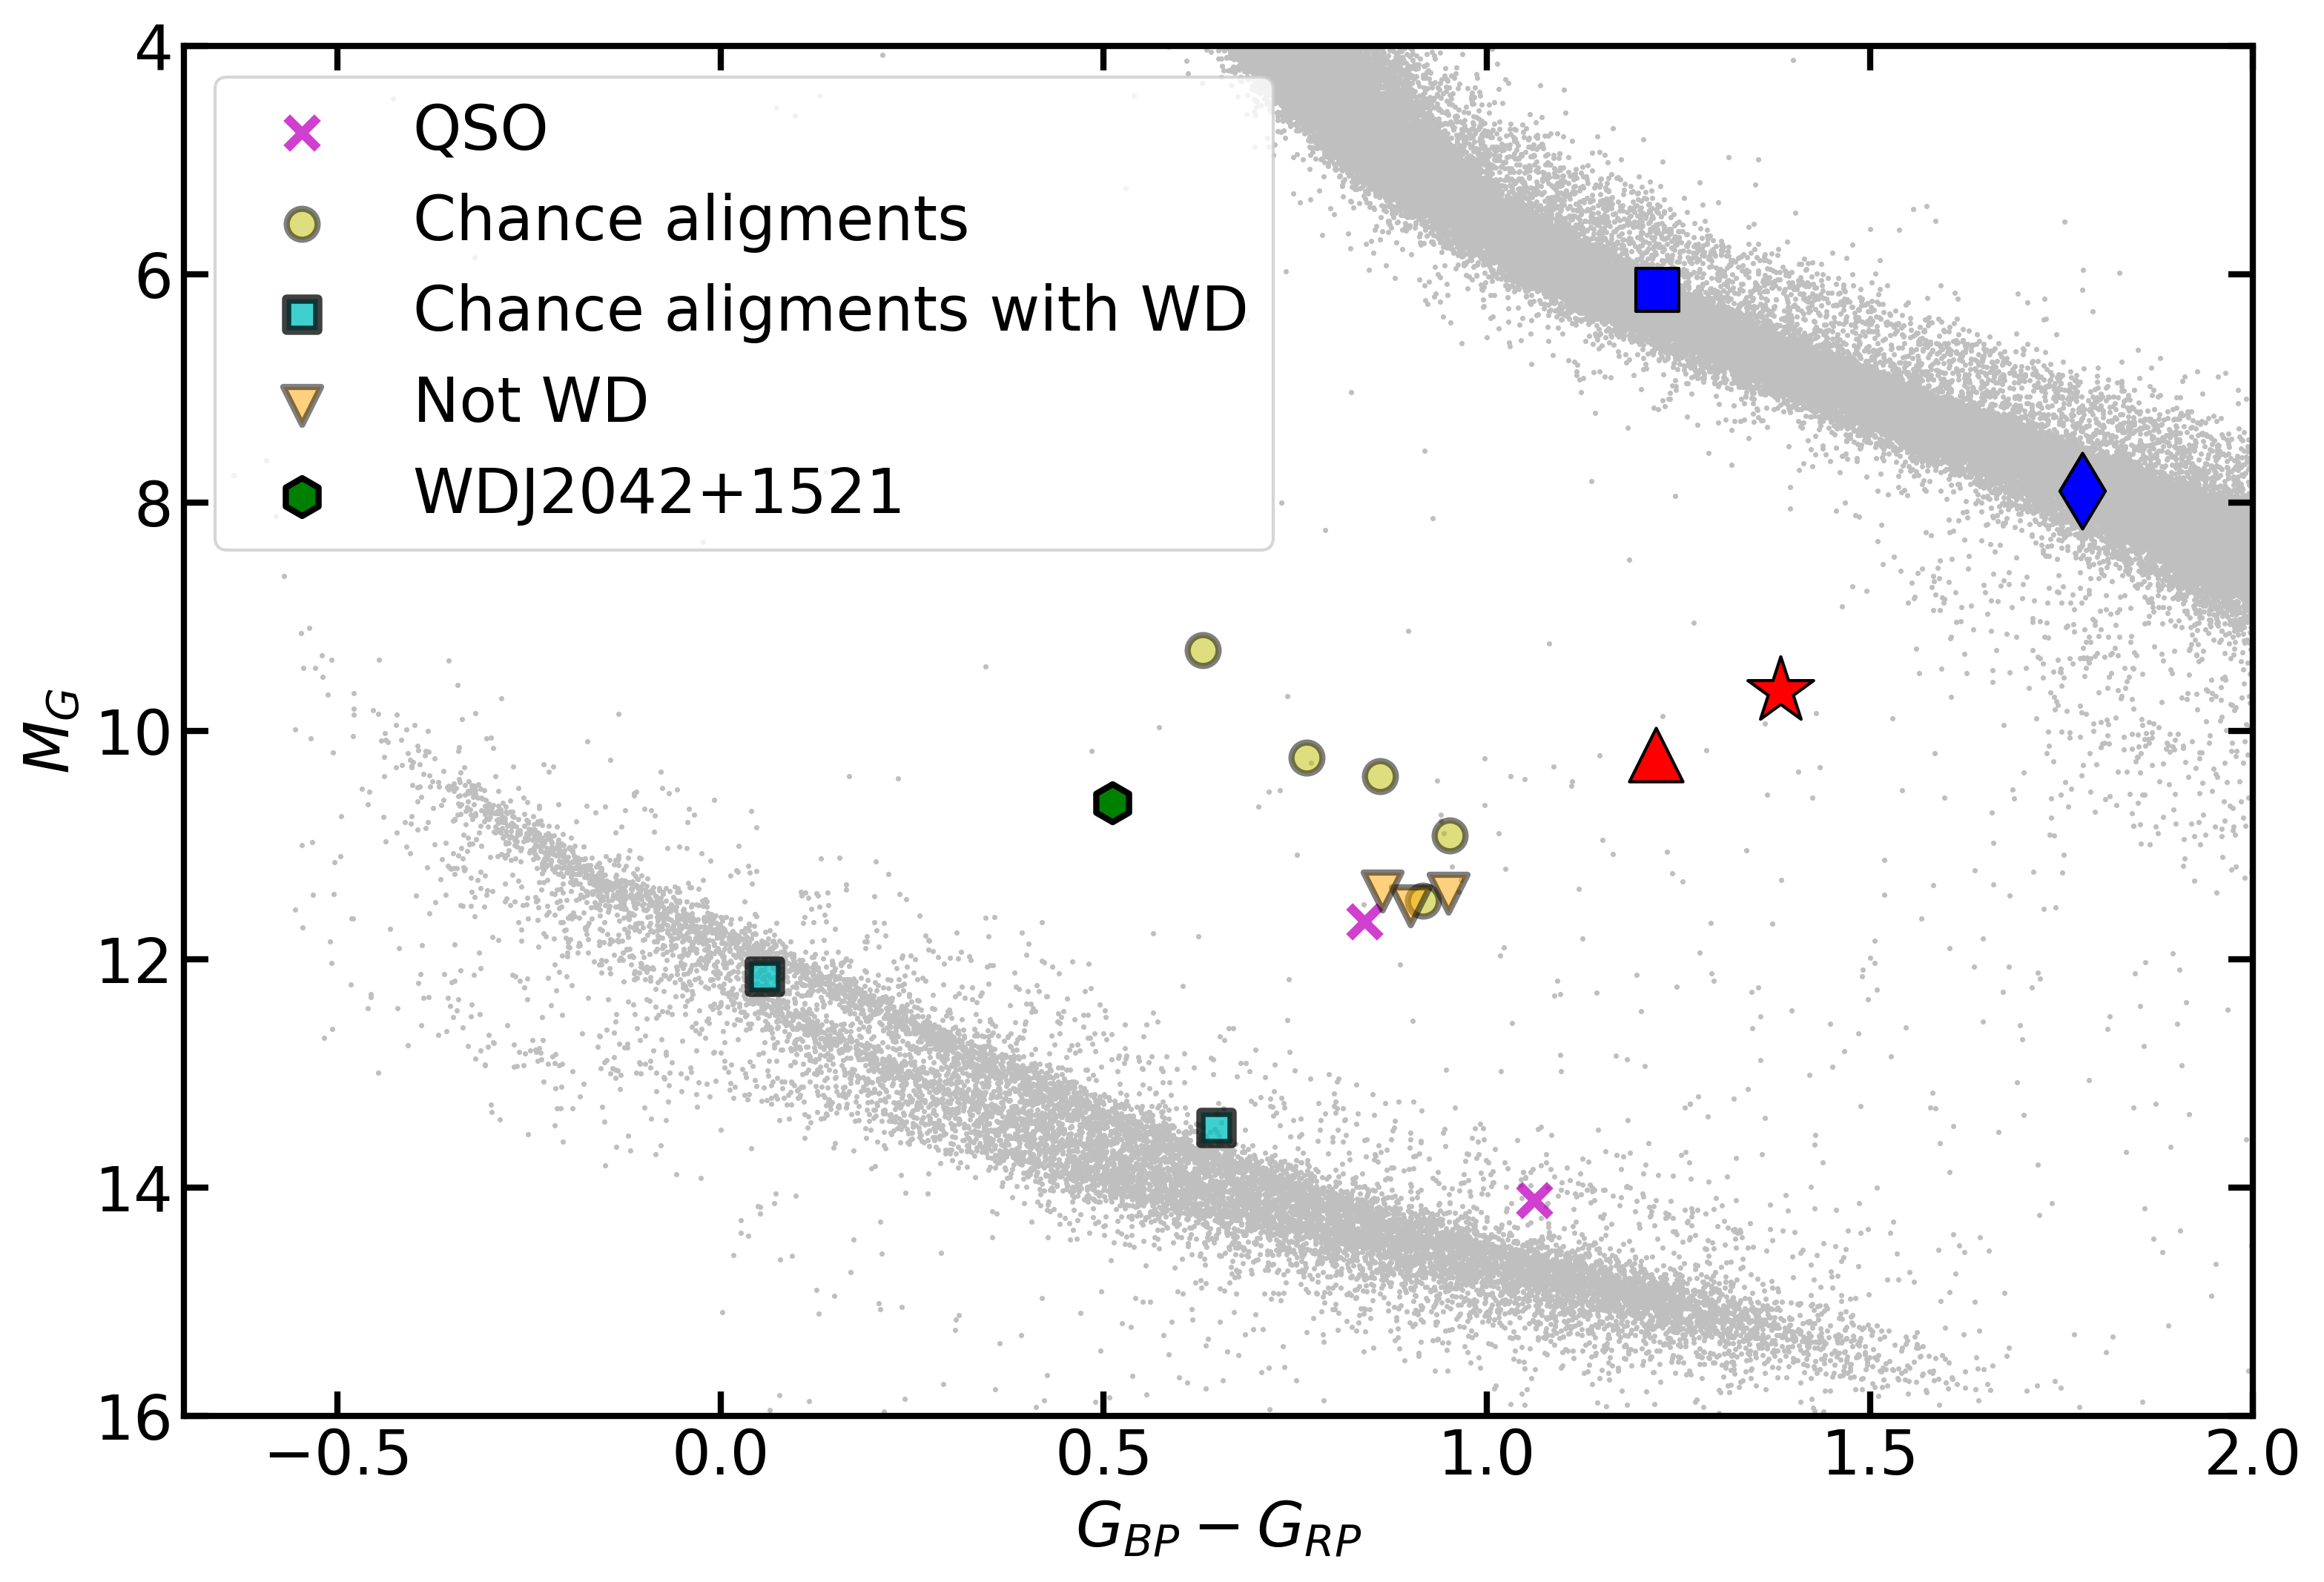
We searched for radio counterparts to 846,000 white dwarf candidates catalogued by Gentile Fusillo et al. (2021) that are in the VLASS footprint. These candidates were selected using colour-magnitude and quality control cuts on the Gaia eDR3 data and assigned a white dwarf probability based on their location in the Gaia colour-magnitude diagram. We cross-compared this Gaia white dwarf catalogue with the VLASS Epoch 1 Quick Look Catalogue (Gordon et al., 2020, 2021), which contains 625,000 unique sources and is complete down to 3 GHz flux densities 3 mJy. We used J2000 coordinates and initially used a generous search radius of 2′′, which is significantly larger than the typical astrometric uncertainty of VLASS sources (; VLASS Project Memo #13111https://library.nrao.edu/public/memos/vla/vlass/VLASS_013.pdf). This resulted in 13 matches, listed in Table 1, whose locations in the Gaia colour-magnitude diagram are shown in Figure 1. Note that the selection of Gentile Fusillo et al. (2021), which is tailored for single white dwarfs, excludes some known radio emitters such as the magnetic propellers and binary white dwarf pulsars.
To investigate the radio variability of these white dwarf–VLASS matches, we downloaded Quick Look images for VLASS Epoch 1 (observed during 2017–2019) and Epoch 2 (2020–2022) from the CIRADA Image Cutout Web Service222http://cutouts.cirada.ca/. Flux densities were measured for the VLASS images by fitting a Gaussian (fixed to the width of the synthesized beam, as expected for a point source) to the radio sources. Some sources looked like they could be extended in the VLASS images, but in all cases the extension was mild/marginal and therefore it was not used as a criterion for exclusion as a possible white dwarf source. It is worth noting that flux density values in the Quick Look images have been found to be systematically low by on average per cent (Gordon et al., 2021). Additionally, substantial scatter ( per cent) was found in the ratio of flux densities measured by VLASS and pointed observations of calibrator targets (Lacy et al., 2019). Reported fluxes should therefore be interpreted with caution. The uncertainties that we quote here are statistical only and reflect the noise levels of the VLASS images, but these systematic uncertainties borne of issues with calibration will also affect the flux densities.
| Name | Flux Density in VLASS [mJy] | Background | Separation | |||
|---|---|---|---|---|---|---|
| [mag] | Epoch 1 | Epoch 2 | contamination | [′′] | ||
| WDJ032623.40-243623.72 | 0.21 | 20.6860.007 | 1.380.12 | 1.750.13 | yes | 1.65 |
| J083802.17+145802.98 | 0.24 | 20.6510.010 | 3.150.12 | 2.880.16 | no | 0.50 |
| J105211.93-335559.93 | 0.11 | 19.6640.006 | 12.020.16 | 12.640.12 | no | 0.87 |
| J105223.24+313012.81 | 0.84 | 20.5640.012 | 1.220.12a | 0.840.12a | no | 0.40 |
| J120358.90-001241.07 | 0.19 | 20.4850.008 | 1.090.14 | 1.030.15 | no | 1.93 |
| WDJ121604.90-281909.67 | 1.00 | 18.784 0.003 | 2.230.12 | 2.290.14 | no | 0.84 |
| J124520.10-351755.53 | 0.24 | 20.6560.008 | 3.700.13a | 3.320.14a | no | 0.19 |
| WDJ132423.32-255746.37 | 0.044 | 20.1830.006 | 1.970.12 | 1.840.14 | yes | 1.85 |
| WDJ182050.14+110832.09 | 0.97 | 20.0440.007 | 12.04 0.15 | 16.840.13 | no | 0.89 |
| WDJ182112.17+204801.17 | 0.06 | 20.4190.005 | 37.270.15a | 27.630.13a | yes | 1.71 |
| WDJ183758.54-330258.93 | 0.07 | 19.8370.007 | 5.21 0.12 | 4.71 0.14 | yes | 1.58 |
| WDJ185250.55-310839.29 | 0.038 | 19.7660.006 | 5.50 0.14 | 5.18 0.15 | yes | 1.35 |
| WDJ204259.71+152108.06 | 0.12 | 16.8770.004 | 10.36 0.12 | 11.90 0.18 | no | 0.40 |
aThis radio source appears mildly extended in the VLASS images, so this flux density (which assumes a point source) is a lower limit on the flux.
2.1 Candidate vetting
To further assess the validity of the white dwarf–VLASS matches, we compared the VLASS Quick Look images with deep optical images obtained by Dark Energy Camera (DECam) and Panoramic Survey Telescope and Rapid Response System (Pan-STARRS, Chambers et al., 2016). The DECam images, primarily processed as part of the DECam Local Volume Exploration survey (DELVE, Drlica-Wagner et al., 2021a), were downloaded from the NOIRLab Astro Data Lab333https://datalab.noirlab.edu/sia.php. The images’ world coordinate systems were matched to Gaia DR2 with 22 mas accuracy (Drlica-Wagner et al., 2021b). The Pan-STARRS images were placed on the Gaia DR1 reference frame with astrometric uncertainty of 6 mas (Magnier et al., 2020).
The comparison of the VLASS images with these deep optical images revealed that, for five matches, the radio position was more consistent with a nearby interloper (likely background galaxies). For all of those, the separation between the Gaia and VLASS coordinates was more than (see the non-bold-faced rows in Table 1). Only one of the sources with separation of more than showed no obvious background contamination. We further consider this source, and the others with separations, in the next sub-section.
2.2 Spectroscopic characterisation
The candidate vetting left eight candidate white dwarfs with matching radio sources. Considering that most of those were assigned low in Gentile Fusillo et al. (2021) (Table 1), the next step in our analysis was to obtain spectra to confirm the white dwarf nature of these candidates.
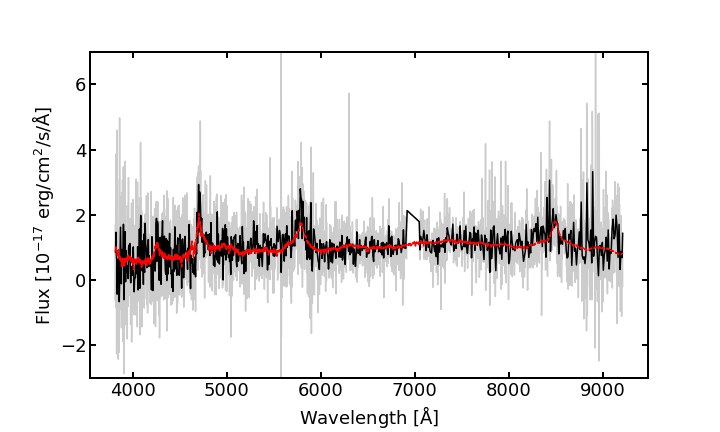
We started by querying the Sloan Digital Sky Survey (SDSS) data release 16 (DR16 Ahumada et al., 2020) and the Large Sky Area Multi-Object Fibre Spectroscopic Telescope (LAMOST) data release 7 (DR7; Luo et al., 2022). Only one match was found, WD J105223.24+313012.81, which has an SDSS spectrum. The features in the spectrum (Fig. 2) clearly indicate that, despite the high white dwarf probability (Table 1), WD J105223.24+313012.81 is a quasar. The significant Gaia parallax of mas is likely the main cause for the high , but it is worth noting that Gentile Fusillo et al. (2021) do classify this object as a quasar in their Gaia-SDSS spectroscopic sample. This object also appears as a quasar candidate in Gaia DR3. The fact that quasars show median parallaxes offset from the expected value of zero is well-known in Gaia; the mean offset is only of the order of mas, but the standard deviation of the distribution of quasar parallaxes is over 1 mas (Lindegren et al., 2021).WD J105223.24+313012.81 seems to be one of the more extreme examples ( from the mean) of a quasar parallax outlier.
For the remaining seven candidate white dwarfs with matching radio sources, spectra were obtained with SOAR/Goodman (Clemens et al., 2004) over several nights between 2022 December 2 and 2023 May 16. These observations all used the 400 l mm-1 grating and a 1.2″ slit, covering an approximate usable wavelength range 4000–7850 Å at a mean full-width at half-maximum (FWHM) resolution of Å. A single initial spectrum of length 1200–1800 s was obtained for each candidate. Using the same setup, three follow-up spectra of WDJ121604.90-281909.67 were also taken, each on a different night over approximately one month. Finally, we also observed WDJ204259.71+152108.06 using two additional setups, comprising: (i) a single spectrum taken on 2023 June 16 with the 400 l mm-1 grating with redder wavelength coverage (4800–8800 Å), and (ii) 61 spectra at medium resolution, using a 1200 lines mm-1 grating covering 7770–8870 Å at a mean FWHM resolution of Å, obtained from 2023 Jun 15 to Oct 25. All SOAR/Goodman spectra were reduced and optimally extracted in the standard manner using IRAF (Tody, 1986). While all spectra were wavelength calibrated with arc lamp spectra taken immediately adjacent to the object spectra, we also made small zeropoint corrections to the wavelength scale using the telluric A band (for 400 l mm-1 spectra) or narrow water features around 8228 Å (for the 1200 l mm-1 spectra). Additionally, two spectra of WDJ204259.71+152108.06 were obtained with the Kast double spectrograph at the 3-m Shane Telescope on 26 July 2022. We only use the blue spectrum here, which was obtained with the 600/4310 grism (covering 3300-5520 Å). A 2” slit was used, and conditions were clear, with 1.5—2” seeing. The data were reduced with PypeIt (Prochaska et al., 2020), using standard bias subtraction and flat fielding techniques. Internal He, Hg, Cd, Ne lamps were used to obtain a wavelength solution.
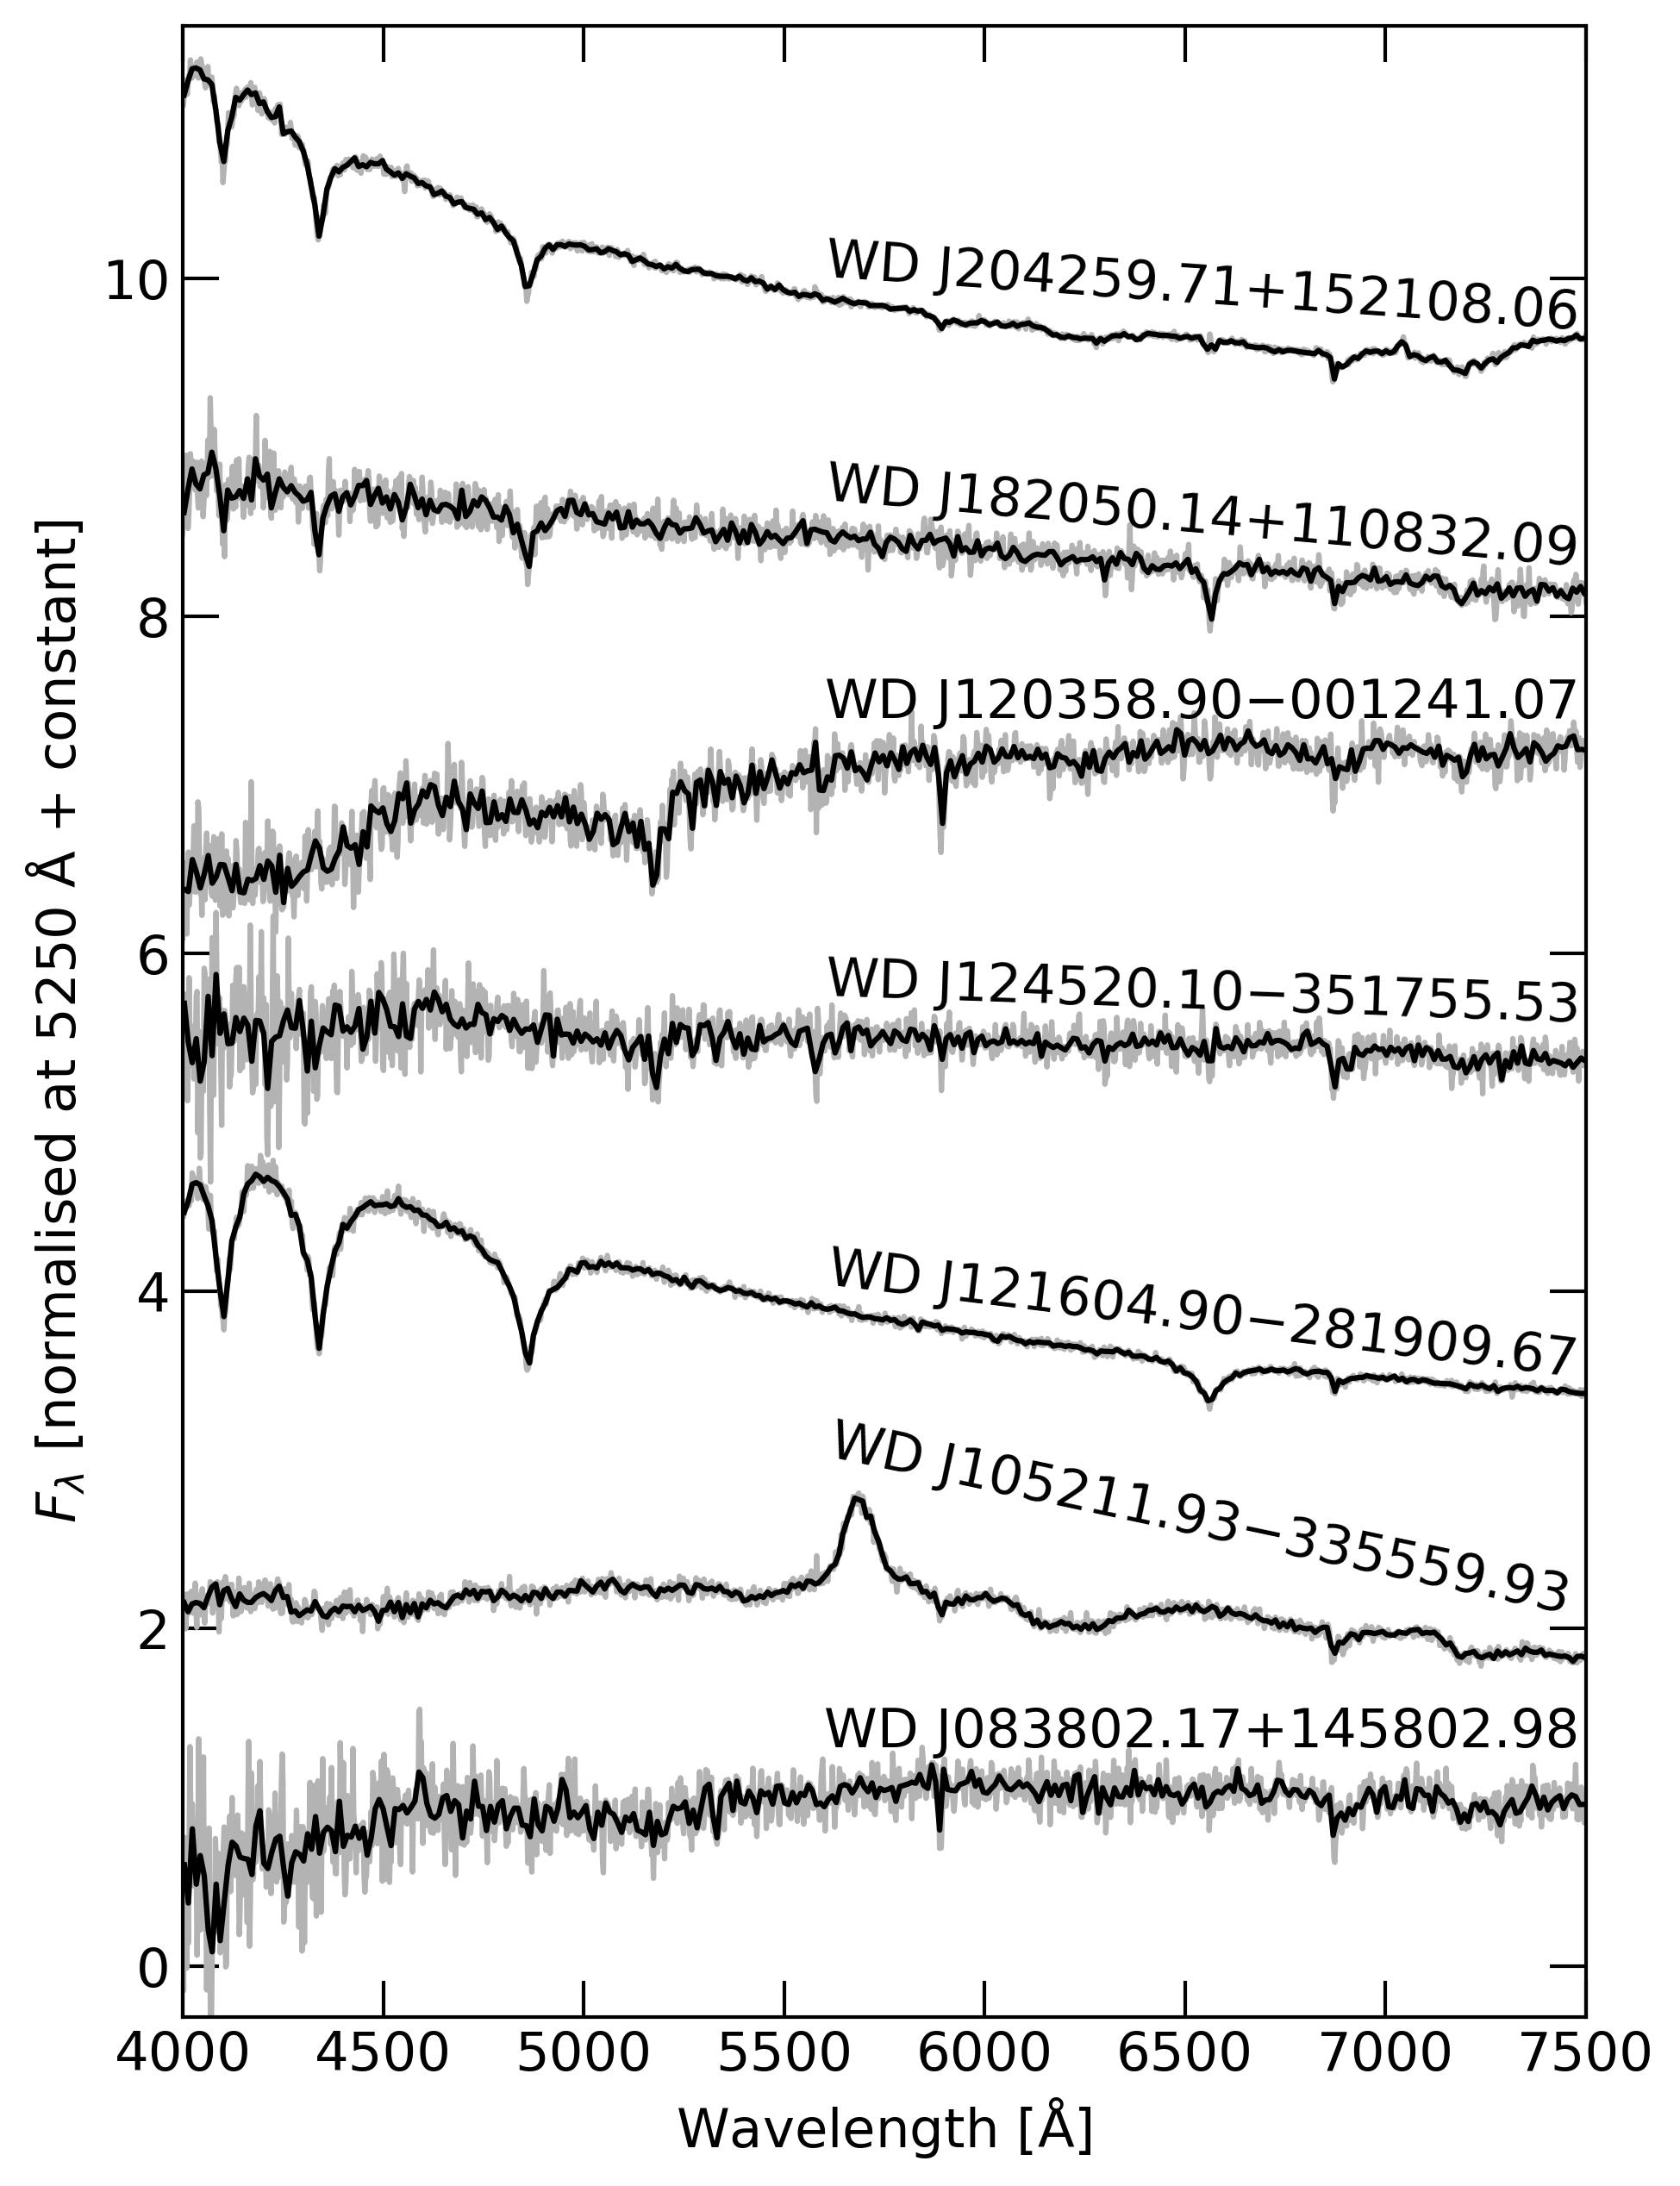
The low-resolution classification spectra are shown in Figure 3. Inspection of the obtained spectra immediately reveals that at least four out of the seven objects are not white dwarfs. The broad emission line shown by WD J105211.93-335559.93 points at a quasar nature. Like the other quasar identified in this sample, it also has a significant parallax of mas. These two objects exemplify how parallax precision does not imply accuracy. As our cross-matching selects on radio emission, which is an uncommon characteristic for white dwarfs, it is not surprising that our selection predominantly reveals contaminants amongst the white dwarf candidates.
The candidates WD J083802.17+145802.98, WD J124520.10-351755.53 and WD J120358.90-001241.07 show spectra typical of late-type main sequence stars, with spectral types between F and K. They all have low white dwarf probabilities and lie around , in the colour region of the main sequence turn-off (Figure 1). The large number of stars in this region facilitates the occurrence of statistical extremes for which the true parallax value is many standard deviations away from the reported value. These three objects are likely examples of such extremes. As we focus here only on white dwarfs, we make no further attempt to determine whether the radio emission indeed matches these stars, though it is worth noting that WDJ120358.90-001241.07 is the one object with no identified background contamination but for which the separation between radio and optical is larger than 1". That does not necessarily mean that these sources are not genuine radio emitters, as radio emission is sometimes detected in late-type main sequence stars due to gyrosynchroton emission from mildly relativistic electrons (e.g., Güdel, 2002).
The follow-up spectra leave three out of our original candidates showing spectra consistent with white dwarfs. The two candidates with the highest are confirmed as white dwarfs, with WDJ121604.90-281909.67 showing a spectrum typical for a hydrogen-dominated (DA) type white dwarf, and WDJ182050.14+110832.09 displaying a similar spectrum, but with a cooler temperature resulting in weaker lines and less steep continuum. WDJ204259.71+152108.06 was observed in morning twilight, with considerable background affecting the red part of the spectrum, but features observed suggest a composite spectrum, dominated by a DA white dwarf in the blue with contribution from a late-type companion (likely a M-dwarf) in the red.
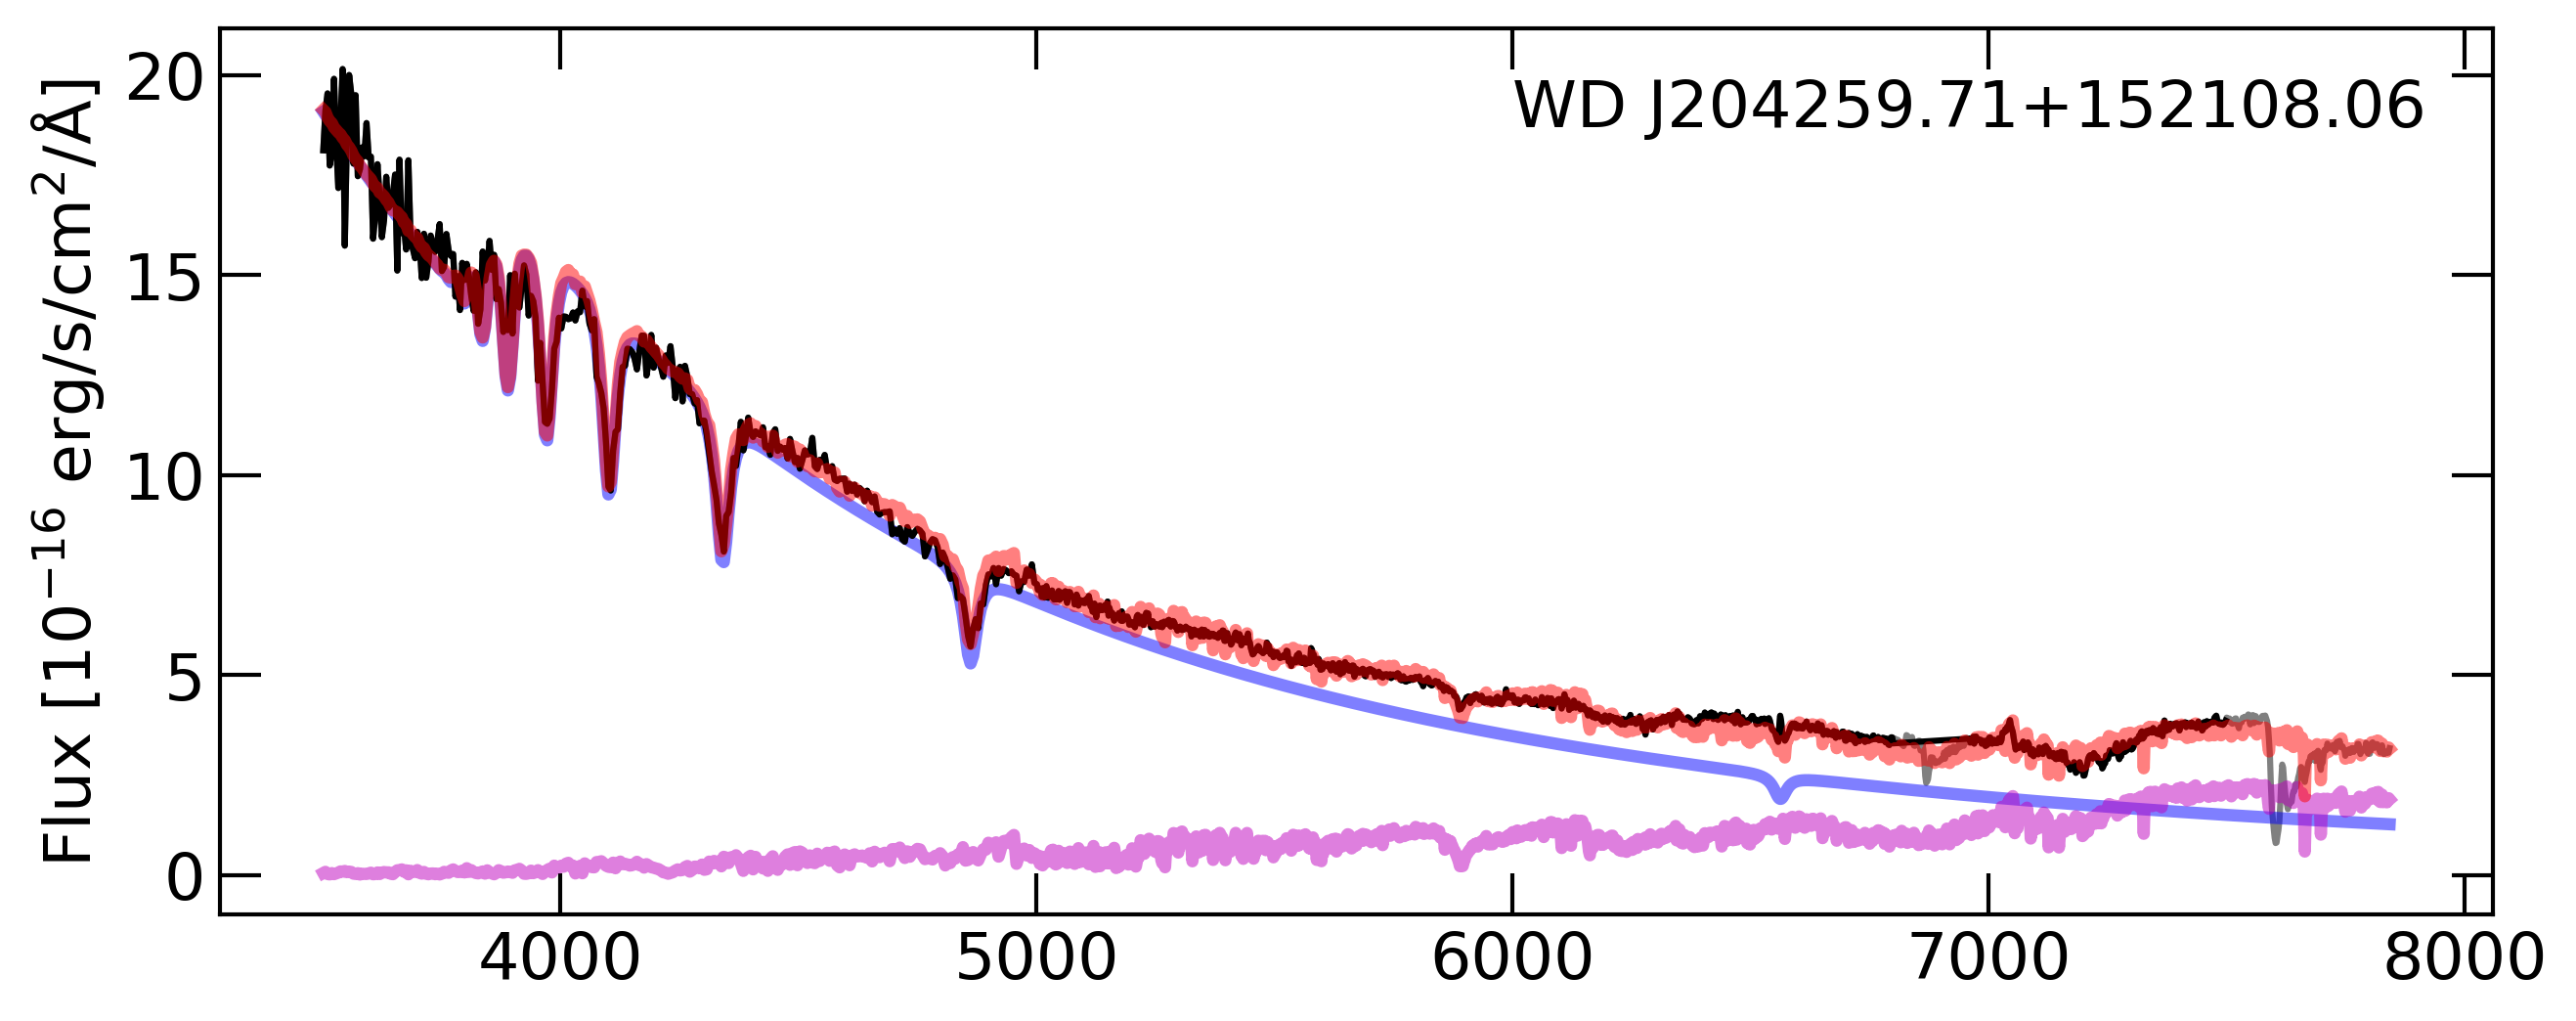
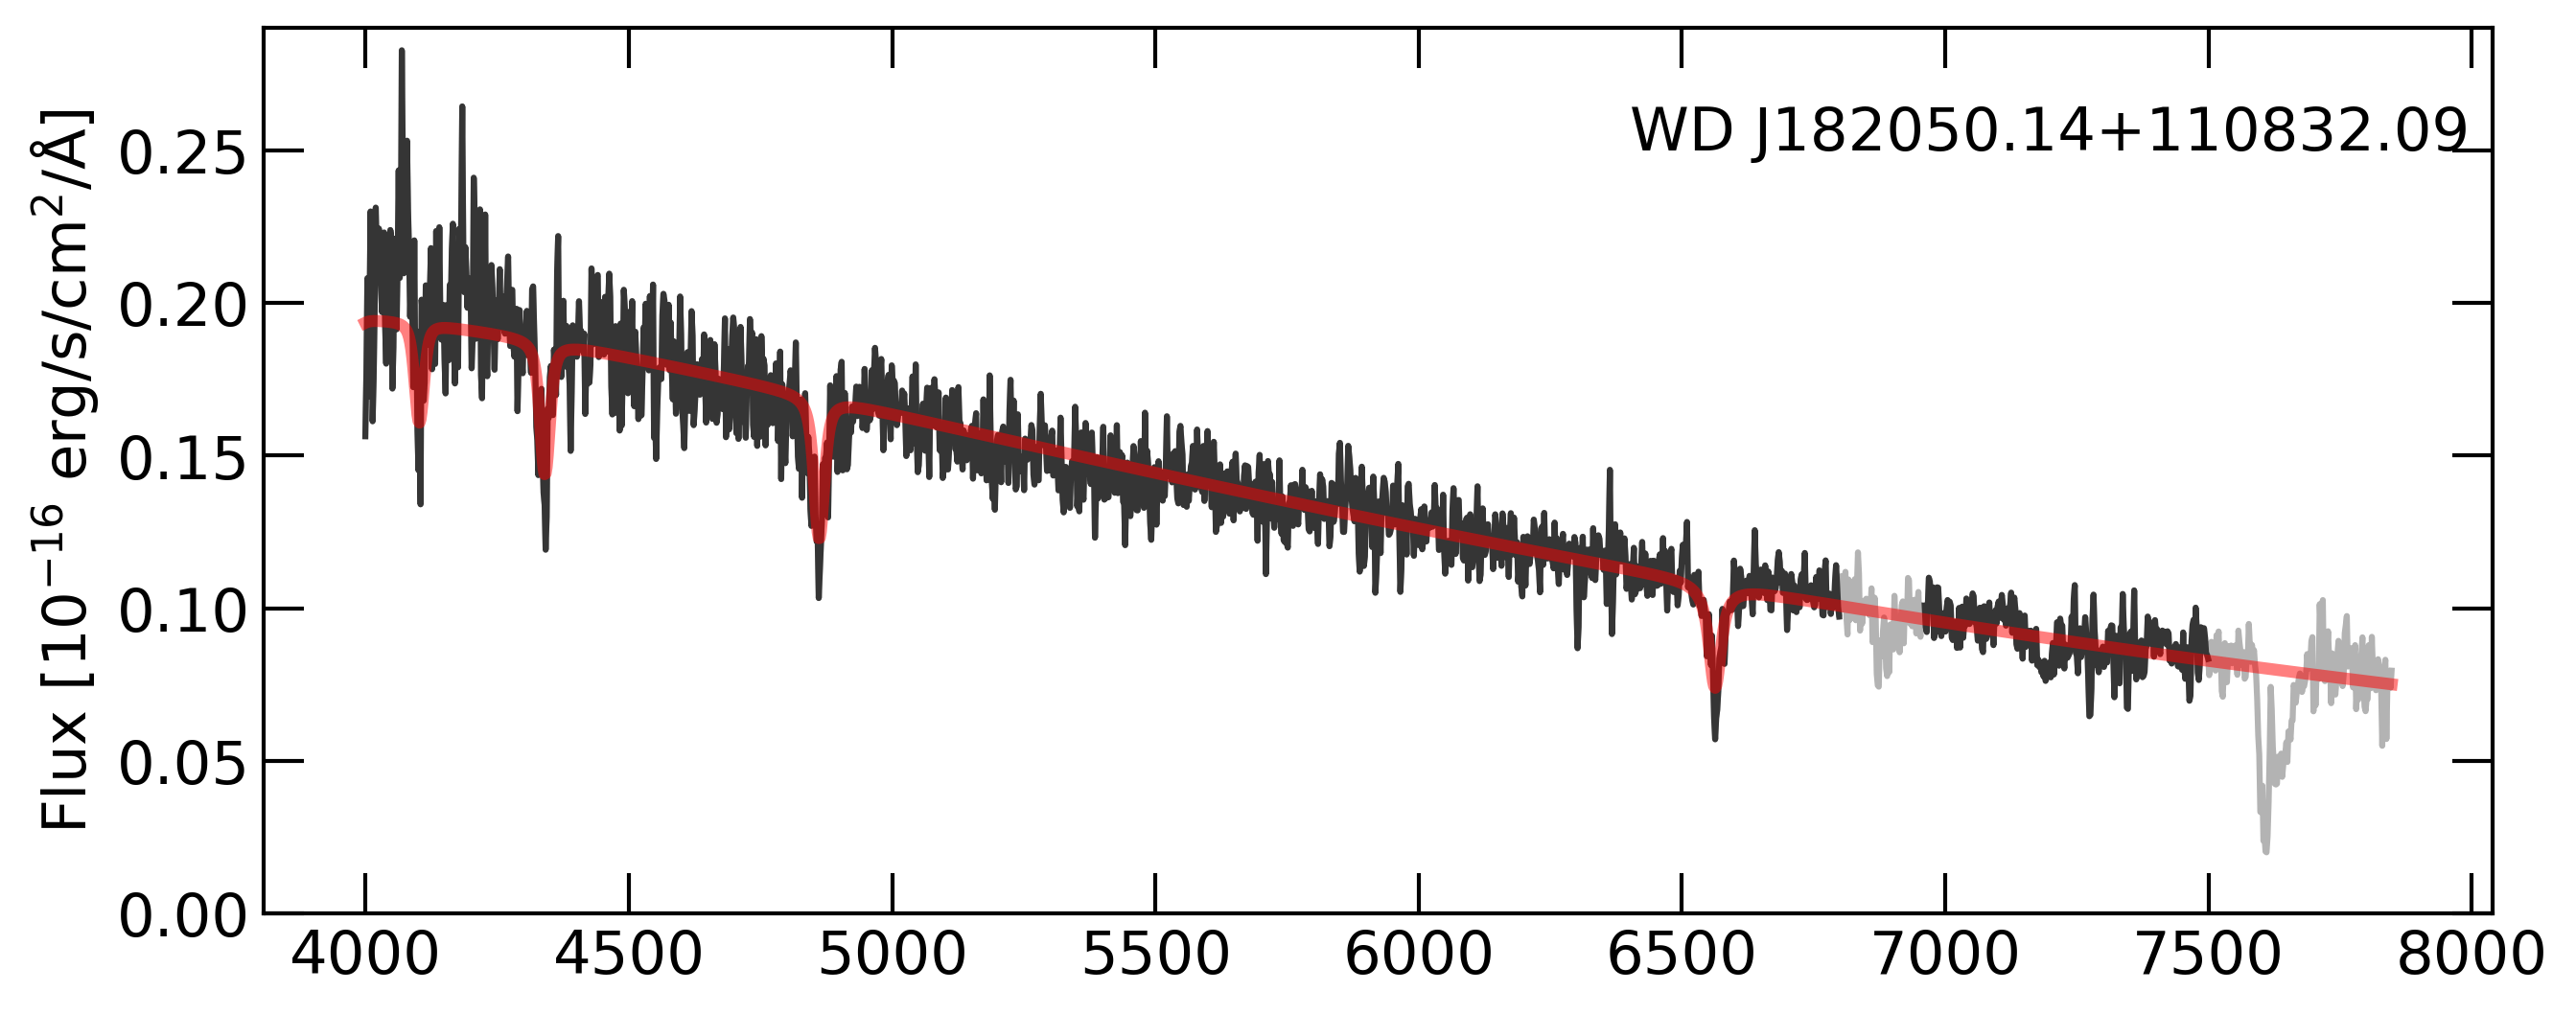
We fit the spectra of these three white dwarfs using models calculated by Koester (2010), with pure-hydrogen atmospheres and convection implemented using the mixing-length approximation with the mixing-length scale set to 0.8. The grid covers K and . We calculated the between the observed spectra and every model in the grid, first degrading the models to the resolution of the observed spectra. Spectra and models were normalised by a constant free parameter, preserving the slope but not the absolute flux given potential slit losses. In all cases an absolute minimum was found, and we adopt the best solution as the one given by the global minimum. Uncertainties were obtained from the 68% percentile of the distribution. The spectra observed were corrected for extinction prior to fitting using values from a 3D extinction map (Capitanio et al., 2017) and the Gaia distance (Bailer-Jones et al., 2021). For WD J204259.71+152108.06, we combine the SOAR spectrum with the KAST spectrograph blue channel spectra (the red channel spectra were unusable due to a short exposure length) by using the KAST spectrum for wavelengths below 5000 Å and the SOAR spectrum above that. No renormalisation was required, giving confidence that the absolute flux calibration is reliable. We then simultaneously fit the white dwarf and the M-dwarf, using BT-Settl models (Allard et al., 2013) for the M-dwarf (with , solar metallicity, and no -enhancement). The resulting fits are shown in Figure 4.
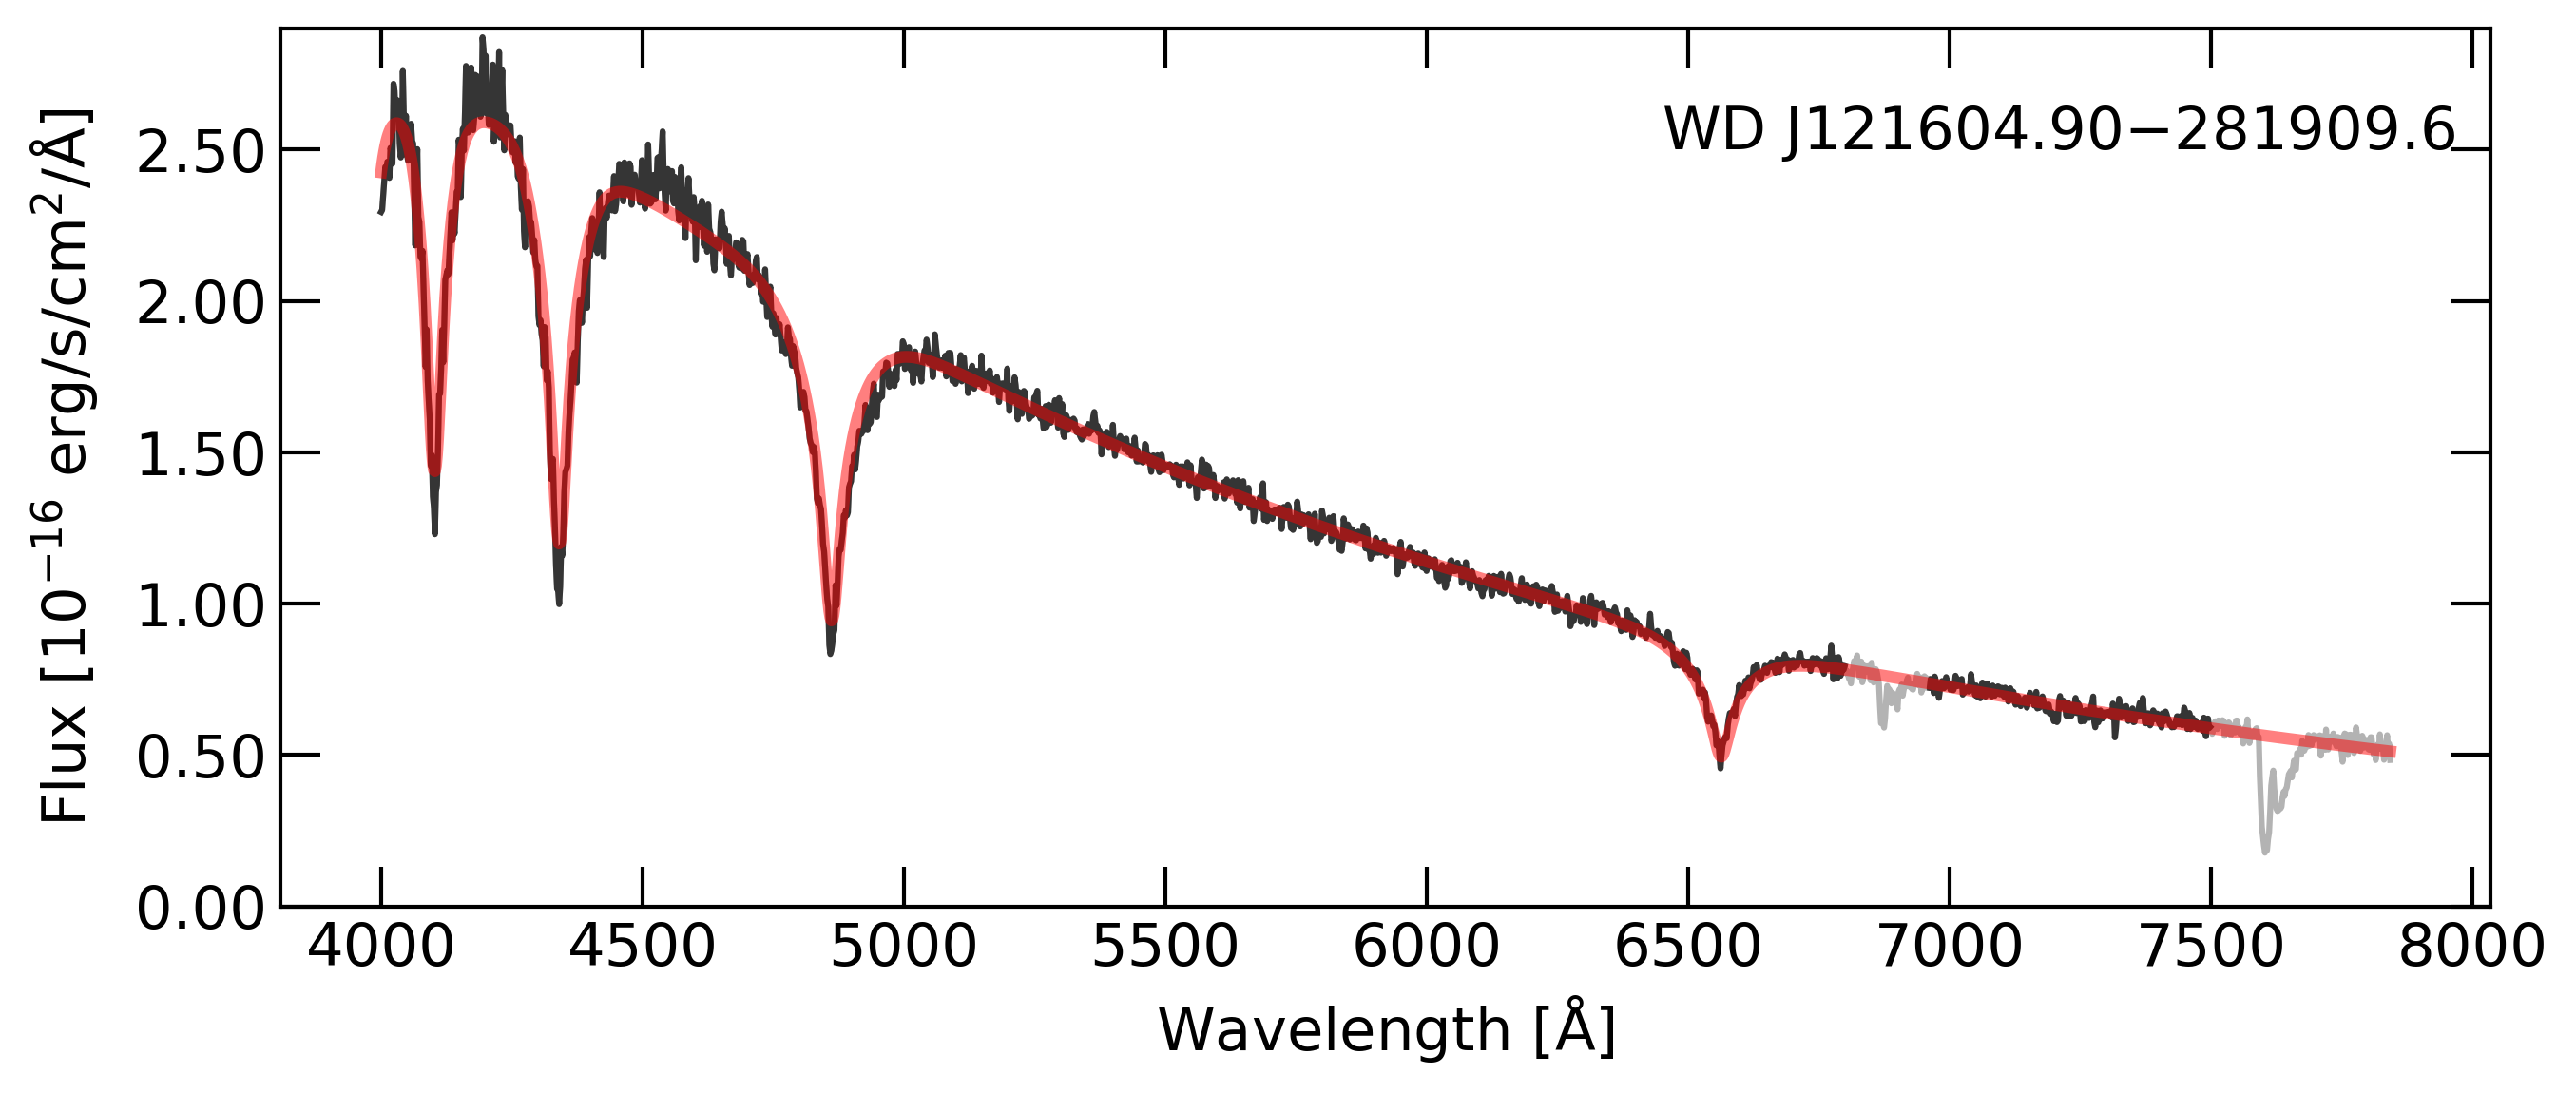
WD J121604.90-281909.67 is found to show K and . Using a mass-radius relationship from carbon-oxygen core cooling models444https://www.astro.umontreal.ca/~bergeron/CoolingModels/ (Bédard et al., 2020), these parameters indicate a mass of M☉. All of the obtained values agree within with the values reported by Gentile Fusillo et al. (2021) for a hydrogen-atmosphere spectral energy distribution fit ( K, , M☉).
WD J182050.14+110832.09’s spectrum was fitted with K and . At such low temperature, the lines become less sensitive to , which results in high uncertainty. The mass is estimated to be M☉ from carbon-oxygen cooling models (Bédard et al., 2020). Like for WD J121604.90-281909.67, the derived parameters are consistent with those obtained by Gentile Fusillo et al. (2021) ( K, , M☉). We note that Gaia’s astrometric solution for WD J182050.14+110832.09 shows some excess noise (astrometric_excess_noise =1.3 mas), but at mag that is not unexpected.
WD J204259.71+152108.06 was fitted with K and , implying a mass of M☉. The M-dwarf was best fitted with K, corresponding to spectral type M2.5. The large uncertainties are due to the different combinations of white dwarf and M-dwarf parameters that result in similar . For this system, given the evidence that slit losses were minimal, the normalisation was set by the radii of each star and the distance of the system to Earth, which were left to vary freely. The best fit was obtained with and R☉ for the white dwarf and M-dwarf, respectively, and distance pc. Gentile Fusillo et al. (2021) provided no parameter estimates for this system, because of its low white dwarf probability that can be attributed to the companion contribution moving it away from the white dwarf cooling track. The presence of a clear companion makes WD J204259.71+152108.06 particularly interesting as a radio source, as the acceleration of electrons due to interaction between the stars could lead to genuine radio emission. Of the three targets confirmed as white dwarfs, this one has the lowest astrometric separation between white dwarf position and radio source.
2.3 Time-series photometric analysis
Radio emission from white dwarf systems is typically accompanied by optical variability, as is the case for magnetic propellers, binary white dwarf pulsars, and cataclysmic variables in general. To identify whether the three sources confirmed as white dwarfs could be associated with one of these known types of radio emitters, we searched for variability in their light curves from the Asteroid Terrestrial-impact Last Alert System (ATLAS, Tonry et al., 2018), the Zwicky Transient Facility (ZTF, Bellm et al., 2019), and the Catalina Surveys (Drake et al., 2009). ATLAS measurements are available in two bands, cyan () and orange (); ZTF provide data in , and Catalina measurements are in the band. The targets were also followed up with the fast-speed photometers ULTRACAM (Dhillon et al., 2007), mounted on the 3.5-m European Southern Observatory (ESO) New Technology Telescope (NTT), and ULTRASPEC (Dhillon et al., 2014), mounted on the 2.4-m Thai National Telescope (TNT), as fast variability such as the white dwarf spin can be missed by the cadence of surveys.
We first searched for periodic variability by calculating Lomb-Scargle periodograms for each band separately. We probed periods between one minute and five days, spanning the typical range of spin and orbital periods. To identify stochastic variability, our approach was to compare the distribution of the number of standard deviations () from the mean () with the maximum expected given the number of observations, assuming that the measurements would follow a Gaussian distribution for a non-variable star. The probability that a measurement of a Gaussian variable lies in the range between and is given by
| (1) |
where erf is the error function. Hence for a number of observations, there is a given for which
| (2) |
i.e. all observations are within the expected range assuming that any scattering is due to only random noise. We solved for in each case and compared it with the observed distribution. In the ideal case, no measurement should have , but does not account for systematic uncertainties. In an attempt to consider systematics, we impose a variability threshold of 10 per cent of the distribution being above the expected , i.e. we assume that up to 10 per cent of measurements can be adversely affected by systematics.
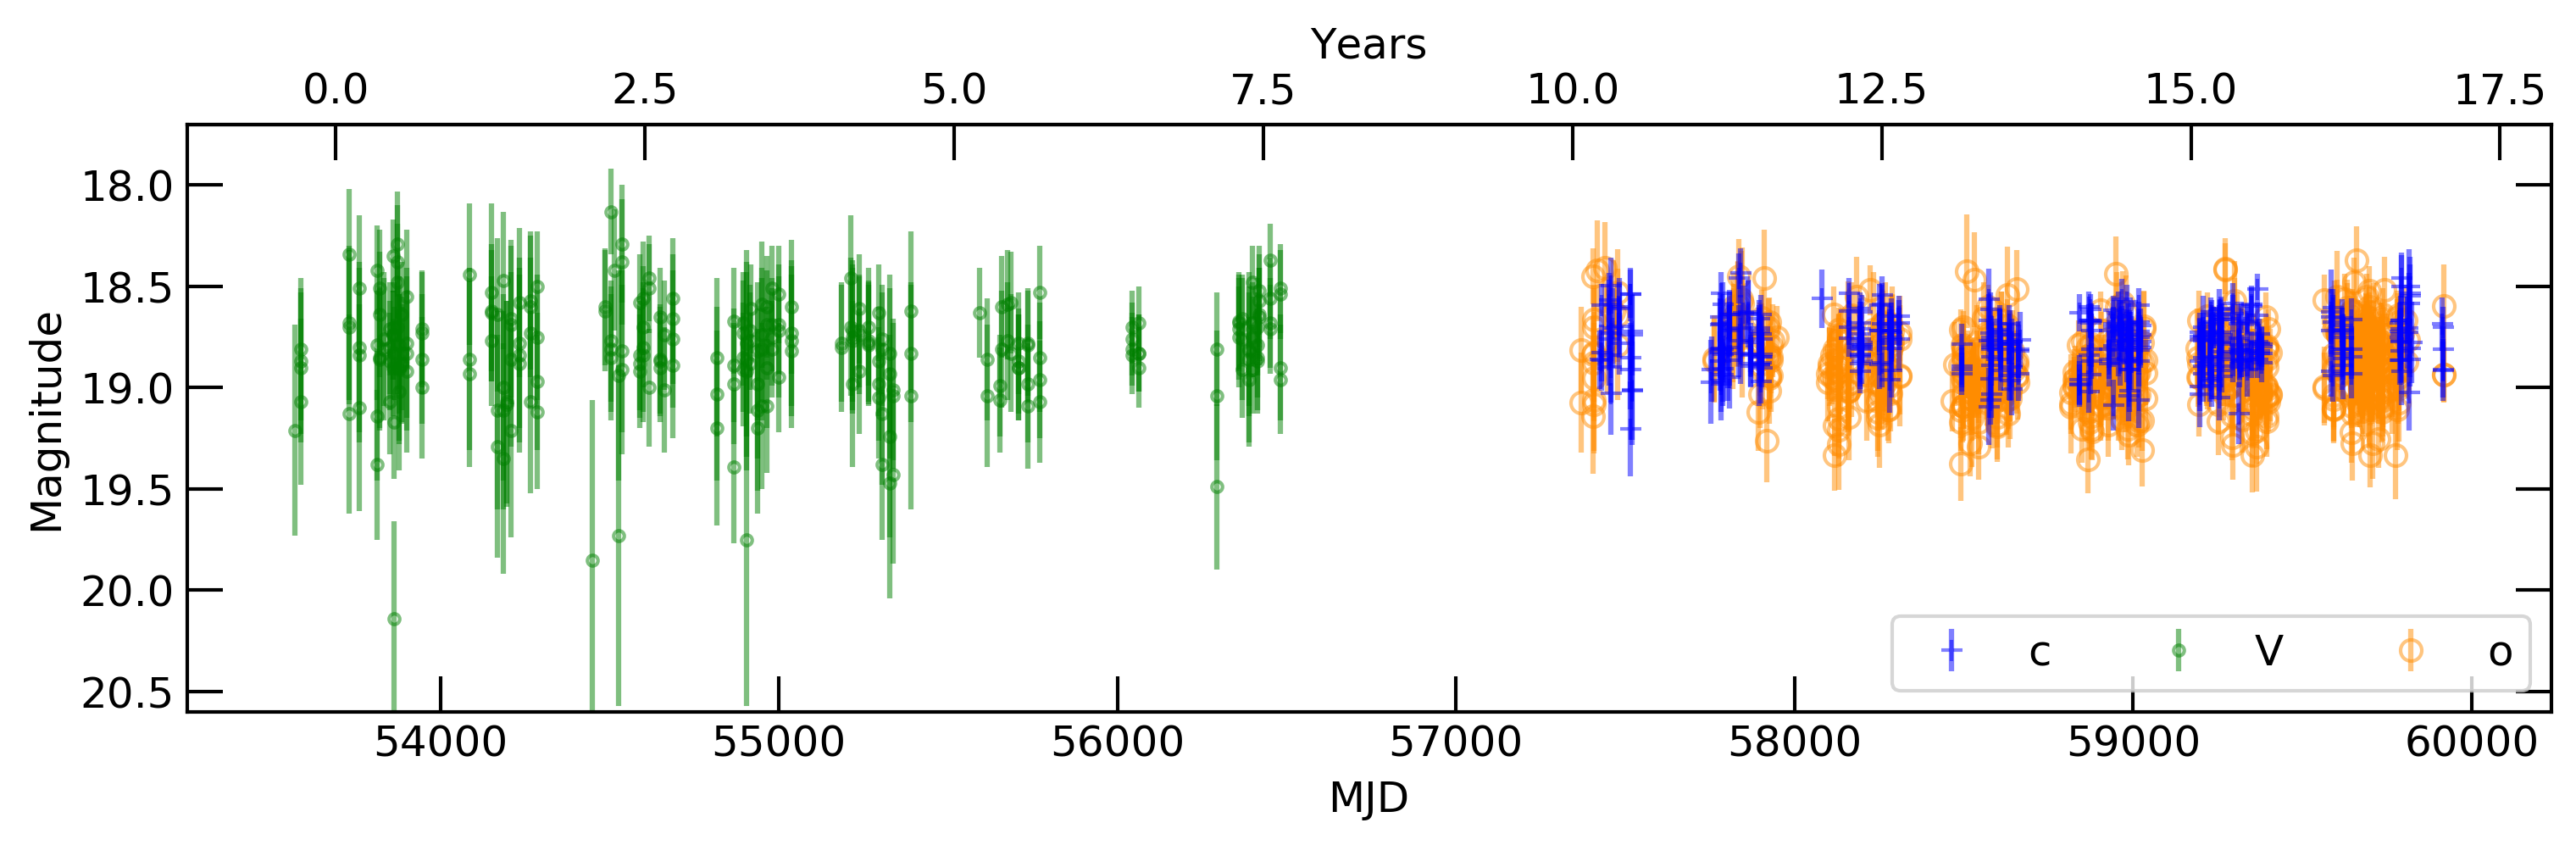
WD J121604.90-281909.67 had available photometry from ATLAS (spanning 2015–2022) and Catalina (spanning 2005–2013), which is shown in Fig. 5. A Lomb-scargle periodogram for each dataset is shown in Fig. 12. There are no clear periods rising above the noise, with the strongest peaks being attributed to one-day aliases resulting from sampling. Periodic variability can be ruled out over the range of probed periods (1 min to 5 days) to about 50 mmag. We also identify no stochastic variability in these light curves. The Catalina light curve has 0.4 per cent of measurements beyond the expected of 2.9 from the mean. For ATLAS, 1.6 per cent of measurements and per cent of are beyond the expected . Therefore there is no indication of any variability in the archival light curves.
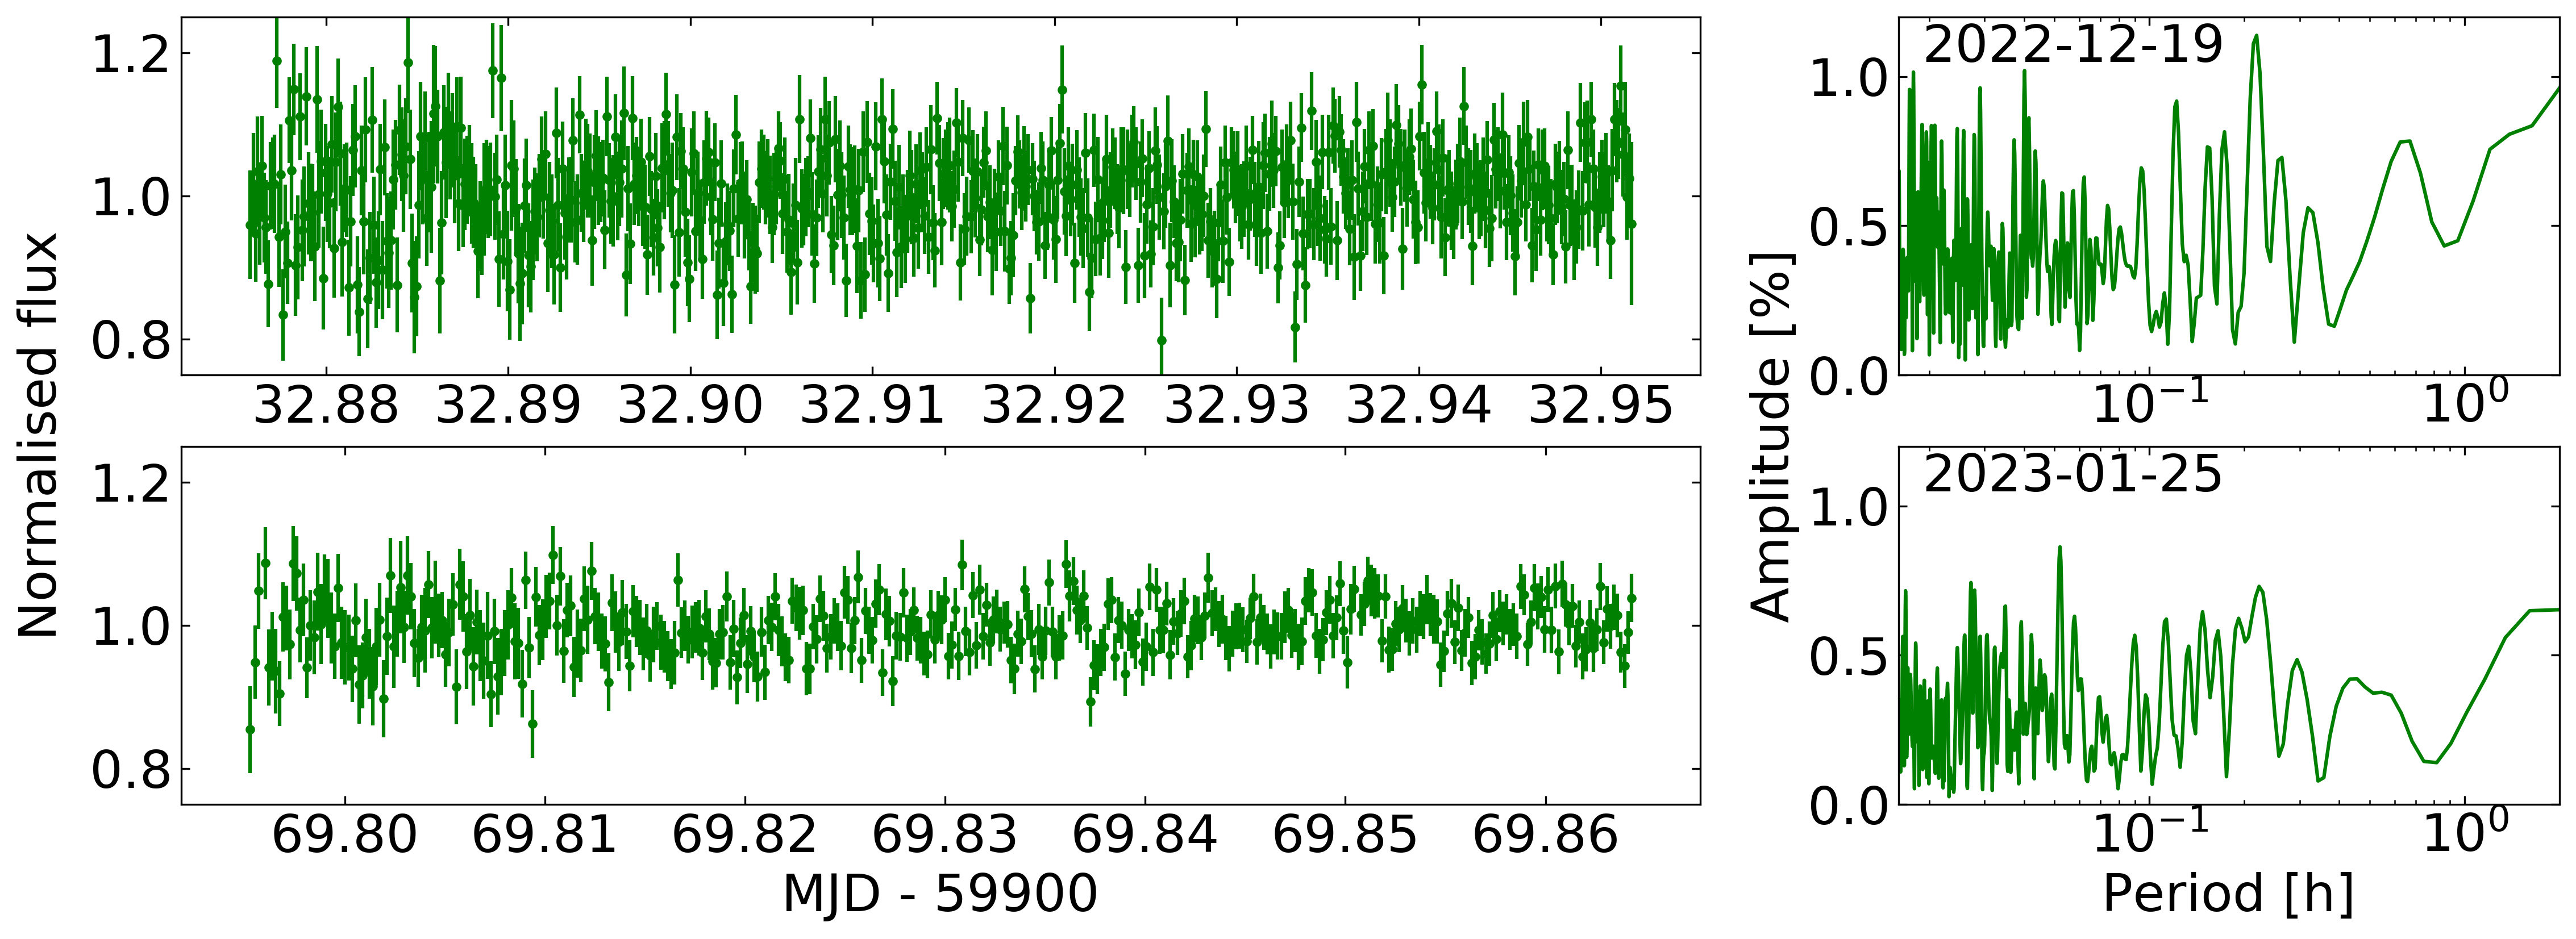
To probe for short-term or low-level variability, we observed WD J121604.90-281909.67 with ULTRASPEC on 2022 December 19 and 2023 January 25. In both cases we employed the filter; this filter has approximately the same cut-off range as the traditional filter but with higher throughput (indicated by the subscript for “super"). Cadence was set as 10.05 and 14.98 s and the length of exposure as 109 and 99 min in the first and second nights, respectively. Deadtime is negligible thanks to frame-transfer capabilities. The light curve and Fourier transforms are shown in Fig. 15. There are no significant peaks in the periodogram and periodic variability up to 3 hours can be ruled out down to an amplitude of less than 1 per cent. No indication of stochastic variability is found either.
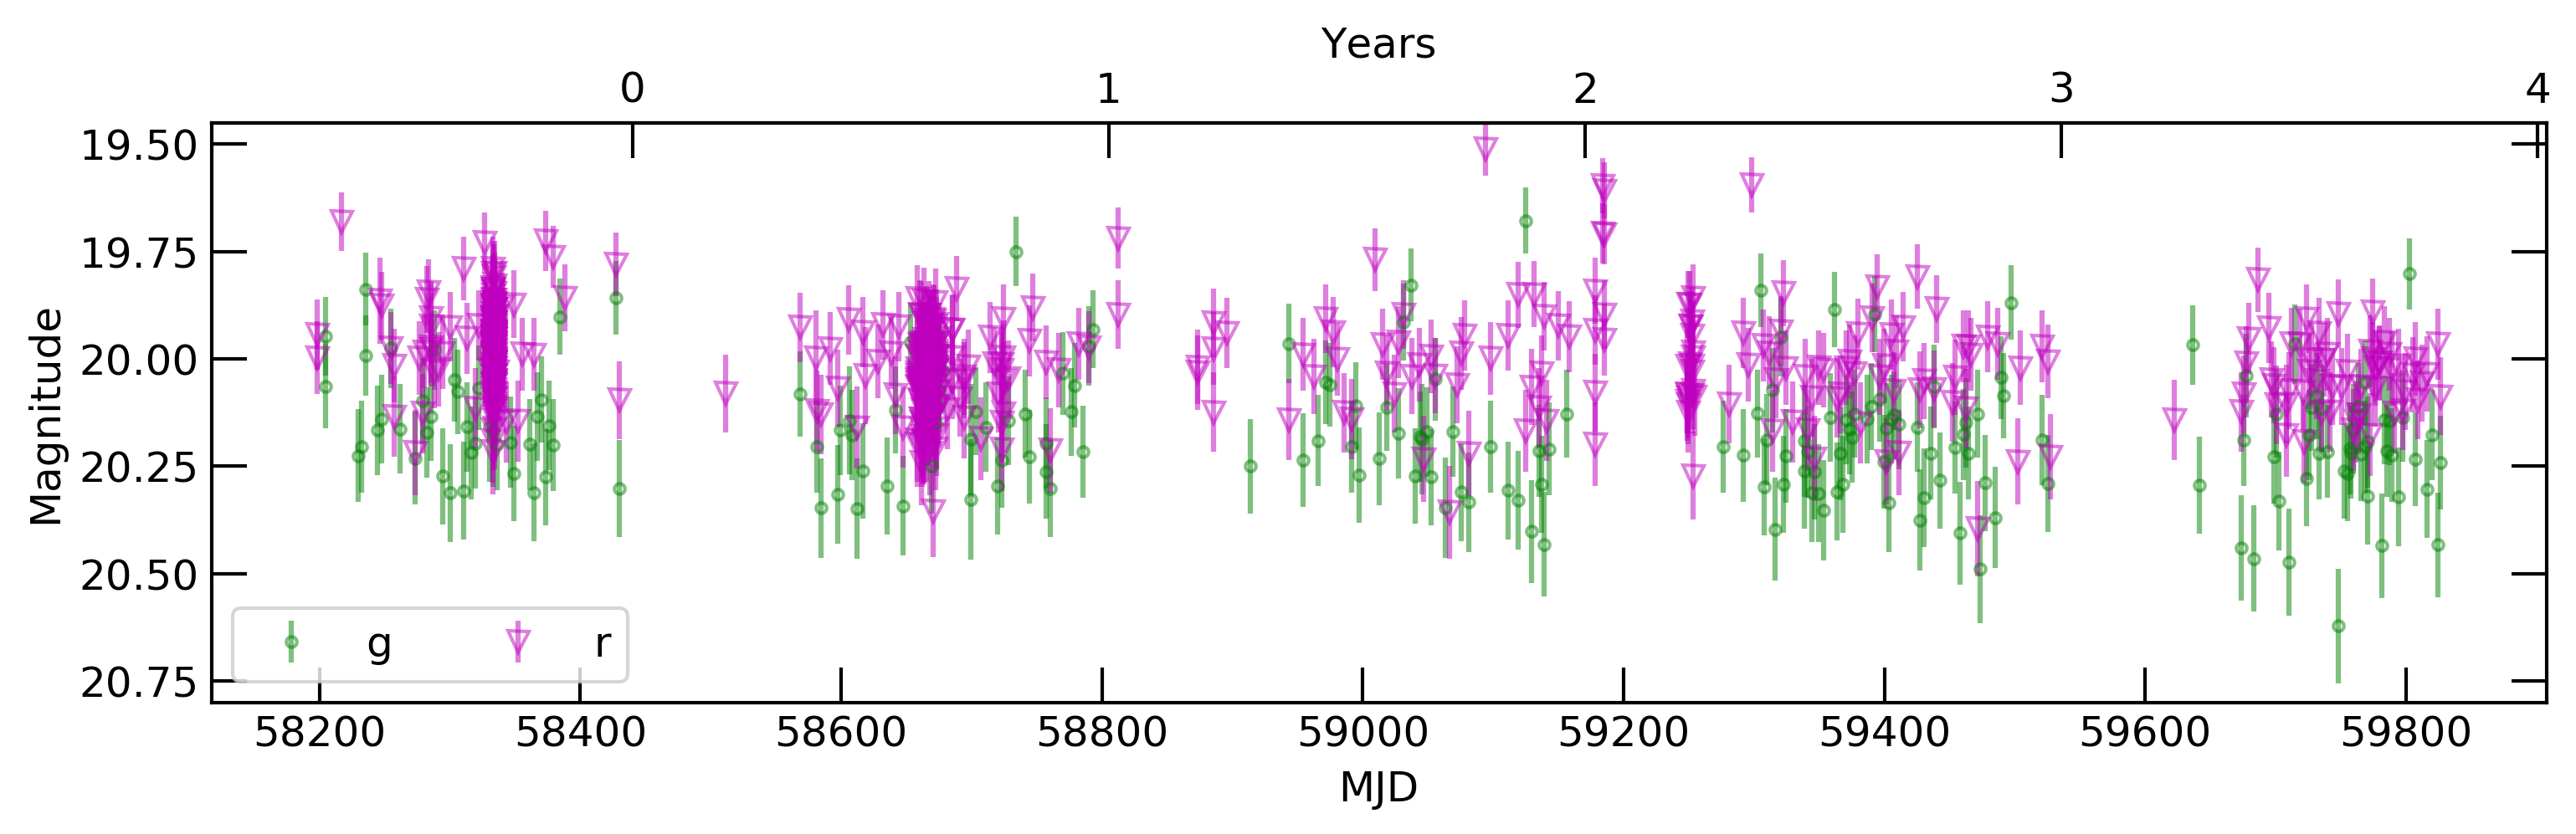
WD J182050.14+110832.09 was observed by ZTF in the and bands, as shown in Fig. 6. Publicly available data span 2018–2021. The light curve shows considerable scatter, but at 20th magnitude this target approaches the detection limit of ZTF. A Lomb-Scargle periodogram reveals no periodic variability between 1 min and 5 days down to mmag (Fig. 13). The only strong peaks are due to one-day aliasing. 6.6 and 2.3 per cent of and measurements, respectively, are above the expected maximum , below our variability threshold.
We subsequently observed WD J182050.14+110832.09 with ULTRACAM on 2023 April 23 for an hour. ULTRACAM’s beam splitter allows simultaneous observations in three filters. Filters , , and were employed. The cadence was 10.06 s for and , and s in . Like ULTRASPEC, ULTRACAM also has negligible deadtime. The light curve and periodogram are shown in Fig. 16. No significant peaks are seen in the periodogram, ruling out periods up to two hours down to 2 () or 10 () per cent amplitude (the one peak seen in the periodogram is due to a cadence alias). There is also no sign of stochastic variability, with less than 1 per cent of the measurements being above the expected maximum in all cases.
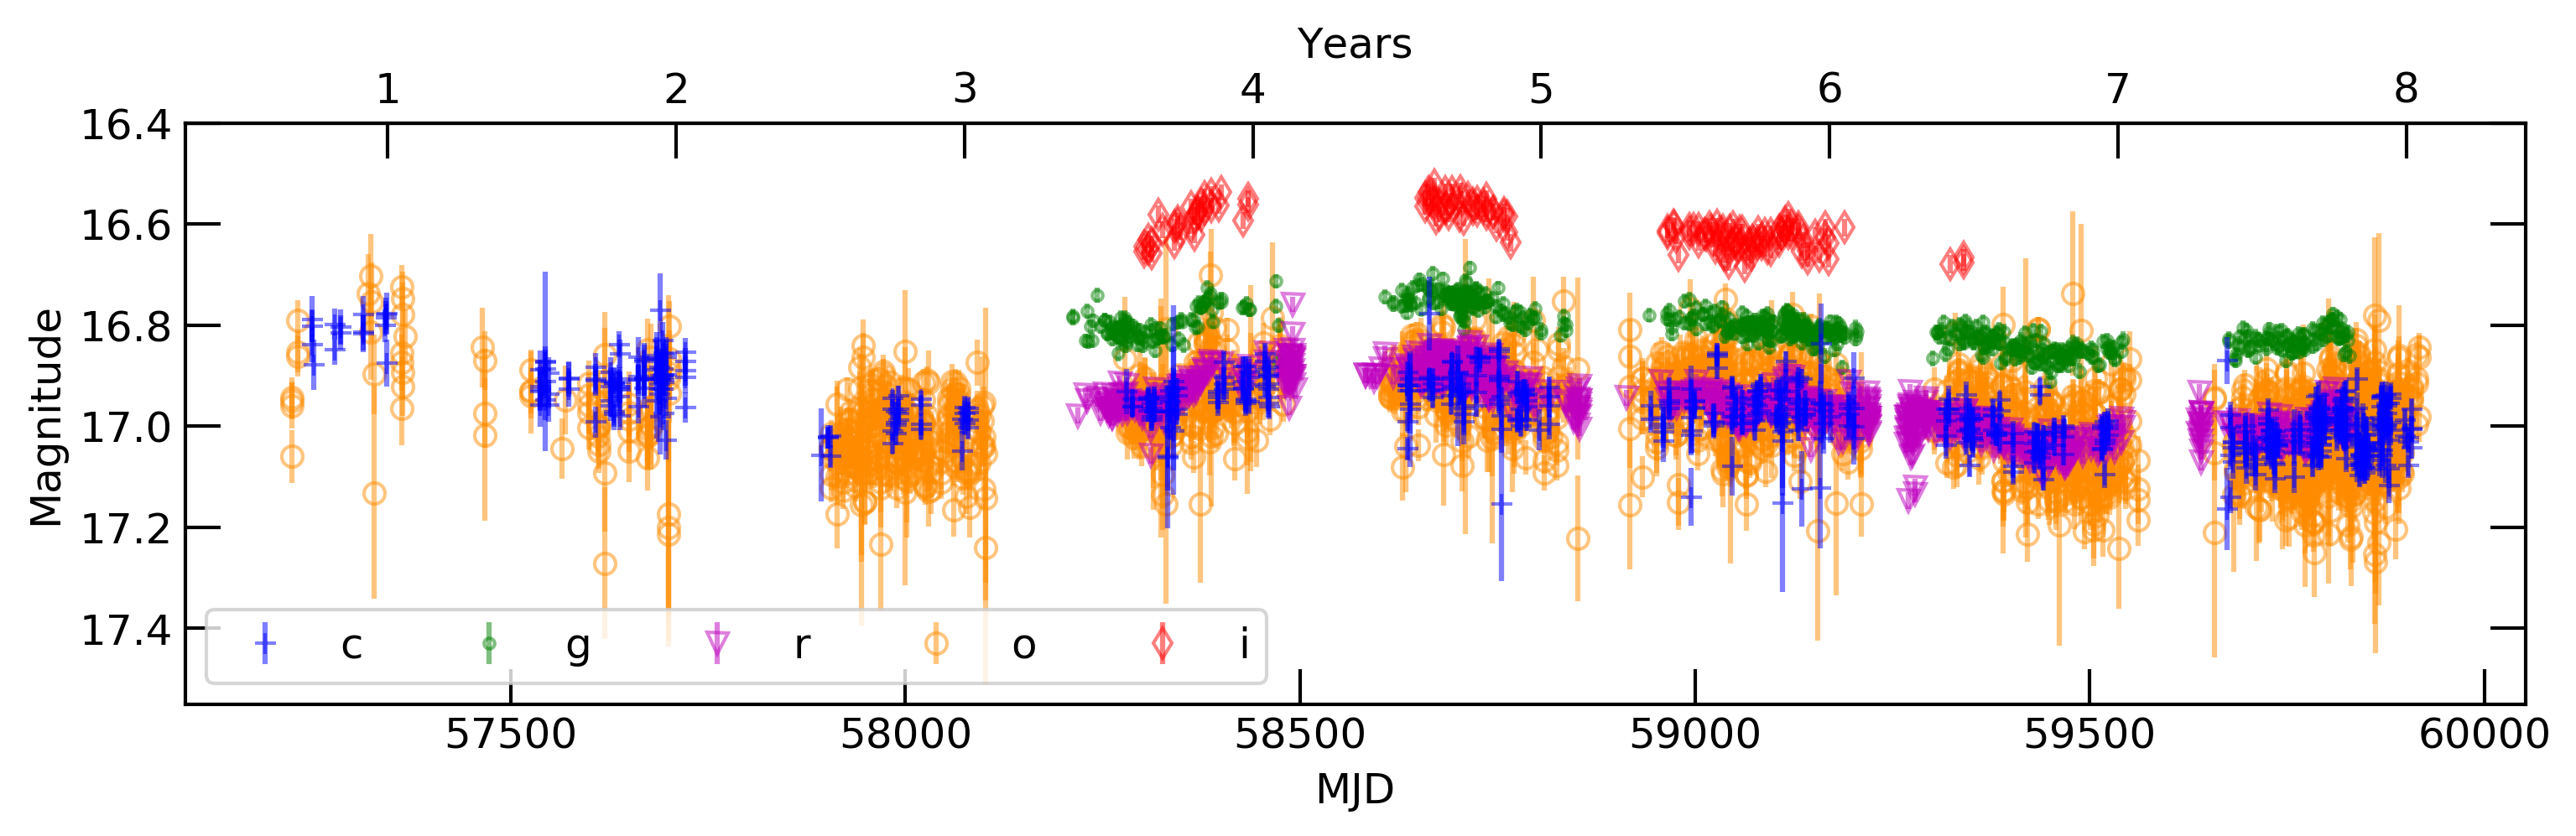
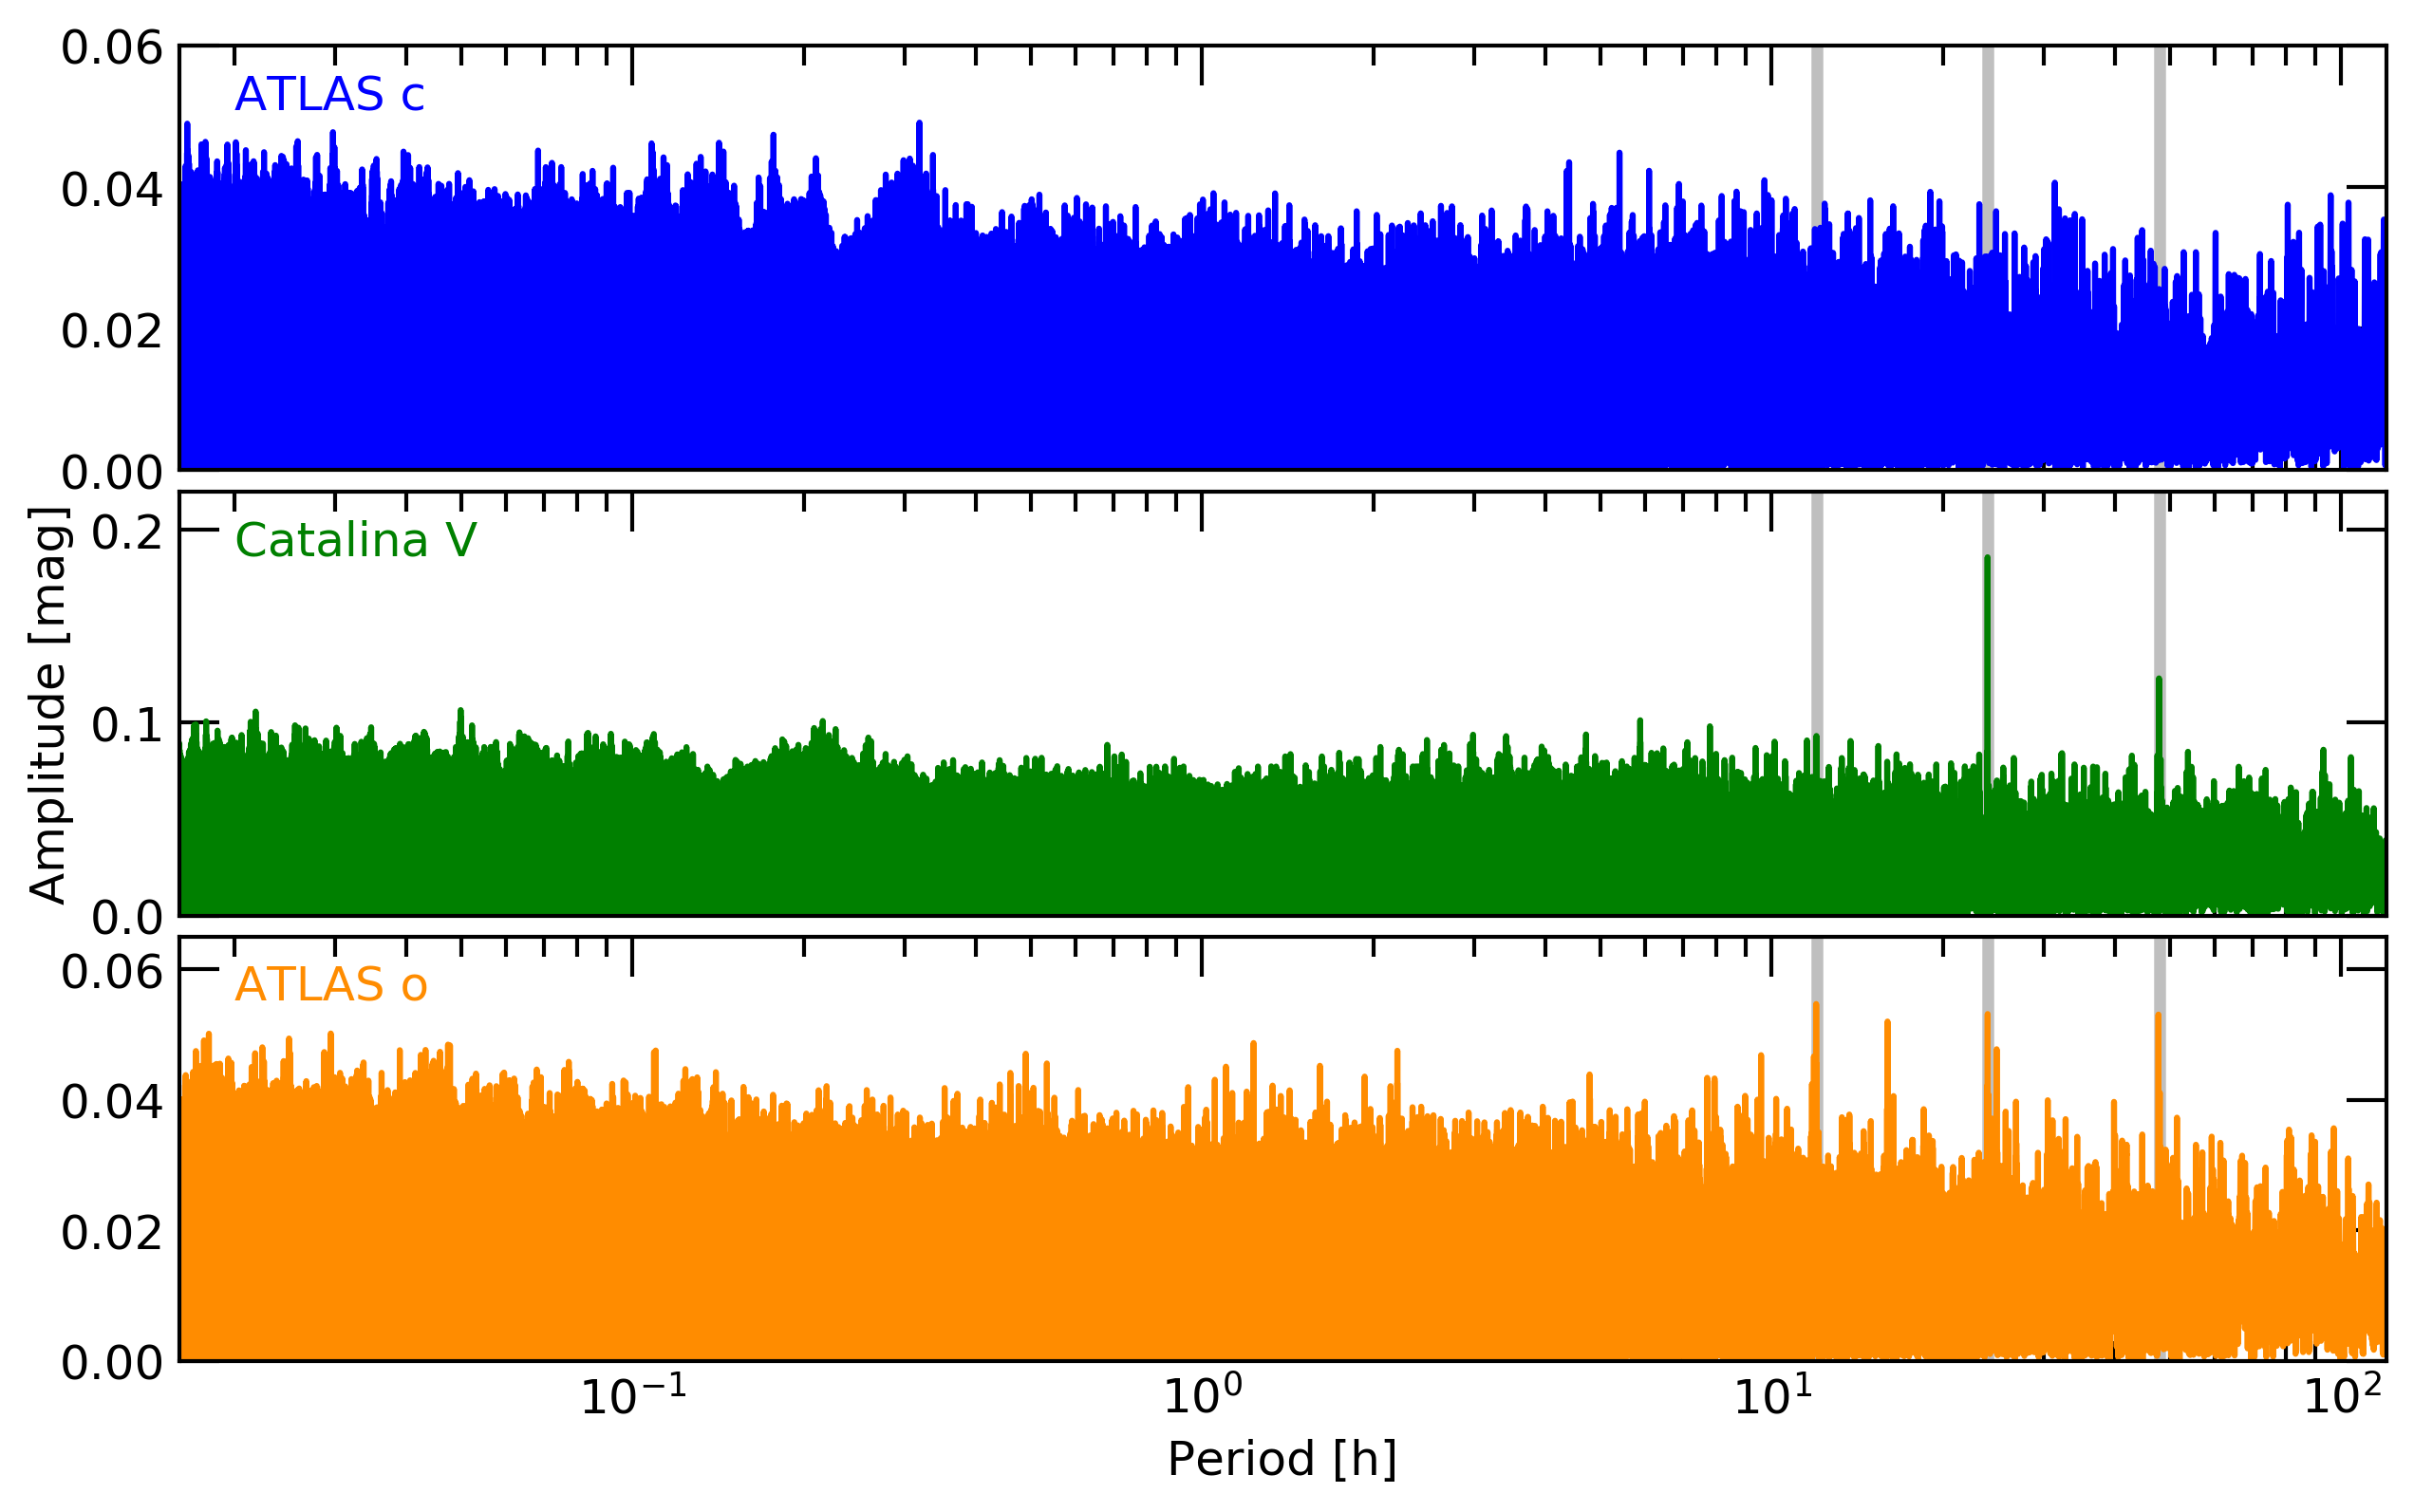
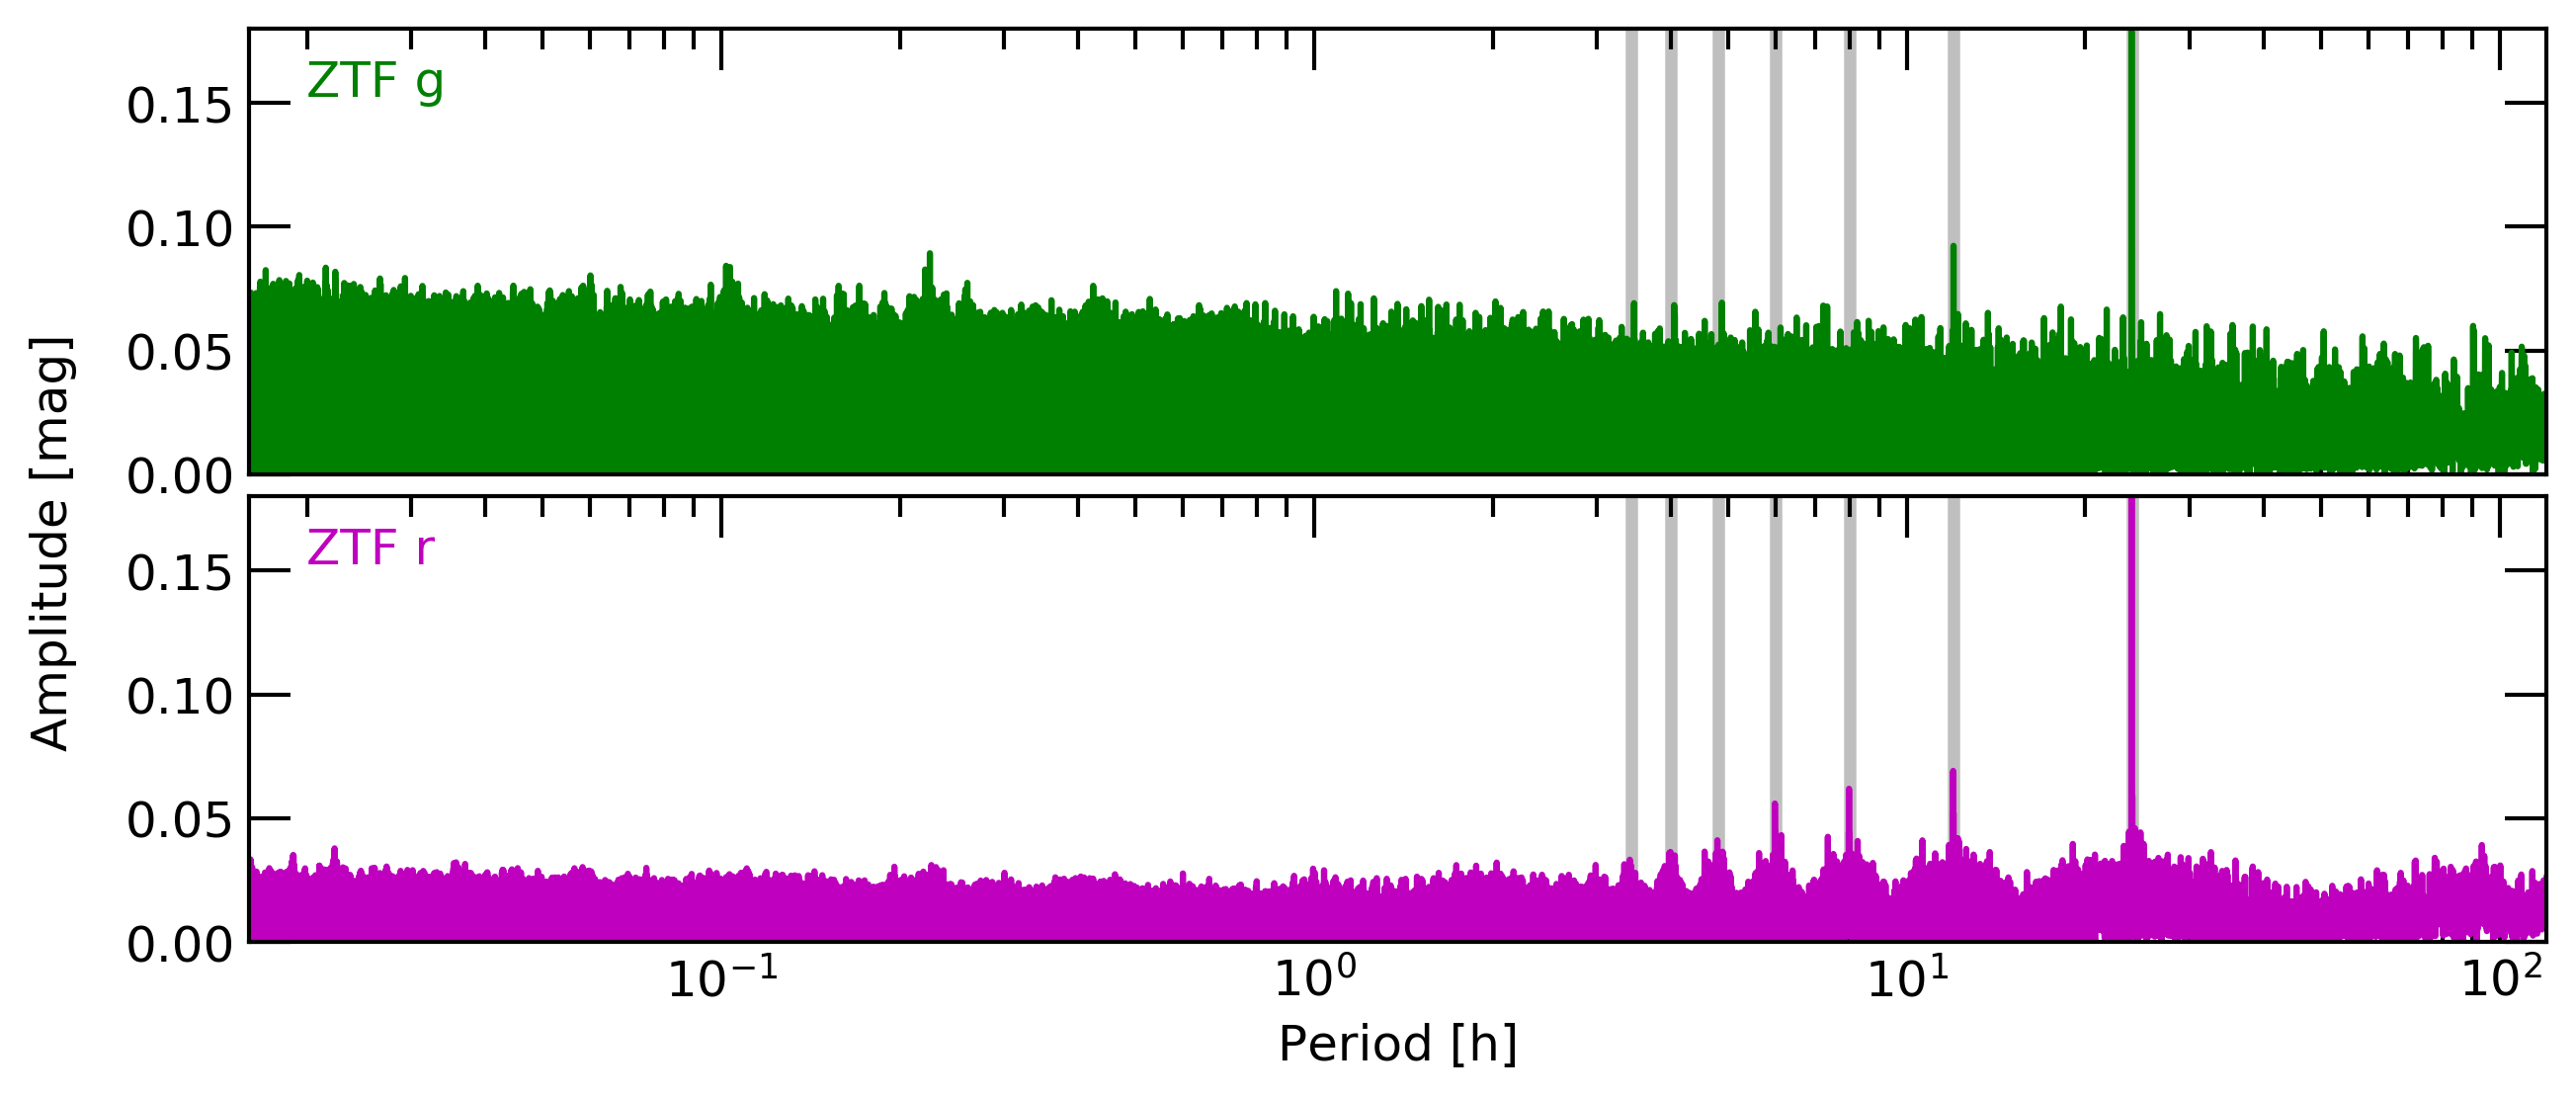
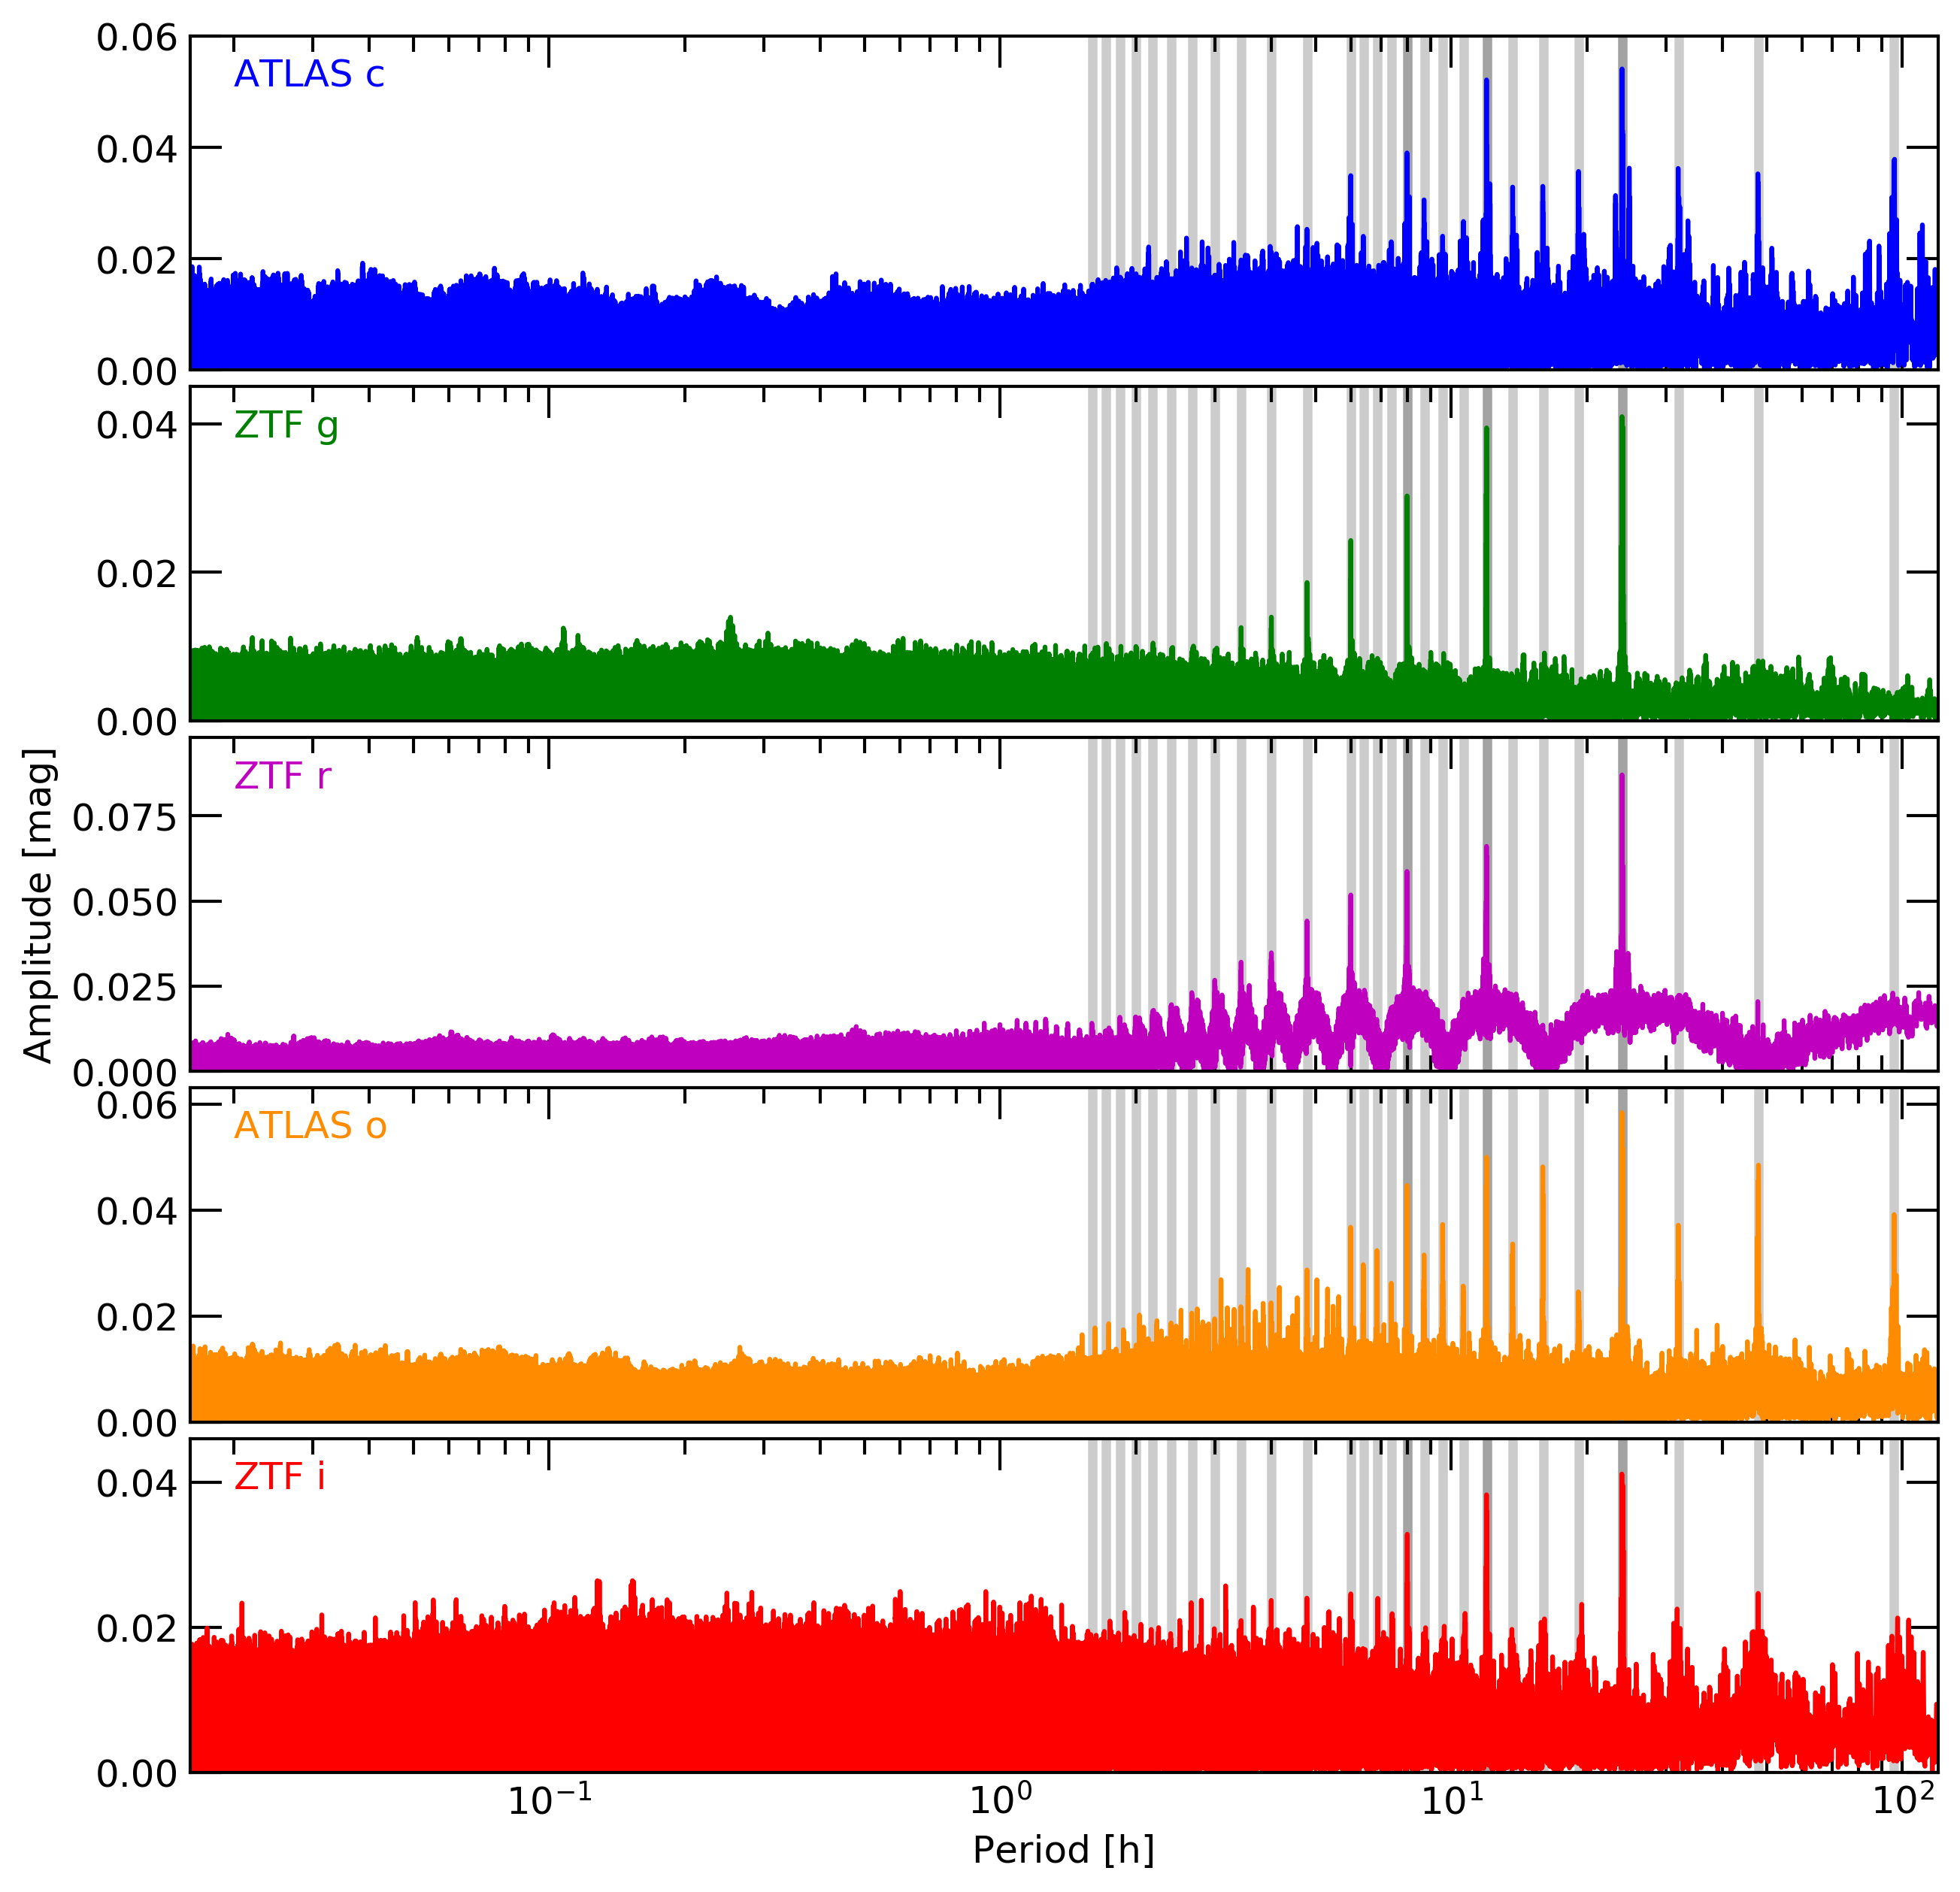
WD J204259.71+152108.06 has light curves in both ATLAS (2015–2022) and ZTF (2018–2022), which are shown in Fig. 7. Visual inspection alone already suggests some long-term variability at the level of mag. We indeed find evidence for stochastic variability in our analysis, which showed that 18, 25, 35, 13, and 29 per cent of measurements are beyond the expected for , , , , and , respectively, above our variability threshold in all cases. The variability does not seem to be periodic in nature, as shown in the periodograms in Fig. 14. Many peaks are present, but can be attributed to one-day aliases.
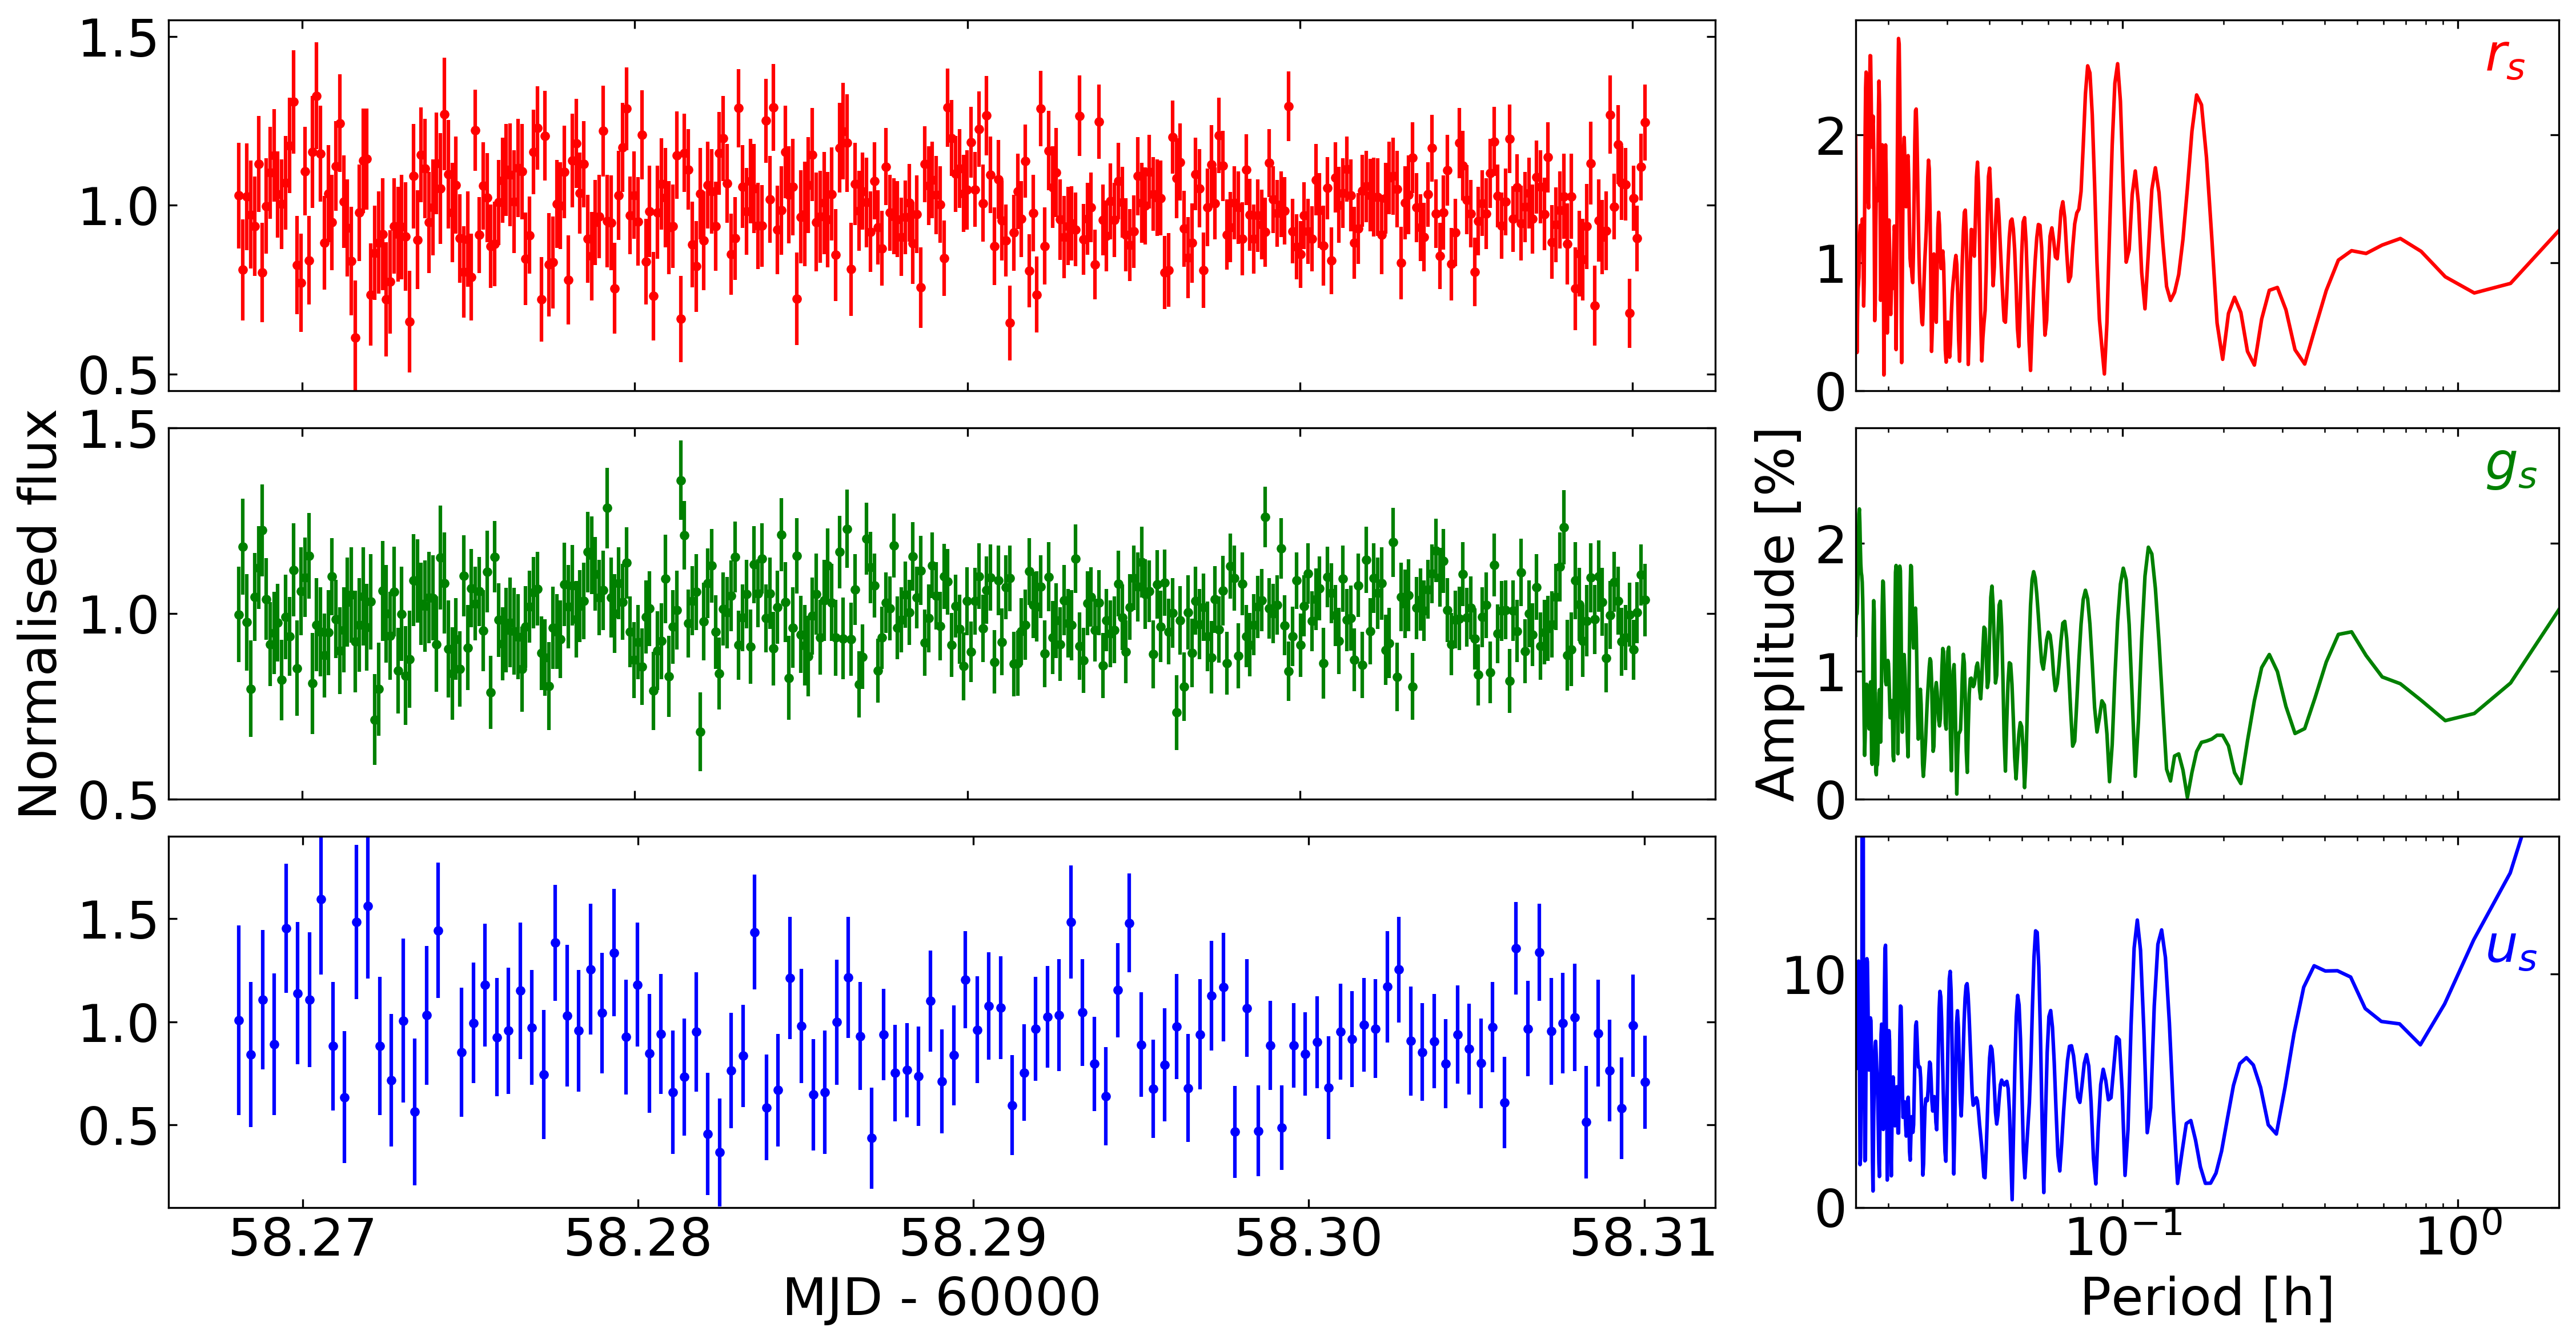
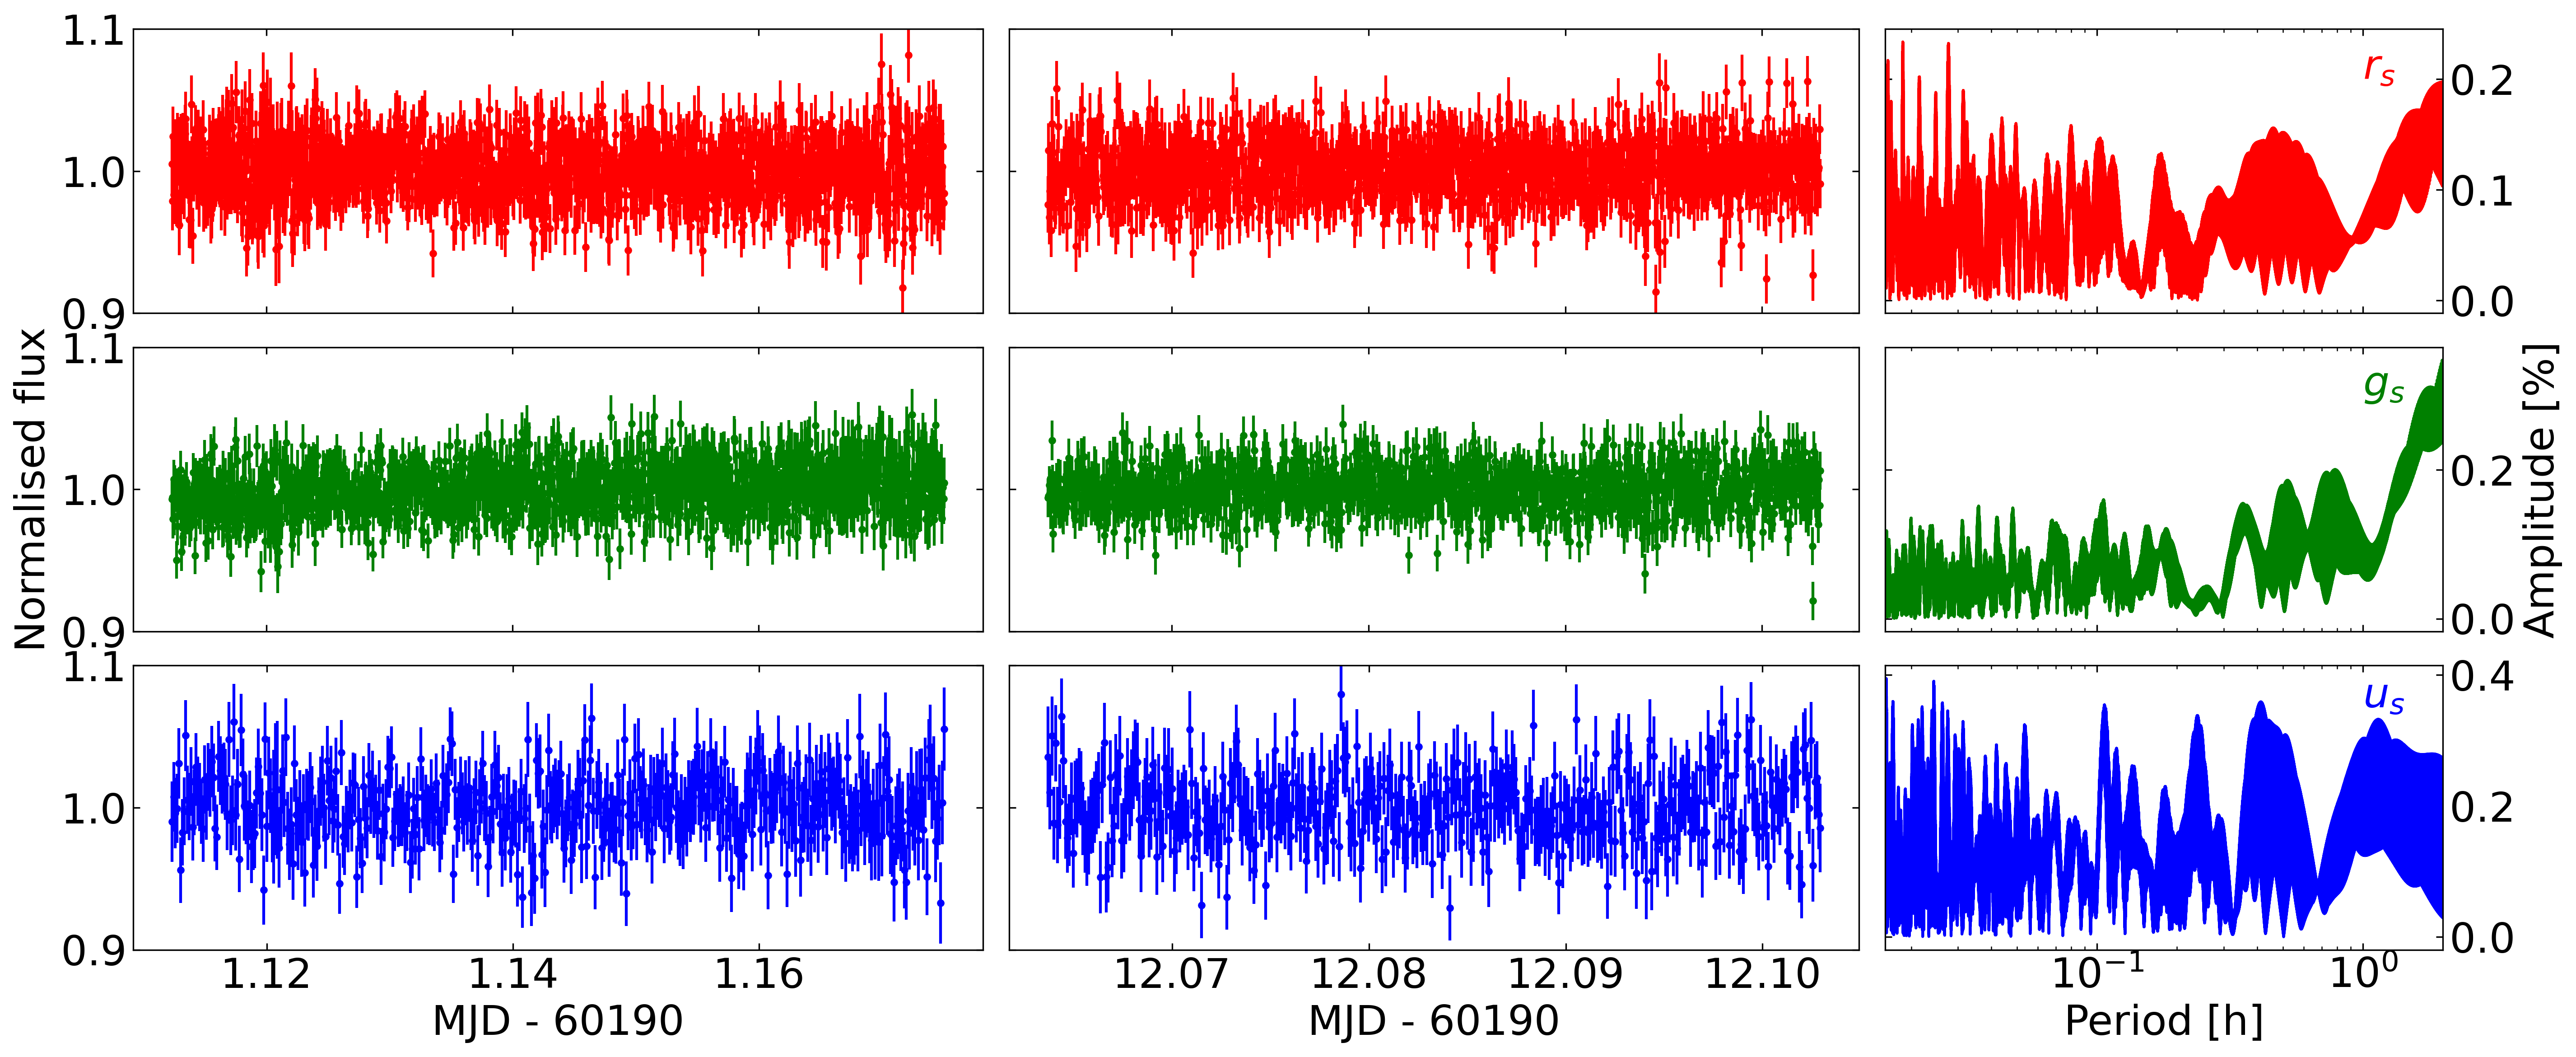
We observed WD J204259.71+152108.06 with ULTRACAM on two nights to probe for short-term variability, in both nights using , and filters. First we observed it for 1.5 hours on 2023 September 03, and then for an hour on 2023 September 14. The cadence was 4.04 s on the first night and 2.84 s on the second night in and bands, and three times that in the band. Figure 17 shows the light curves and periodograms for the data. We find no indication of periodic variability down to an amplitude of per cent. Similarly, in these short runs there is also no evidence for aperiodic variability. We conclude that WD J204259.71+152108.06 may show long-term aperiodic variability, as indicated by ATLAS and ZTF, but no periodic or short-term variability.
2.4 High-resolution radio imaging
To further test the association of our three spectroscopically confirmed white dwarfs with the VLASS radio sources, we sought higher resolution radio imaging which could yield more precise astrometry. The below-described radio data were all calibrated and imaged using standard routines in the Astronomical Image Processing System (AIPS; Greisen 2003)555http://www.aips.nrao.edu/index.shtml. All imaging was carried out using a Briggs robust value of 1, and all equatorial coordinates are on the ICRS.
To explore the radio sky around WD J121604.90-281909.67 at higher resolution, we applied for director’s discretionary time on the VLA (program code 23A-389; PI L. Chomiuk) while it was in its B configuration. Data were obtained over a half hour on 2023 April 28 in the X band (8–12 GHz), yielding 13 minutes on source. To image the field, the 4 GHz of bandwidth was split in two to yield two images centered at 8.9 and 11.0 GHz. The FWHM of the synthesized beam in the 8.9 GHz image is (PA ) and 1 noise of 11 Jy beam-1. At 11.0 GHz, the beam FWHM is (PA ) with a 1 noise of 11 Jy beam-1. In both images, the radio source is consistent with a point source at a position of RA = 12h16m04.7963s, Dec = ; at 8.9 GHz it has a flux density of mJy, while at 11.0 GHz the flux density is mJy. Comparing these measurements with the VLASS flux densities implies a relatively steep radio spectrum ( where ), as expected for optically thin synchrotron emission. Taking the Gaia astrometric parameters and advancing them to the epoch of this radio observation, WD J121604.90-281909.67 would have a position of RA = 12h16m04.8437s, Dec = , separated from the radio source by 0.63". The complex gain calibrator used in our VLA observation (1209241) has a position accuracy code of A, implying that its position is known to . A positional accuracy of about a tenth of the synthesised beam’s FWHM should therefore be attainable at the field’s phase centre where WD J121604.90-281909.67 is located666https://science.nrao.edu/facilities/vla/docs/manuals/oss/performance/positional-accuracy. We conclude that the separation between the white dwarf and the radio source is significantly larger than the uncertainty on the position of the radio source or the white dwarf, implying that the radio source is unlikely to be associated with the white dwarf (and probably attributable to an optically faint background galaxy).
To further investigate WD J182050.14+110832.09, we downloaded archival data from the pre-upgrade Very Large Array, obtained in the X band (8.5 GHz) using the VLA’s A configuration under program code AM623 (PI S. Myers). The data were obtained on 1999 Aug 17.3, with just 43 seconds integrated on source and the radio source located very near the phase centre (1.4 arcsec away). The resulting image has a synthesised beam FWHM of (PA ) and 1 noise of 0.23 mJy beam-1. The radio source is consistent with a point source and has a flux density of 24.7 mJy, significantly brighter than the VLASS flux measurements (Table 1). This may imply that the radio spectrum is inverted (increasing to high frequency; ) as expected for emission that is partially optically thick, but it may also be explained with variability (there is significant variability measured between VLASS Epochs 1 and 2; Table 1). The radio source is located at RA = 18h20m50.1090s, Dec = . Accounting for the proper motion measured by Gaia, WD J182050.14+110832.09 would have a position of RA = 18h20m50.1384s, Dec = at the epoch of the radio observations. Therefore, the separation between the white dwarf and the radio source is . The complex gain calibrator used in this VLA observation (1824114) has a position accuracy code of B, implying that its position is known to . Hence, the uncertainty on the position is probably best given as 0.1 FWHM of the synthesised beam (). As the separation between the white dwarf and radio source is significantly larger than the uncertainty on either position, we conclude that the radio source is probably not associated with the white dwarf and is a rather a chance near-coincidence.
Higher resolution observations of WD J204259.71+152108.06 were found in the NRAO archive, observed with the A configuration of the Jansky VLA on 2019 Sep 12.0, using the C band (4–8 GHz) under program code SB072. A field including WD J204259.71+152108.06 was observed in a single 103-s long scan, with the white dwarf position offset from the phase centre by (this is relatively far out in the C-band primary beam, whose half-power point is from the phase centre at 5 GHz and at 7.1 Hz). To image, we split the 4 GHz of bandwidth in two halves to yield two images centred at 5.0 and 7.1 GHz. The images were created with faceting to correct for wide-field effects, and were primary-beam corrected before measuring the source’s flux density. At 5 GHz, the resulting synthesised beam has FWHM of (PA ) and 1 noise of 29 Jy beam-1, while at 7.1 GHz the point spread function’s dimensions are (PA ) with 1 noise of 32 Jy beam-1. The radio source is detected at high significance and is consistent with a point source in both images at a position of RA = 20h42m59.7254s, Dec = . At 5.0 GHz, we measure a flux density of mJy, and at 7.1 GHz, the flux density is mJy. When compared with the VLASS flux densities measured at 3 GHz, the radio spectrum appears to be marginally steep to flat (). Accounting for the Gaia proper motion, WD J204259.71+152108.06 would have a position of RA = 20h42m59.731s, Dec = at the time of these radio observations, offset from the position of the radio source by .
This is the smallest optical–radio separation of the sources considered in this paper, but does it imply that the radio source and white dwarf are associated? The Gaia parameter RUWE is very large for this source (7.3), implying a poor astrometric solution, although it is not simple to quantify the resulting positional uncertainty. The position of the complex gain calibrator used for the radio position 2031+123 is accurate to . As previously discussed, while a positional accuracy of about a tenth of the synthesised beam’s FWHM is possible, this accuracy is only reached at the field’s phase centre. In these high-resolution VLA observations, the white dwarf is located rather far out in the primary beam and errors on position grow with distance from the phase centre777https://science.nrao.edu/facilities/vla/docs/manuals/oss/performance/positional-accuracy. Given the significant but poorly defined uncertainties on both the Gaia and radio astrometry of this source, we consider it possible that the white dwarf and the radio source are associated.
To assess the variability of the radio source potentially associated with WD J204259.71+152108.06, we downloaded lower-resolution VLA observations obtained in the B configuration and the L band (1–2 GHz) under program code 20A-439 (PI S. Bruzewski). The observation was obtained on 2020 Oct 9 and yielded 60 minutes on source at the same pointing centre as the C band observations (but as the L-band primary beam is larger — FWHM = at 1.5 GHz — this location is less far out in the primary beam). For imaging, we split the bandwidth in two halves, yielding images at 1.36 GHz (synthesised beam FWHM ) and 1.83 GHz (synthesised beam FWHM ). The observation-averaged flux density is mJy at 1.36 GHz and mJy at 1.83 GHz. To look for variability over this observation, we separately imaged the five 12-minute-long observation scans. We see no evidence for significant variations in the flux density. For comparison, the white dwarf pulsar AR Sco shows factor of 2 variability over the course of its 3.56 h orbital period (Stanway et al., 2018), which would have been easily detectable in this radio observation.
Because AR Sco’s radio emission is highly circularly polarised during some phases of its orbit (Stanway et al., 2018), we investigated Stokes images of WD J204259.71+152108.06. The 7.1 GHz image yields a non-detection in Stokes , implying a 3 upper limit on the circular polarisation fraction of . At 5.0 GHz, there is a low-significance (5) Stokes positive signal at the position of the Stokes source, implying circular polarisation at the level of . We however caution that this estimate is likely affected by circular beam squint, due to the fact that we are observing relatively far out in the primary beam, which can lead to uncertainties of few percent888https://science.nrao.edu/facilities/vla/docs/manuals/obsguide/modes/pol. The lower-frequency observation yielded detections of negative (right-handed) Stokes V signal, implying circular polarisation fractions of at 1.36 GHz and at 1.83 GHz.
2.5 Time-series spectroscopic analysis
For WD J204259.71+152108.06, which showed evidence of a cool M-dwarf companion star and a potentially consistent astrometric position between the white dwarf and the radio emission, we obtained time-series spectroscopy with SOAR at moderate resolution, encompassing 61 spectra taken on 9 nights over a time span of 132 d. We derived barycentric radial velocities for these spectra through cross-correlation with a synthetic M dwarf template with K in the region of the Na 1 doublet at 8190 Å.
We fit these velocities using the custom Markov Chain Monte Carlo sampler TheJoker (Price-Whelan et al., 2017), finding an excellent fit (r.m.s. = 4.2 km s-1) to a circular model with binary period d, BJD time of ascending node of the white dwarf d, semi-amplitude km s-1, and systemic velocity = km s-1, with all uncertanties listed as estimates. This fit is plotted with the data in Figure 8. No other period has posterior support, and all parameters are well-constrained. Allowing a non-zero eccentricity does not improve the fit quality and the posterior of the eccentricity parameter is strongly peaked at zero; hence, we retain the circular fit as our best model.
The binary mass function ,
| (3) |
for mass ratio and inclination , has a measured value of . Unfortunately, this value provides not much more than a consistency check: for a M-dwarf secondary and a white dwarf primary, the inferred inclination is around , but a broad range of inclinations and secondary masses are consistent with the mass function and the uncertain white dwarf mass of , excepting perhaps face-on () orbits. Given the estimated M dwarf radius of , eclipses of the white dwarf would only be expected for exceptionally edge-on () orbits, so the observed lack of eclipses does not meaningfully constrain the inclination. In fact, the lack of photometric signature on the orbital period (Section 2.3) is unsurprising, as no significant irradiation or tidal effects are expected.
Overall, the optical spectroscopy for WD J204259.71+152108.06 is fully consistent with a white dwarf–M-dwarf binary with a circular, 4.15 d orbit. Such a wide orbit implies that there is no mass transfer in the system, as the M-dwarf would not fill its Roche lobe (which would be R☉ for this period and typical M dwarf masses). In other words, WD J204259.71+152108.06 is not a CV.

2.6 X-ray Observations and Analysis
With the nature of WD J204259.71+152108.06 yet unclear, we also analysed X-ray data for this system. An XMM-Newton observation was performed on 2019 May 20. Here we discuss only the EPIC/pn data, taken with the medium filter. We use standard products from the XMM-Newton pipeline, yielding a total on-source time of ksec.
We fit the pn data with a power-law model over the energy range 0.4–10 keV in Xspec, allowing a free absorption component from the Tuebingen absorption model (TBabs). We find that this model provides an excellent fit to the data, with a photon index and of cm-2 (90% confidence intervals for both parameters), with /d.o.f. = 97/101. The unabsorbed flux from this model is erg s-1 cm-2.
We also examined the standard products pn light curve, and find that there is no evidence for substantial variability. In detail, we used the lcstats tool to produce re-binned light curves on a variety of timescales from the initial binning of 1.46 seconds to a light curve rebinned by a factor of 256 to 373.76 seconds. In all cases, the excess variance (i.e., the variance after subtracting the variance expected due to Poisson noise) is approximately zero. At a binning of 1.46 seconds, the 3 upper limit on rms fractional variation is 18%, while at 373.76 seconds, the 3 upper limit on variability is 4.1%. We examined the source’s power spectrum with a range of binnings and found no statistically significant bins.
3 Discussion
3.1 The paucity of bright radio emission from white dwarfs
Out of the initial 13 matches between the Gaia white dwarf candidate catalogue and VLASS, we find that at least seven are chance alignments. Five were found to be chance alignments from analysis of deep optical images from DECam and Pan-STARRS, which revealed the radio source to be a background faint source rather than the candidate white dwarf. The remaining two chance alignments could only be revealed with high-resolution radio imaging that provided more precise radio coordinates, which were found to be inconsistent with the position of two now confirmed white dwarfs (WD J121604.90-281909.67 and WD J182050.14+110832.09). Three additional matches could also be chance alignments; for those, the candidates were found to be main sequence stars rather than white dwarfs (WD J083802.17+145802.98, WD J120358.90-001241.07, and WD J124520.10-351755.53) and were removed from our analysis. WD J120358.90-001241.07 has the largest separation between radio and optical coordinates in the sample, hence the association between the radio emission and the main sequence star is indeed rather unlikely. The separations are much smaller for WD J083802.17+145802.98 () and WD J124520.10-351755.53 (), the latter of which actually shows the smallest separation between optical and VLASS positions in all the sample. Determining whether these two main sequence stars are indeed radio emitters is outside the scope of this work. Additionally, two out of the 13 candidate white dwarfs with a radio match were found to be quasars.
| Name | Chance coincidence | Spectroscopic class | Verdict |
|---|---|---|---|
| WDJ032623.40-243623.72 | Yes | - | Candidate white dwarf is not a radio source. |
| WDJ083802.17+145802.98 | - | FGK | Candidate is not a white dwarf. |
| WDJ105211.93-335559.93 | No | QSO | Candidate is not a white dwarf. |
| WDJ105223.24+313012.81 | No | QSO | Candidate is not a white dwarf. |
| WDJ120358.90-001241.07 | - | FGK star | Candidate is not a white dwarf. |
| WDJ121604.90-281909.67 | Yes | WD | Candidate is a white dwarf, but not a radio source, |
| as revealed by high-resolution radio imaging. | |||
| WDJ124520.10-351755.53 | - | FGK star | Candidate is not a white dwarf. |
| WDJ132423.32-255746.37 | Yes | - | Candidate white dwarf is not a radio source. |
| WDJ182050.14+110832.09 | Yes | WD | Candidate is a white dwarf, but not a radio source |
| as revealed by high-resolution radio imaging. | |||
| WDJ182112.17+204801.17 | Yes | - | Candidate white dwarf is not a radio source. |
| WDJ183758.54-330258.93 | Yes | - | Candidate white dwarf is not a radio source. |
| WDJ185250.55-310839.29 | Yes | - | Candidate white dwarf is not a radio source. |
| WDJ204259.71+152108.06 | No | WD+M | Uncertain – see text |
This left only one white dwarf (WD J204259.71+152108.06) from Gentile Fusillo et al. (2021) with radio emission detected in VLASS. These results are summarised in Fig. 9 and Table 2. There are 846k white dwarf candidates in the sky region covered by VLASS (dec ), suggesting an extremely low (%) incidence of 3 GHz radio emission above 3 mJy from white dwarfs. This is perhaps not surprising considering that the only known types of white dwarf radio emitters are either not included in the colour-magnitude selection of Gentile Fusillo et al. (2021), as is the case for white dwarf pulsars and magnetic propellers (see Fig. 1), or might be excluded due to their properties. The latter case refers to CVs, which can have poor astrometric solutions due to variability and hence not pass the quality criteria of Gentile Fusillo et al. (2021) (see their section 2.1). Additionally, depending on the contribution of the main sequence companion and of the accretion disc, they might be outside the region selected by Gentile Fusillo et al. (2021) (see, e.g., figure 2 in Abril et al., 2020), whose main goal was to identify single white dwarfs. Some CVs might be included in Gentile Fusillo et al. (2021)’s selection and not be detected by VLASS, given that typical flux densities are of the order of 0.1 mJy (Coppejans et al., 2015, 2016).
If we consider also the possibility of Jupiter–Io-like emission, which has never been detected from white dwarfs but has been explored in published models (Willes & Wu, 2004, 2005), the detection threshold and frequency of VLASS might also introduce a barrier. The predicted flux densities at 3 GHz are, at most, 0.01 mJy (see Figure 5 in Willes & Wu, 2004), well below VLASS’s threshold.
3.2 The nature of WD J204259.71+152108.06
The only system in our search for which we could not rule out that the white dwarf and radio source are associated was WD J204259.71+152108.06. Spectroscopic follow-up has showed this to be a white dwarf and M dwarf binary, where the white dwarf has a mass of M☉ and the companion is consistent with M2.5 type. Time-series spectroscopy has showed that the period is 4.15 days, much too long for a CV, from which radio emission could be expected.
Follow-up high-speed optical photometry revealed no pulses that could be associated with emission on the spin of the white dwarf, as seen for white dwarf pulsars like AR Sco. We also did not detect flaring activity, expected from magnetic propellers like AE Aqr. In fact, there is no indication of short-term or periodic optical variability, only long-term variability of the order of 0.2 mag in timescales of months to years. Variation on the orbital period is not expected given the relatively long period.
Ruling out a CV, a white dwarf pulsar, and a magnetic propeller excludes all possible radio emission channels that have been previously observed for white dwarfs. The possibility of a Jupiter-Io system is also very unlikely considering the predictions of Willes & Wu (2004) for peak radio emission. Additionally, we do not find the radio emission to be strongly circularly polarised, which would be expected if the emission were due to the electron cyclotron maser mechanism.
Another possibility is that the radio emission can be attributed to the M dwarf itself. Low-frequency radio emission has been found to be ubiquitous across the M-dwarf main sequence (Hallinan et al., 2008; Callingham et al., 2021). The mechanism for emission is believed to be electron cyclotron maser from the low-density regions above the star’s magnetic poles (Hallinan et al., 2006, 2008). The possibility that the radio emission in WD J204259.71+152108.06 can be attributed to magnetic activity of the M-dwarf can be tested from X-ray observations. Observations have shown that X-ray luminosity of active M-dwarfs rarely exceeds times the bolometric luminosity (see e.g. Magaudda et al., 2022, in particular the right panel of fig. 8). The analysis of XMM-Newton data in Section 2.6 found a 0.4–10 keV X-ray flux of erg s-1 cm-2. We note the X-ray flux from an independent archival Swift/XRT measurement in the 1SXPS catalog is very similar (Evans et al., 2014), suggesting that this is an accurate measurement of the source’s X-ray flux. The binary has a 2MASS mag (Skrutskie et al., 2006), which unlike the optical or ultraviolet flux should be dominated by the M-dwarf. Assuming a -band bolometric correction of 2.61 mag, typical of M2.5 dwarfs (e.g. Pecaut & Mamajek, 2013; Mann et al., 2015), we estimate a bolometric flux of erg s-1 cm-2, giving a distance-independent . While the exact value is dependent on the X-ray band and bolometric corrections used, this is at least two orders of magnitude larger than expected for chromospheric emission from the M dwarf. Hence chromospheric emission can be ruled out as the primary source of the X-ray emission.
One important factor for WD J204259.71+152108.06 is that, even though it has a large and highly significant Gaia parallax ( mas), the astrometric fit is rather poor (RUWE=7.3), implying that the parallax may not be accurate. A large RUWE value indicates that the photocentre of the source has wobbled during the timespan of the Gaia observations. Likely reasons are variability, multiplicity, or background sources. Variability is unlikely to play a role, as the source is not variable enough to be flagged as such by Gaia. Although WD J204259.71+152108.06 is a binary, its separation is expected to be too small to cause a large wobble—the projected separation at 180 pc would be a mere 0.3 mas, lower than the per epoch astrometric accuracy expected for a Gaia source of its brightness (Holl et al., 2023). Conceivably, the unusual nature of the binary, with two components with extremely different intrinsic colors that cross over in brightness within the Gaia band, together with a barely resolved semi-major axis, could lead to a poor astrometric solution, but this is speculative.
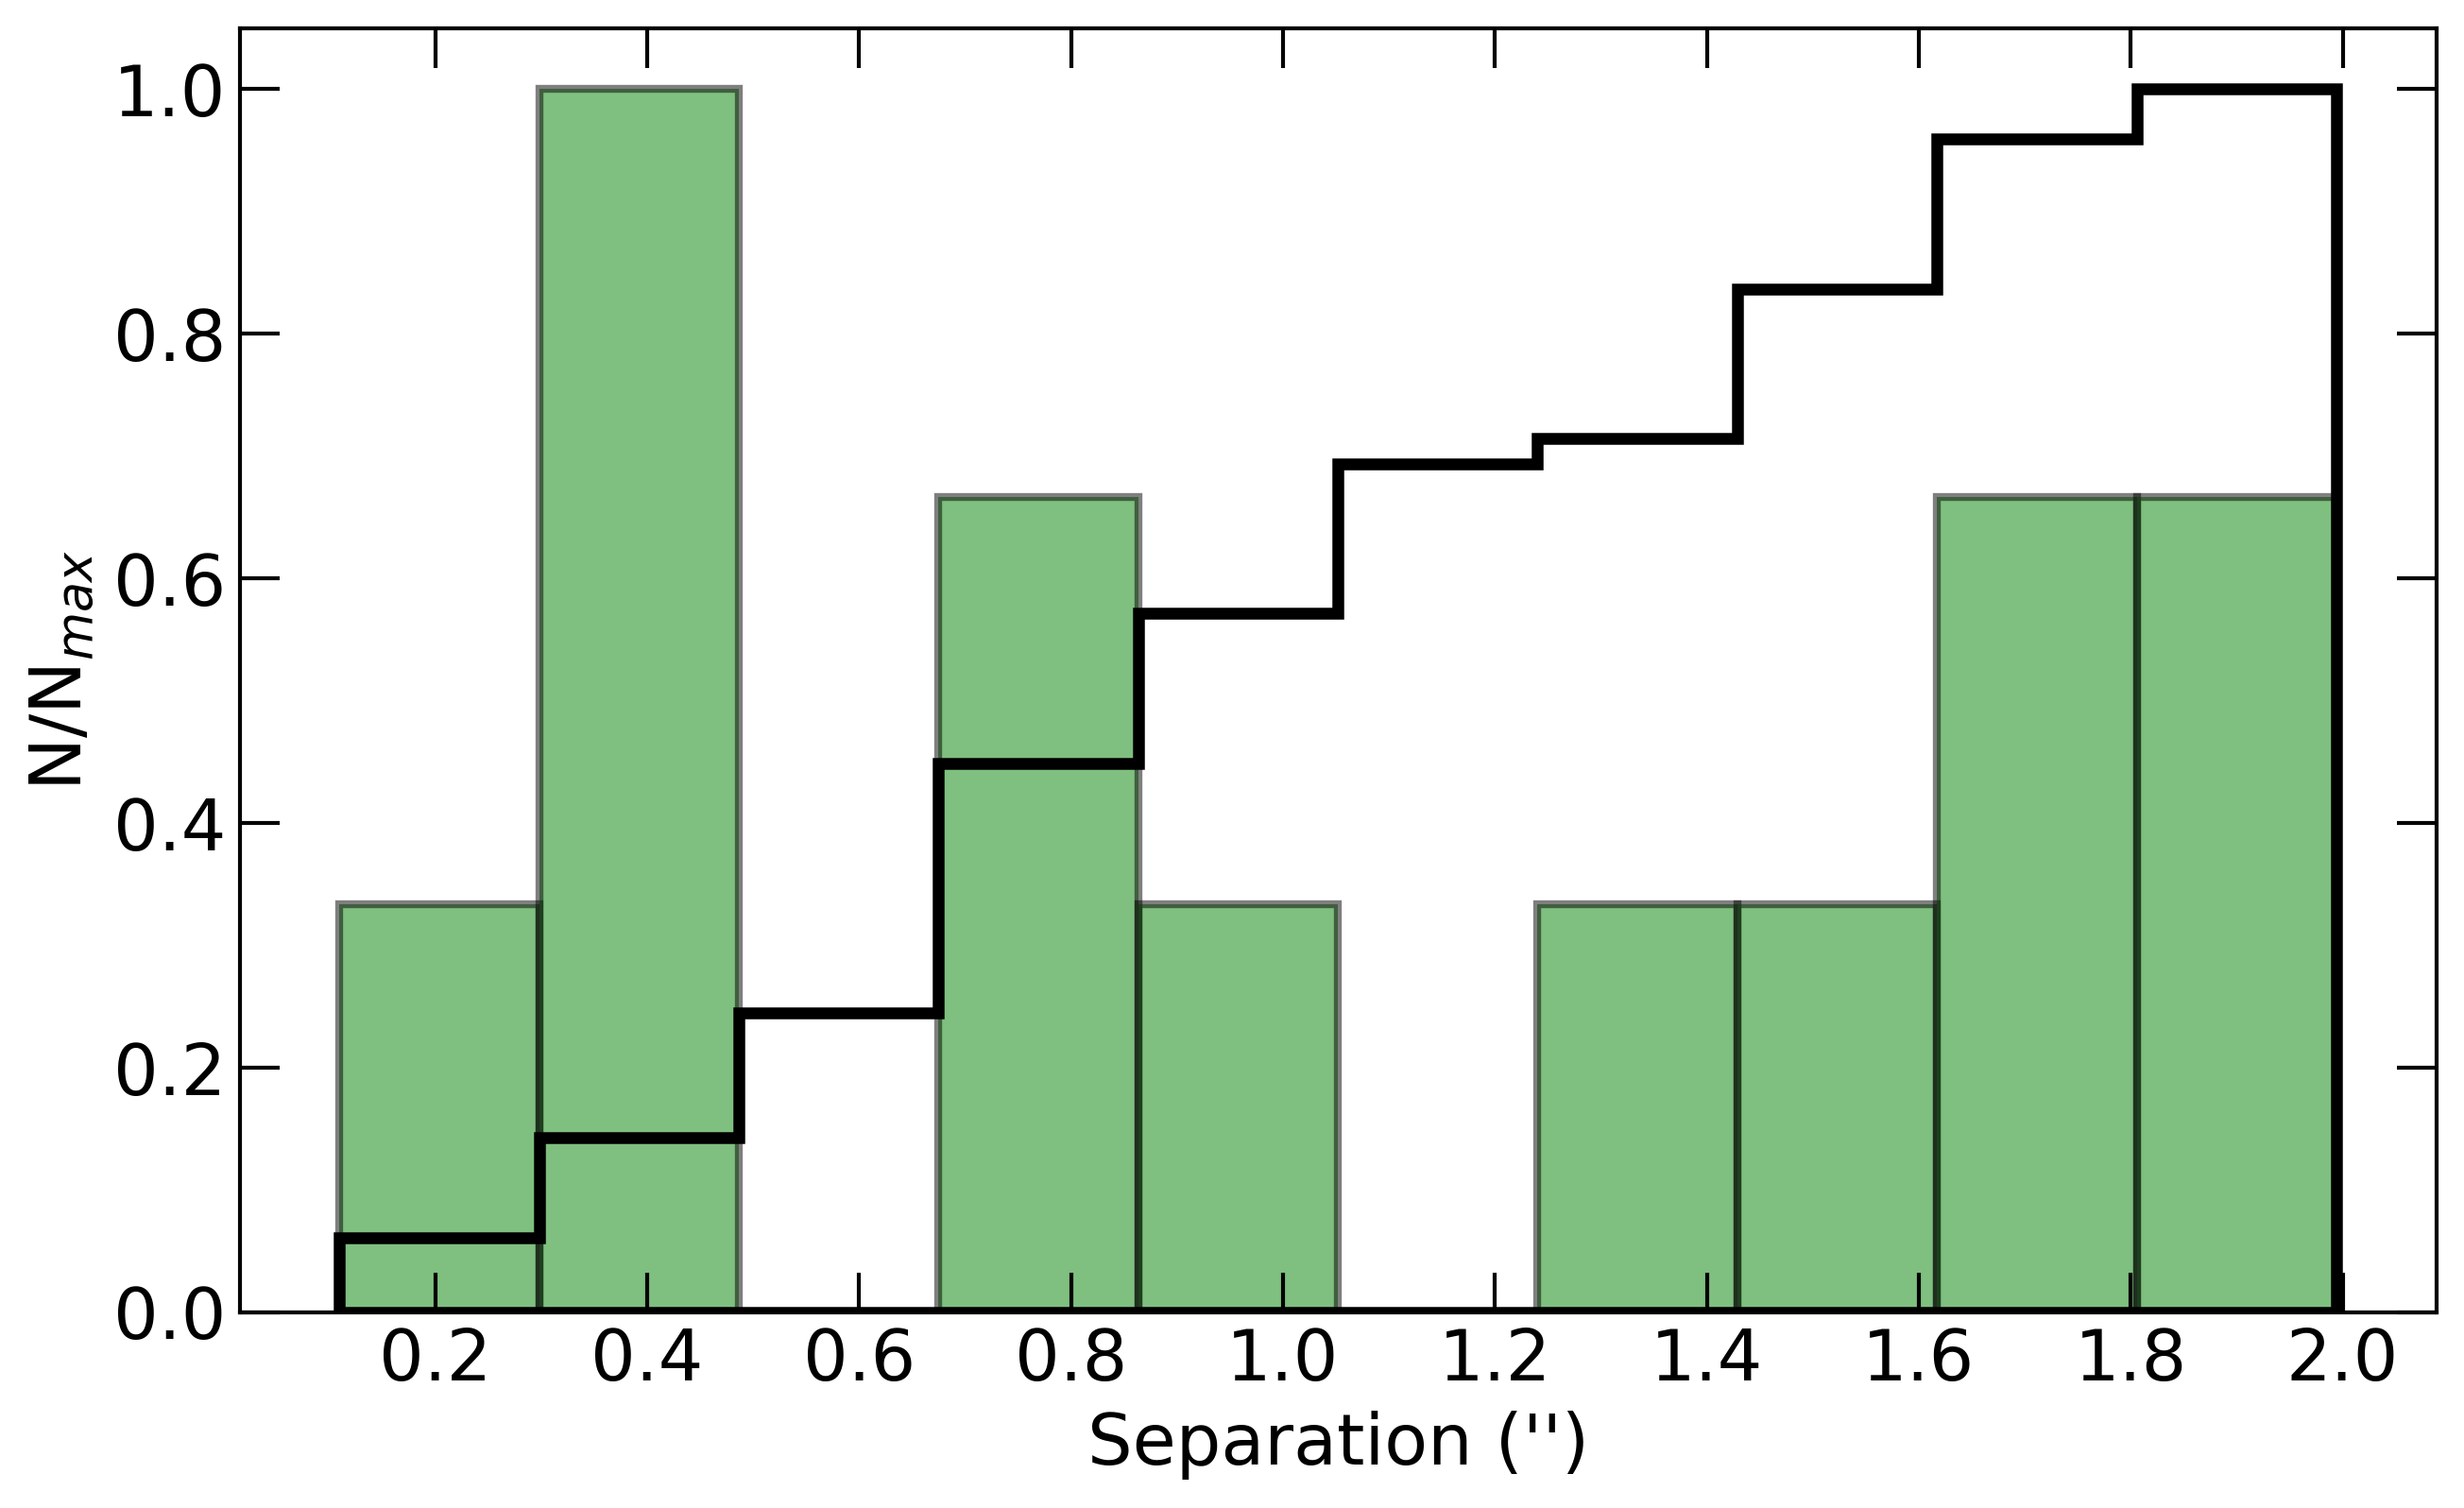
To estimate the probability of a chance alignment with a background source, we follow an approach similar to that of Lépine & Bongiorno (2007): we repeat the match between the white dwarf candidate catalogue and VLASS, displacing the VLASS right ascension by an amount . This removes any real matches, but preserves chance alignments. Given the low spatial density of sources in the catalogues, a single always results in a low () number of matches. Hence, to obtain a statistically significant sample of chance alignments, we used many values of ( in steps, in steps, in steps) and combined all resulting matches. This results in the chance alignment distribution shown in Figure 10. As expected, the number of chance alignments increases with separation. Six out of 248 mock-matches show separations like WD J204259.71+152108.06, hence we estimate the chance alignment probability to be per cent (uncertainties were calculated via bootstraping). Therefore, we cannot rule out an unfortunate chance alignment between WD J204259.71+152108.06 and a background source that would account for the radio and X-ray emission, and could potentially also contribute sufficient optical emission to affect the Gaia astrometry. We note, however, that there is an excess of sources at small separation between optical and radio (Fig. 10), perhaps implying that some of these sources are real associations.
One way to check the chance alignment scenario is to use the expected proper motion of the white dwarf–M dwarf binary, which should have been more separated from a putative background source in the past. We inspected images from the Digitized Sky Survey (DSS)999https://irsa.ipac.caltech.edu/data/DSS/, which date back to the 1950s, to check whether there is indication of another source near the position of the binary. In these images, assuming the proper motions reported by Gaia are accurate and apply to the binary, there would be a offset between the binary and a fixed background source. Fig. 11 shows a DSS cutout with the coordinates at the DSS and Gaia epochs indicated. There is no detection of a background source, but given the resolution of the image of per pixel, comparable to the expected separation, it is not possible to rule out that the two sources are confused in the DSS image. Therefore, a chance alignment remains a possibility.

Assuming that the Gaia parallax of WD J204259.71+152108.06 is accurate would imply a distance of pc. This distance gives mag, corresponding to an untenably cooler star than we infer from optical spectroscopy, more like an M5V (e.g. Pecaut & Mamajek, 2013; Cifuentes et al., 2020). The latter paper suggests a typical for an M2.5V, which would imply a distance pc. Similarly for the white dwarf, we can rely on the magnitude to estimate a parallax-independent distance. SDSS reports , and at our derived values of and , cooling models suggest (Bédard et al., 2020), implying a distance of also pc. Not only is this distance over a factor of two larger than the parallax distance, it is also significantly larger than the distance inferred by our spectroscopic fit ( pc). This suggests there is additional flux contributing to the spectrum, which could be due to a contaminating background source. The residuals from our spectroscopic fit show no significant slope or features, so any additional flux would likely have no strong features (such as a BL Lacertae-type blazars). The WISE photometry for WD J204259.71+152108.06 (Cutri et al., 2021) gives and , potentially redder than expected for a single M dwarf (Theissen & West, 2014), which could be consistent with the contribution of a background blazar. On the other hand, there is no detection in WISE band , which is unusual for blazars detected in the other WISE bands and with red colours (e.g., Massaro & D’Abrusco 2016). In addition, we note that WD J204259.71+152108.06 is located 3.7′ from a Fermi-LAT GeV -ray source (Abdollahi et al., 2022). As the Fermi source has a 95% positional semi-major axis of 2.7′, there is probably no relationship between the -ray source and WD J204259.71+152108.06. However, if a future Fermi-LAT data release showed a refined position more consistent with our potential optical blend, then that would make the presence of a background blazar more likely.
Overall, a background source could explain the poor astrometric fit and the possible additional flux in the spectra. It could also be responsible for the observed long-term variability. The inferred radio spectral index of is not atypical for radio galaxies (e.g. Zajaček et al., 2019). Similarly, the X-ray photon index of photon index , although higher than the average value for quasars of , is not unseen for low-redshift quasars (e.g. Shehata et al., 2021).
Given how bright the source is in the radio, future very long baseline interferometric observations should be able to pin down its radio position with sufficiency accuracy to definitively rule out or confirm its association with the white dwarf–M dwarf binary.
4 Summary and Conclusions
We performed a cross-match between the white dwarf candidate catalogue of Gentile Fusillo et al. (2021) and VLASS (Gordon et al., 2020, 2021), identifying 13 sources that matched within . Two of the white dwarf candidates turned out to be quasars according to spectroscopy, and three were found to be main sequence stars. Of the remaining eight sources, five were found to be chance alignments through analysis of deeper optical images, and two were found to be chance alignments with a white dwarf using higher resolution radio imaging. The only source for which the association between the Gaia optical source and the radio stood up to scrutiny was WD J204259.71+152108.06.
This source was found to be a binary system with a white dwarf and an M-dwarf on a 4.1-day orbit, too wide for significant mass-transfer that could explain radio emission like that seen for CVs. We found no short-term variability that could associate this source with radio-emitting white dwarf pulsars or magnetic propellers. The lack of circular polarisation additionally rules out electron cyclotron maser from a Jupiter-Io analogue. The radio and X-ray properties of the source are consistent with a quasar, and we do find evidence for additional flux in our spectra that could be due to a background source. However, we find the probability of chance alignment to be low (%) given the small () separation between the radio and optical coordinates. Additionally, archival DSS images where the position of the binary would be shifted by from a static background source reveal no evidence of a resolved source, but the low resolution of the DSS images () makes decisive conclusions difficult.
WD J204259.71+152108.06 could therefore be explained by a near-perfect chance alignment with a background radio source, although the lack of detection of this source in archival images as well as the low probability of such an alignment remain a puzzle. Future long-baseline radio observations can settle the matter definitively. With at most one (and quite possibly zero) genuine radio-emitting white dwarfs found in VLASS, our main conclusion is that radio emission from white dwarfs outside of interacting binaries, at least at 3 GHz and with fluxes mJy, is extremely rare to non-existent.
Acknowledgements
This work was conceived of and initiated at the KITP program “White Dwarfs as Probes of the Evolution of Planets, Stars, the Milky Way and the Expanding Universe", which was supported in part by the National Science Foundation under Grant No. NSF PHY-1748958. We are grateful to the organisers of this program for spurring new collaborations.
This research was partially supported by the Munich Institute for Astro-, Particle and BioPhysics (MIAPbP) which is funded by the Deutsche Forschungsgemeinschaft (DFG, German Research Foundation) under Germany´s Excellence Strategy – EXC-2094 – 390783311. IP thanks the organisers and participants of the MIAPbP workshop Stellar Magnetic Fields from Protostars to Supernovae for helpful discussions, in particular Rob Kavanagh and Antonino Lanza.
IP acknowledges support from a Warwick Astrophysics prize post-doctoral fellowship, made possible thanks to a generous philanthropic donation, and from a Royal Society University Research Fellowship (URF\R1\231496).
LC is grateful for support from the National Science Foundation (under grants AST-1751874, AST-2107070, and AST-2205628) and NASA (under grant 80NSSC23K0497).
JS acknowledges support from the Packard Foundation.
This project has received funding from the European Research Council (ERC) under the European Union’s Horizon 2020 research and innovation programme (Grant agreement No. 101020057).
TJM thanks the late Tom Marsh for useful discussions both about J204259.71+152108.06, and many other topics over the years.
KCD acknowledges support for this work provided by NASA through the NASA Hubble Fellowship grant HST-HF2-51528 awarded by the Space Telescope Science Institute, which is operated by the Association of Universities for Research in Astronomy, Inc., for NASA, under contract NAS5–26555.
VSD and ULTRACAM are funded by the Science and Technology Facilities Council (grant ST/V000853/1).
The National Radio Astronomy Observatory is a facility of the National Science Foundation operated under cooperative agreement by Associated Universities, Inc. Based on observations obtained at the Southern Astrophysical Research (SOAR) telescope, which is a joint project of the Ministério da Ciência, Tecnologia e Inovações (MCTI/LNA) do Brasil, the US National Science Foundation’s NOIRLab, the University of North Carolina at Chapel Hill (UNC), and Michigan State University (MSU). This research has made use of the International Variable Star Index (VSX) database, operated at AAVSO, Cambridge, Massachusetts, USA. We acknowledge with thanks the variable star observations from the AAVSO International Database contributed by observers worldwide and used in this research. This work has made use of data from the European Space Agency (ESA) mission Gaia (https://www.cosmos.esa.int/gaia), processed by the Gaia Data Processing and Analysis Consortium (DPAC,https://www.cosmos.esa.int/web/gaia/dpac/consortium). Funding for the DPAC has been provided by national institutions, in particular the institutions participating in the Gaia Multilateral Agreement. This research has made use of the CIRADA cutout service at http://cutouts.cirada.ca/, operated by the Canadian Initiative for Radio Astronomy Data Analysis (CIRADA). CIRADA is funded by a grant from the Canada Foundation for Innovation 2017 Innovation Fund (Project 35999), as well as by the Provinces of Ontario, British Columbia, Alberta, Manitoba and Quebec, in collaboration with the National Research Council of Canada, the US National Radio Astronomy Observatory and Australia’s Commonwealth Scientific and Industrial Research Organisation. This research uses services and data provided by the Astro Data Lab at NSF’s National Optical-Infrared Astronomy Research Laboratory. NOIRLab is operated by the Association of Universities for Research in Astronomy (AURA), Inc. under a cooperative agreement with the National Science Foundation.
For the purpose of open access, the author has applied a Creative Commons Attribution (CC-BY) licence to any Author Accepted Manuscript version arising from this submission.
Data Availability
All data analysed in this work can be made available upon reasonable request to the authors.
References
- Abdollahi et al. (2022) Abdollahi S., et al., 2022, The Astrophysical Journal Supplement Series, 260, 53
- Abril et al. (2020) Abril J., Schmidtobreick L., Ederoclite A., López-Sanjuan C., 2020, MNRAS, 492, L40
- Ahumada et al. (2020) Ahumada R., et al., 2020, ApJS, 249, 3
- Allard et al. (2013) Allard F., Homeier D., Freytag B., 2013, Mem. Soc. Astron. Italiana, 84, 1053
- Bailer-Jones et al. (2021) Bailer-Jones C. A. L., Rybizki J., Fouesneau M., Demleitner M., Andrae R., 2021, AJ, 161, 147
- Barrett et al. (2020) Barrett P., Dieck C., Beasley A. J., Mason P. A., Singh K. P., 2020, Advances in Space Research, 66, 1226
- Bastian et al. (1988) Bastian T. S., Dulk G. A., Chanmugam G., 1988, ApJ, 324, 431
- Bédard et al. (2020) Bédard A., Bergeron P., Brassard P., Fontaine G., 2020, ApJ, 901, 93
- Bellm et al. (2019) Bellm E. C., et al., 2019, PASP, 131, 018002
- Bookbinder & Lamb (1987) Bookbinder J. A., Lamb D. Q., 1987, ApJ, 323, L131
- Callingham et al. (2021) Callingham J. R., et al., 2021, Nature Astronomy, 5, 1233
- Capitanio et al. (2017) Capitanio L., Lallement R., Vergely J. L., Elyajouri M., Monreal-Ibero A., 2017, A&A, 606, A65
- Chambers et al. (2016) Chambers K. C., et al., 2016, arXiv e-prints, p. arXiv:1612.05560
- Cifuentes et al. (2020) Cifuentes C., et al., 2020, A&A, 642, A115
- Clemens et al. (2004) Clemens J. C., Crain J. A., Anderson R., 2004, in Moorwood A. F. M., Iye M., eds, Society of Photo-Optical Instrumentation Engineers (SPIE) Conference Series Vol. 5492, Ground-based Instrumentation for Astronomy. pp 331–340, doi:10.1117/12.550069
- Coppejans et al. (2015) Coppejans D. L., Körding E. G., Miller-Jones J. C. A., Rupen M. P., Knigge C., Sivakoff G. R., Groot P. J., 2015, MNRAS, 451, 3801
- Coppejans et al. (2016) Coppejans D. L., et al., 2016, MNRAS, 463, 2229
- Cutri et al. (2021) Cutri R. M., et al., 2021, VizieR Online Data Catalog, p. II/328
- Dhillon et al. (2007) Dhillon V. S., et al., 2007, MNRAS, 378, 825
- Dhillon et al. (2014) Dhillon V. S., et al., 2014, MNRAS, 444, 4009
- Drake et al. (2009) Drake A. J., et al., 2009, ApJ, 696, 870
- Drlica-Wagner et al. (2021a) Drlica-Wagner A., et al., 2021a, ApJS, 256, 2
- Drlica-Wagner et al. (2021b) Drlica-Wagner A., et al., 2021b, ApJS, 256, 2
- Dubus et al. (2018) Dubus G., Otulakowska-Hypka M., Lasota J.-P., 2018, A&A, 617, A26
- Evans et al. (2014) Evans P. A., et al., 2014, ApJS, 210, 8
- Gentile Fusillo et al. (2021) Gentile Fusillo N. P., et al., 2021, MNRAS, 508, 3877
- Gordon et al. (2020) Gordon Y. A., et al., 2020, Research Notes of the American Astronomical Society, 4, 175
- Gordon et al. (2021) Gordon Y. A., et al., 2021, ApJS, 255, 30
- Greisen (2003) Greisen E. W., 2003, in Heck A., ed., Astrophysics and Space Science Library Vol. 285, Information Handling in Astronomy - Historical Vistas. p. 109, doi:10.1007/0-306-48080-8_7
- Güdel (2002) Güdel M., 2002, ARA&A, 40, 217
- Hallinan et al. (2006) Hallinan G., Antonova A., Doyle J. G., Bourke S., Brisken W. F., Golden A., 2006, ApJ, 653, 690
- Hallinan et al. (2008) Hallinan G., Antonova A., Doyle J. G., Bourke S., Lane C., Golden A., 2008, ApJ, 684, 644
- Harayama et al. (2013) Harayama A., Terada Y., Ishida M., Hayashi T., Bamba A., Tashiro M. S., 2013, PASJ, 65, 73
- Holl et al. (2023) Holl B., et al., 2023, Astronomy and Astrophysics, 674, A10
- Katz (2017) Katz J. I., 2017, ApJ, 835, 150
- Koester (2010) Koester D., 2010, Mem. Soc. Astron. Italiana, 81, 921
- Kroupa (2001) Kroupa P., 2001, MNRAS, 322, 231
- Lacy et al. (2019) Lacy M., et al., 2019, VLASS Project Memo #13: Pilot and Quick Look Data Release (v2)
- Lauffer et al. (2018) Lauffer G. R., Romero A. D., Kepler S. O., 2018, MNRAS, 480, 1547
- Lépine & Bongiorno (2007) Lépine S., Bongiorno B., 2007, AJ, 133, 889
- Li et al. (1998) Li J., Ferrario L., Wickramasinghe D., 1998, ApJ, 503, L151
- Lindegren et al. (2021) Lindegren L., et al., 2021, A&A, 649, A4
- Luo et al. (2022) Luo A. L., Zhao Y. H., Zhao G., et al. 2022, VizieR Online Data Catalog, p. V/156
- Magaudda et al. (2022) Magaudda E., Stelzer B., Raetz S., Klutsch A., Salvato M., Wolf J., 2022, A&A, 661, A29
- Magnier et al. (2020) Magnier E. A., et al., 2020, ApJS, 251, 6
- Mann et al. (2015) Mann A. W., Feiden G. A., Gaidos E., Boyajian T., von Braun K., 2015, ApJ, 804, 64
- Marsh et al. (2016) Marsh T. R., et al., 2016, Nature, 537, 374
- Massaro & D’Abrusco (2016) Massaro F., D’Abrusco R., 2016, The Astrophysical Journal, 827, 67
- Meintjes & Venter (2005) Meintjes P. J., Venter L. A., 2005, MNRAS, 360, 573
- Nelemans et al. (2001) Nelemans G., Yungelson L. R., Portegies Zwart S. F., Verbunt F., 2001, A&A, 365, 491
- Padoan & Nordlund (2002) Padoan P., Nordlund Å., 2002, ApJ, 576, 870
- Patterson (1979) Patterson J., 1979, ApJ, 234, 978
- Pecaut & Mamajek (2013) Pecaut M. J., Mamajek E. E., 2013, ApJS, 208, 9
- Pelisoli et al. (2022) Pelisoli I., et al., 2022, MNRAS, 509, L31
- Pelisoli et al. (2023) Pelisoli I., et al., 2023, Nature Astronomy,
- Potter & Buckley (2018) Potter S. B., Buckley D. A. H., 2018, MNRAS, 481, 2384
- Pretorius et al. (2021) Pretorius M. L., et al., 2021, MNRAS, 503, 3692
- Price-Whelan et al. (2017) Price-Whelan A. M., Hogg D. W., Foreman-Mackey D., Rix H.-W., 2017, The Astrophysical Journal, 837, 20
- Prochaska et al. (2020) Prochaska J., et al., 2020, The Journal of Open Source Software, 5, 2308
- Ridder et al. (2023) Ridder M. E., Heinke C. O., Sivakoff G. R., Hughes A. K., 2023, MNRAS, 519, 5922
- Schreiber et al. (2021) Schreiber M. R., Belloni D., Gänsicke B. T., Parsons S. G., Zorotovic M., 2021, Nature Astronomy, 5, 648
- Schwope et al. (2023) Schwope A., Marsh T. R., Standke A., Pelisoli I., Potter S., Buckley D., Munday J., Dhillon V., 2023, A&A, 674, L9
- Shehata et al. (2021) Shehata S. M., Misra R., Osman A. M. I., Shalabiea O. M., Hayman Z. M., 2021, Journal of High Energy Astrophysics, 31, 37
- Skrutskie et al. (2006) Skrutskie M. F., et al., 2006, AJ, 131, 1163
- Stanway et al. (2018) Stanway E. R., Marsh T. R., Chote P., Gänsicke B. T., Steeghs D., Wheatley P. J., 2018, A&A, 611, A66
- Takata et al. (2017) Takata J., Yang H., Cheng K. S., 2017, ApJ, 851, 143
- Theissen & West (2014) Theissen C. A., West A. A., 2014, The Astrophysical Journal, 794, 146
- Thorstensen (2020) Thorstensen J. R., 2020, AJ, 160, 151
- Tody (1986) Tody D., 1986, in Crawford D. L., ed., Society of Photo-Optical Instrumentation Engineers (SPIE) Conference Series Vol. 627, Instrumentation in astronomy VI. p. 733, doi:10.1117/12.968154
- Tonry et al. (2018) Tonry J. L., et al., 2018, PASP, 130, 064505
- Toonen et al. (2017) Toonen S., Hollands M., Gänsicke B. T., Boekholt T., 2017, A&A, 602, A16
- Warner (1995) Warner B., 1995, Cataclysmic variable stars. Vol. 28
- Willes & Wu (2004) Willes A. J., Wu K., 2004, MNRAS, 348, 285
- Willes & Wu (2005) Willes A. J., Wu K., 2005, A&A, 432, 1091
- Woosley & Heger (2015) Woosley S. E., Heger A., 2015, ApJ, 810, 34
- Zajaček et al. (2019) Zajaček M., et al., 2019, A&A, 630, A83
- du Plessis et al. (2022) du Plessis L., Venter C., Wadiasingh Z., Harding A. K., Buckley D. A. H., Potter S. B., Meintjes P. J., 2022, MNRAS, 510, 2998
Appendix A Periodograms of long-term photometric data
Appendix B Follow-up photometric data