Asgard/NOTT: L-band nulling interferometry at the VLTI
II. Warm optical design and injection system
Abstract
Asgard/NOTT (previously Hi-5) is a European Research Council (ERC)-funded project hosted at KU Leuven and a new visitor instrument for the Very Large Telescope Interferometer (VLTI). Its primary goal is to image the snow line region around young stars using nulling interferometry in the L’-band (3.5 to 4.0) µm, where the contrast between exoplanets and their host stars is advantageous. The breakthrough is the use of a photonic beam combiner, which only recently allowed the required theoretical raw contrast of in this spectral range. Nulling interferometry observations of exoplanets also require a high degree of balancing between the four pupils of the VLTI in terms of intensity, phase, and polarization. The injection into the beam combiner and the requirements of nulling interferometry are driving the design of the warm optics and the injection system. The optical design up to the beam combiner is presented. It offers a technical solution to efficiently couple the light from the VLTI into the beam combiner. During the coupling, the objective is to limit throughput losses to 5 % of the best expected efficiency for the injection. To achieve this, a list of different loss sources is considered with their respective impact on the injection efficiency. Solutions are also proposed to meet the requirements on beam balancing for intensity, phase, and polarization. The different properties of the design are listed, including the optics used, their alignment and tolerances, and their impact on the instrumental performances in terms of throughput and null depth. The performance evaluation gives an expected throughput loss 6.4 % of the best efficiency for the injection and a null depth of 2., mainly from optical path delay errors outside the scope of this work.
Germain Garreaua111germain.garreau@kuleuven.be,
Azzurra Bigiolia,
Romain Laugiera,
Gert Raskina,
Johan Morrena,
Jean-Philippe Bergerb,
Colin Dandumontc,
Harry-Dean Kenchington Goldsmithd,
Simon Grosse,
Michael Irelandd,
Lucas Labadief,
Jérôme Loicqc,g,
Stephen Maddend,
Guillermo Martinb,
Marc-Antoine Martinoda,
Alexandra Mazzolic,
Ahmed Sannye,f,
Hancheng Shaod,
Kunlun Yand, and
Denis Defrèrea
aKU Leuven, Institute of Astronomy, Leuven, Belgium
bUniversity of Grenoble Alpes/CNRS, IPAG, Grenoble, France
cUniversity of Liège, STAR Institute, Liège, Belgium
dAustralian National University, Research School of Astronomy and Astrophysics, Canberra, Australian Capital Territory, Australia
eMacquarie University, School of Mathematical and Physical Sciences, MQ Photonics Research Centre, Macquarie Park, New South Wales, Australia
fUniversität zu Köln, I. Physikalisches Institut, Köln, Germany
gDelft University of Technology, Faculty of Aerospace Engineering, Delft, The Netherlands
Keywords instrumentation; integrated optics; exoplanets; nulling interferometry; Very Large Telescope Interferometer; Asgard/NOTT
1 Introduction
Imaging planetary systems close to the snow line is an important step in astronomy. This region is known to have a statistically rich exoplanet distribution (Fulton et al., 2021). Long baseline interferometry already manages to probe exoplanets using high angular resolution (50 mas) and high contrast () with the VLTI/GRAVITY instrument (GRAVITY Collaboration et al., 2019) at the Very Large Telescope Interferometer (VLTI). However, to go below the 50 mas and image inside the coronagraphic regime (Serabyn et al., 2022), a nulling interferometer becomes advantageous in the mid-infrared range. Nulling interferometry was first proposed by Bracewell (Bracewell, 1978) and has already been implemented for example with the Palomar Fiber Nuller (PFN) (Serabyn et al., 2019), the Keck Interferometer Nuller (Colavita et al., 2009), the Nulling and Imaging Camera (NIC) (Hinz et al., 2008) at the Large Binocular Telescope (LBT) and the Guided-Light Interferometric Nulling Technology (Norris et al., 2020; Martinod et al., 2021) (GLINT) on the Subaru telescope. Asgard/NOTT (previously Hi-5) is a nulling interferometer (Defrère et al., 2018, 2022) dedicated to high-contrast imaging. It is part of the Asgard instrumental suite (Martinod et al., 2023) which is the new visitor instrument of the VLTI. The instrument would be the first to implement nulling interferometry at the VLTI, aiming to achieve a contrast of after post-processing.
The instrument will use an integrated optics beam combiner to recombine the light from the four Unit Telescopes (UTs) or Auxiliary Telescopes (ATs). Photonic beam combiners have already been successfully implemented at shorter wavelengths in other interferometric instruments like in VLTI/PIONIER (Berger et al., 2010; Le Bouquin et al., 2011) or Subaru/GLINT (Norris et al., 2020; Martinod et al., 2021). It enables a more stable and more compact design as well as an easier alignment procedure than with free-space optics. The innovation brought by Asgard/NOTT is the use of such integrated optics in the L’-band (3.5 to 4.0) µm (Sanny et al., 2022), a spectral region where guided optics is still emerging.
The optical design of the instrument includes the cold optics located inside a cryostat and cooled at 90K (Dandumont et al., 2022). They comprise the injection system, the photonic chip, the spectrograph, and the detector. Upstream of the cryostat are the warm optics at ambient temperature. This paper focuses on the warm optics and the injection system up to the waveguides’ inputs of the photonic chip. The coupling between free-space beams with imperfect wavefronts and the guided modes inside a photonic chip requires careful engineering for the optical design. On top of this challenge, nulling interferometry is also particularly demanding when it comes to the balancing of the different beams in terms of intensity, phase, and polarization.
This work presents the warm optical design and the injection system of Asgard/NOTT up to the photonic beam combiner. The proposed design offers a technical solution to maximise the coupling of the light inside the guided modes while enhancing the contrast achievable with nulling interferometry. Section 2 first introduces the instrumental requirements which drive the overall optical design. In Sec. 3, a complete description of the optical design is given. Finally, Sec. 4 estimates its performances in terms of null depth and coupling efficiency between the light and the guided modes of the beam combiner.
2 Instrumental Requirements
In this section, we define the objective as well as the requirements for the optical design of the instrument.
2.1 Requirements on Coupling Efficiency
The studied chip beam combiner (or “chip") is an integrated optic fabricated from a dielectric substrate where an ultrafast laser inscription (ULI) changed the refractive index of the material locally to create optical waveguides (Labadie et al., 2018). The use of couplers inside the chip enables to generate interferences by evanescent coupling between the different waveguides (see Fig. 1) . The chip planned to be used in the Asgard/NOTT instrument is manufactured at Macquarie University. It is made of gallium lanthanum sulfide (GLS) chalcogenide glass with propagation losses as low as 0.22 dB/cm at 4 µm wavelength (Gretzinger et al., 2019). This chip has four inputs corresponding to the four telescopes of the VLTI with the following properties for each input:
| (1) |
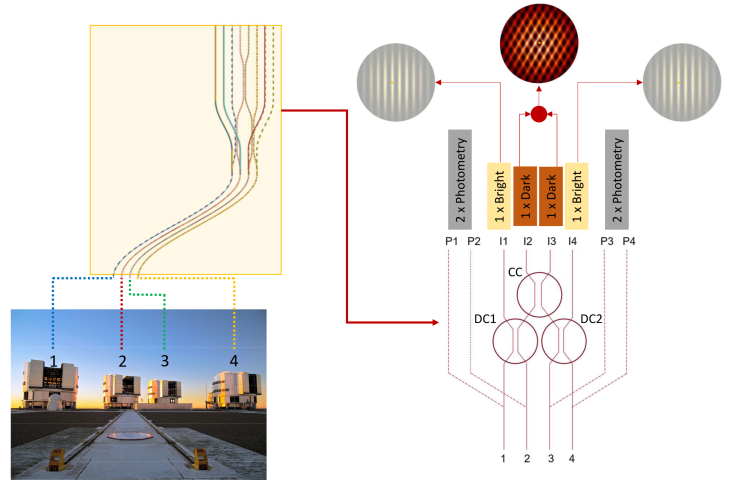
The performance evaluation in Sec. 4 considers a circular MFD of 22.45 µm. The impact of the MFD error and ellipticity is estimated in Sec. 4.5. The eight outputs of the chip shown in Fig. 1 are spectrally dispersed using grisms with spectral resolutions of 20, 400, or 2000. They are then imaged on a HAWAII 2RG® detector array (Dandumont et al., 2022). Different substrates were available for the chip, for example with lithium niobate (Heidmann et al., 2011; Martin et al., 2014a, b) or silicon. These alternatives have benefits: internal fringe locking for lithium niobate or propagation losses 1 dB/cm for silicon. They may be tested as future prospects using the optical design described in this paper.
The coupling efficiency corresponds to the energy ratio between the incoming electric field and the light that actually couples and propagates into the waveguide. When simplifying the problem by considering a Gaussian approximation for the single-mode waveguide and an Airy pattern from a diffraction-limited regime for the incoming electric field, a simple expression for the coupling efficiency is obtained (Ruilier, 1999) with
| (2) | ||||
| and | (3) |
with the central obstruction, the mode radius of the waveguide, the wavelength of the beam and the f-number of the injection optic. The resolution of this equation with no obstruction () gives a maximum value of for , which corresponds to @=4 µm according to the MFD given in Eq. (1).
One main objective of the design presented in this paper is to maximize the coupling efficiency of each beam into the photonic chip. This value is very sensitive to optical aberrations, alignment errors, vignetting, phase wavefront perturbations, diffraction, and manufacturing errors of the optics. Some optical aberrations are inherent to the optical design and cannot be minimized or corrected without adding other surfaces to the design. This is the case for instance of coma produced by off-axis parabolas (OAPs). In this paper, the maximum coupling efficiency is defined as the efficiency obtained in a situation where only irreducible aberrations are considered (see Sec. 4.1). The requirement is therefore to limit the impact from all other sources at of the maximum coupling efficiency, assuming a perfect wavefront at the entrance. The number of 5 % is chosen arbitrarily to be less than the losses from the wavefront correction upstream (see Sec. 4.6.3). Section 4 lists the estimated impact from individual sources and the resulting throughput loss that can be expected. The Fresnel losses of the system are also estimated but they are not impacting the coupling efficiency. Therefore, they are not accounted in the 5 % criterion.
2.2 Requirements on the Null Depth
2.2.1 Null depth definition
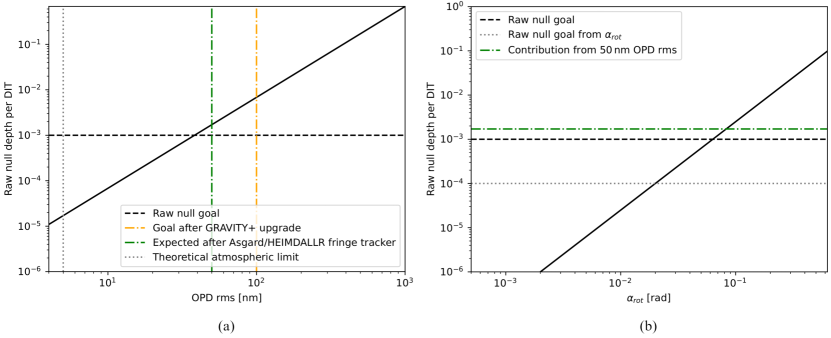
The null depth of the instrument corresponds to the ratio between the stellar flux transmitted to the null output (or stellar leakage) and the total stellar flux collected by the telescopes. A lower null depth enables the detection of fainter companions around the host star. To achieve its science goals, Asgard/NOTT targets a raw null depth of and a calibrated null depth of over the full L’-band (Defrère et al., 2018). These values are very sensitive to imbalances between the different beams regarding intensity, polarization and phase. To achieve , the sources of errors should each aim for a null depth as a safe margin.
2.2.2 Impact of the phase error
The relative phase difference between the four beams may have various sources: mainly the Optical Path Difference (OPD) and the longitudinal dispersion from water vapor (Absil, O. et al., 2006) and CO2. The OPD represents the difference of optical path between two light beams. The associated phase difference scales with the optical frequency as
| (4) |
with c, the speed of light in vacuum and n, the refractive index of the medium of propagation. After correction of the static phase difference, the total relative phase fluctuation is limiting the null depth (Serabyn, 2000)
| (5) |
Current levels of OPD errors with the GRAVITY fringe tracker are estimated at 200 nm (0.335 rad) root mean square (RMS) for the UTs (Lacour et al., 2019). Ongoing efforts within the GRAVITY+ consortium aim at improving this value down to 100 nm (0.168 rad) RMS (Bigioli et al., 2022; Courtney-Barrer et al., 2022). The adaptive optics of Asgard/HEIMDALLR (Ireland et al., 2018) are expected to reduce it down to 50 nm (0.084 rad) RMS (Martinache and Ireland, 2018). Using Eqs. (4) and (5), the raw null depth from OPD fluctuations is computed and presented in Fig. 2.
The static OPD is corrected by the internal delay lines of Asgard/NOTT up to 12 mm range.
2.2.3 Impact of the relative intensity error
The relative intensity error between the inputs is limiting the null depth (Martin et al., 2014a)
| (6) |
The aimed relative intensity error is then % for a null depth of according to Eq. (6). Section 4 presents the expected intensity error at the injection from propagation through the optical design only. Strategies to control errors from other sources are discussed in Sec. 5.2. Their performance evaluation is part of future work.
2.2.4 Impact of polarization errors
Relative polarization errors, both static and dynamic, are hampering the null depth of the instrument. In the optical system, this error may arise from a relative polarization rotation angle difference between the beams. is limiting the null depth of the instrument with (Serabyn, 2000)
| (7) |
Instrumental birefringence may also impact the null depth limit. When light propagates in a birefringent material, it generates a differential TE/TM OPD. If this OPD is different between two beams, that will limit the null depth according to Eq. (5).
An estimation for these two polarization errors is given is Sec. 4.7 for the optical design and for the VLTI. We expect only the instrumental birefringence to have a significant impact on the instrumental null depth. The optical design thus includes a correction setup (see Sec. 3.6) to maintain the OPD from birefringence at 10 µm (0.02 rad), i.e., null depth.
3 Optical Design
In this section, we describe the warm optical design, the injection system, and the motivations for their architecture. The optical designs presented in this section were entirely realized using OpticStudio-Zemax.
3.1 Objective
The light from the telescopes of the VLTI reaches the Visitor Instrument table with diameters of 18 mm and separated by 240 mm. These beams are first expected to go through the Asgard/HEIMDALLR fringe tracker with adaptive optics mirrors reducing the beam diameter down to 12 mm. For GRAVITY or PIONIER, the injection inside integrated optics is performed using optical fibers (Lippa et al., 2018; Le Bouquin et al., 2011). However in the context of Asgard/NOTT, optical fibers working in the L’-band that resist cryo-temperatures and also maintain polarization are not mature enough to be implemented here.
The objective is then to use a free-space optical system to inject these 12 mm-diameter beams into the four inputs of the chip combiner while respecting the requirements on coupling efficiency and null depth stated in Sec. 2.
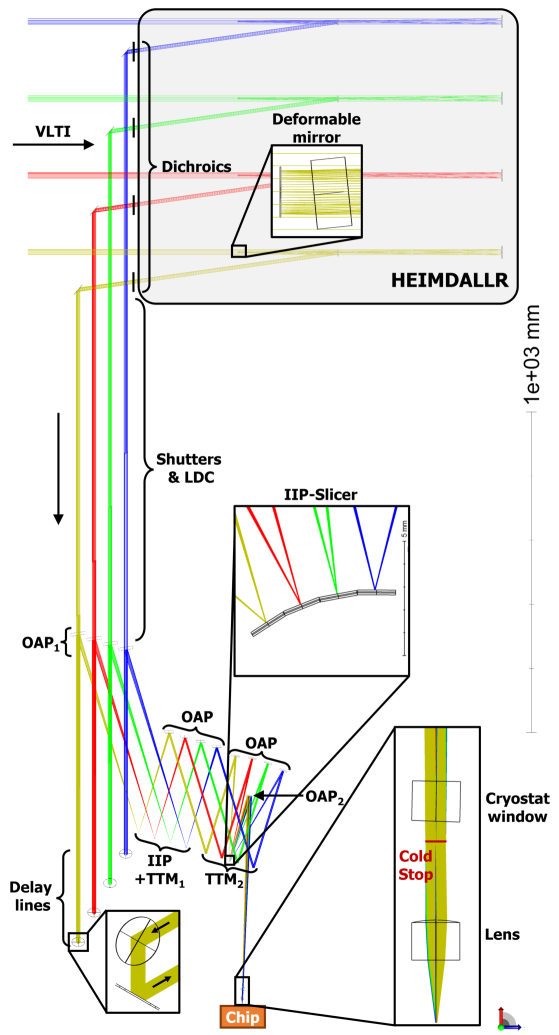
3.2 Step-by-step Description of the Main Optics
Figure 3 gives a complete view of the optical design. The four beams from the VLTI are first directed toward the Asgard/HEIMDALLR fringe tracker. Using dichroics optimized to transmit only the L’-band, collimated beams with a diameter of 12 mm are then reflected along the edge of the optical table. The light beams then encounter shutters, longitudinal dispersion correctors (LDCs) and, the delay lines. These LDCs are presented in Sec. 3.6. The delay lines consist of two plane mirrors with a 45 angle reflecting the beams in the same direction but 40 mm lower (going from 125 mm to 85 mm height). The two mirrors are moved in parallel to the beams to change their optical path length without affecting the alignment of the system downstream.
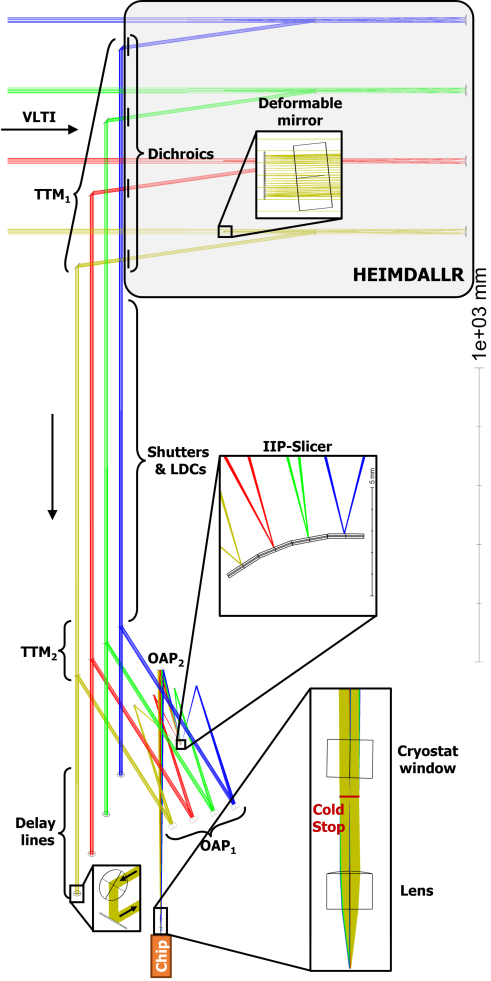
Since optical fibers cannot be used to inject into the chip, a free-space optical system is chosen. A multi-lens array like the one used in GLINT (Norris et al., 2020) is considered too expensive to be compatible with cryo-temperatures in the L’-band. The solution of a single telecentric lens made of zinc selenide (ZnSe) is then adopted for the injection. By implementing a cold stop in the focal plane of the injection lens, the magnification of the image becomes independent from the incidence angle so that mirrors at different angles can be used to recombine the four telescope’s pupils. The use of mirror slices with different angles and located at an intermediate image plane (IIP) enables this recombination; these slices will be assembled in a monolithic optic called “slicer". OAPs are implemented to focus the incoming beams on the slicer, collimate, and direct them toward the chip and the injection lens.
Finally, two sets of Tip/Tilt Mirrors (TTMs) are added to the design to ensure the alignment of both the pupils and the images of the beams (see the alignment procedure in Sec. 3.4).
3.3 Design of the Main Optics
The separation between the slices is chosen to be 1.67 mm which needs to be demagnified to match the 125 µm chip’s inputs separation. Therefore, the magnification of the OAP2+lens system needs to be . At the chip inputs, the beams also need to have to match with the result from Eq. (3) to obtain the optimal coupling efficiency with the guided mode of the chip. A pupil diameter D requires an injection lens with a focal length of
| (8) |
The focal length of the OAP2 is then given as
| (9) |
But the diameter D also constraints from the divergence of the beams at the IIP which gives
| (10) |
is defined by the focal length of OAPs1 () and the diameter of the entrance pupil (D=12 mm)
| (12) |
From Eq (11), we can derive the value of
| (13) |
The only free parameter left for the system is the diameter D of the beam collimated by OAP2. It determines the values for the remaining parameters defined above. D is set to 5 mm to enable manufacturing and optical alignment easiness, giving the following values:
| (14) |
3.4 Alignment Procedure of the Optical System
The alignment of the system is realized by two TTMs for each beam: the first ones (TTMs1) are placed after the dichroics; the seconds (TTMs2) are placed after the delay lines (see Fig. 3). These mirrors are used to align the beams both at the pupil position (i.e., at the cold stop) and at the image position (i.e., at the chip inputs). The TTMs1 and TTMs2 are responsible for the alignment at the pupil and image plane respectively. However, since both mirrors are not placed in a conjugate plane, they will have a combined effect in the alignment.
Using a coordinated motion between TTMs1 and TTMs2 (see Sec. 4.2.2), it is possible to change the alignment of the pupils without impacting the alignment at the chip inputs and vice versa. Changing only the pupil alignment with the cold stop may therefore be used to regulate the injected intensity for each beam. This would enable to actively reduce relative intensity errors mentioned in Sec. 2.2.3 using the photometric outputs of the chip (see Sec. 5.2).
3.5 Pupil Matching between Asgard/HEIMDALLR and the Cold Stop
To maintain a stable injection throughout the cold stop, the alignment of the beams at this position needs to be independent of any tip/tilt generated by Asgard/HEIMDALLR and especially their deformable mirrors (see Fig. 3). The solution is to reimage the deformable mirrors at the position of the cold stop. This can be done without altering the light path by imposing convex spherical surfaces to the slicer. With an appropriate radius of curvature, a pupil matching between the cold stop and the deformable mirrors can be achieved, thus providing a stable alignment at the cold stop position.
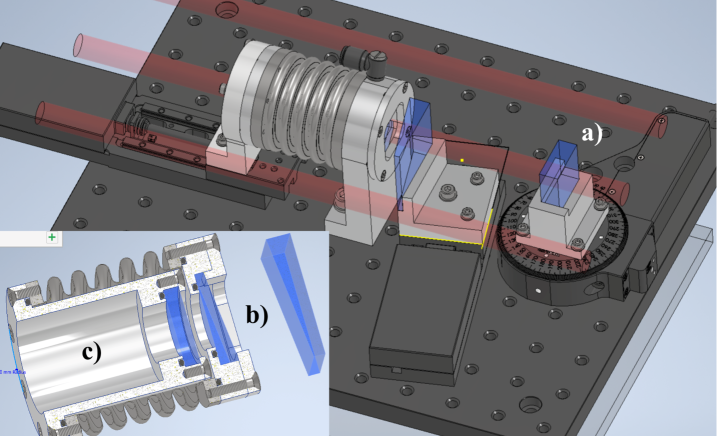
3.6 Longitudinal Dispersion Correctors (LDC)
Figure 4 shows the current opto-mechanical design of the LDCs. The objective of this subsystem is to correct the instrumental birefringence, the water vapor dispersion and the CO2 dispersion altogether for each beam individually.
For the instrumental birefringence, a solution is to use a waveplate and rotate it on a stage until the instrumental birefringence is canceled. The technique was proposed and tested in PIONIER (Lazareff et al., 2012), and achieves a correction down to µm OPD precision. However, to achieve a null depth of a correction down to nm is required. A comprehensive study is thus necessary to assess the possibility of reaching such performance.
The correction of water vapor dispersion has already been explored in the case of the Keck Interferometer Nuller (Koresko et al., 2003). A similar design with two wedges of LiNbO3 is planned here: the method is to translate one of the wedges relative to the other to change the light dispersion impacting the transmitted beam. The characteristics of the two wedges can be computed using the performance simulator of Asgard/NOTT: SCIFYsim (Laugier et al., 2023). A wedge angle of 11.5 deg and a stroke range of 25 mm are estimated for the current design.
For the CO2 dispersion, its effect on the phase dispersion is observed near and after 4 µm for example in the VLTI/MATISSE instrument (Lopez et al., 2022). The technical solution proposed in Asgard/NOTT is to use a chamber filled with CO2 at a constant pressure and change its length with a translation stage to control the transmitted beam’s dispersion. SCIFYsim enables estimation of the range of the translation stage at 50 mm.
After correction of the water vapor and CO2 dispersions using the LDCs, the chromatic phase dispersion is estimated to be rad by SCIFYsim. This corresponds to a null depth of according to Eq. (5).
3.7 Discussion on an Additional IIP for the Optical System
During the design phase of the instrument, the option of adding a second IIP to the optical system was considered. On paper, this option has one crucial advantage: it would enable the alignment of the pupils at the cold stop and the images independently without combining the movements of two TTMs like in the previously described system. Indeed, a tip/tilt movement generated at an image plane will change the transversal position of the beam in the pupil plane but not in the image plane. Using the additional IIP as a TTM thus allows an independent alignment and relative intensity error correction at the cold stop. The additional IIP also allows more flexibility on the position of the pupil matching mentioned in Sec. 3.5. Using again convex-shaped spherical surfaces, it is possible to reimage the deformable mirrors with the new IIP. At the same time, the slicer can define the entrance pupil position of the cold stop. They can thus be placed at the same position everywhere along the optical axis. If a TTM is then placed at the same location, its movement will only affect the position of the images without disturbing the pupil alignment at the cold stop.
To realize this system, two additional OAPs are needed compared to the optical system in Fig. 3. The new IIP is defined at the focus of the OAPs1. The two new OAPs are then used to collimate and refocus the beams on the slicer. A TTM is inserted in between these two OAPs, where pupil matching is done. If the effective focal length of both OAPs is equal, this ensures conservation of the beam divergence. In this case, the optical design in Sec. 3.3 stays valid for the optics downstream of the slicer. A complete view of this system is drawn in Fig. 5.
This solution is indeed efficient to perform an independent alignment between the two TTMs. However, its realization implies an increase in cost and complexity. Considering these factors of risk, it has been decided to not pursue this option anymore in the final design.
4 Performance Evaluation
Using the design presented in Sec. 3 and realized in Zemax, this section aims to give a performance evaluation of the system. It is then compared to the Asgard/NOTT requirements listed in Sec. 2.
4.1 Estimation of the Maximum Coupling Efficiency
The coupling efficiency is used to evaluate the performance of the injection inside the chip. Using the tools available in Zemax, it is computed for each beam at different wavelengths in the L’-band. When the alignment and the manufacturing of the optics are ideal, the coupling efficiency obtained corresponds to the maximum coupling efficiency of the system as defined in Sec. 2.1. Table 1 shows that a throughput loss of 23 % (i.e., maximum coupling efficiency of 77 %) can be expected during the injection even in an ideal case. This maximum coupling efficiency is different from the one announced by Eq. (2) (81 %). The main reason is the use of OAP2 and the injection lens with off-axis beams. This generates aberrations that hamper the coupling efficiency even for perfect alignment and the manufacturing precision.
4.2 Tip/tilt Mirrors Evaluation
4.2.1 Tip/tilt angular resolution
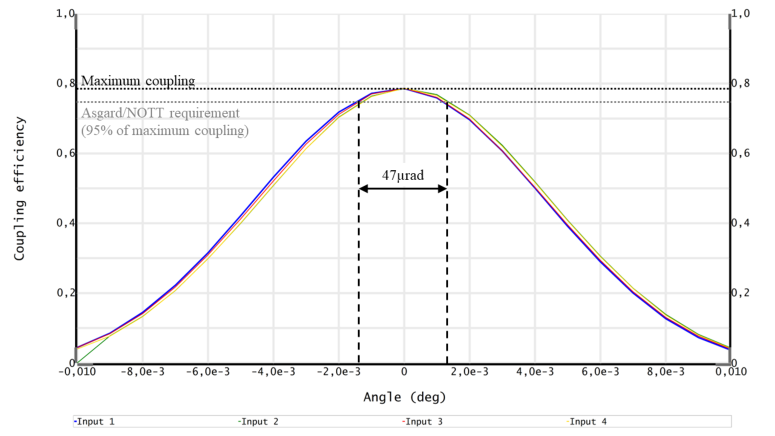
The Asgard/NOTT requirement stated in Sec. 2.1 mentions that the optical design should provide at least 95 % of the maximum coupling efficiencies (see Table 1). This gives a criterion on the angular resolution needed for the TTMs. The coupling efficiency computing in Zemax also considers the impact of vignetting upstream from the inputs. The value thus gives a realistic idea of the throughput loss due to misalignments both at the cold stop and chip inputs.
Figure 6 shows the sensitivity of coupling efficiency with respect to the pitch angle of TTMs1. Using the 95 % criterion defined above, an angle accuracy of 460.4 µrad is required to stay within this criterion. Assuming a safe margin of 1/10 to find the ideal alignment, an angular resolution of 4 µrad can be used for this mirror.
Using the same method for the yaw angle and for TTMs2, the results are summarized in Table 2. Such angular resolution can be reached using piezo optical mounts, for example with Agilis from Newport.
| Wavelength | |||
| Coupling efficiency | 3.5 µm | 3.8 µm | 4.0 µm |
| Input 1 (blue beam) | 76.7 % | 78.6 % | 77.0 % |
| Input 2 (green beam) | 77.0 % | 78.6 % | 77.1 % |
| Input 3 (red beam) | 77.0 % | 78.5 % | 77.2 % |
| Input 4 (yellow beam) | 76.7 % | 78.2 % | 77.1 % |
| Null depth | 2.4 | 4.1 | 1.1 |
| TTM1 | TTM2 | |
|---|---|---|
| Pitch angle at 95 % [µrad] | 470.9 | 402.0 |
| Yaw angle at 95 % [µrad] | 461.4 | 381.7 |
| Required resolution [µrad] | 4 | 4 |
4.2.2 Tip/tilt angular range
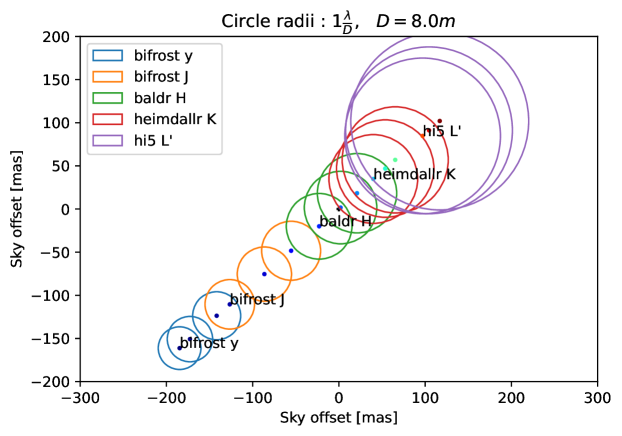
The lower limit for the angular range of the TTMs depends on the sky coverage necessary for the instrument. Indeed, the movement from TTMs1 can be used to change the part of the sky injected into the chip inputs, enabling a scan of the field of view. The alignment between the target and the center of the field of view is realized in the H-band by the Asgard/Baldr (Martinod et al., 2023) instrument. However, the light dispersion from the atmosphere generates an angular offset between the H-band and the L’-band where Asgard/NOTT operates, as shown in Fig. 7 (Laugier et al. in prep.). When observing with the UTs at 30 deg elevation, this offset is at most 150 mas projected on-sky. As a safe margin, the system should then be able to have a sky coverage of 300 mas around the center of the field of view to ensure a good alignment with the target in the L’-band.
To calculate the resulting physical angle from this offset in the design, the étendue can be used. is given by the surface of the pupil and the solid angle :
| (15) |
and remains constant in an optical system (Fischer et al., 2008). The exit pupil of the telescope shares the same étendue as the entrance pupil of the telescope. The physical angle at the exit pupil can thus be calculated from the angle on the sky and the pupil diameters and
| (16) |
The objective is to adapt the system in order to ensure 300 mas in every direction on the sky. For the UTs, 8.2 m and 18 mm.
To compensate for , the TTMs1 need to be tilted by an angle 0.03 deg. But because TTMs1 are not at the pupil matching position (see Sec. 3.4), this results in a misalignment at the cold stop as shown in Fig. 8, generating vignetting. The second step is then to use TTMs2 to realign the beams at the cold stop. This can be done with an angle 0.011 deg but it also simultaneously moves the spot by 17 µm from the chip inputs. The solution is therefore to combine the movements of both TTMs until the four beams are aligned at the chip and the cold stop. Table 3 summarizes the values for the angles and for which an optimal alignment is achieved in the case of 300 mas in both directions on the sky. Table 3 also shows the ratio of vignetted light when using only TTMs1 for the sky coverage. This ratio goes up to 20 % in every direction. The conclusion is that even when only using TTMs1 to search for a target in the field of view, of the flux should always be transmitted through the cold stop, enabling the detection of the target.
The angular range required from Table 3 for both TTMs can be reached using the piezo optical mounts Agilis from Newport for example.
| (µrad) | (µrad) | Vignetting (%) | |
| Pitch angle for =+300 mas | -8128.7 | -31014 | 191.1 |
| Pitch angle for =-300 mas | 8128.7 | 31417 | 181.0 |
| Yaw angle for =+300 mas | -8077.6 | -314 | 180.6 |
| Yaw angle for =-300 mas | 80738 | 31425 | 190.6 |
| Required angular range [µrad] | 1000 | 500 |
4.3 Impact of Fresnel Diffraction
4.3.1 Definition
The Fresnel diffraction model can be used to estimate the encircled energy loss at the pupil plane in the near field. This diffraction may have a significant impact especially when the beam diameter is small ( mm). The distance along the optical axis z where this approximation is valid is between and (Balanis, 2005).
From the Fresnel approximation, the encircled energy is estimated with the relation:
| (17) | ||||
| (18) |
represents the electric field at every spatial point and its wavenumber.
4.3.2 Results
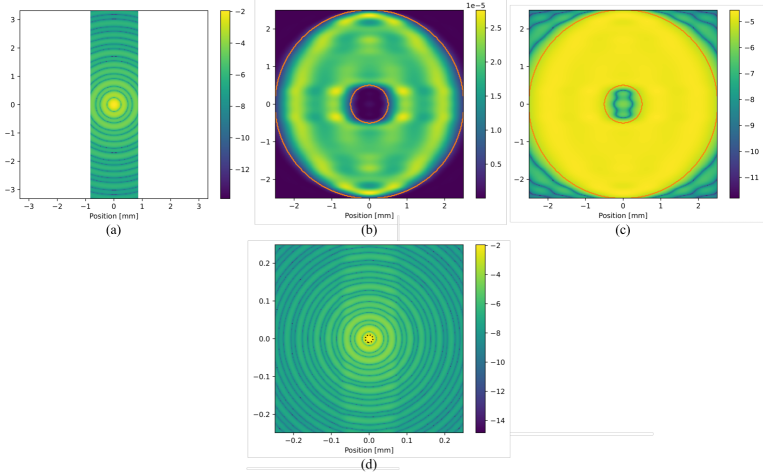
4.4 Impact of Diffraction from the Slicer and the Cold Stop
The diffraction pattern at the chip’s inputs is expected to be altered by the cropping of the intensity distribution at the image plane (from the slicer’s segments) and at the pupil plane (from the cold stop). This alteration may impact the maximum coupling efficiency described in Sec. 2.1. Figure 10 shows the resulting intensity distribution at the chip’s input after the cropping from the slicer’s segment and the cropping from the cold stop. Computing the coupling efficiency between the altered diffraction pattern and the MFD gives an estimated loss of 0.08 % due to the diffraction from the slicer’s segment and the cold stop. This impact is well within our requirement (see Sec. 2.1).
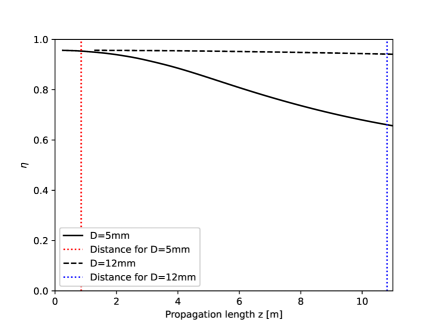
| [m] | [m] | [m] | ||
|---|---|---|---|---|
| D=12 mm | 0.14 | 18 | 10.8 | 1.5 % |
| D=5 mm | 0.04 | 3.1 | 0.85 | 0.29 % |
4.5 Impact of Mode Field Diameter (MFD) Error and Ellipticity
In this section, the MFD is assumed to be circular with a value of 22.45 µm. Measurements (Gretzinger et al., 2019) indicate an elliptical shape of 22.3x22.6 µm with an error of 0.1 µm. The MFD ellipcticity and error may have an impact on the maximum coupling efficiency that can be achieved. This impact is estimated by considering two extreme cases: a circular MFD of 22.2 µm and 22.7 µm respectively. In an ideal alignment situation, the worst case scenario is a MFD of 22.2 µm with a loss of 0.5 % on the maximum coupling efficiency at 3.5 µm wavelength. The impact of waveguide ellipticity is thus assumed to be 0.5 %, which is well within our requirement (see Sec. 2.1).
4.6 Fabrication Errors Evaluation
4.6.1 Definitions
We identify two types of fabrication errors that affect the quality of optics: the figure errors and the surface errors. The first one represents the deviation of the full-figure form of the surface from the ideal one. This induces a deviation from the theoretical radius of curvature and conic. The second one represents the local deviations of the surface compared to the full-figure form inducing local wavefront errors.
4.6.2 Impact of figure errors
The figure errors on the radius of curvature of a surface are estimated to be less critical as they do not generate aberrations. The change of focal length from these errors can be measured by the manufacturer and later compensated in the optical design. However, this error needs to be constrained as it also changes the value of and therefore can impact the performance of the injection into the chip. The tolerances of the curvature for the aspherical optics of the system are summarized in Table 5. The four OAPs1 are assumed to share the same radius of curvature if they are manufactured from the same parabola.
4.6.3 Impact of surface errors
Surface errors generate wavefront errors which result in aberrations when focusing the beams at the chip inputs. These aberrations are hampering the expected coupling efficiencies. This energy loss from wavefront errors can be approximated by the Strehl ratio.
For small aberrations (normalized wavefront error RMS), this Strehl ratio S can be estimated using Maréchal’s approximation
| (19) |
with the normalized wavefront error RMS corresponding to
| (20) |
with the reference wavelength (usually nm), N the surface quality index and the central wavelength ( µm in the L’-band).
For a multiple optics combination, the total Strehl ratio of a number of optics is
| (21) | ||||
| (22) |
| OAPs1 | OAP2 | Lens | |
|---|---|---|---|
| Tolerances at 95 % [mm] | 42 | 17 | 0.06 |
| Tolerances at 95 % [%] | 3.4 | 3.3 | 0.2 |
| Final tolerances [%] | 0.3 | 0.3 | 0.02 |
For reflective optics, the surface errors and wavefront errors are related by a factor 2
| (23) |
For refractive optics, the surface errors and wavefront errors are related by a factor depending on the glass index of refraction n
| (24) |
In some cases, the surface errors are given by manufacturers in peak-to-valley (P-V). The RMS equivalents are typically approximated to a range going from to of the P-V values (Fischer et al., 2008).
4.6.4 Estimation of the maximum surface errors
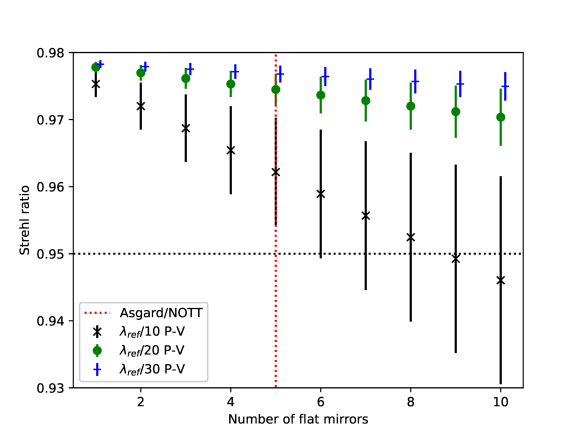
The objective is to find the maximum surface errors for each optic that reach the objective of a Strehl ratio % while minimizing the manufacturing challenges. In Fig. 3, the wavefront errors from optics prior to the dichroics are corrected by the Zernike Wavefront Sensor in Asgard/Baldr using the deformable mirrors of Asgard/HEIMDALLR. Only the optics after and including the dichroics are considered to estimate . This comprises the OAPs1, OAP2 and slicer (three reflective surfaces), the cryostat window and injection lens (four refractive surfaces), the dichroics (two refractive surfaces) and the flat mirrors (five reflective surfaces). This estimation does not include the wavefront errors generated by the LDCs.
The OAPs1, OAP2 and slicer are custom optics designed with high surface quality . The injection lens is designed with an expected surface quality of RMS from ZnSe ( at µm). The window of the cryostat is chosen with a transmitted wavefront error of P-V. Finally the dichroics are made of CaF2 ( at µm) with an expected surface quality of RMS. These hypotheses allow to study whether the use of commercially available off-the-shelf optics for the flat mirrors is possible. Figure 11 shows that a Strehl ratio is expected with a surface quality of P-V for the flat mirrors. This surface quality is indeed obtainable, e.g., from Edmund Optics.
The wavefront correction done by Asgard/Baldr is expected to reach a Strehl ratio of 40%̇ and 50 % for the UTs and the ATs, respectively, in the J-band (Martinod et al., 2023). This corresponds to a Strehl ratio of 90.3 % and 92.6 %, respectively, in the L’-band (or a throughput loss of 9.7 % and 7.4 %, respectively, during the injection in the chip). Using Eq. (21), the Strehl ratio expected at the chip’s inputs corresponds to
| (25) |
where is thus estimated to be 88.0 % and 90.3 % for the UTs and the ATs respectively in the L’-band.
4.7 Impact of Polarization Errors
From the optical design simulated on Zemax, the different polarization errors can be estimated with their impact on the null depth (see Sec. 2.2.3). This estimation is done considering three linear polarization states at the beginning of the design: , , and for “vertical", “horizontal", and “diagonal" polarization states respectively. At the inputs of the chip, the final polarization angle is calculated for the and cases and the difference between the four beams gives a null depth limit using Eq. (7). In the case, the phase delay between and is also calculated at the inputs of the chip and for each beam. This phase delay is due to the birefringence of the optical system and also contributes to limiting the null depth. Table 6 summarizes the results for the three cases. As first expected, birefringence represents the main null depth limitation from polarization errors (), which confirms the need for a birefringence correction (see Sec. 3.6).
For the polarization errors induced by the VLTI optics, a recent study estimated that the differential birefringence between the UTs generates a phase error of rad at µm wavelength (Widmann et al., 2023). This corresponds to an OPD error of nm. In the L’-band, the phase error is rad. This limits the null depth to , which is within our requirements. For the ATs, larger differential birefringence is expected and can be corrected given the model of its Jones matrix. Other polarization errors (degree of polarization, polarization angle, etc.) may arise from the VLTI optics but a more extensive study is needed to estimate them.
4.8 Final Throughput Loss and Null Depth Budget
This section summarizes the impact of the different sources impairing the optical throughput (Table 7) and the null depth from the optical system (Table 8). Table 8 highlights that OPD errors and birefringence are expected to be the main limitations for the null depth of the instrument. After correction by the LDCs, the null depth from birefringence is expected to be , which leaves the OPD errors as the main limitation (assuming that the null depth is not limited by the photonic chip). This confirms that reducing OPD errors at the VLTI is the best way to improve high-contrast imaging with nulling interferometry.
The impact of alignment and figure errors is calculated with Monte Carlo method on Zemax. Using the values from Table 2 and 5, less than 1 % throughput loss is expected across the bandwidth and for the four beams.
The throughput loss during the injection is estimated at 6.4 % of the best coupling efficiency. While it is above the objective, it remains less than the impact from wavefront errors. The optical design is thus assumed to have an optimized injection efficiency.
An estimation of the Fresnel losses gives a throughput loss of 40 %. It represents the losses due to reflections and transmissions from the Asgard/NOTT optics (including the LDCs). The global throughput loss of the instrument is then estimated at 60 %.
| Angle at the chip [mrad] | Phase delay at the chip [mrad] | ||
| Starting polarization state | |||
| Input 1 (blue beam) | |||
| Input 2 (green beam) | |||
| Input 3 (red beam) | |||
| Input 4 (yellow beam) | |||
| Null depth | |||
| Throughput loss [%] | |
|---|---|
| Fresnel diffraction | |
| Slicer & Cold stop diffractions | |
| MFD ellipticity | |
| Alignment & figure errors | |
| Surface errors | |
| Total 1 | |
| Maximum coupling efficiency | |
| Wavefront errors (after Asgard/Baldr correction) | [UTs] and [ATs] |
| Fresnel losses | |
| Total 2 |
| Null depth | |
|---|---|
| OPD error (after Asgard/HEIMDALLR) | |
| Intensity error (objective) | |
| Longitudinal dispersion from H2O & CO2 | |
| Polarization angle difference | |
| Birefringence before [after] LDCs correction | [] |
| Total |
5 Discussion
5.1 Beam Swapping Capacity
Because Asgard/NOTT uses a two-stage nulling recombination scheme, its sensitivity map depends on the order in which the telescopes are recombined (Laugier et al., 2023). Therefore, the optical design must enable the swap of the light beams two-by-two before the couplers inside the chip. This swap would allow to ensure more flexibility to detect an exoplanet.
Several internal solutions have been considered, including beam swapping with different photonic chips, with the slicer, or with mirror permutation, but none of these sufficiently fit the instrumental constraints. An alternative solution is to perform beam swapping using the M16 mirrors of the VLTI and moving the VLTI delay lines accordingly to correct for the OPD. This solution would make Asgard/NOTT simpler and easier to implement at Paranal but also less automatic.
5.2 Intensity Matching
Section 2.2.3 presents the requirement in terms of relative intensity error between the different injected beams. Table 1 shows that the expected contribution from the optical design is well within the null depth requirement of . However, other sources of intensity mismatch may contribute, like the difference of throughput between the telescopes of the VLTI. Measurements done in April 2020 show a difference of throughput between the four ATs which gives a relative intensity error of almost 20 % in the K-band, i.e., a null depth of (X. Haubois, personal communication, December 14, 2023). This example motivates the need for a strategy to maintain .
The intensity mismatch can be directly measured using the photometric outputs of the chip (see Fig. 1).To actively reduce the mismatch, several strategies are considered for the instrument:
-
•
Using motorized iris diaphragms, the pupil diameter of each beam can be actively adjusted to minimize .
-
•
Using the TTMs, misalignments between the pupil planes and the cold stop can generate vignetting to minimize (see Sec. 3.4).
However both of these solutions cannot provide a chromatic correction of the intensity injected into the chip. In order to enable a wavelength-dependent control of the intensity as well as the phase, an adaptive nuller (Peters et al., 2010) is considered. The system would be a future improvement for the instrument installed in between OAP2 and the cryostat.
6 Conclusion
The finalized version of the Asgard/NOTT warm optical design and injection system is presented in this paper. This work gives a complete description of the optical layout as well as explanations for the choices made during the design process. The performance section lists different phenomena that can hamper the throughput of the instrument and/or the null depth. The impact for each of these is estimated and an overall null depth limit of can be given for the instrument with a throughput loss of . The null depth limit is expected to be dominated by the OPD error from the atmosphere and the vibrations at the VLTI, even after correction by the adaptive optics of Asgard/HEIMDALLR. The loss of throughput is dominated by the Fresnel losses and wavefront errors after the Asgard/Baldr correction. For the injection into the chip, the throughput loss is estimated to be 6.4 % of the maximum coupling efficiency. Even if the estimation is above the requirement of 5 % stated in Sec. 2.1, it remains below the loss from wavefront errors. The optical system and its tolerancing are thus assumed to be adapted for efficiently injecting the VLTI beams into the beam combiner of the instrument.
Some aspects of the design are still risky and subject to change in the future like the LDCs for which a prototype demonstration is required. Combining the two TTMs also needs a comprehensive study to allow for alignment and possible intensity matching. These will be implemented in the test bench of the Asgard/NOTT instrument located at KU Leuven.
Acknowledgments
SCIFY has received funding from the European Research Council (ERC); Award no. CoG – 866070 under the European Union’s Horizon 2020 research and innovation program. M-A.M. has received funding from the European Union’s Horizon 2020 Research and Innovation Program; Award No. 101004719. Acknowledgment to J.B. Le Bouquin (IPAG/OSU) for discussions about the injection alignment.
References
- Fulton et al. [2021] Benjamin J. Fulton, Lee J. Rosenthal, Lea A. Hirsch, Howard Isaacson, Andrew W. Howard, Cayla M. Dedrick, Ilya A. Sherstyuk, Sarah C. Blunt, Erik A. Petigura, Heather A. Knutson, Aida Behmard, Ashley Chontos, Justin R. Crepp, Ian J. M. Crossfield, Paul A. Dalba, Debra A. Fischer, Gregory W. Henry, Stephen R. Kane, Molly Kosiarek, Geoffrey W. Marcy, Ryan A. Rubenzahl, Lauren M. Weiss, and Jason T. Wright. California Legacy Survey. II. Occurrence of Giant Planets beyond the Ice Line. The Astrophysical Journal Supplement Series, 255(1):14, July 2021. ISSN 0067-0049, 1538-4365. doi:10.3847/1538-4365/abfcc1. URL https://iopscience.iop.org/article/10.3847/1538-4365/abfcc1.
- GRAVITY Collaboration et al. [2019] GRAVITY Collaboration, S. Lacour, M. Nowak, J. Wang, O. Pfuhl, F. Eisenhauer, R. Abuter, A. Amorim, N. Anugu, M. Benisty, J. P. Berger, H. Beust, N. Blind, M. Bonnefoy, H. Bonnet, P. Bourget, W. Brandner, A. Buron, C. Collin, B. Charnay, F. Chapron, Y. Clénet, V. Coudé du Foresto, P. T. de Zeeuw, C. Deen, R. Dembet, J. Dexter, G. Duvert, A. Eckart, N. M. Förster Schreiber, P. Fédou, P. Garcia, R. Garcia Lopez, F. Gao, E. Gendron, R. Genzel, S. Gillessen, P. Gordo, A. Greenbaum, M. Habibi, X. Haubois, F. Haußmann, Th. Henning, S. Hippler, M. Horrobin, Z. Hubert, A. Jimenez Rosales, L. Jocou, S. Kendrew, P. Kervella, J. Kolb, A.-M. Lagrange, V. Lapeyrère, J.-B. Le Bouquin, P. Léna, M. Lippa, R. Lenzen, A.-L. Maire, P. Mollière, T. Ott, T. Paumard, K. Perraut, G. Perrin, L. Pueyo, S. Rabien, A. Ramírez, C. Rau, G. Rodríguez-Coira, G. Rousset, J. Sanchez-Bermudez, S. Scheithauer, N. Schuhler, O. Straub, C. Straubmeier, E. Sturm, L. J. Tacconi, F. Vincent, E. F. van Dishoeck, S. von Fellenberg, I. Wank, I. Waisberg, F. Widmann, E. Wieprecht, M. Wiest, E. Wiezorrek, J. Woillez, S. Yazici, D. Ziegler, and G. Zins. First direct detection of an exoplanet by optical interferometry: Astrometry and K -band spectroscopy of HR 8799 e. Astronomy & Astrophysics, 623:L11, March 2019. ISSN 0004-6361, 1432-0746. doi:10.1051/0004-6361/201935253. URL https://www.aanda.org/10.1051/0004-6361/201935253.
- Serabyn et al. [2022] E. Serabyn, G. Ruane, and D. Echeverri. Observing inside the coronagraphic regime with optimized single-mode nulling interferometry. In Laura E. Coyle, Shuji Matsuura, and Marshall D. Perrin, editors, Space Telescopes and Instrumentation 2022: Optical, Infrared, and Millimeter Wave, volume 12180 of Society of Photo-Optical Instrumentation Engineers (SPIE) Conference Series, page 121800N, August 2022. doi:10.1117/12.2630589.
- Bracewell [1978] R. N. Bracewell. Detecting nonsolar planets by spinning infrared interferometer. Nature, 274(5673):780–781, August 1978. ISSN 0028-0836, 1476-4687. doi:10.1038/274780a0. URL http://www.nature.com/articles/274780a0.
- Serabyn et al. [2019] E Serabyn, B Mennesson, S Martin, K Liewer, and J Kühn. Nulling at short wavelengths: theoretical performance constraints and a demonstration of faint companion detection inside the diffraction limit with a rotating-baseline interferometer. Monthly Notices of the Royal Astronomical Society, 489(1):1291–1303, October 2019. ISSN 0035-8711, 1365-2966. doi:10.1093/mnras/stz2163. URL https://academic.oup.com/mnras/article/489/1/1291/5548800.
- Colavita et al. [2009] M. M. Colavita, E. Serabyn, R. Millan-Gabet, C. D. Koresko, R. L. Akeson, A. J. Booth, B. P. Mennesson, S. D. Ragland, E. C. Appleby, B. C. Berkey, A. Cooper, S. L. Crawford, M. J. Creech-Eakman, W. Dahl, C. Felizardo, J. I. Garcia-Gathright, J. T. Gathright, J. S. Herstein, E. E. Hovland, M. A. Hrynevych, E. R. Ligon, D. W. Medeiros, J. D. Moore, D. Morrison, C. G. Paine, D. L. Palmer, T. Panteleeva, B. Smith, M. R. Swain, R. F. Smythe, K. R. Summers, K. Tsubota, C. Tyau, G. Vasisht, E. Wetherell, P. L. Wizinowich, and J. M. Woillez. Keck Interferometer Nuller Data Reduction and On-Sky Performance. Publications of the Astronomical Society of the Pacific, 121(884):1120–1138, October 2009. ISSN 0004-6280, 1538-3873. doi:10.1086/606063. URL http://iopscience.iop.org/article/10.1086/606063.
- Hinz et al. [2008] Philip Hinz, Elliott Solheid, Oli Durney, and William Hoffmann. Nic: Lbti’s nulling and imaging camera. Proceedings of SPIE - The International Society for Optical Engineering, 7013, 07 2008. doi:10.1117/12.790242.
- Norris et al. [2020] Barnaby R. M. Norris, Nick Cvetojevic, Tiphaine Lagadec, Nemanja Jovanovic, Simon Gross, Alexander Arriola, Thomas Gretzinger, Marc-Antoine Martinod, Olivier Guyon, Julien Lozi, Michael J. Withford, Jon S. Lawrence, and Peter Tuthill. First on-sky demonstration of an integrated-photonic nulling interferometer: the GLINT instrument. MNRAS, 491(3):4180–4193, January 2020. doi:10.1093/mnras/stz3277.
- Martinod et al. [2021] Marc-Antoine Martinod, Barnaby Norris, Peter Tuthill, Tiphaine Lagadec, Nemanja Jovanovic, Nick Cvetojevic, Simon Gross, Alexander Arriola, Thomas Gretzinger, Michael J. Withford, Olivier Guyon, Julien Lozi, Sébastien Vievard, Vincent Deo, Jon S. Lawrence, and Sergio Leon-Saval. Scalable photonic-based nulling interferometry with the dispersed multi-baseline GLINT instrument. Nature Communications, 12(1):2465, December 2021. ISSN 2041-1723. doi:10.1038/s41467-021-22769-x. URL http://www.nature.com/articles/s41467-021-22769-x.
- Defrère et al. [2018] D. Defrère, M. Ireland, O. Absil, J.-P. Berger, W. C. Danchi, S. Ertel, A. Gallenne, F. Hénault, P. Hinz, E. Huby, S. Kraus, L. Labadie, J.-B. Le Bouquin, G. Martin, A. Matter, B. Mennesson, A. Mérand, S. Minardi, J. D. Monnier, B. Norris, G. Orban de Xivry, E. Pedretti, J.-U. Pott, M. Reggiani, E. Serabyn, J. Surdej, K. R. W. Tristram, and J. Woillez. Hi-5: a potential high-contrast thermal near-infrared imager for the VLTI. In Michelle J. Creech-Eakman, Peter G. Tuthill, and Antoine Mérand, editors, Optical and Infrared Interferometry and Imaging VI, volume 10701, pages 223 – 237. International Society for Optics and Photonics, SPIE, 2018. doi:10.1117/12.2313700. URL https://doi.org/10.1117/12.2313700.
- Defrère et al. [2022] Denis Defrère, Azzurra Bigioli, Colin Dandumont, Germain Garreau, Romain Laugier, Marc-Antoine Martinod, Olivier Absil, Jean-Philippe Berger, Emilie Bouzerand, Benjamin Courtney-Barrer, Alexandre Emsenhuber, Steve Ertel, Jonathan Gagne, Adrian M. Glauser, Simon Gross, Michael J. Ireland, Harry-Dean Kenchington Goldsmith, Jacques Kluska, Stefan Kraus, Lucas Labadie, Victor Laborde, Alain Léger, Jarron Leisenring, Jérôme Loicq, Guillermo Martin, Johan Morren, Alexis Matter, Alexandra Mazzoli, Kwinten Missiaen, Salman Muhammad, Marc Ollivier, Gert Raskin, Hélène Rousseau, Ahmed Sanny, Simon Verlinden, Bart Vandenbussche, and Julien Woillez. L-band nulling interferometry at the VLTI with Asgard/Hi-5: status and plans. In Antoine Mérand, Stephanie Sallum, and Joel Sanchez-Bermudez, editors, Optical and Infrared Interferometry and Imaging VIII, page 16, Montréal, Canada, August 2022. SPIE. ISBN 978-1-5106-5347-4 978-1-5106-5348-1. doi:10.1117/12.2627953. URL https://www.spiedigitallibrary.org/conference-proceedings-of-spie/12183/2627953/L-band-nulling-interferometry-at-the-VLTI-with-Asgard-Hi/10.1117/12.2627953.full.
- Martinod et al. [2023] Marc-Antoine Martinod, Denis Defrère, Michael Ireland, Stefan Kraus, Frantz Martinache, Peter Tuthill, Azzurra Bigioli, Emilie Bouzerand, Julia Bryant, Sorabh Chhabra, Benjamin Courtney-Barrer, Fred Crous, Nick Cvetojevic, Colin Dandumont, Steve Ertel, Tyler Gardner, Germain Garreau, Adrian M. Glauser, Lucas Labadie, Tiphaine Lagadec, Romain Laugier, Alexandra Mazzoli, Daniel Mortimer, Barnaby Norris, Gert Raskin, Gordon Robertson, Ahmed Sanny, and Adam Taras. High-angular resolution and high contrast observations from Y to L band at the Very Large Telescope Interferometer with the Asgard Instrumental suite. Journal of Astronomical Telescopes, Instruments, and Systems, 9(2):025007, 2023. doi:10.1117/1.JATIS.9.2.025007. URL https://doi.org/10.1117/1.JATIS.9.2.025007.
- Berger et al. [2010] J.-P. Berger, Gerard Zins, B. Lazareff, J. Lebouquin, L. Jocou, Pierre Kern, Rafael Millan-Gabet, Wesley Traub, Pierre Haguenauer, Olivier Absil, Jean-Charles Augereau, M. Benisty, Nicolas Blind, X. Bonfils, Alain Delboulbé, P. Feautrier, M. Germain, D. Gillier, P. Gitton, and Eric Tatulli. Pionier: a visitor instrument for the vlti. Proceedings of SPIE - The International Society for Optical Engineering, 7734, 08 2010. doi:10.1117/12.858647.
- Le Bouquin et al. [2011] J. B. Le Bouquin, J. P. Berger, B. Lazareff, G. Zins, P. Haguenauer, L. Jocou, P. Kern, R. Millan-Gabet, W. Traub, O. Absil, J. C. Augereau, M. Benisty, N. Blind, X. Bonfils, P. Bourget, A. Delboulbe, P. Feautrier, M. Germain, P. Gitton, D. Gillier, M. Kiekebusch, J. Kluska, J. Knudstrup, P. Labeye, J. L. Lizon, J. L. Monin, Y. Magnard, F. Malbet, D. Maurel, F. Ménard, M. Micallef, L. Michaud, G. Montagnier, S. Morel, T. Moulin, K. Perraut, D. Popovic, P. Rabou, S. Rochat, C. Rojas, F. Roussel, A. Roux, E. Stadler, S. Stefl, E. Tatulli, and N. Ventura. PIONIER: a 4-telescope visitor instrument at VLTI. A&A, 535:A67, November 2011. doi:10.1051/0004-6361/201117586.
- Sanny et al. [2022] Ahmed Sanny, Simon Gross, Lucas Labadie, Denis Defrère, Azzurra Bigioli, Romain Laugier, Colin Dandumont, and Michael J. Withford. Development of the four-telescope photonic nuller of Hi-5 for the characterization of exoplanets in the mid-IR. In Antoine Mérand, Stephanie Sallum, and Joel Sanchez-Bermudez, editors, Optical and Infrared Interferometry and Imaging VIII, page 43, Montréal, Canada, August 2022. SPIE. ISBN 978-1-5106-5347-4 978-1-5106-5348-1. doi:10.1117/12.2628903. URL https://www.spiedigitallibrary.org/conference-proceedings-of-spie/12183/2628903/Development-of-the-four-telescope-photonic-nuller-of-Hi-5/10.1117/12.2628903.full.
- Dandumont et al. [2022] C. Dandumont, A. Mazzoli, V. Laborde, R. Laugier, A. Bigioli, G. Garreau, S. Gross, M. Ireland, H. D. Kenchington Goldsmith, L. Labadie, M. A. Martinod, G. Raskin, A. Sanny, J. Loicq, and D. Defrère. Technical requirements and optical design of the Hi-5 spectrometer. In Antoine Mérand, Stephanie Sallum, and Joel Sanchez-Bermudez, editors, Optical and Infrared Interferometry and Imaging VIII, volume 12183 of Society of Photo-Optical Instrumentation Engineers (SPIE) Conference Series, page 121831Y, August 2022. doi:10.1117/12.2627939.
- Labadie et al. [2018] Lucas Labadie, Stefano Minardi, Jan Tepper, Romina Diener, Balaji Muthusubramanian, Jörg-Uwe Pott, Stefan Nolte, Simon Gross, Alexander Arriola, and Michael J. Withford. Photonics-based mid-infrared interferometry: 4-year results of the ALSI project and future prospects. In Michelle J. Creech-Eakman, Peter G. Tuthill, and Antoine Mérand, editors, Optical and Infrared Interferometry and Imaging VI, volume 10701 of Society of Photo-Optical Instrumentation Engineers (SPIE) Conference Series, page 107011R, July 2018. doi:10.1117/12.2312930.
- Gretzinger et al. [2019] Thomas Gretzinger, Simon Gross, Alexander Arriola, and Michael J. Withford. Towards a photonic mid-infrared nulling interferometer in chalcogenide glass. Optics Express, 27(6):8626, March 2019. ISSN 1094-4087. doi:10.1364/OE.27.008626. URL https://opg.optica.org/abstract.cfm?URI=oe-27-6-8626.
- Heidmann et al. [2011] S. Heidmann, O. Caballero, A. Nolot, M. Gineys, T. Moulin, A. Delboulbé, L. Jocou, J. B. Le Bouquin, J. P. Berger, and G. Martin. Two telescopes ABCD electro-optic beam combiner based on lithium niobate for near infrared stellar interferometry. In Mario Bertolotti, editor, Nonlinear Optics and Applications V, volume 8071 of Society of Photo-Optical Instrumentation Engineers (SPIE) Conference Series, page 807108, June 2011. doi:10.1117/12.886725.
- Martin et al. [2014a] Guillermo Martin, Samuel Heidmann, Jean-Yves Rauch, Laurent Jocou, and Nadège Courjal. Electro-optic fringe locking and photometric tuning using a two-stage Mach-Zehnder lithium niobate waveguide for high-contrast mid-infrared interferometry. Optical Engineering, 53:034101, March 2014a. doi:10.1117/1.OE.53.3.034101.
- Martin et al. [2014b] Guillermo Martin, Samuel Heidmann, Fabrice Thomas, Mikhael de Mengin, Laurent Jocou, Gwenn Ulliac, Nadège Courjal, Alain Morand, Pierre Benech, and Etienne P. le Coarer. Lithium Niobate active beam combiners: results of on-chip fringe locking, fringe scanning and high contrast integrated optics interferometry and spectrometry. In Jayadev K. Rajagopal, Michelle J. Creech-Eakman, and Fabien Malbet, editors, Optical and Infrared Interferometry IV, volume 9146 of Society of Photo-Optical Instrumentation Engineers (SPIE) Conference Series, page 91462I, July 2014b. doi:10.1117/12.2055516.
- Ruilier [1999] C. Ruilier. Filtrage modal et recombinaison de grands télescopes. Contributions à l’instrument FLUOR. Journal des Astronomes Francais, 60:43, December 1999.
- Absil, O. et al. [2006] Absil, O., den Hartog, R., Gondoin, P., Fabry, P., Wilhelm, R., Gitton, P., and Puech, F. Performance study of ground-based infrared bracewell interferometers - application to the detection of exozodiacal dust disks with genie. A&A, 448(2):787–800, 2006. doi:10.1051/0004-6361:20053516. URL https://doi.org/10.1051/0004-6361:20053516.
- Serabyn [2000] Eugene Serabyn. Nulling interferometry: symmetry requirements and experimental results. In Pierre J. Lena and Andreas Quirrenbach, editors, Interferometry in Optical Astronomy, volume 4006, pages 328 – 339. International Society for Optics and Photonics, SPIE, 2000. doi:10.1117/12.390223. URL https://doi.org/10.1117/12.390223.
- Lacour et al. [2019] S. Lacour, R. Dembet, R. Abuter, P. Fédou, G. Perrin, Elodie Choquet, O. Pfuhl, F. Eisenhauer, Julien Woillez, Frédéric Cassaing, Ekkehard Wieprecht, T. Ott, E. Wiezorrek, K.R.W. Tristram, B. Wolff, Andres Ramirez Molina, X. Haubois, Karine Perraut, C. Straubmeier, and Antonio Amorim. The gravity fringe tracker. Astronomy and Astrophysics, 624, 04 2019. doi:10.1051/0004-6361/201834981.
- Bigioli et al. [2022] A. Bigioli, B. Courtney-Barrer, R. Abuter, F. Eisenhauer, F. Gonte, R. Laugier, G. Raskin, M. Riquelme, M. Salman, N. Schuhler, J. Woillez, and D. Defrère. Measuring and compensating vibrations at the VLTI: MANHATTAN-II self-intrinsic noise and hardware extension. In Antoine Mérand, Stephanie Sallum, and Joel Sanchez-Bermudez, editors, Optical and Infrared Interferometry and Imaging VIII, volume 12183 of Society of Photo-Optical Instrumentation Engineers (SPIE) Conference Series, page 121831Z, August 2022. doi:10.1117/12.2629168.
- Courtney-Barrer et al. [2022] B. Courtney-Barrer, J. Woillez, R. Laugier, A. Bigioli, N. Schuhler, P. Guajardo, V. Lizana, N. Behara, F. Eisenhauer, M. Ireland, X. Haubois, and D. Defrère. Towards a better understanding of OPD limitations for higher sensitivity and contrast at the VLTI. In Antoine Mérand, Stephanie Sallum, and Joel Sanchez-Bermudez, editors, Optical and Infrared Interferometry and Imaging VIII, volume 12183 of Society of Photo-Optical Instrumentation Engineers (SPIE) Conference Series, page 1218328, August 2022. doi:10.1117/12.2628835.
- Ireland et al. [2018] Michael J. Ireland, Denis Defrère, Frantz Martinache, John Monnier, Julien Woillez, Peter G. Tuthill, and Barnaby Norris. Image-plane fringe tracker for adaptive-optics assisted long baseline interferometry. In Antoine Mérand, Michelle J. Creech-Eakman, and Peter G. Tuthill, editors, Optical and Infrared Interferometry and Imaging VI, page 21, Austin, United States, July 2018. SPIE. ISBN 978-1-5106-1955-5 978-1-5106-1956-2. doi:10.1117/12.2314393. URL https://www.spiedigitallibrary.org/conference-proceedings-of-spie/10701/2314393/Image-plane-fringe-tracker-for-adaptive-optics-assisted-long-baseline/10.1117/12.2314393.full.
- Martinache and Ireland [2018] Frantz Martinache and Michael J. Ireland. Kernel-nulling for a robust direct interferometric detection of extrasolar planets. A&A, 619:A87, November 2018. doi:10.1051/0004-6361/201832847.
- Lippa et al. [2018] Magdalena Lippa, Stefan Gillessen, Nicolas Blind, Yitping Kok, Karine Perraut, Laurent Jocou, Frank Eisenhauer, Oliver Pfuhl, Marcus Haug, Stefan Kellner, Frank Haußmann, Markus Plattner, Christian Rau, Oliver Hans, Ekkehard Wieprecht, Thomas Ott, Erich Wiezorrek, Eckhard Sturm, Alexander Buron, Sylvestre Lacour, Reinhard Genzel, Guy Perrin, Wolfgang Brandner, Christian Straubmeier, and Antonio Amorim. Learnings from the use of fiber optics in GRAVITY. In Michelle J. Creech-Eakman, Peter G. Tuthill, and Antoine Mérand, editors, Optical and Infrared Interferometry and Imaging VI, volume 10701 of Society of Photo-Optical Instrumentation Engineers (SPIE) Conference Series, page 107011Y, July 2018. doi:10.1117/12.2312477.
- Lazareff et al. [2012] B. Lazareff, J. B. Le Bouquin, and J. P. Berger. A novel technique to control differential birefringence in optical interferometers. Demonstration on the PIONIER-VLTI instrument. A&A, 543:A31, July 2012. doi:10.1051/0004-6361/201219160.
- Koresko et al. [2003] Christopher D. Koresko, Bertrand P. Mennesson, Eugene Serabyn, Mark Colavita, Rachel L. Akeson, and Mark R. Swain. Longitudinal dispersion control for the Keck interferometer nuller. page 625, Waikoloa, Hawai’i, United States, February 2003. doi:10.1117/12.458032. URL http://proceedings.spiedigitallibrary.org/proceeding.aspx?doi=10.1117/12.458032.
- Laugier et al. [2023] Romain Laugier, Denis Defrère, Julien Woillez, Benjamin Courtney-Barrer, Felix A. Dannert, Alexis Matter, Colin Dandumont, Simon Gross, Olivier Absil, Azzurra Bigioli, Germain Garreau, Lucas Labadie, Jérôme Loicq, Marc-Antoine Martinod, Alexandra Mazzoli, Gert Raskin, and Ahmed Sanny. Asgard/NOTT: L-band nulling interferometry at the VLTI. I. Simulating the expected high-contrast performance. A&A, 671:A110, March 2023. doi:10.1051/0004-6361/202244351.
- Lopez et al. [2022] B. Lopez, S. Lagarde, R. G. Petrov, W. Jaffe, P. Antonelli, F. Allouche, P. Berio, A. Matter, A. Meilland, F. Millour, S. Robbe-Dubois, Th. Henning, G. Weigelt, A. Glindemann, T. Agocs, Ch. Bailet, U. Beckmann, F. Bettonvil, R. van Boekel, P. Bourget, Y. Bresson, P. Bristow, P. Cruzalèbes, E. Eldswijk, Y. Fanteï Caujolle, J. C. González Herrera, U. Graser, P. Guajardo, M. Heininger, K. H. Hofmann, G. Kroes, W. Laun, M. Lehmitz, C. Leinert, K. Meisenheimer, S. Morel, U. Neumann, C. Paladini, I. Percheron, M. Riquelme, M. Schoeller, Ph. Stee, L. Venema, J. Woillez, G. Zins, P. Ábrahám, S. Abadie, R. Abuter, M. Accardo, T. Adler, J. Alonso, J. C. Augereau, A. Böhm, G. Bazin, J. Beltran, A. Bensberg, W. Boland, R. Brast, L. Burtscher, R. Castillo, A. Chelli, C. Cid, J. M. Clausse, C. Connot, R. D. Conzelmann, W. C. Danchi, M. Delbo, J. Drevon, C. Dominik, A. van Duin, M. Ebert, F. Eisenhauer, S. Flament, R. Frahm, V. Gámez Rosas, A. Gabasch, A. Gallenne, E. Garces, P. Girard, A. Glazenborg, F. Y. J. Gonté, F. Guitton, M. de Haan, H. Hanenburg, X. Haubois, V. Hocdé, M. Hogerheijde, R. ter Horst, J. Hron, C. A. Hummel, N. Hubin, R. Huerta, J. Idserda, J. W. Isbell, D. Ives, G. Jakob, A. Jaskó, L. Jochum, L. Klarmann, R. Klein, J. Kragt, S. Kuindersma, E. Kokoulina, L. Labadie, S. Lacour, J. Leftley, R. Le Poole, J. L. Lizon, M. Lopez, F. Lykou, A. Mérand, A. Marcotto, N. Mauclert, T. Maurer, L. H. Mehrgan, J. Meisner, K. Meixner, M. Mellein, J. L. Menut, L. Mohr, L. Mosoni, R. Navarro, E. Nußbaum, L. Pallanca, E. Pantin, L. Pasquini, T. Phan Duc, J. U. Pott, E. Pozna, A. Richichi, A. Ridinger, F. Rigal, Th. Rivinius, R. Roelfsema, R. R. Rohloff, S. Rousseau, D. Salabert, D. Schertl, N. Schuhler, M. Schuil, K. Shabun, A. Soulain, C. Stephan, P. Toledo, K. Tristram, N. Tromp, F. Vakili, J. Varga, J. Vinther, L. B. F. M. Waters, M. Wittkowski, S. Wolf, F. Wrhel, and G. Yoffe. MATISSE, the VLTI mid-infrared imaging spectro-interferometer. A&A, 659:A192, March 2022. doi:10.1051/0004-6361/202141785.
- Fischer et al. [2008] Robert E. Fischer, Biljana Tadic-Galeb, and Paul R. Yoder. Optical System Design: Second Edition. McGraw-Hill, 2008.
- Balanis [2005] Constantine A. Balanis. Antenna Theory : Analysis and Design, pages 34–36. John Wiley & Sons, 2005.
- Widmann et al. [2023] F. Widmann, X. Haubois, N. Schuhler, O. Pfuhl, F. Eisenhauer, S. Gillessen, Nur Aimar, Antonio Amorim, M. Bauböck, J.B. Berger, H. Bonnet, Guillaume Bourdarot, W. Brandner, Y. Clénet, Roger Davies, Tim de Zeeuw, J. Dexter, A. Drescher, A. Eckart, and Julien Woillez. Polarization analysis of the vlti and gravity. Astronomy & Astrophysics, 11 2023. doi:10.1051/0004-6361/202347238.
- Peters et al. [2010] Robert D. Peters, Oliver P. Lay, and Peter R. Lawson. Mid-Infrared Adaptive Nulling for the Detection of Earthlike Exoplanets. PASP, 122(887):85, January 2010. doi:10.1086/649850.