Predicting User Experience on Laptops
from Hardware Specifications
Abstract
Estimating the overall user experience (UX) on a device is a common challenge faced by manufacturers. Today, device makers primarily rely on microbenchmark scores, such as Geekbench, that stress test specific hardware components, such as CPU or RAM, but do not satisfactorily capture consumer workloads. System designers often rely on domain-specific heuristics and extensive testing of prototypes to reach a desired UX goal, and yet there is often a mismatch between the manufacturers’ performance claims and the consumers’ experience.
We present our initial results on predicting real-life user experience on laptops from their hardware specifications. We target web applications that run on Chromebooks (ChromeOS laptops) for a simple and fair aggregation of experience across applications and workloads. On 54 laptops, we track 9 UX metrics on common end-user workloads: web browsing, video playback and audio / video calls. We focus on a subset of high-level metrics exposed by the Chrome browser, that are part of the Web Vitals initiative for measuring user experience on web applications.
With a dataset of 100K UX data points, we train gradient boosted regression trees that predict the metric values from device specifications. Across our 9 metrics, we note a mean score (goodness-of-fit on our dataset) of and a mean MAAPE (percentage error in prediction on unseen data) of .
1 Introduction
Computer hardware continues to evolve rapidly. Intel released 150+ CPU SKUs (unique identifiers for processors) in 2022 alone [5], each with a unique base frequency, core count, thread count, etc. The number of possible ways to assemble a system grows exponentially as we multiply the available options for the various components: CPU, GPU, RAM, display etc. Computer architects have the challenging job of perfecting a device assembly to match a target performance goal. This demands deep domain knowledge, heuristics to estimate performance of designs, and then extensive testing of prototypes to verify that the desired performance is achieved. Yet, the manufacturers’ claims regarding device performance often does not match the consumers’ experiences [22].
While there has been prior effort [21, 28, 27] towards predicting performance, they have primarily targeted popular CPU microbenchmark suites, such as Geekbench [4] and SPEC [18]. Li et al. [21] propose an approach based on Multiple Additive Regression Trees (MARTs) [16] for predicting processor performance on SPEC benchmarks. Wang et al. [28] use deep neural networks (DNNs) to predict the performance of Intel CPUs on both Geekbench and SPEC suites. In a recent work, Cengiz et al. [13] also leverage DNNs to predict SPEC scores with very high accuracy. A recent survey by Tousi and Luján [27] compares a number of different approaches for predicting SPEC scores and note that tree-based models provide the best results. Beyond CPU performance prediction, Morlans et al. [23] recently proposed ML models for predicting power consumption. These approaches demonstrate the power of ML for performance prediction, but they are too specific to particular subsystems, such as CPU or power, and do not generalize to predicting overall user experience (UX).
While these microbenchmarks are excellent at stress testing a system, revealing the “peak” system performance, they do not satisfactorily model the “average” UX, as observed by Moorhead [22]. Designing workloads that mimic end-user use cases is challenging, and the large diversity in operating systems and software libraries makes a fair comparison of UX even more difficult. In this study, we restrict our attention to ChromeOS [3], which primarily runs web applications (webapps), such as Google Docs, Google Meet, YouTube etc. Every webapp runs within the Chrome browser, which simplifies the tooling required for a fair aggregation and comparison of UX indicators.
| Latency | Responsiveness | Smoothness | ||
| Startup Time | Janky Intervals | Dropped Frames | ||
| Time (ms) since an application invocation to a window launch | Number of 100ms intervals in which a user event was in queue | Fraction (%) of frames dropped during scrolling or update | ||
| Tab Switch Time | Key Press Delay | Window Animation | ||
| Time (ms) since a tab switch event to the first rendered frame | Time (ms) taken by application to start a key press event | Relative (%) FPS (compared to 60 FPS) during window hiding | ||
| Largest Contentful Paint | Mouse Press Delay | Tab Switch Animation | ||
| Time (ms) taken to paint the largest image or text block | Time (ms) taken by application to start a mouse press event | Relative (%) FPS (compared to 60 FPS) during tab switching |
ChromeOS powers the Chromebook [2] laptops that are widely used in the education sector [9, 29, 12]. We define automated tests that replicate common end-user workloads from telemetry data, including document editing and web browsing, YouTube playback, and video calling in Google Meet. We observe that system-level health metrics such as CPU/RAM usage, system load etc. do not always indicate perceivable UX degradation. Instead, we identify a subset of metrics from the Chrome browser [7], that capture noticeable performance degradation. For instance, users notice when an application takes too long to start, or when an application is slow in responding to keyboard or mouse actions. Our metrics are part of the Web Vitals [8] initiative that outlines a set of key performance indicators (KPIs) for web applications. We list these metrics in Table 1, and discuss more in § 2.
We run our test automation to track 9 UX metrics on 54 Chromebooks from 4 manufacturers, and gather 100K UX data points. We train a set of gradient boosted regression trees (GBRTs) [16], one per UX metric. We observe an average score [30] of indicating that the trained GBRTs are a “good fit” on our dataset, i.e., they explain the variations in the dataset well. We also achieve an average MAAPE of , indicating a low percentage error rate in predictions. We discuss these models and our results in more detail in § 4.
In summary, the key contributions presented in this paper are the following:
-
1.
We define automated tests for ChromeOS webapps that mimic end-user workloads, and identify a subset Chrome browser metrics that strongly correlate with perceivable UX degradation.
-
2.
On 54 Chromebooks, we evaluate these UX metrics across our tests, and curate a hardware specifications UX metrics dataset with 100K data points.
-
3.
We train gradient boosted regression trees that predict these UX metrics accurately.
2 Data Collection
In this section, we detail our dataset — our collection of Chromebook devices, the target workloads and automated tests, the UX metrics we track during these automated tests across all our devices.
Devices & Specifications.
We setup a test bed of 54 Chromebooks. To ensure good diversity, we collected devices from 4 well-known manufacturers, containing system on chips (SoCs) from 4 well-known vendors. While all our device SoCs have a 64-bit architecture, we have a mix of both ARM64 and x64 SoCs. In § A.1, we present a distribution of the hardware specs within our test bed.
We exclude the following major components from our current study: (a) battery specs: since we only evaluate UX when devices are on AC power (b) storage (HDD/SSD) specs: since ChromeOS workloads are primarily CPU-intensive [10] (c) GPU specs: all of our Chromebooks have integrated GPUs and exact specs on core count, FLOPS etc. are not readily available in most cases.
Workloads & Tests.
Our target workloads are inspired by end-user telemetry data. They primarily focus on web browsing, document editing in Google Docs, audio / video calling in Google Meet, and video playback in YouTube. We defined automated tests that mimic these use cases.
We take several steps to reduce variability in measurements: (a) our devices run the same ChromeOS version (b) tests are run only when the device is on AC power (c) we run each test is run multiple times per device (d) if a test does not run to completion, we discard all collected metrics.
User-Experience Metrics.
We track 9 metrics, listed in Table 1, from the “User Metrics Analysis” framework [7] in the Chrome browser, that directly quantify UX degradation. Many of our metrics are part of the Web Vitals [8] initiative that outlines a set of key performance indicators for webapps:
Beyond these page-level metrics, we also track application-level metrics such as startup time and window / tab animation smoothness to capture a holistic view of user experience.
As a sanity check before building predictive models, we also performed a correlation analysis between our Chromebook specifications and the UX metric values, to check if user experience generally improved with better hardware. We discuss the correlation matrix in § A.2.
3 Methodology
In this section, we overview (a) our data pipeline — our data cleaning and feature engineering processes (b) our machine-learning (regression) model. Formally, for each metric we train a function that given a vector of hardware specifications predicts an estimated value for the metric (with some true value ) based on the model parameters learned during training.
Data Cleaning.
We discard metrics from tests that terminate before completion. We also remove extreme values, such as 100% dropped frames and 0% smoothness. To reduce the impact of outliers, we only use the median of the multiple per-test iterations. Mean seemed highly susceptible to outliers.
Feature Engineering.
We list our features § A.3; all are numeric, except the following:
-
•
We use a one-hot encoding [31] for the CPU vendor name: a categorical feature with 4 choices.
-
•
We use a single pixel count feature as opposed to using vertical and horizontal components of display resolution, as performance typically depends on the number of pixels not their position.
ML Model.
Tree-based models have been shown to be more effective [14, 26] than neural models, especially at regression on tabular data, i.e., data with a fixed set of features. Tabular data often poses challenges for neural networks: lack of locality, data sparsity, mixed feature types etc. Further, given their determinism and interpretability, we use Gradient Boosted Regression Trees (GBRTs) [16]. We clip the outputs of our GBRTs from below at zero, since all our metrics assume non-negative values.
4 Evaluation
We use a 80% / 10% / 10% pseudo-random split of our devices for training / validation / testing, ensuring good diversity of specs in all sets. We detail our training process and then our results below.
Training.
For training our GBRT models, we use the GradientBoostingRegressor interface in the scikit-learn [25] Python library. We minimize the default loss function on the training data — the Mean Squared Error (MSE) using Friedman [16]’s least-squares improvement criterion.
We use cross-validated grid search [24] to optimize 5 hyperparameters: (a) learning rate (b) the number of estimators (c) subsampling for estimators (d) depth of estimators (e) number of features to split on. The optimal hyperparameter values are listed in the appendix, § A.4.
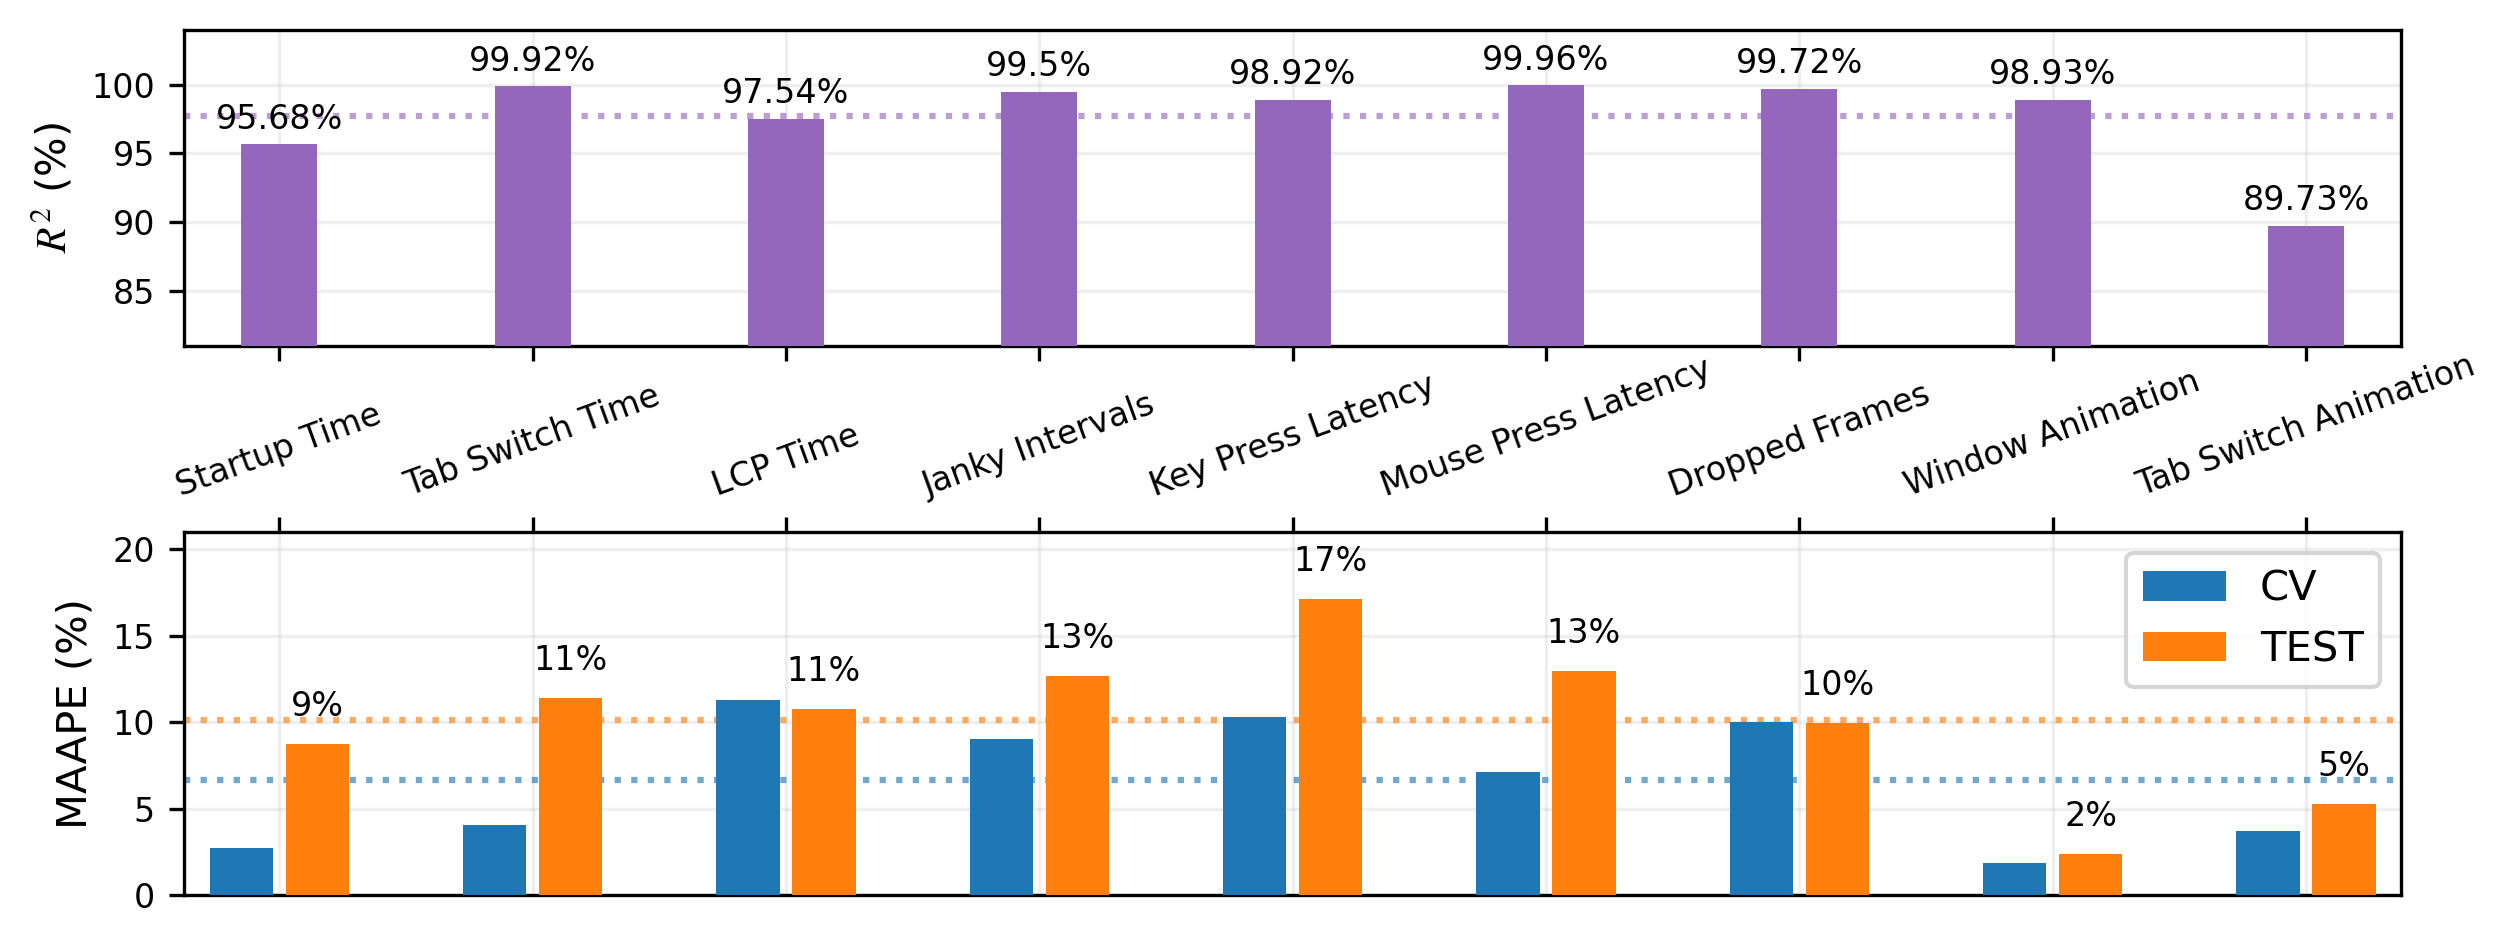
Assessment.
In Figure 1, we present an evaluation of our GBRTs, one per metric from Table 1. We measure (a) the goodness of fit on learning dataset (b) the prediction error rates on test dataset.
We compute the score [30], to measure how well our regression models fit our datasets. We observe a mean score of , indicating that our models fit our datasets very well. However, does not indicate prediction accuracy or model generalization on out-of-sample points [17]. For prediction error rate, we compute the Mean Arctangent Absolute Percentage Error (MAAPE) [20], which provides a stable relative error even when the true values are zero. For instance, a zero value for the “Janky Intervals” metric indicates that there was no queuing in browser event processing during a test, which is actually observed on several devices.
5 Limitations
While we believe that our results are promising, we are aware of the following key limitations:
-
•
While ChromeOS supports Linux and Android applications inside virtual machines or within containers, we restrict the workloads in our experiments to only native (web) applications.
-
•
There is an observation cost in measuring UX metrics while running the workloads. We believe this overhead is minimal, as we directly use the Chrome browser’s UMA [7] framework.
-
•
We collect UX metrics only when the devices are connected to AC power, so our current study makes no claims regarding the user experience when laptops are on battery power.
Acknowledgments and Disclosure of Funding
We thank Jesse Barnes and Dossym Nurmukhanov for their support in making this experiment possible. We also thank Willis Kung and Sanghwan Moon for their insights and valuable discussions, and David Lo for reviewing our early drafts and providing feedback.
References
- chr [a] Largest Contentful Paint. https://www.w3.org/TR/largest-contentful-paint/, a. Accessed: 2023-08-01.
- chr [b] Google Chromebooks. https://www.google.com/chromebook/, b. Accessed: 2023-08-01.
- chr [c] Google ChromeOS. https://www.google.com/chromebook/chrome-os/, c. Accessed: 2023-08-01.
- [4] Geekbench 6. https://www.geekbench.com/. Accessed: 2023-08-01.
- [5] Intel Processors. https://www.intel.com/content/www/us/en/products/details/processors.html. Accessed: 2023-08-01.
- [6] Chromium Scheduler Responsiveness Calculator. https://chromium.googlesource.com/chromium/src.git/+/refs/tags/115.0.5790.177/content/browser/scheduler/responsiveness/calculator.cc. Accessed: 2023-08-01.
- [7] Chrome Platform Status: HTML & JavaScript Usage Metrics. https://chromestatus.com/metrics/feature/popularity. Accessed: 2023-08-01.
- [8] Web Vitals. https://web.dev/vitals/. Accessed: 2023-08-01.
- Ahlfeld [2017] K. Ahlfeld. Device-Driven Research: The Impact of Chromebooks in American Schools. International Information & Library Review, 49(4):285–289, 2017.
- Boroumand et al. [2018] A. Boroumand, S. Ghose, Y. Kim, R. Ausavarungnirun, E. Shiu, R. Thakur, D. Kim, A. Kuusela, A. Knies, P. Ranganathan, et al. Google Workloads for Consumer Devices: Mitigating Data Movement Bottlenecks. In Proceedings of the Twenty-Third International Conference on Architectural Support for Programming Languages and Operating Systems, pages 316–331, 2018.
- Breiman [2001] L. Breiman. Random forests. Machine learning, 45:5–32, 2001.
- Carter [2018] T. Carter. Preparing Generation Z for the Teaching Profession. Srate Journal, 27(1):1–8, 2018.
- Cengiz et al. [2023] M. Cengiz, M. Forshaw, A. Atapour-Abarghouei, and A. S. McGough. Predicting the Performance of a Computing System with Deep Networks. In Proceedings of the 2023 ACM/SPEC International Conference on Performance Engineering. ACM, 2023. doi: 10.1145/3578244.3583731.
- Chen and Guestrin [2016] T. Chen and C. Guestrin. Xgboost: A scalable tree boosting system. In Proceedings of the 22nd acm sigkdd international conference on knowledge discovery and data mining, pages 785–794, 2016.
- Freedman et al. [2007] D. Freedman, R. Pisani, and R. Purves. Statistics (international student ed.). Pisani, R. Purves, 4th edn. WW Norton & Company, New York, 2007.
- Friedman [2001] J. H. Friedman. Greedy Function Approximation: A Gradient Boosting Machine. Annals of statistics, pages 1189–1232, 2001.
- Hawinkel et al. [2023] S. Hawinkel, W. Waegeman, and S. Maere. Out-of-Sample : Estimation and Inference. The American Statistician, (just-accepted):1–16, 2023.
- Henning [2006] J. L. Henning. Spec cpu2006 benchmark descriptions. ACM SIGARCH Computer Architecture News, 34(4):1–17, 2006.
- Kendall [1938] M. G. Kendall. A new measure of rank correlation. Biometrika, 30(1/2):81–93, 1938.
- Kim and Kim [2016] S. Kim and H. Kim. A new metric of absolute percentage error for intermittent demand forecasts. International Journal of Forecasting, 32(3):669–679, 2016.
- Li et al. [2009] B. Li, L. Peng, and B. Ramadass. Accurate and efficient processor performance prediction via regression tree based modeling. Journal of Systems Architecture, 55(10-12):457–467, 2009.
- [22] P. Moorhead. Misunderstood Mobile Benchmarks are Hurting the Industry and Consumers. https://www.forbes.com/sites/patrickmoorhead/2015/06/12/misunderstood-or-inappropriate-mobile-benchmarks-are-hurting-the-industry-and-consumers/. Accessed: 2023-08-01.
- Morlans et al. [2022] C. P. Morlans, R. R. Buchillon, U. K. Ammu, P. Voravootivat, and M. Hashemi. Power Consumption Estimation for Laptops a Machine Learning Approach. In NeurIPS 2022 - Workshop on ML for Systems, 2022.
- Müller and Guido [2016] A. C. Müller and S. Guido. Introduction to machine learning with Python: a guide for data scientists. " O’Reilly Media, Inc.", 2016.
- Pedregosa et al. [2011] F. Pedregosa, G. Varoquaux, A. Gramfort, V. Michel, B. Thirion, O. Grisel, M. Blondel, P. Prettenhofer, R. Weiss, V. Dubourg, J. Vanderplas, A. Passos, D. Cournapeau, M. Brucher, M. Perrot, and E. Duchesnay. scikit-learn: Machine learning in Python. Journal of Machine Learning Research, 12:2825–2830, 2011.
- Shwartz-Ziv and Armon [2022] R. Shwartz-Ziv and A. Armon. Tabular data: Deep learning is not all you need. Information Fusion, 81:84–90, 2022.
- Tousi and Luján [2022] A. Tousi and M. Luján. Comparative analysis of machine learning models for performance prediction of the spec benchmarks. IEEE Access, 10:11994–12011, 2022.
- Wang et al. [2019] Y. Wang, V. Lee, G.-Y. Wei, and D. Brooks. Predicting new workload or cpu performance by analyzing public datasets. ACM Transactions on Architecture and Code Optimization (TACO), 15(4):1–21, 2019.
- Williamson [2019] B. Williamson. New power networks in educational technology, 2019.
- Wright [1921] S. Wright. Correlation and Causation. 1921.
- Zheng and Casari [2018] A. Zheng and A. Casari. Feature Engineering for Machine Learning: Principles and Techniques for Data Scientists. O’Reilly Media, Inc., 2018.
A Appendix
A.1 Distribution of Hardware Specifications
All 54 devices in our test bed had 60 Hz display refresh rate. Below, we present the distribution of other CPU, RAM and display specs across our devices.
![[Uncaptioned image]](/html/2402.08964/assets/figures/hw_specs_dist.png)
A.2 UX Metrics Hardware Specs Correlation
As opposed to Pearson’s [15], which captures linear correlation, we found Kendall’s rank correlation [19] to be more informative. We present the correlation matrix below.
![[Uncaptioned image]](/html/2402.08964/assets/figures/corr.png)
A positive value indicates that the UX metric often increases as a hardware spec value improves and vice versa. Similarly, a negative value indicates that the UX metric often decreases as a hardware spec value improves and vice versa. The correlation patterns match our expectations: (a) latencies, and timings metrics negatively correlate with hardware specs (b) frame drop rate and jankiness also negatively correlate (c) animation smoothness metrics positively correlate with hardware specs. We observe that RAM capacity and CPU thread count have the strongest correlation with most UX metrics. CPU base frequency seemed to have the weakest correlation across metrics, but that is expected since the OS dynamically adjusts the CPU’s running frequency.
We note one interesting correlation that ran counter to our intuition. Higher display resolution seems to correlate with lower latencies and with higher animation smoothness! On performing a cross correlation between hardware specifications, it was revealed that most devices with higher display resolution simultaneously also had better CPU and RAM specifications, therefore demonstrating lower latencies and higher animation smoothness.
A.3 Device Specification Features
| CPU | RAM | Display |
| Base Frequency (GHz) | Data Rate (GT/s) | Pixel Count * |
| (Float) | (Integer) | (Integer) |
| Core Count | Capacity (GB) | Refresh Rate (Hz) $ |
| (Integer) | (Integer) | (Integer) |
| Thread Count | ||
| (Integer) | ||
| Vendor Code # | ||
| (One-Hot) |
* Pixel Count = Horizontal Pixels Vertical Pixels, e.g. 2073600 for 1920 1080 resolution.
$ Refresh rate, although collected, is dropped from training, since it is 60 Hz for all our devices.
# Vendor Code is a one-hot encoding [31] for 4 distinct CPU vendor names (a categorical field).
A.4 Model Hyperparameters
In the tables below, an unspecified (-) indicates the following:
-
•
for Max Features parameter: all features are considered for the best split.
-
•
for Max Depth parameter: tree nodes are expanded until all leaves are pure.
A.4.1 GBRTs for Latency Metrics
| Startup | Tab Switch | LCP | |
| Time | Time | Time | |
| Estimators | 128 | 128 | 96 |
| Learning Rate | 0.3 | 0.3 | 0.2 |
| Subsample | 0.7 | 0.7 | 0.5 |
| Max Features | 3 | - | 6 |
| Max Depth | 2 | - | - |
A.4.2 GBRTs for Responsiveness Metrics
| Janky | Key Press | Mouse Press | |
| Intervals | Delay | Delay | |
| Estimators | 128 | 96 | 128 |
| Learning Rate | 0.3 | 0.3 | 0.3 |
| Subsample | 1.0 | 0.7 | 0.6 |
| Max Features | 3 | 6 | 3 |
| Max Depth | 5 | - | 5 |
A.4.3 GBRTs for Smoothness Metrics
| Dropped | Window | Tab | |
| Frames | Animation | Animation | |
| Estimators | 96 | 128 | 96 |
| Learning Rate | 0.3 | 0.1 | 0.3 |
| Subsample | 1.0 | 1.0 | 0.6 |
| Max Features | 7 | - | 2 |
| Max Depth | 5 | 5 | 3 |
A.5 Feature Importance for GBRTs
For a high-level understanding of our models, we compute the permutation importance of features [11] for each GBRT. Permutation importance of a particular feature is defined as the decrease in a model score when only that feature is randomly shuffled. Below, we show the feature importance matrix with the feature importance values for each model normalized to .
![[Uncaptioned image]](/html/2402.08964/assets/figures/fimp.png)
As in the correlation matrix in § A.2, we observe that CPU thread count is one of the most important features across all models. On the other hand, CPU core count and display resolution have low importance across all models. RAM capacity seemed more important in predicting smoothness metrics, but not so much for latency or responsiveness. A few models relied heavily on the one-hot encoded SoC vendor id, perhaps to effectively partition the feature space and learn more accurate vendor-specific predictors. It is important to note that unlike correlation analysis, which reveals true patterns in the data, feature importance only indicates the subset of specs that the GBRTs use to accurately partition the feature spaces and predict metric values with minimal errors.