Constraining neutrino-DM interactions with Milky Way dwarf spheroidals and supernova neutrinos
Abstract
We constrain the neutrino-dark matter cross section using properties of the dark matter density profiles of Milky Way dwarf spheroidal galaxies. The constraint arises from core-collapse supernova neutrinos scattering on dark matter as a form of energy injection, allowing the transformation of the dark matter density profile from a cusped profile to a flatter profile. We assume CDM, collisionless and non-self-interacting dark matter, and by requiring that the dark matter cores do not overshoot constraints from stellar kinematics, we place an upper limit on the cross section of , which is stronger than existing ones by several orders of magnitude. Consideration of baryonic feedback or host galaxy effects on the dark matter profile can strengthen this constraint.
I Introduction
Constraining the interaction cross section between neutrinos and dark matter (DM), , is important to better understand both neutrinos and DM. Such an interaction is intriguing considering the fact that the neutrino properties we observe do not agree with the predictions from the Standard Model (SM), e.g., the origin of neutrino masses [1, 2, 3, 4, 5, 6] and oscillation experiment anomalies [7, 8]. However, given the weak nature of neutrino interactions, the cross section is only weakly tested, mostly from astrophysical neutrinos, e.g., SN1987A [9], higher energy astrophysical neutrinos observed at IceCube [10, 11, 12, 13], or low energy relic neutrinos [14, 15]. Other searches have looked for the effects such an interaction will have on cosmology [9, 16, 17, 18, 19], astrophysics [20, 21, 22, 23, 24], boosted DM detection [25, 26, 27, 28, 29, 30, 31, 32, 33], etc.
If DM scattering can take place, it can also have effects on the small-scale structure of the universe. For example, CDM by itself cannot reproduce the observed small-scale structures purely thought gravitational interactions (for a review see, e.g., Ref. [34]). One such problem is that the DM only simulations predict sub-halos inhabited by dwarf galaxies to have cuspy DM density profiles [35, 36], while observations suggest the presence of near constant density cores of DM [37, 38, 39, 40, 41, 42, 43, 44]. Many solutions to this discrepancy exist involving some form of feedback in order to cause a redistribution of the DM mass profile, e.g., Refs. [45, 46, 47]. The question of how effective baryonic feedback should be is still an ongoing effort. The role of neutrinos, specifically those from core-collapse supernovae (CCSNe), as a source of feedback in dwarf galaxy-sized sub-halos, is not well studied.
In this paper, we explore supernova neutrinos as a source of energy for feedback, in particular in light of beyond the standard model (BSM) physics which allow larger interactions between neutrinos and DM. This is potentially a powerful probe since each CCSNe emits erg of energy in neutrinos [48, 49, 50, 51, 52, 53, 54, 55, 56], so the total energy budget available for injection over the history of the dwarf galaxy is potentially very large. Since CCSNe neutrinos have MeV energies, there are neutrinos from each CCSNe. Therefore, even small interaction cross sections may still have noticeable impacts on DM structures. This is because the scattering will inject some amount of energy into the DM, and this can change, e.g., an initially cuspy central density profile into a centrally cored profile. Since observations of stellar kinematics constrain the maximum size of such DM density cores, the amount of energy that can be injected into the sub-halo is constrained which translates into a constraint on .
In this work, we derive an upper bound on the cross section between neutrinos and DM. We use the fact that measured core sizes have estimated upper limits to constrain the maximum size of the interaction cross section. As we know that CCSNe have occurred in these dwarf spheroidals, there is an associated neutrino emission with typical energies of erg released in neutrinos per supernova with an average neutrino energy of 15 MeV. In order to not overshoot estimated upper limits of DM core sizes, we find that , which is several orders of magnitude stronger than those at similar energies from SN1987A [9]. Considering other forms of energy injection or feedback occurring would strengthen our constraints.
II Dwarf Galaxy Sub-Halo Properties
In this section, we cover the DM sub-halo properties of the dwarf spheroidals (dSphs) studied in this work. These properties are estimated from stellar kinematic data of the stars in the dwarfs. We also cover how we model the amount of energy needed to transform a cusped profile into a cored profile, for which we follow the methods of Ref. [46].
II.1 NFW parameters
To be able to constrain the DM interaction, we assume that CDM cosmology is correct and that the sub-halos of DM that dSphs occupy initially have a NFW profile. We first find the properties of the DM sub-halo that each dwarf spheroidal occupies.
We estimate the density distribution of the DM from the motions of stars in dwarf galaxies, based on the Jeans equation. This analysis closely mirrors previous work that investigated the deformation of the DM density distribution due to DM self-interactions, see Ref. [57].
We model the sub-halo DM density distribution for core radius with a modification of the NFW profile,
| (1) |
where is the characteristic halo density and is the scale radius.
We adopt the data on half-light radii, characterized using the Plummer profile, from Ref. [58]. Additionally, we utilize the stellar kinematics data of member stars in each dwarf galaxy, as reported in various sources [59, 60, 61, 62, 63, 64, 65, 66, 67, 68, 69, 70, 70, 71, 72, 72, 73, 74, 75, 76, 77]. Furthermore, we apply the concentration-mass relation to the NFW model parameters, as described by Ref. [78].
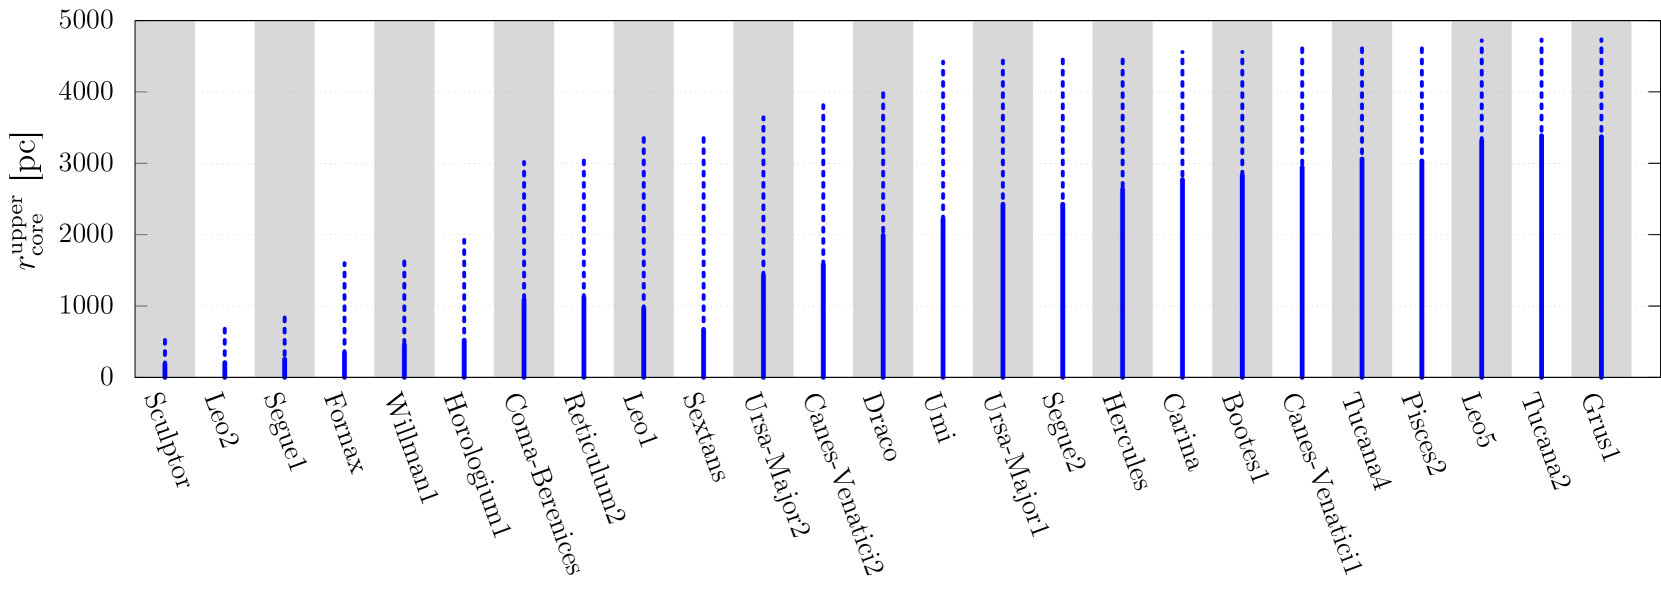
These allow us to estimate for each dwarf galaxy we consider in this study. The upper limit for each is shown in Fig. 1, where the solid (dashed) lines correspond to the () upper limit. These are the values of that let us place an upper limit on the energy injection from interactions that is allowed. The NFW parameters assuming are also estimated using Markov chain Monte Carlo techniques, the results of which are shown in Table 1.
II.2 Virial radius and mass
We assume the DM profile is virialized and in equilibrium before any CCSNe occur. Then, the neutrinos emitted from CCSNe within the dSphs interact with the DM sub-halo, injecting energy via DM scatterings and causing the profile to become cored. In this process, we assume that DM is not lost such that the sub-halo remains at a constant mass, and that the profiles re-virialize and is equilibrated again into what we currently observe.
We define the virial radius () and the virial mass () adopting , i.e., that the sub-halo extends until the density of the DM is 200 times greater than the critical density of the universe,
| (2) |
where is the Hubble constant and is Newton’s gravitational constant.
Therefore, we can simply find the virial radius using the sub-halo parameters found in Sec. II.1. Using Eq. (1) with and the NFW parameters, we find at what radius does the density satisfy the condition of Eq. (2). As we keep the virial mass constant and only the inner regions of the DM profile change with the energy injection, this should stay constant as the core forms. The specific values of for each dwarf galaxy are found in column 5 of Table 1. is then found easily as well. We take the volume integral of the mass density profile out to . These masses are given in column 6 of Table 1.
We assume that the only form of feedback that acts upon the DM sub-halos is from neutrinos. This should make our upper bound a conservative limit, as we ignore other sources of feedback, e.g., gas blowout or tidal effects from the MW DM halo, and other possible sources that can change the shape of the DM profile [45, 79, 80, 81, 82, 83, 84, 85, 86, 87, 88, 47, 89, 90, 91, 92, 93, 94, 95, 96, 97, 98, 99, 100, 101, 102, 103].
III Deriving the upper limit on the DM-neutrino cross section
In this section, we first define the CCSN neutrino energy spectrum. We then use the dwarf galaxy properties to estimate how many CCSNe have gone off in each dwarf galaxy. Next, we get an upper limit on the amount of energy that can be injected into the DM sub-halo by neutrino interactions using the estimated upper limit of the core radius found from stellar kinematics. This energy constraint is then transformed into a constraint on the interaction cross section under certain assumptions of the interaction. These assumptions are that the interactions take place within the DM core region and that each interaction has maximal energy transfer.
III.1 Neutrino Emission
In our phenomenological derivation of an upper limit on , we consider flavor-independent interactions. For the sake of simplicity, we therefore use a time-integrated, flavor-independent energy spectrum for CCSN neutrino emission from Ref. [104], which when normalized is given by,
| (3) |
where is the total energy emitted in neutrinos, is the average neutrino energy, is the pinching parameter, and is the gamma function. The normalization of is such that , where is the total number of neutrinos emitted. The bounds of the integral is the energy range of the neutrinos, which throughout this work we choose to be 0 to 1 GeV. The specific values of the spectrum parameters change over time during core collapse due to the different stages of collapse, asymmetries, dependence upon the stellar progenitor, and remnant. To reduce complexity, we consider only the time-integrated spectrum with averaged values motivated by simulations of CCSNe [104, 105, 106, 107, 108, 109, 110]: erg, MeV, and (Fermi-Dirac). This is reasonable given the duration of neutrino emission for each CCSN, which is only seconds and much shorter than the time of the DM profile adjusting.
We then find the total energy budget of CCSN neutrinos for each dwarf galaxy. For this, we take the observed stellar masses of the dwarf and use that as the total historical stellar mass. This assumption and the fact that in order to find the stellar mass, it is assumed that , should lead to a minimum estimate for the total historical stellar mass and therefore a conservative estimate on the total neutrino energy budget. Next, we assume an initial mass function (IMF) of Ref. [111],
| (4) |
normalized such that . We can then estimate the approximate number of massive stars that used to exist, and therefore the number of CCSNe () that have occurred in each dwarf galaxy using the following equation,
| (5) |
which builds on the observation that the minimum mass threshold for core collapse is [112, 113, 114, 115]. Here, is the stellar mass of the dwarf galaxy which sets the overall normalization. The calculation of this for each dwarf galaxy is shown in the third column of Table 2, kept as floating point numbers. Then, we simply assume that each CCSNe emits erg of energy in neutrinos in order to get the total DM energy budget as seen in column 4 of Table 2, e.g., .
III.2 Constraining the energy injected into DM
In order to place a constraint on the energy injection, we must first find out the energy needed to transform the DM profile. For this, we follow Ref. [46]. We assume a CDM cosmology with , =0.268, , and (). With these parameters and assuming constant sub-halo mass and full equilibration for the initial cusped profile and the final cored profile we observe today, the virial theorem can be applied to find the energy needed for the transformation to occur. This change in energy required is,
| (6) |
where the work, , is given by
| (7) |
with being the halo mass profile. The halo mass profile is found by integrating the density profile over volume and has the analytic form of,
| (8) |
where and .
Using Eqs. (1)–(8) and the dwarf galaxy properties shown in Table 1, we calculate the energy required for this transformation between the bounds of the core radius estimates, which are the last two columns in Table 2.
| Name | [/pc]111assuming a pure NFW profile | [pc] | [] | Refs. | ||
|---|---|---|---|---|---|---|
| Seg1 | [116, 117] | |||||
| Seg2 | [118] | |||||
| Boo1 | [116, 119] | |||||
| Her | [120, 116] | |||||
| Com | [121, 116] | |||||
| CVn1 | [121, 116] | |||||
| CVn2 | [121, 116] | |||||
| Leo5 | [116, 122, 123] | |||||
| UMa1 | [121, 116] | |||||
| UMa2 | [121, 116] | |||||
| Ret2 | [124, 125, 126] | |||||
| Psc2 | [127] | |||||
| Gru1 | [126, 128] | |||||
| Hor1 | [126, 125] | |||||
| Tuc2 | [124, 129] | |||||
| Tuc4 | [130, 131] | |||||
| Wil1 | [116, 132] | |||||
| Car | [116, 133, 134] | |||||
| Dra | [116, 135, 136] | |||||
| For | [116, 134, 133, 137] | |||||
| Leo1 | [116, 138] | |||||
| Leo2 | [116, 136] | |||||
| Scl | [116, 133, 134, 139] | |||||
| Sex | [116, 133, 134] | |||||
| UMi | [116, 135, 140] |
| Name | []222assuming from Refs. [127, 141] | [erg] | [erg] | [erg] | [erg] | |
|---|---|---|---|---|---|---|
| Seg1 | ||||||
| Seg2 | ||||||
| Boo1 | ||||||
| Her | ||||||
| Com | ||||||
| CVn1 | ||||||
| CVn2 | ||||||
| Leo5 | ||||||
| UMa1 | ||||||
| UMa2 | ||||||
| Ret2 | ||||||
| Psc2 | ||||||
| Gru1 | ||||||
| Hor1 | ||||||
| Tuc2 | ||||||
| Tuc4 | ||||||
| Wil1 | ||||||
| Car | ||||||
| Dra | ||||||
| For | ||||||
| Leo1 | ||||||
| Leo2 | ||||||
| Scl | ||||||
| Sex | ||||||
| UMi |
We constrain the amount of energy that can be injected into the DM sub-halo of each dwarf galaxy using Eq. (6). We do this by requiring that the energy injected must not be too large such that the core size becomes larger than the estimation. For this, we allow the fraction of energy injected,
| (9) |
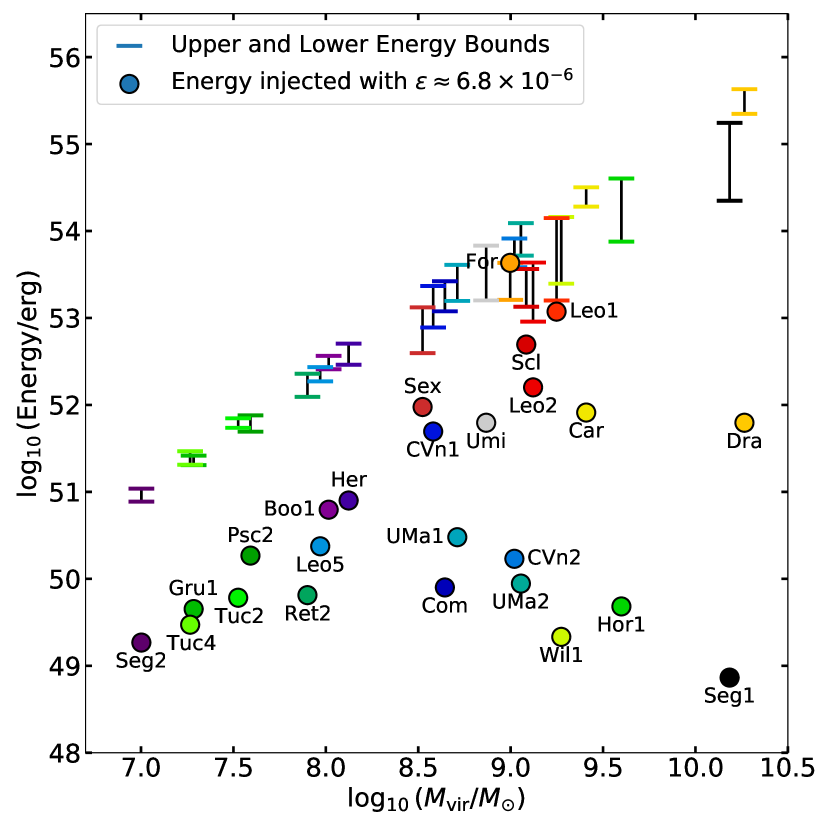
to be freely changed until it satisfies our virial energy change constraint for a dwarf galaxy that is well studied. This is shown in Fig. 2, where the horizontal bars are the virial energy change found from Eq. (6) for the upper core radius () and the lower core radius (). The circles correspond to the energy injected calculated using . The resulting upper limit on the energy injection fraction we get is that such that the requirement of is maintained.
III.3 Upper limit on the interaction cross section
With the constraint on , we now convert that into a constraint on the cross section. For this, we assume that the fraction of energy transferred between the neutrinos and the DM in their scattering interaction is what is maximally allowed in relativistic collisions, and that fraction is given by,
| (10) |
where is the DM mass. Defining the number of DM interactions as , we can estimate the fraction of neutrinos that undergo an interaction with DM,
| (11) |
which shows the relation between , , and .
For the DM mass range we consider, is larger than the limit on , and thus , implying that most of the neutrinos are not allowed even a single interaction. We estimate the limit on the cross section by , where is the DM number density and is the mean free path of a neutrino through the DM profile. We estimate this using the column number density of DM,
| (12) |
where we choose to integrate out to the upper limit of the core radius. As we assume an initial cusped NFW profile, a majority of the interactions should occur near the center of the sub-halo, which is where it needs to happen for core formation. This yields the limit,
| (13) |
where is the value of the cross section assuming that all neutrinos are emitted at a single energy. However, as the neutrino spectrum from CCSNe is not mono-energetic, we take into account the spectrum energy dependence. To do so, we average the value of the cross section over the neutrino energy spectrum
| (14) |
where has mass and energy dependence from and .
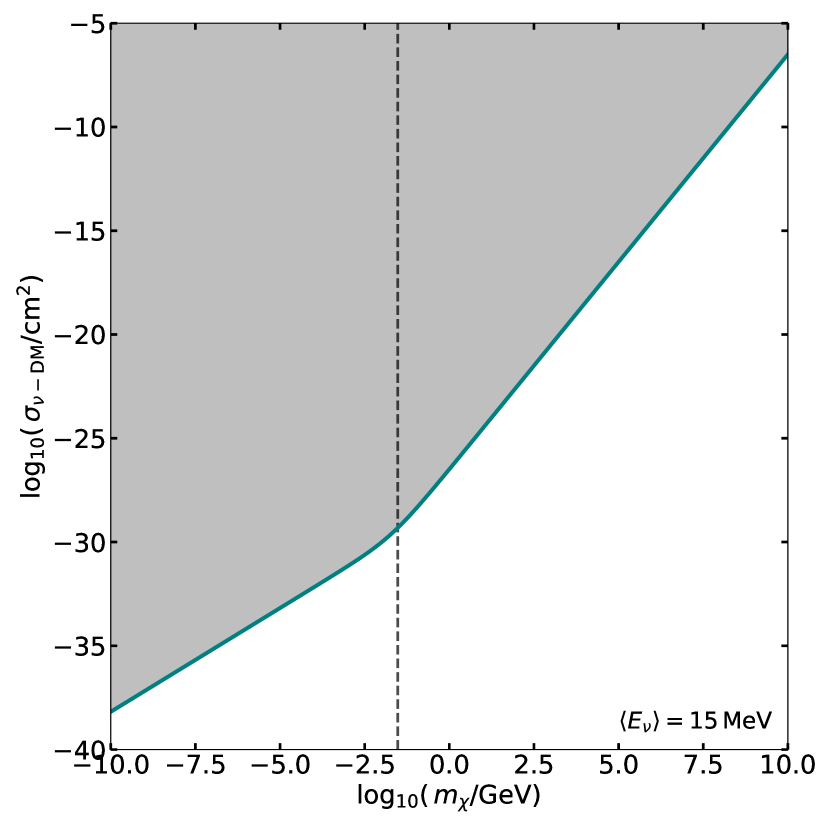
Since the CCSN neutrino spectrum is approximately a Fermi-Dirac spectrum with temperatures in the several MeV, we chose the upper limit of the integration to be 1 GeV. The resulting only has mass dependence, which we plot in Fig. 3. We can see a broken power law behavior of the mass dependence, which comes from the DM mass dependence of Eq. (10). We can approximate the two regions numerically as
| (15) |
If we assume a power law form of the energy dependence of the cross section, then our upper bound is,
| (16) |
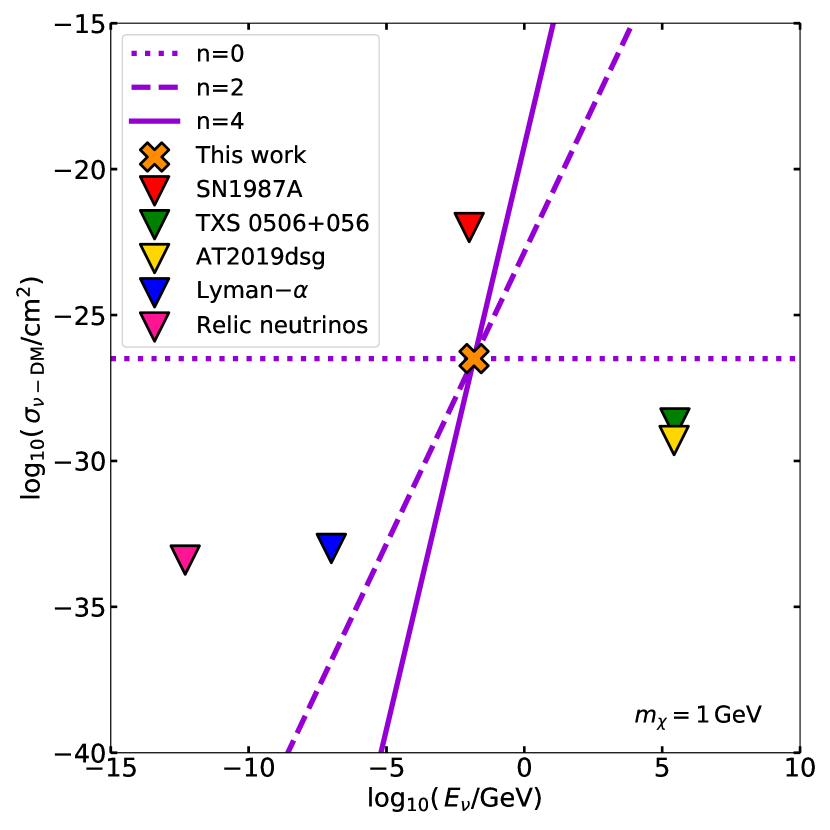
where the specific value of depends on the choice of and determines the specific energy dependence. We plot our upper limit in its naive power law form along with other constraints from similar works in Fig. 4 where in all cases GeV is fixed. We see that in the energy range of CCSNe neutrinos, our upper limit is much stronger than those placed by SN1987A [9].
IV Discussion
In this section we discuss our resulting upper limit and compare it to other limits on the DM cross section. We consider a simple particle DM model and work out how to use our energy constraint to place constraints on the coupling constants. We also go over the different uncertainties that are in our analysis.
IV.1 Comparison to limits from previous works
There are several previous works that constrain the interaction cross section between neutrinos and DM, of which we have chosen a few to compare to. The bounds from the similar studies are also plotted in Fig. 4, represented by the upside-down triangles. The works we chose to compare to are spread out in terms of the neutrino energy, going from 0.5 meV up to 290 TeV.
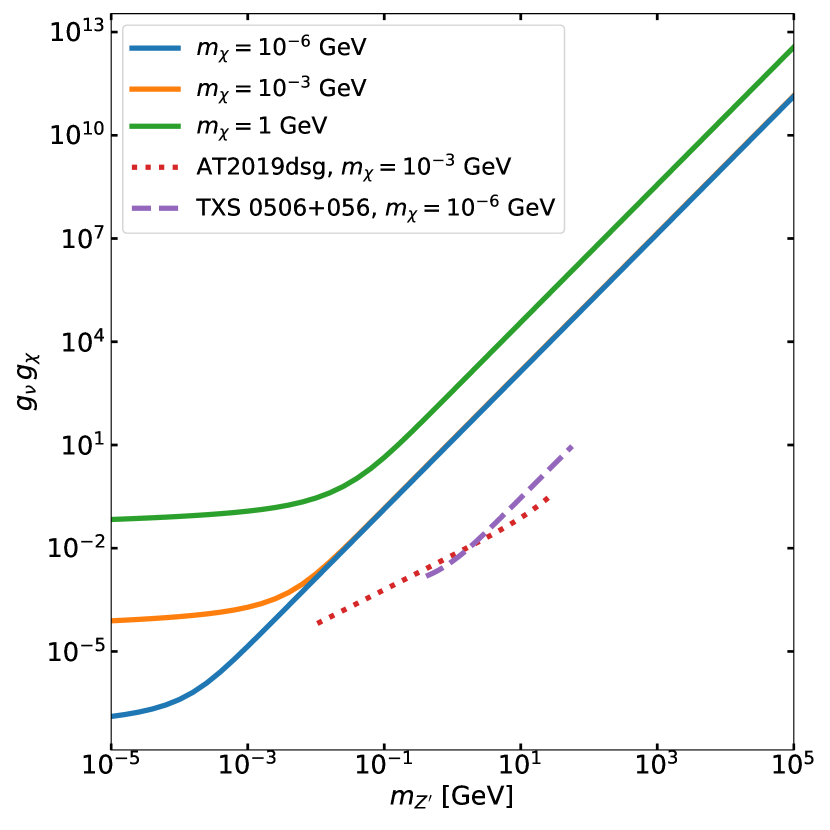
The most relevant comparison is to the bounds from SN1987A, which remains the only supernova we have measured neutrinos from. Reference [9] looks at elastic scattering of neutrinos on DM and uses the fact that the theoretical neutrino flux from SN1987A agrees with the observed neutrino flux [142, 143, 144] to retrieve a bound of cm2 for a 1 GeV DM candidate (red triangle). Our bound for a 1 GeV DM particle is orders of magnitude stronger. A back of the envelope calculation for the reasoning behind this difference is that the estimated column density of DM that SN1987A neutrinos traversed was for a single core-collapse event. The strongest upper bound we derive comes from Fornax dwarf, for which the column density a neutrino has to traverse , and in addition Fornax has had at least core-collapse events. Combining these, statistically one could expect an increase in the strength of the constraint of 5–6 orders of magnitude.
At higher energies, works have used high energy neutrino events observed by the IceCube experiment, e.g., Ref. [10], which looks at the 290 TeV neutrino from the flaring blazar TXS 0506+056 [145]. More stringent constraints have also been made using TXS 0506+056, by assuming DM spike profiles near the supermassive black hole which are model dependent [11, 12] (green triangle). There are also bounds from a high energy neutrino at 270 TeV thought to be associated with the tidal disruption event AT2019dsg [146] also assuming a dark matter spike model [13] (yellow triangle).
Low energy limits come from looking at data from the CMB, BAO, matter power spectrum, and Lyman- data [9, 14, 147, 148, 17, 18]. There are also constraints of relic neutrinos interacting with Milky Way satellites [15]. These limits have a smaller upper bound for the cross section, and fit within the limit found in this paper if the energy dependence scales as .
IV.2 model
As an illustrative example, we discuss a simple model for a Dirac fermion DM candidate that scatters with neutrinos, the model. It is an interaction that has a vector boson exchange () and two couplings and . For simplicity, is assumed to take the same value for all flavors and for particles and anti-particles. This is the same model as discussed in Ref. [11].
Since we are interested in the kinematics of the interaction, we start with the energy-transfer weighted differential cross section,
| (17) |
where and are the coupling constants for neutrinos and DM, respectively, is the energy lost by the neutrino, is the initial neutrino energy, is the DM mass, and is the mediator mass. The full form of the cross section of different models can be found in the appendix of Ref. [149].
In order to place upper limits on the couplings for differing DM masses and mediator masses, we must relate the energy injection constraint we have placed to the differential cross section shown above. First, we find the cross section weighted by the energy transferred in the interaction and normalized by the neutrino energy spectrum, i.e.,
| (18) |
where the limits for the inner integral are from 0 to and the outer integrals are from 0 to 1 GeV. The result of carrying out the integration is , averaged over the neutrino energy spectrum . Next, we relate this to the energy injection limit placed in Sec. III.2 (seen in Table 2 and in Fig. 2). This is accomplished by looking back to Eq. (13), which allows us to write,
| (19) |
which allows us to directly constrain the product of the couplings using the energy injection limit we have placed.
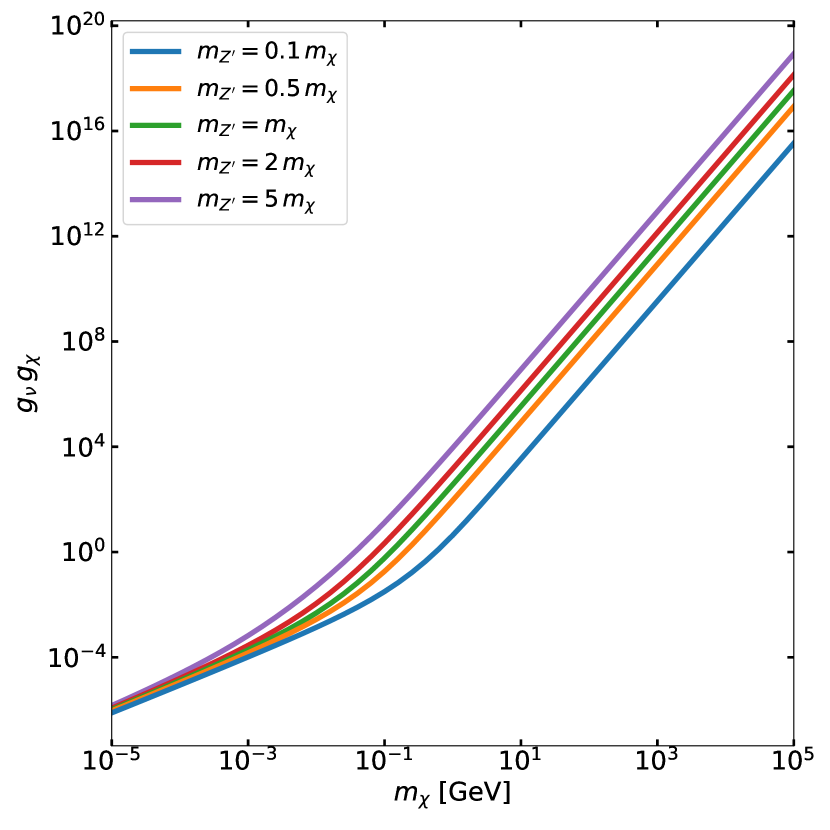
We calculate this limit and show it in Fig. 5, where we plot the upper limit of the coupling product versus the mass of the mediator for three different DM masses. We also plot the coupling upper limit as a function of DM mass for various mediator masses as a factor of the DM mass in Fig. 6.
IV.3 Uncertainties
There are various sources of uncertainty that we do not include in our derivation of an upper bound in the -DM cross section. Uncertainties with the stellar kinematics and stellar groupings can have large effects on the inferred sub-halo properties and observed stellar masses. In order to try and minimize the impact of uncertainties, we make assumptions that result in a more conservative when possible. For example, we chose to use the upper limit for the core radius such that the cross section estimation was maximal. For the same reasoning, we used a minimum estimation for the total dSph stellar mass, which results in the minimum estimate of the number of CCSNe, taking it directly from the observed luminosity with a conservative mass-to-light ratio .
We also ignore any effects other than DM interactions that could contribute to DM core formation. For example, baryonic feedback which results from supernova explosion energy [84, 82, 87, 89, 90, 92, 94, 95, 96, 97, 101, 103] (note that this is the explosion energy, which is % of the total neutrino energy) and tidal effects from the Milky Way halo [80, 85, 87, 88, 91, 95, 98, 100] are both neglected. If any of these were included, they would contribute to DM core formation, yielding stronger constraints on the energy injection and DM interaction.
Other effects we do not consider come from specific DM particle models, such as flavor dependence, that we do not consider as we solely look at the phenomenological upper bound. This can also change the energy dependence of the cross section to not be a simple power law. The mediator of the interaction also affects the cross section which depend on the specific particle model that is considered.
Uncertainties in our derivation itself come from neglecting the distribution of energy transfer, that all interactions occur near the center of the sub-halo, and neglecting time-dependence of CCSNe occurrence. The energy transfer distribution is a highly model dependent quantity, so we only consider one example. For assuming most interactions happen within the central cusp/core region, one can expect most of the interactions to happen within the DM cusp as the number density of DM is much larger compared to other regions of the sub-halo, e.g., for Fornax the column number density only increases by when changing the upper integration bound from to , thus most of the DM lies in the central region. Even when an initial core begins to form, the number density is still larger within the core, so interactions are more favorable within the inner volume. There is also an uncertainty in the pinching/anti-pinching of the neutrino spectrum, but changing this parameter has only a small impact on . Finally, CCSNe are transient injections of energy, and a numerical simulation is desirable to explore beyond our treatment based on Ref. [46]. For example, the impact of energy injection from supernova feedback is dependent on the number and size of so-called blowouts, with a single large blowout influencing the DM profile more strongly than multiple weaker blowouts [90]. While the star-forming activity of Milky Way satellites often occur in prominent bursts [150], it would still be interesting to explore the impacts of time-dependent energy injections from CCSN neutrinos.
V Summary
In this work, we find a phenomenological upper bound on the interaction cross section between neutrinos and DM using the condition that CCSN neutrinos cannot have too many interactions with DM particles inside the sub-halos of Milky Way dwarf spheroidals such that their DM cores become too large when compared to observed estimations. Using stellar kinematic data, we estimate the sub-halo properties for different dSphs. We then estimate the amount of energy that needs to be injected in order to transform an initial NFW cusped DM profile into the cored profile that we observe today. Under the assumptions that CDM is correct, the DM interactions are the only source of energy injection and feedback, and that the energy transfer between the neutrinos and the DM particle is maximal, we find an upper bound of . This upper limit we find is 5 orders of magnitude stronger than previous limits using supernova neutrino data [9] for MeV neutrinos.
There are several sources of uncertainty in our derivation, e.g., constant energy transfer, stellar kinematics, and assumptions of core formation. Wherever possible we adopt assumptions within the calculation that make the upper limit more conservative. Therefore, our limit is conservative, and inclusion of additional effects will likely result in stronger constraints.
Additional uncertainties that can affect our result are model dependent. While we remain model agnostic throughout the derivation, we briefly discuss a simple model of particle DM that can interact with neutrinos that is flavor independent (Sec. IV.2). We then use the derivation of our cross section upper limit to place constraints on parameters of the model itself, specifically the product of the neutrino and DM couplings to the mediator. For other models the same can be done, however one needs to remain careful about the flavor dependence of the interaction(s) as well as the kinematics.
Many different astrophysical neutrino sources have been used to constrain the cross section of neutrinos and DM. At MeV energies, our limits remain competitive compared to those from SN1987A neutrinos [9]. Looking to the future, the detection prospects of the diffuse supernova neutrino background is very promising [151, 152], which can help in constraining further.
Acknowledgements.
We thank Kohei Hayashi for providing us the stellar kinematics data used in the analysis. We thank Gonzalo Herrera and R. Andrew Gustafson for useful discussions. S. Heston is supported by U.S. Department of Energy Office of Science under award number DE-SC0020262 and NSF Grant No. PHY-2209420. The work of S. Horiuchi is supported by the U.S. Department of Energy Office of Science under award number DE-SC0020262, NSF Grant No. AST1908960 and No. PHY-2209420, JSPS KAKENHI Grant Number JP22K03630 and JP23H04899, and the Julian Schwinger Foundation. The work of S. Shirai is supported by Grant-in-Aid for Scientific Research from the Ministry of Education, Culture, Sports, Science, and Technology (MEXT), Japan, 20H01895, 20H05860 and 21H00067. This work was supported by World Premier International Research Center Initiative (WPI Initiative), MEXT, Japan.References
- Asaka et al. [2005] T. Asaka, S. Blanchet, and M. Shaposhnikov, The MSM,dark matter and neutrino masses, Physics Letters B 631, 151 (2005).
- Ma [2006] E. Ma, Verifiable radiative seesaw mechanism of neutrino mass and dark matter, Phys. Rev. D 73, 077301 (2006), arXiv:hep-ph/0601225 .
- Farzan and Ma [2012] Y. Farzan and E. Ma, Dirac neutrino mass generation from dark matter, Phys. Rev. D 86, 033007 (2012).
- de Gouvêa [2016] A. de Gouvêa, Neutrino mass models, Annual Review of Nuclear and Particle Science 66, 197 (2016), https://doi.org/10.1146/annurev-nucl-102115-044600 .
- Escudero et al. [2017a] M. Escudero, N. Rius, and V. Sanz, Sterile neutrino portal to dark matter I: the case, Journal of High Energy Physics 2017, 45 (2017a).
- Escudero et al. [2017b] M. Escudero, N. Rius, and V. Sanz, Sterile neutrino portal to dark matter II: exact dark symmetry, The European Physical Journal C 77, 397 (2017b).
- Aguilar et al. [2001] A. Aguilar et al. (LSND Collaboration), Evidence for neutrino oscillations from the observation of appearance in a beam, Phys. Rev. D 64, 112007 (2001).
- Aguilar-Arevalo et al. [2021] A. A. Aguilar-Arevalo et al. (MiniBooNE Collaboration), Updated MiniBooNE neutrino oscillation results with increased data and new background studies, Phys. Rev. D 103, 052002 (2021).
- Mangano et al. [2006] G. Mangano, A. Melchiorri, P. Serra, A. Cooray, and M. Kamionkowski, Cosmological bounds on dark-matter-neutrino interactions, Phys. Rev. D 74, 10.1103/physrevd.74.043517 (2006).
- Choi et al. [2019] K.-Y. Choi, J. Kim, and C. Rott, Constraining dark matter-neutrino interactions with IceCube-170922a, Phys. Rev. D 99, 10.1103/physrevd.99.083018 (2019).
- Cline et al. [2023] J. M. Cline, S. Gao, F. Guo, Z. Lin, S. Liu, M. Puel, P. Todd, and T. Xiao, Blazar constraints on neutrino-dark matter scattering, Phys. Rev. Lett. 130, 091402 (2023).
- Ferrer et al. [2023] F. Ferrer, G. Herrera, and A. Ibarra, New constraints on the dark matter-neutrino and dark matter-photon scattering cross sections from TXS 0506+056, J. Cosmol. Astropart. Phys. 2023 (05), 057.
- Fujiwara and Herrera [2023] M. Fujiwara and G. Herrera, Tidal disruption events and dark matter scatterings with neutrinos and photons (2023), arXiv:2312.11670 [hep-ph] .
- Wilkinson et al. [2014] R. J. Wilkinson, C. Bœhm, and J. Lesgourgues, Constraining dark matter-neutrino interactions using the CMB and large-scale structure, J. Cosmol. Astropart. Phys. 2014 (05), 011.
- Akita and Ando [2023] K. Akita and S. Ando, Constraints on dark matter-neutrino scattering from the milky-way satellites and subhalo modeling for dark acoustic oscillations (2023), arXiv:2305.01913 [astro-ph.CO] .
- Bœhm et al. [2013] C. Bœhm, M. J. Dolan, and C. McCabe, A lower bound on the mass of cold thermal dark matter from planck, J. Cosmol. Astropart. Phys. 2013 (08), 041.
- Mosbech et al. [2021] M. R. Mosbech, C. Boehm, S. Hannestad, O. Mena, J. Stadler, and Y. Y. Wong, The full Boltzmann hierarchy for dark matter-massive neutrino interactions, J. Cosmol. Astropart. Phys. 2021 (03), 066.
- Hooper and Lucca [2022] D. C. Hooper and M. Lucca, Hints of dark matter-neutrino interactions in Lyman- data, Phys. Rev. D 105, 10.1103/physrevd.105.103504 (2022).
- Mosbech et al. [2023] M. R. Mosbech, C. Boehm, and Y. Y. Wong, Probing dark matter interactions with 21cm observations, J. Cosmol. Astropart. Phys. 2023 (03), 047.
- Fayet et al. [2006] P. Fayet, D. Hooper, and G. Sigl, Constraints on light dark matter from core-collapse supernovae, Phys. Rev. Lett. 96, 211302 (2006).
- Koren [2019] S. Koren, Neutrino-dark matter scattering and coincident detections of UHE neutrinos with EM sources, J. Cosmol. Astropart. Phys. 2019 (09), 013.
- Murase and Shoemaker [2019] K. Murase and I. M. Shoemaker, Neutrino echoes from multimessenger transient sources, Phys. Rev. Lett. 123, 10.1103/physrevlett.123.241102 (2019).
- McMullen et al. [2021] A. McMullen, A. Vincent, C. Arguëlles, and A. Schneider (IceCube Collaboration), Dark matter neutrino scattering in the galactic centre with IceCube, Journal of Instrumentation 16 (08), C08001.
- Carpio et al. [2023] J. A. Carpio, A. Kheirandish, and K. Murase, Time-delayed neutrino emission from supernovae as a probe of dark matter-neutrino interactions, J. Cosmol. Astropart. Phys. 2023 (04), 019.
- Farzan and Palomares-Ruiz [2014] Y. Farzan and S. Palomares-Ruiz, Dips in the diffuse supernova neutrino background, J. Cosmol. Astropart. Phys. 2014 (06), 014.
- Das and Sen [2021] A. Das and M. Sen, Boosted dark matter from diffuse supernova neutrinos, Phys. Rev. D 104, 075029 (2021).
- Chao et al. [2021] W. Chao, T. Li, and J. Liao, Connecting primordial black hole to boosted sub-gev dark matter through neutrino (2021), arXiv:2108.05608 [hep-ph] .
- Jho et al. [2021] Y. Jho, J.-C. Park, S. C. Park, and P.-Y. Tseng, Cosmic-neutrino-boosted dark matter (bdm) (2021), arXiv:2101.11262 [hep-ph] .
- Zhang [2021] Y. Zhang, Speeding up dark matter with solar neutrinos, Progress of Theoretical and Experimental Physics 2022, 10.1093/ptep/ptab156 (2021).
- Ghosh et al. [2022] D. Ghosh, A. Guha, and D. Sachdeva, Exclusion limits on dark matter-neutrino scattering cross section, Phys. Rev. D 105, 10.1103/physrevd.105.103029 (2022).
- Bardhan et al. [2023] D. Bardhan, S. Bhowmick, D. Ghosh, A. Guha, and D. Sachdeva, Bounds on boosted dark matter from direct detection: The role of energy-dependent cross sections, Phys. Rev. D 107, 10.1103/physrevd.107.015010 (2023).
- Romeri et al. [2023] V. D. Romeri, A. Majumdar, D. K. Papoulias, and R. Srivastava, XENONnT and LUX-ZEPLIN constraints on DSNB-boosted dark matter (2023), arXiv:2309.04117 [hep-ph] .
- Lin et al. [2023] Y.-H. Lin, W.-H. Wu, M.-R. Wu, and H. T.-K. Wong, Searching for afterglow: Light dark matter boosted by supernova neutrinos, Phys. Rev. Lett. 130, 10.1103/physrevlett.130.111002 (2023).
- Bullock and Boylan-Kolchin [2017] J. S. Bullock and M. Boylan-Kolchin, Small-scale challenges to the CDM paradigm, Annual Review of Astronomy and Astrophysics 55, 343 (2017), https://doi.org/10.1146/annurev-astro-091916-055313 .
- Navarro et al. [1996] J. F. Navarro, C. S. Frenk, and S. D. M. White, The Structure of Cold Dark Matter Halos, Astrophys. J. 462, 563 (1996), arXiv:astro-ph/9508025 [astro-ph] .
- Wang et al. [2020] J. Wang, S. Bose, C. S. Frenk, L. Gao, A. Jenkins, V. Springel, and S. D. M. White, Universal structure of dark matter haloes over a mass range of 20 orders of magnitude, Nature 585, 39 (2020).
- Flores and Primack [1994] R. A. Flores and J. R. Primack, Observational and Theoretical Constraints on Singular Dark Matter Halos, Astrophys. J. Letters 427, L1 (1994), arXiv:astro-ph/9402004 [astro-ph] .
- Moore [1994] B. Moore, Evidence against dissipation-less dark matter from observations of galaxy haloes, Nature 370, 629 (1994).
- Spergel and Steinhardt [2000] D. N. Spergel and P. J. Steinhardt, Observational evidence for self-interacting cold dark matter, Phys. Rev. Lett. 84, 3760 (2000).
- Oh et al. [2008] S.-H. Oh, W. J. G. de Blok, F. Walter, E. Brinks, and R. C. Kennicutt, High-resolution dark matter density profiles of THINGS dwarf galaxies: Correcting for noncircular motions, Astron. J. 136, 2761 (2008).
- Donato et al. [2009] F. Donato, G. Gentile, P. Salucci, C. Frigerio Martins, M. I. Wilkinson, G. Gilmore, E. K. Grebel, A. Koch, and R. Wyse, A constant dark matter halo surface density in galaxies, Mon. Not. R. Astron. Soc. 397, 1169 (2009).
- Walker and Peñarrubia [2011] M. G. Walker and J. Peñarrubia, A method for measuring (slopes of) the mass profiles of dwarf spheroidal galaxies, Astrophys. J. 742, 20 (2011).
- Salucci et al. [2012] P. Salucci, M. I. Wilkinson, M. G. Walker, G. F. Gilmore, E. K. Grebel, A. Koch, C. F. Martins, and R. F. G. Wyse, Dwarf spheroidal galaxy kinematics and spiral galaxy scaling laws, Mon. Not. R. Astron. Soc. 420, 2034 (2012).
- Oh et al. [2015] S.-H. Oh et al., High-resolution mass models of dwarf galaxies from LITTLE THINGS, Astron. J. 149, 180 (2015).
- Navarro et al. [1996] J. F. Navarro, V. R. Eke, and C. S. Frenk, The cores of dwarf galaxy haloes, Mon. Not. Roy. Astron. Soc. 283, L72 (1996), https://academic.oup.com/mnras/article-pdf/283/3/L72/3305901/283-3-L72.pdf .
- Peñarrubia et al. [2012] J. Peñarrubia, A. Pontzen, M. G. Walker, and S. E. Koposov, The coupling between the core/cusp and missing satellite problems, Astrophys. J. Letters 759, L42 (2012).
- Pontzen and Governato [2012] A. Pontzen and F. Governato, How supernova feedback turns dark matter cusps into cores, Mon. Not. Roy. Astron. Soc. 421, 3464 (2012), https://academic.oup.com/mnras/article-pdf/421/4/3464/3832707/mnras0421-3464.pdf .
- Arnett [1966] W. D. Arnett, Gravitational collapse and weak interactions, Can. J. Phys. 44, 2553 (1966).
- Colgate and White [1966] S. A. Colgate and R. H. White, The hydrodynamic behavior of supernovae explosions, Astrophys. J. 143, 626 (1966).
- Wilson [1985] J. R. Wilson, Supernovae and Post-Collapse Behavior, in Numerical Astrophysics, edited by J. M. Centrella, J. M. Leblanc, and R. L. Bowers (Jones & Bartlett, Boston, 1985) p. 422.
- Bethe and Wilson [1985] H. A. Bethe and J. R. Wilson, Revival of a stalled supernova shock by neutrino heating, Astrophys. J. 295, 14 (1985).
- Bethe [1990] H. A. Bethe, Supernova mechanisms, Rev. Mod. Phys. 62, 801 (1990).
- Burrows and Goshy [1993] A. Burrows and J. Goshy, A theory of supernova explosions, Astrophys. J. 416, L75 (1993).
- Kotake et al. [2006] K. Kotake, K. Sato, and K. Takahashi, Explosion mechanism, neutrino burst and gravitational wave in core-collapse supernovae, Rep. Prog. Phys. 69, 971 (2006).
- Janka [2012] H.-T. Janka, Explosion mechanisms of core-collapse supernovae, Annu. Rev. Nucl. Part. Sci. 62, 407 (2012).
- Mirizzi et al. [2016] A. Mirizzi, I. Tamborra, H.-T. Janka, N. Saviano, K. Scholberg, R. Bollig, L. Hudepohl, and S. Chakraborty, Supernova neutrinos: Production, oscillations and detection, Riv. Nuovo Cimento 39, 10.1393/ncr/i2016-10120-8 (2016).
- Hayashi et al. [2021] K. Hayashi, M. Ibe, S. Kobayashi, Y. Nakayama, and S. Shirai, Probing dark matter self-interaction with ultrafaint dwarf galaxies, Phys. Rev. D 103, 023017 (2021), arXiv:2008.02529 [astro-ph.CO] .
- Muñoz et al. [2018] R. R. Muñoz, P. Côté, F. A. Santana, M. Geha, J. D. Simon, G. A. Oyarzún, P. B. Stetson, and S. G. Djorgovski, A MegaCam Survey of Outer Halo Satellites. III. Photometric and Structural Parameters, Astrophys J. 860, 66 (2018), arXiv:1806.06891 [astro-ph.GA] .
- Simon et al. [2011a] J. D. Simon et al., A Complete Spectroscopic Survey of the Milky Way Satellite Segue 1: The Darkest Galaxy, Astrophys. J. 733, 46 (2011a), arXiv:1007.4198 [astro-ph.GA] .
- Kirby et al. [2013] E. N. Kirby, M. Boylan-Kolchin, J. G. Cohen, M. Geha, J. S. Bullock, and M. Kaplinghat, Segue 2: The Least Massive Galaxy, Astrophys. J. 770, 16 (2013), arXiv:1304.6080 [astro-ph.CO] .
- Koposov et al. [2011a] S. E. Koposov et al., Accurate Stellar Kinematics at Faint Magnitudes: application to the Bootes~I dwarf spheroidal galaxy, Astrophys. J. 736, 146 (2011a), arXiv:1105.4102 [astro-ph.GA] .
- Simon and Geha [2007a] J. D. Simon and M. Geha, The Kinematics of the Ultra-Faint Milky Way Satellites: Solving the Missing Satellite Problem, Astrophys. J. 670, 313 (2007a), arXiv:0706.0516 [astro-ph] .
- Simon et al. [2015] J. D. Simon et al. (DES), Stellar Kinematics and Metallicities in the Ultra-Faint Dwarf Galaxy Reticulum II, Astrophys. J. 808, 95 (2015), arXiv:1504.02889 [astro-ph.GA] .
- Martin et al. [2016] N. F. Martin et al., Is Draco II one of the faintest dwarf galaxies? First study from Keck/DEIMOS spectroscopy, Mon. Not. Roy. Astron. Soc. 458, L59 (2016), arXiv:1510.01326 [astro-ph.GA] .
- Kirby et al. [2017] E. N. Kirby, J. G. Cohen, J. D. Simon, P. Guhathakurta, A. O. Thygesen, and G. E. Duggan, Triangulum II. Not Especially Dense After All, Astrophys. J. 838, 83 (2017), arXiv:1703.02978 [astro-ph.GA] .
- Kirby et al. [2015] E. N. Kirby, J. D. Simon, and J. G. Cohen, Spectroscopic Confirmation of the Dwarf Galaxies Hydra II and Pisces II and the Globular Cluster Laevens 1, Astrophys. J. 810, 56 (2015), arXiv:1506.01021 [astro-ph.GA] .
- Walker et al. [2016] M. G. Walker et al., Magellan/M2FS spectroscopy of Tucana 2 and Grus 1, Astrophys. J. 819, 53 (2016), arXiv:1511.06296 [astro-ph.GA] .
- Simon et al. [2020a] J. D. Simon et al. (DES), Birds of a Feather? Magellan/IMACS Spectroscopy of the Ultra-Faint Satellites Grus II, Tucana IV, and Tucana V, Astrophys. J. 892, 137 (2020a), arXiv:1911.08493 [astro-ph.GA] .
- Koposov et al. [2015a] S. E. Koposov et al., Kinematics and chemistry of recently discovered Reticulum 2 and Horologium 1 dwarf galaxies, Astrophys. J. 811, 62 (2015a), arXiv:1504.07916 [astro-ph.GA] .
- Simon et al. [2017] J. D. Simon et al. (DES), Nearest Neighbor: The Low-Mass Milky Way Satellite Tucana III, Astrophys. J. 838, 11 (2017), arXiv:1610.05301 [astro-ph.GA] .
- Walker et al. [2015] M. G. Walker, E. W. Olszewski, and M. Mateo, Bayesian analysis of resolved stellar spectra: application to MMT/Hectochelle observations of the Draco dwarf spheroidal, Mon. Not. Roy. Astron. Soc. 448, 2717 (2015), arXiv:1503.02589 [astro-ph.GA] .
- Walker et al. [2008a] M. G. Walker, M. Mateo, and E. W. Olszewski, Systemic Proper Motions of Milky Way Satellites from Stellar Redshifts: the Carina, Fornax, Sculptor and Sextans Dwarf Spheroidals, Astrophys. J. Lett. 688, L75 (2008a), arXiv:0810.1511 [astro-ph] .
- Walker et al. [2009a] M. G. Walker, M. Mateo, and E. Olszewski, Stellar Velocities in the Carina, Fornax, Sculptor and Sextans dSph Galaxies: Data from the Magellan/MMFS Survey, Astron. J. 137, 3100 (2009a), arXiv:0811.0118 [astro-ph] .
- Fabrizio et al. [2016] M. Fabrizio et al., The Carina Project. X. On the Kinematics of Old and Intermediate-age Stellar Populations1,2, Astrophys. J. 830, 126 (2016), arXiv:1607.03181 [astro-ph.GA] .
- Spencer et al. [2018] M. E. Spencer, M. Mateo, E. W. Olszewski, M. G. Walker, A. W. McConnachie, and E. N. Kirby, The Binary Fraction of Stars in Dwarf Galaxies: The Cases of Draco and Ursa Minor, Astron. J. 156, 257 (2018), arXiv:1811.06597 [astro-ph.GA] .
- Mateo et al. [2008a] M. Mateo, E. W. Olszewski, and M. G. Walker, The Velocity Dispersion Profile of the Remote Dwarf Spheroidal Galaxy Leo. 1. A Tidal Hit and Run?, Astrophys. J. 675, 201 (2008a), arXiv:0708.1327 [astro-ph] .
- Spencer et al. [2017] M. E. Spencer, M. Mateo, M. G. Walker, and E. W. Olszewski, A Multi-epoch Kinematic Study of the Remote Dwarf Spheroidal Galaxy Leo II, Astrophys. J. 836, 202 (2017), arXiv:1702.08836 [astro-ph.GA] .
- Moliné et al. [2017] A. Moliné, M. A. Sánchez-Conde, S. Palomares-Ruiz, and F. Prada, Characterization of subhalo structural properties and implications for dark matter annihilation signals, Mon. Not. Roy. Astron. Soc. 466, 4974 (2017), arXiv:1603.04057 [astro-ph.CO] .
- El-Zant et al. [2001] A. El-Zant, I. Shlosman, and Y. Hoffman, Dark halos: The flattening of the density cusp by dynamical friction, Astrophys. J. 560, 636 (2001).
- Mayer et al. [2001] L. Mayer, F. Governato, M. Colpi, B. Moore, T. Quinn, J. Wadsley, J. Stadel, and G. Lake, Tidal stirring and the origin of dwarf spheroidals in the local group, Astrophys. J. 547, L123 (2001).
- Read and Gilmore [2005] J. I. Read and G. Gilmore, Mass loss from dwarf spheroidal galaxies: the origins of shallow dark matter cores and exponential surface brightness profiles, Mon. Not. Roy. Astron. Soc. 356, 107 (2005).
- Mashchenko et al. [2008] S. Mashchenko, J. Wadsley, and H. M. P. Couchman, Stellar feedback in dwarf galaxy formation, Science 319, 174 (2008).
- Goerdt et al. [2010] T. Goerdt, B. Moore, J. I. Read, and J. Stadel, Core creation in galaxies and halos via sinking massive objects, Astrophys. J. 725, 1707 (2010).
- Governato et al. [2010] F. Governato et al., Bulgeless dwarf galaxies and dark matter cores from supernova-driven outflows, Nature 463, 203 (2010).
- Kazantzidis et al. [2011] S. Kazantzidis, E. L. Lokas, S. Callegari, L. Mayer, and L. A. Moustakas, On the Efficiency of the Tidal Stirring Mechanism for the Origin of Dwarf Spheroidals: Dependence on the Orbital and Structural Parameters of the Progenitor Disky Dwarfs, Astrophys. J. 726, 98 (2011), arXiv:1009.2499 [astro-ph.CO] .
- Cole et al. [2011] D. R. Cole, W. Dehnen, and M. I. Wilkinson, Weakening dark matter cusps by clumpy baryonic infall, Mon. Not. Roy. Astron. Soc. 416, 1118 (2011).
- Brooks and Zolotov [2014] A. M. Brooks and A. Zolotov, Why Baryons Matter: The Kinematics of Dwarf Spheroidal Satellites, Astrophys. J. 786, 87 (2014), arXiv:1207.2468 [astro-ph.CO] .
- Chang et al. [2013] J. Chang, A. V. Maccio’, and X. Kang, The dependence of tidal stripping efficiency on the satellite and host galaxy morphology, Mon. Not. Roy. Astron. Soc. 431, 3533 (2013), arXiv:1212.3408 [astro-ph.CO] .
- Di Cintio et al. [2013] A. Di Cintio, C. B. Brook, A. V. Macciò, G. S. Stinson, A. Knebe, A. A. Dutton, and J. Wadsley, The dependence of dark matter profiles on the stellar-to-halo mass ratio: a prediction for cusps versus cores, Mon. Not. Roy. Astron. Soc. 437, 415 (2013).
- Garrison-Kimmel et al. [2013] S. Garrison-Kimmel, M. Rocha, M. Boylan-Kolchin, J. Bullock, and J. Lally, Can Feedback Solve the Too Big to Fail Problem?, Mon. Not. Roy. Astron. Soc. 433, 3539 (2013), arXiv:1301.3137 [astro-ph.CO] .
- Kazantzidis et al. [2013] S. Kazantzidis, E. L. Lokas, and L. Mayer, Tidal Stirring of Disky Dwarfs with Shallow Dark Matter Density Profiles: Enhanced Transformation into Dwarf Spheroidals, Astrophys. J. Lett. 764, L29 (2013), arXiv:1302.0008 [astro-ph.CO] .
- Teyssier et al. [2013] R. Teyssier, A. Pontzen, Y. Dubois, and J. I. Read, Cusp-core transformations in dwarf galaxies: observational predictions, Mon. Not. Roy. Astron. Soc. 429, 3068 (2013).
- Nipoti and Binney [2015] C. Nipoti and J. Binney, Early flattening of dark matter cusps in dwarf spheroidal galaxies, Mon. Not. Roy. Astron. Soc. 446, 1820 (2015), arXiv:1410.6169 [astro-ph.GA] .
- Chan et al. [2015] T. K. Chan, D. Kereš, J. Oñorbe, P. F. Hopkins, A. L. Muratov, C.-A. Faucher-Giguère, and E. Quataert, The impact of baryonic physics on the structure of dark matter haloes: the view from the FIRE cosmological simulations, Mon. Not. Roy. Astron. Soc. 454, 2981 (2015).
- Read et al. [2016] J. I. Read, O. Agertz, and M. L. M. Collins, Dark matter cores all the way down, Mon. Not. Roy. Astron. Soc. 459, 2573 (2016), arXiv:1508.04143 [astro-ph.GA] .
- Dutton et al. [2016] A. A. Dutton, A. V. Macciò, A. Dekel, L. Wang, G. Stinson, A. Obreja, A. Di Cintio, C. Brook, T. Buck, and X. Kang, NIHAO IX: the role of gas inflows and outflows in driving the contraction and expansion of cold dark matter haloes, Mon. Not. Roy. Astron. Soc. 461, 2658 (2016).
- Tollet et al. [2016] E. Tollet et al., NIHAO – IV: core creation and destruction in dark matter density profiles across cosmic time, Mon. Not. Roy. Astron. Soc. 456, 3542 (2016).
- Wang et al. [2017] M. Y. Wang, A. Fattahi, A. P. Cooper, T. Sawala, L. E. Strigari, C. S. Frenk, J. F. Navarro, K. Oman, and M. Schaller, Tidal features of classical Milky Way satellites in a cold dark matter universe, Mon. Not. Roy. Astron. Soc. 468, 4887 (2017), arXiv:1611.00778 [astro-ph.GA] .
- Fitts et al. [2017] A. Fitts et al., fire in the field: simulating the threshold of galaxy formation, Mon. Not. Roy. Astron. Soc. 471, 3547 (2017).
- Hiroshima et al. [2018] N. Hiroshima, S. Ando, and T. Ishiyama, Modeling evolution of dark matter substructure and annihilation boost, Phys. Rev. D 97, 123002 (2018), arXiv:1803.07691 [astro-ph.CO] .
- Freundlich et al. [2019] J. Freundlich, A. Dekel, F. Jiang, G. Ishai, N. Cornuault, S. Lapiner, A. A. Dutton, and A. V. Macciò, A model for core formation in dark matter haloes and ultra-diffuse galaxies by outflow episodes, Mon. Not. Roy. Astron. Soc. 491, 4523 (2019).
- Lazar et al. [2020] A. Lazar et al., A dark matter profile to model diverse feedback-induced core sizes of CDM haloes, Mon. Not. Roy. Astron. Soc. 497, 2393 (2020).
- Burger and Zavala [2021] J. D. Burger and J. Zavala, Supernova-driven mechanism of cusp-core transformation: an appraisal, Astrophys. J. 921, 126 (2021).
- Keil et al. [2003] M. T. Keil, G. G. Raffelt, and H.-T. Janka, Monte carlo study of supernova neutrino spectra formation, Astrophys. J. 590, 971 (2003).
- Totani et al. [1998] T. Totani, K. Sato, H. E. Dalhed, and J. R. Wilson, Future detection of supernova neutrino burst and explosion mechanism, Astrophys. J. 496, 216 (1998).
- Thompson et al. [2003] T. A. Thompson, A. Burrows, and P. A. Pinto, Shock breakout in core-collapse supernovae and its neutrino signature, Astrophys. J. 592, 434 (2003).
- Sumiyoshi et al. [2005] K. Sumiyoshi, S. Yamada, H. Suzuki, H. Shen, S. Chiba, and H. Toki, Postbounce evolution of core-collapse supernovae: Long-term effects of the equation of state, Astrophys. J. 629, 922 (2005).
- Nakazato et al. [2013] K. Nakazato, K. Sumiyoshi, H. Suzuki, T. Totani, H. Umeda, and S. Yamada, Supernova neutrino light curves and spectra for various progenitor stars: from core collapse to proto-neutrino star cooling, Astrophys. J. Suppl. Ser. 205, 2 (2013).
- Suwa et al. [2019] Y. Suwa, K. Sumiyoshi, K. Nakazato, Y. Takahira, Y. Koshio, M. Mori, and R. A. Wendell, Observing supernova neutrino light curves with super-kamiokande: Expected event number over 10 s, Astrophys. J. 881, 139 (2019).
- Bollig et al. [2021] R. Bollig, N. Yadav, D. Kresse, H.-T. Janka, B. Müller, and A. Heger, Self-consistent 3d supernova models from -7 minutes to 7 s: A 1-bethe explosion of a 19 progenitor, Astrophys. J. 915, 28 (2021).
- Kroupa [2002] P. Kroupa, The initial mass function of stars: Evidence for uniformity in variable systems, Science 295, 82 (2002).
- Smartt [2009] S. J. Smartt, Progenitors of core-collapse supernovae, Annu. Rev. Astron. Astrophys. 47, 63 (2009).
- Smartt et al. [2009] S. J. Smartt, J. J. Eldridge, R. M. Crockett, and J. R. Maund, The death of massive stars – I. Observational constraints on the progenitors of Type II-P supernovae, Mon. Not. Roy. Astron. Soc. 395, 1409 (2009).
- Díaz-Rodríguez et al. [2018] M. Díaz-Rodríguez, J. W. Murphy, D. A. Rubin, A. E. Dolphin, B. F. Williams, and J. J. Dalcanton, Progenitor mass distribution for core-collapse supernova remnants in M31 and M33, Astrophys. J. 861, 92 (2018).
- Díaz-Rodríguez et al. [2021] M. Díaz-Rodríguez, J. W. Murphy, B. F. Williams, J. J. Dalcanton, and A. E. Dolphin, Progenitor mass distribution for 22 historic core-collapse supernovae, Mon. Not. Roy. Astron. Soc. 506, 781 (2021).
- Grcevich and Putman [2009] J. Grcevich and M. E. Putman, H I in the local group dwarf galaxies and stripping by the galactic halo, Astrophys. J. 696, 385 (2009).
- Simon et al. [2011b] J. D. Simon et al., A complete spectroscopic survey of the Milky Way satellite Segue 1: the darkest , Astrophys. J. 733, 46 (2011b).
- Belokurov et al. [2009] V. Belokurov, M. G. Walker, N. W. Evans, G. Gilmore, M. J. Irwin, M. Mateo, L. Mayer, E. Olszewski, J. Bechtold, and T. Pickering, The discovery of Segue 2: a prototype of the population of satellites of satellites, Mon. Not. Roy. Astron. Soc. 397, 1748 (2009), https://academic.oup.com/mnras/article-pdf/397/4/1748/17322184/mnras0397-1748.pdf .
- Koposov et al. [2011b] S. E. Koposov et al., Accurate stellar kinematics at faint magnitudes: Application to the Boötes I dwarf spheroidal galaxy, Astrophys. J. 736, 146 (2011b).
- Adén, D. et al. [2009] Adén, D., Feltzing, S., Koch, A., Wilkinson, M. I., Grebel, E. K., Lundström, I., Gilmore, G. F., Zucker, D. B., Belokurov, V., Evans, N. W., and Faria, D., A photometric and spectroscopic study of the new dwarf spheroidal galaxy in - metallicity, velocities, and a clean list of RGB members, Astron. Astrophys. 506, 1147 (2009).
- Simon and Geha [2007b] J. D. Simon and M. Geha, The kinematics of the ultra-faint Milky Way satellites: Solving the missing satellite problem, Astrophys. J. 670, 313 (2007b).
- Walker et al. [2009b] M. G. Walker, V. Belokurov, N. W. Evans, M. J. Irwin, M. Mateo, E. W. Olszewski, and G. Gilmore, Leo v: Spectroscopy of a distant and disturbed satellite*, Astrophys. J. 694, L144 (2009b).
- Belokurov et al. [2008] V. Belokurov, M. G. Walker, N. W. Evans, D. C. Faria, G. Gilmore, M. J. Irwin, S. Koposov, M. Mateo, E. Olszewski, and D. B. Zucker, Leo v: A companion of a companion of the milky way galaxy?, Astrophys. J. 686, L83 (2008).
- Koposov et al. [2015b] S. E. Koposov, V. Belokurov, G. Torrealba, and N. W. Evans, Beasts of the southern wild: Discovery of nine ultra faint satellites in the vicinity of the Magellanic clouds, Astrophys. J. 805, 130 (2015b).
- Koposov et al. [2015c] S. E. Koposov et al., Kinematics and chemistry of recently discovered Reticulum 2 and Horologium 1 dwarf galaxies, Astrophys. J. 811, 62 (2015c).
- Muñoz et al. [2018] R. R. Muñoz, P. Côté, F. A. Santana, M. Geha, J. D. Simon, G. A. Oyarzún, P. B. Stetson, and S. G. Djorgovski, A MegaCam survey of outer halo satellites. III. photometric and structural †, Astrophys. J. 860, 66 (2018).
- McConnachie [2012] A. W. McConnachie, The observed properties of dwarf galaxies in and around the local group, Astron. J. 144, 4 (2012).
- Chiti et al. [2022] A. Chiti, J. D. Simon, A. Frebel, A. B. Pace, A. P. Ji, and T. S. Li, Magellan/IMACS spectroscopy of Grus i: A low metallicity ultra-faint dwarf galaxy∗, Astrophys. J. 939, 41 (2022).
- Chiti et al. [2023] A. Chiti, A. Frebel, A. P. Ji, M. K. Mardini, X. Ou, J. D. Simon, H. Jerjen, D. Kim, and J. E. Norris, Detailed chemical abundances of stars in the outskirts of the Tucana II ultrafaint dwarf galaxy*, Astron. J. 165, 55 (2023).
- Drlica-Wagner et al. [2015] A. Drlica-Wagner et al. (The DES Collaboration), Eight ultra-faint galaxy candidates discovered in year two of the dark energy survey, Astrophys. J. 813, 109 (2015).
- Simon et al. [2020b] J. D. Simon et al. (The DES Collaboration), Birds of a feather? Magellan/IMACS spectroscopy of the ultra-faint satellites Grus II, Tucana IV, and Tucana V∗, Astrophys. J. 892, 137 (2020b).
- Martin et al. [2007] N. F. Martin, R. A. Ibata, S. C. Chapman, M. Irwin, and G. F. Lewis, A Keck/DEIMOS spectroscopic survey of faint Galactic satellites: searching for the least massive dwarf galaxies∗, Mon. Not. Roy. Astron. Soc. 380, 281 (2007), https://academic.oup.com/mnras/article-pdf/380/1/281/4150506/mnras0380-0281.pdf .
- Walker et al. [2008b] M. G. Walker, M. Mateo, and E. W. Olszewski, Systemic proper motions of Milky Way satellites from stellar redshifts: The Carina, Fornax, Sculptor, and Sextans dwarf spheroidals∗, Astrophys. J. 688, L75 (2008b).
- Walker et al. [2009c] M. G. Walker, M. Mateo, and E. W. Olszewski, Stellar velocities in the Carina, Fornax, Sculptor, and Sextans dSph galaxies: Data from the Magellan/MMFS survey∗, Astron. J. 137, 3100 (2009c).
- Wilkinson et al. [2004] M. I. Wilkinson, J. T. Kleyna, N. W. Evans, G. F. Gilmore, M. J. Irwin, and E. K. Grebel, Kinematically cold populations at large radii in the Draco and Ursa Minor dwarf spheroidal galaxies, Astrophys. J. 611, L21 (2004).
- Walker et al. [2007] M. G. Walker, M. Mateo, E. W. Olszewski, O. Y. Gnedin, X. Wang, B. Sen, and M. Woodroofe, Velocity dispersion profiles of seven dwarf spheroidal galaxies∗, Astrophys. J. 667, L53 (2007).
- Bouchard et al. [2006] A. Bouchard, C. Carignan, and L. Staveley-Smith, Neutral hydrogen clouds near early-type dwarf galaxies of the local group, Astron. J. 131, 2913 (2006).
- Mateo et al. [2008b] M. Mateo, E. W. Olszewski, and M. G. Walker, The velocity dispersion profile of the remote dwarf spheroidal galaxy Leo i: A tidal hit and run?, Astrophys. J. 675, 201 (2008b).
- Carignan et al. [1998] C. Carignan, S. Beaulieu, S. Côté, S. Demers, and M. Mateo, Detection of h i associated with the Sculptor dwarf spheroidal galaxy, Astron. J. 116, 1690 (1998).
- Walker et al. [2009d] M. G. Walker, M. Mateo, E. W. Olszewski, J. Peñarrubia, N. W. Evans, and G. Gilmore, A universal mass profile for dwarf spheroidal galaxies?∗, Astrophys. J. 704, 1274 (2009d).
- Hayashi et al. [2023] K. Hayashi, Y. Hirai, M. Chiba, and T. Ishiyama, Dark matter halo properties of the galactic dwarf satellites: Implication for chemo-dynamical evolution of the satellites and a challenge to lambda cold dark matter, Astrophys. J. 953, 185 (2023).
- Hirata et al. [1987] K. Hirata, T. Kajita, M. Koshiba, M. Nakahata, Y. Oyama, N. Sato, et al., Observation of a neutrino burst from the supernova SN1987A, Phys. Rev. Lett. 58, 1490 (1987).
- Bionta et al. [1987] R. M. Bionta, G. Blewitt, C. B. Bratton, D. Casper, A. Ciocio, R. Claus, et al., Observation of a neutrino burst in coincidence with supernova 1987a in the large magellanic cloud, Phys. Rev. Lett. 58, 1494 (1987).
- Alexeyev et al. [1988] E. Alexeyev, L. Alexeyeva, I. Krivosheina, and V. Volchenko, Detection of the neutrino signal from SN 1987a in the lmc using the inr baksan underground scintillation telescope, Phys. Lett. B 205, https://doi.org/10.1016/0370-2693(88)91651-6 (1988).
- Aartsen et al. [2018] M. Aartsen et al. (The IceCube Collaboration and Fermi-LAT and MAGIC and AGILE and ASAS-SN and HAWC and H.E.S.S. and INTEGRAL and Kanata and Kiso and Kapteyn and Liverpool Telescope and Subaru and Swift/NuSTAR and VERITAS and VLA/17B-403 teams), Multimessenger observations of a flaring blazar coincident with high-energy neutrino IceCube-170922A, Science 361, eaat1378 (2018).
- Stein et al. [2021] R. Stein et al., A tidal disruption event coincident with a high-energy neutrino, Nature Astron. 5, 510 (2021), arXiv:2005.05340 [astro-ph.HE] .
- Olivares-Del Campo et al. [2018] A. Olivares-Del Campo, C. Bœhm, S. Palomares-Ruiz, and S. Pascoli, Dark matter-neutrino interactions through the lens of their cosmological implications, Phys. Rev. D 97, 075039 (2018).
- Palanque-Delabrouille et al. [2020] N. Palanque-Delabrouille, C. Yèche, N. Schöneberg, J. Lesgourgues, M. Walther, S. Chabanier, and E. Armengaud, Hints, neutrino bounds, and wdm constraints from SDSS DR14 Lyman- and Planck full-survey data, J. Cosmol. Astropart. Phys. 2020 (04), 038.
- Argüelles et al. [2017] C. A. Argüelles, A. Kheirandish, and A. C. Vincent, Imaging galactic dark matter with high-energy cosmic neutrinos, Phys. Rev. Lett. 119, 201801 (2017).
- Weisz et al. [2014] D. R. Weisz, A. E. Dolphin, E. D. Skillman, J. Holtzman, K. M. Gilbert, J. J. Dalcanton, and B. F. Williams, The Star Formation Histories of Local Group Dwarf Galaxies I. Hubble Space Telescope / Wide Field Planetary Camera 2 Observations, Astrophys. J. 789, 147 (2014), arXiv:1404.7144 [astro-ph.GA] .
- Li et al. [2022] Y.-F. Li, M. Vagins, and M. Wurm, Prospects for the detection of the diffuse supernova neutrino background with the experiments SK-Gd and JUNO, Universe 8, 181 (2022).
- Ekanger et al. [2023] N. Ekanger, S. Horiuchi, H. Nagakura, and S. Reitz, Diffuse supernova neutrino background with up-to-date star formation rate measurements and long-term multi-dimensional supernova simulations (2023), arXiv:2310.15254 [astro-ph.HE] .