The thesan project: galaxy sizes during the epoch of reionization
Abstract
We investigate galaxy sizes at redshift with the cosmological radiation-magneto-hydrodynamic simulation suite thesan(-hr). These simulations simultaneously capture reionization of the large-scale intergalactic medium and resolved galaxy properties. The intrinsic sizes () of simulated galaxies increase moderately with stellar mass at and decrease fast at larger masses, resulting in a hump feature at that is insensitive to redshift. Low-mass galaxies are in the initial phase of size growth and are better described by a spherical shell model with feedback-driven outflows competing with the cold inflowing gas streams. In contrast, massive galaxies fit better with the disk formation model. They generally experience a phase of rapid compaction and gas depletion, likely driven by internal disk instability rather than external processes. We identify four compact quenched galaxies in the volume of thesan-1 at and their quenching follows reaching a characteristic stellar surface density akin to the massive compact galaxies at cosmic noon. Compared to observations, we find that the median UV effective radius () of simulated galaxies is at least three times larger than the observed ones at or at . The population of compact galaxies () galaxies at is missing in our simulations. This inconsistency persists across many other cosmological simulations with different galaxy formation models and demonstrates the potential of using galaxy morphology to constrain physics of galaxy formation at high redshifts.
keywords:
methods: numerical — galaxies: evolution — galaxies: formation — galaxies: high-redshift — galaxies: structure1 Introduction
The size of the stellar distribution of galaxies and its evolution with cosmic time provide valuable insights about the formation history of galaxies and the relationship with their dark matter (DM) haloes (e.g. Mo et al., 1998; Kravtsov, 2013; Somerville et al., 2018). At low redshifts, the two main categories of galaxies (star-forming and quenched) show rather different dependencies between galaxy size and stellar mass/luminosity (e.g. Shen et al., 2003; Kauffmann et al., 2003; Franx et al., 2008; van der Wel et al., 2014), which encode their different evolutionary and assembly histories. Galaxy sizes at lower redshifts and their complicated dependencies on various galaxy properties are well reproduced in cosmological hydrodynamic simulations (e.g. Genel et al., 2018; Pillepich et al., 2019; Popping et al., 2022).
However, at high redshifts, the classification of galaxy morphology and the measurement of galaxy sizes are challenging due to the limited angular resolution of instruments. Prior to the James Webb Space Telescope (JWST), galaxy size measurements have been mainly driven by the Hubble Space Telescope (HST) with the Advanced Camera for Surveys and the Wide Field Camera 3/IR channel on board (e.g. Bruce et al., 2012; Mosleh et al., 2012; van der Wel et al., 2014; Morishita et al., 2014; Allen et al., 2017; Mosleh et al., 2020). This has been pushed for Lyman Break galaxies (LBGs) out to with HST legacy data (e.g. Oesch et al., 2010; Ono et al., 2013; Shibuya et al., 2015; Bouwens et al., 2022). These studies have found stable slopes and scatters of size–mass/luminosity relation at but significantly decreasing average sizes and increased star-formation rate surface density towards high redshifts. These are in good agreement with disk formation theories of star-forming/late-type galaxies (e.g. Mo et al., 1998; Dutton et al., 2007; Kravtsov, 2013). At , there are no significant differences between the size of star-forming versus quiescent galaxies at the massive end (e.g. Faisst et al., 2017; Hill et al., 2017; Mowla et al., 2019) when the morphological transitions are thought to present.
The early results from the Early Science Release and Cycle-1 observations have already demonstrated the remarkable capabilities of JWST. With its infrared sensitivity and angular resolution, JWST revealed morphologies of early galaxies at down to scales of throughout rest-frame ultraviolet (UV) to optical wavelengths (e.g. Yang et al., 2022; Naidu et al., 2022; Finkelstein et al., 2022; Baggen et al., 2023; Robertson et al., 2023b; Tacchella et al., 2023a; Treu et al., 2023; Morishita et al., 2023; Huertas-Company et al., 2023; Ormerod et al., 2023). Notably, JWST has revealed a population of extremely compact galaxies at (e.g. Baker et al., 2023; Baggen et al., 2023; Morishita et al., 2023). These galaxies are more compact than the extrapolations of low-redshift measurements or theoretical model predictions. The formation channel of compact galaxies at very early stages remains unexplored. Many of the compact galaxies show signatures of heavily obscured active galatic nuclei (AGN; e.g. Greene et al., 2023; Harikane et al., 2023; Labbe et al., 2023; Kocevski et al., 2023; Matthee et al., 2023; Maiolino et al., 2023; Kokorev et al., 2024) with abundance significantly exceeding the extrapolation of UV-selected AGN in the Hubble era (e.g. Kulkarni et al., 2019; Niida et al., 2020; Shen et al., 2020b). They could bias the constraints on galaxy morphology (e.g. Harikane et al., 2023; Tacchella et al., 2023b) but also pose interesting questions regarding the co-evolution of supermassive black holes (SMBHs) with their host galaxies.
On the other hand, theoretical predictions on galaxy sizes have been made by several numerical simulations, which have the unique power to predict spatially resolved galaxy properties. For example, Ma et al. (2018a) studied galaxy morphology and sizes at using the FIRE-2 simulations (Ma et al., 2018b) and focused on the low-mass end. Marshall et al. (2022) studied galaxy sizes at using mock images generated from the Bluetides simulations and highlighted the impact of dust. Roper et al. (2022) studied galaxy sizes at using the FLARES simulations (Lovell et al., 2021) and explored physical mechanisms of compact galaxy formation (Roper et al., 2023). In general, these studies found a negative correlation between intrinsic sizes of galaxies with stellar mass that is contradictory to the observed size–mass/luminosity relation (e.g. Shibuya et al., 2015; Kawamata et al., 2018). Concentrated dust attenuation could play a key role in reversing the trend in massive luminous galaxies and reconciling theoretical predictions with observations (e.g. Marshall et al., 2022; Roper et al., 2022; Popping et al., 2022). However, it is worth noting that most of these simulations are calibrated based on low-redshift observables and are subject to great uncertainties when extrapolating to high redshifts. For instance, the inhomogeneity of the UV radiation background during the epoch of reionization can affect galaxy properties in non-trivial ways (Rosdahl et al., 2018; Katz et al., 2020; Borrow et al., 2022) compared to models assuming spatially uniform radiation background (e.g. Vogelsberger et al., 2013; Schaye et al., 2015; Pillepich et al., 2018a). The implementation and calibration of different stellar feedback mechanisms are far from converging between theoretical frameworks and become more uncertain at high redshifts (e.g. Gnedin, 2014; Pawlik et al., 2017; Pallottini et al., 2022; Dekel et al., 2023; Ferrara, 2023).
In this study, we aim to provide a thorough analysis of galaxy sizes at over a large range of galaxy stellar mass from to using both the flagship thesan simulations and its high-resolution variants. As a suite of radiation-hydrodynamic simulations, thesan is able to self-consistently model the reionization process and the galaxies responsible for it with unprecedented physical fidelity. We will first focus on the physical mechanisms driving galaxy size evolution and understanding the causal connection between size and other galaxy properties. We will then compare results with the most recent JWST constraints and explore implications for physics models for galaxy formation at high redshifts. The paper is organized as follows. In Section 2, we introduce the simulation suite. In Section 3, we introduce the analysis methods, including galaxy identification, classification, post-processing, and definitions of various galaxy properties. In Section 4, we study the galaxy intrinsic size–mass relation and the correlation of size with other galaxy or environmental properties. In Section 5, we explore the physical mechanisms that drive galaxy size evolution, especially the compaction of massive galaxies. In Section 6, we compare the simulation results with observations and discuss various theoretical and observational uncertainties. In Section 7, we present the conclusions of the paper.
(1) Name of the simulation. Simulations labeled with are used only for the numerical convergence study in Appendix A. (2) : Side-length of the periodic simulation box. The unit is comoving Mpc (cMpc). (3) : Number of particles (cells) in the simulation. In the initial conditions, there are an equal number of DM particles and gas cells. (4) : Mass of DM particles, which is conserved over time. (5) : Mass of gas cells in the initial conditions as a reference for the baryonic mass resolution. The gas cells are (de-)refined so that the gas mass in each cell is within a factor of two of this target gas mass. Stellar particles stochastically generated out of gas cells have initial masses typically comparable to and are subject to mass loss via stellar evolution (Vogelsberger et al., 2013). (6) : The comoving gravitational softening length for the DM and stellar particles. This is also the minimum gravitational softening length of gas cells, which are adaptively softened. (7) : The physical gravitational softening length at for reference. (8) : The minimum physical size of gas cells at the end of the simulations ().
| Simulation Name | |||||||
|---|---|---|---|---|---|---|---|
| thesan-1 | 95.5 | ||||||
| thesan-hr (L8-N512) | 11.8 | ||||||
| thesan-hr (L4-N512∗) | 5.9 |
2 Simulations
The thesan project (Kannan et al., 2022a; Garaldi et al., 2022; Smith et al., 2022) is a suite of radiation-magneto-hydrodynamic simulations utilizing the moving-mesh hydrodynamics code AREPO (Springel, 2010; Weinberger et al., 2020). Gravity is solved using the hybrid Tree–PM method (Barnes & Hut, 1986). The hydrodynamics is solved using the quasi-Lagrangian Godunov method (Godunov & Bohachevsky, 1959) on an unstructured Voronoi mesh grid (see Vogelsberger et al., 2020a, for a review). For self-consistent treatment of ionizing radiation, the thesan project employs the radiative transfer (RT) extension Arepo-rt (Kannan et al., 2019), which solves the first two moments of the RT equation assuming the M1 closure relation (Levermore, 1984). The simulation includes the sourcing (from stars and AGNs) and propagation of ionizing photons (in three energy bins relevant for hydrogen and helium photoionization between energy intervals of ) as well as a non-equilibrium thermochemistry solver to model the coupling of radiation fields to gas. The luminosity and spectral energy density of stars in thesan as a complex function of age and metallicity are calculated using the Binary Population and Spectral Synthesis models (BPASS v2.2.1; Eldridge et al. 2017). The sub-grid escape fraction of stars was set to be in the simulations to match the global reionization history of the Universe. For details of the simulation methods, we refer to Kannan et al. (2019); Kannan et al. (2022a).
In terms of the galaxy formation model, the simulations employ the IllustrisTNG model (Pillepich et al., 2018a; Nelson et al., 2019), which is an update of the Illustris model (Vogelsberger et al., 2014a, b). The simulations include (1) density-, temperature-, metallicity- and redshift-dependent cooling of metal-enriched gas (Smith et al., 2008; Wiersma et al., 2009), (2) a two-phase, effective equation of state model for the interstellar medium (ISM) at the sub-resolution level (Springel & Hernquist, 2003), (3) star-formation in dense gas following the empirically defined Kennicutt–Schmidt relation, (4) thermal and mechanical feedback from supernovae and stellar winds, (5) metal enrichment from stellar evolution and supernovae, and (6) SMBH formation, growth, and feedback in the quasar and radio modes as described in Weinberger et al. (2017). The model has been extensively tested in large-scale simulations and can produce realistic galaxies that match a wide range of observations (e.g. Nelson et al., 2018; Springel et al., 2018; Genel et al., 2018; Pillepich et al., 2018b; Naiman et al., 2018; Vogelsberger et al., 2018; Marinacci et al., 2018; Vogelsberger et al., 2020b; Shen et al., 2020b, 2022; Kannan et al., 2023).
The initial conditions of the simulations are generated using the Gadget4 code (Springel et al., 2021) using the second-order Lagrangian perturbation theory at the initial redshift of . The simulations employ the Planck Collaboration et al. (2016) cosmology with , , and , , . We will follow these cosmological parameter choices throughout this paper. In the initial conditions, the gas perfectly follows the DM distribution and is assumed to have primordial composition with hydrogen and helium mass fractions of and , respectively.
The simulations studied in this paper and associated parameters are summarized in Table 1 and all of them are made publically available (Garaldi et al., 2023). Among them, thesan-1 is the flagship simulation of the suite with the largest number of resolution elements in a volume periodic cubic patch of the universe. thesan-hr (Borrow et al., 2022; Shen et al., 2024) is a subset of high-resolution small-volume simulations using the same numerical setup and physics inputs as the main thesan suite, aiming to explore the formation and evolution of low-mass galaxies in the early Universe. The mass resolution of the L8-N512 (L4-N512) run is about () times better than the flagship thesan-1 simulation and allows atomic cooling haloes (; e.g. Bromm & Yoshida 2011; Wise et al. 2014) to be properly resolved with DM particles, though many important physics mechanisms for haloes below this mass scale have not been included (e.g. explicit treatments of the formation and destruction of molecular hydrogen, Lyman-Werner radiation, and Population-III stars).
3 Analysis methods
| Halo mass () | The halo mass of a galaxy is defined as the sum of the mass of all particles gravitationally bound to the subhalo identified by Subfind. We find that the difference of this halo mass compared to the one based on spherical overdensity, , is () dex for () percent of the central galaxies in the thesan simulations at . The virial radius of the halo is defined as , where and is the critical density of the Universe at . |
|---|---|
| Stellar mass () | The stellar mass of a galaxy is defined as the sum of the current mass of all stellar particles within a spherical aperture from the galaxy centre. If not specifically mentioned, the default aperture is twice the stellar half-mass radius (as will be defined below). As shown in Pillepich et al. (2018b), this stellar mass definition results in good agreement with the galaxy stellar mass functions at . In practice, we find that it is typically dex smaller than the total stellar mass gravitationally bound to the subhalo. |
| Star-formation rate (SFR) | To be consistent with the default definition of stellar mass, the SFR of a galaxy is defined as the sum of the instantaneous SFR of gas cells within twice the stellar half-mass radius. The specific star-formation rate (sSFR) is the ratio between SFR and stellar mass defined above. |
| Gas mass ( and ) | Similar to the stellar mass, the gas mass in a galaxy () is defined as the sum of the mass of all gas cells within twice the stellar half-mass radius. Meanwhile, the total halo gas mass () is defined as the sum of the mass of all gas cells that are gravitationally bound to the subhalo. This represents the total gas reservoir of a given galaxy. The halo gas fraction () is defined as the ratio between and . |
| Stellar half-mass radius () | We compute the stellar three-dimensional (3D) half-mass radius so that the stellar mass enclosed is half of all the stellar mass gravitationally bound to the subhalo. We note that this could cause a minor inconsistency between our definitions of and . The here should be interpreted as a galaxy size without any pre-defined aperture. |
| Stellar effective radius () | The effective radius of a galaxy is defined as the two-dimensional (2D) half-mass/light radius. The viewing angle is set to the positive direction in simulation coordinates. We use to refer to the 2D stellar half-mass radius. We use to refer to the 2D half-light radius in a given observing band x, measured based on the mock images described in Section 3.3. We account for light contributions from all stellar particles without mimicking any surface brightness or signal-to-noise cuts. As a result, our size estimates may be larger than those typically inferred observationally (see Section 6.2 for a detailed discussion). The UV (V-band) sizes are measured in a top-hat filter centering around rest-frame 1500Å (5510Å) with a width of 100Å (300Å). |
| Halo spin () | The halo spin is defined as (Bullock et al., 2001), where is the total angular momentum of all particles associated with the halo, is the virial velocity. An alternative definition of spin parameter is (Peebles, 1969) , where is total energy of the halo. is related to this as , where is a function defined in Mo et al. (1998). |
| Stellar/gas disk fraction ( and ) | We define the face-on direction of a galaxy as the direction of the total angular momentum of stellar particles within twice . We decompose the stellar content of a galaxy by the circularity parameters of stellar particles, , where is the angular momentum of the particle aligned with the galaxy face-on vector and is the total angular momentum of this particle. Following Tacchella et al. (2019), we define that a stellar particle belongs to the disk if . The stellar disk fraction is the mass fraction of the disk component to the total stellar mass. The gas disk fraction is defined in the same way as the stellar content, except that the face-on direction is instead defined by the total angular momentum of gas cells within twice . |
3.1 Galaxy identification and properties
We identify dark matter haloes using the Friends-of-Friends (FoF; Davis et al. 1985; Springel 2005) algorithm and further identify inhabiting subhaloes via the Subfind (first described in Springel et al., 2001) algorithm. Gravitationally bound resolution elements are associated with each subhalo, and by definition, exclude elements bound to satellite galaxies. In this paper, galaxies are subhaloes with stellar masses larger than times the baryonic mass resolution () of the corresponding simulation, including both central and satellite galaxies. A comparison of the sizes of centrals and satellites is presented in Appendix B and displays no significant offsets. Unless otherwise stated, we study both central and satellite galaxies without distinction. The centre position of a galaxy is taken from the particle with the minimum gravitational potential energy. The derived galaxy properties that will be used in this paper are summarized in Table 2.
3.2 Classification of star-forming and quenched galaxies
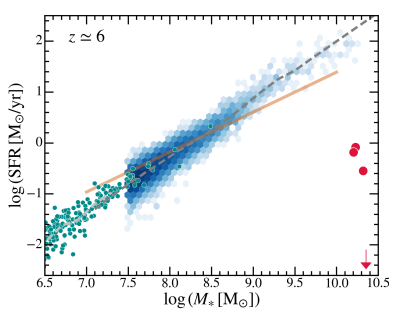
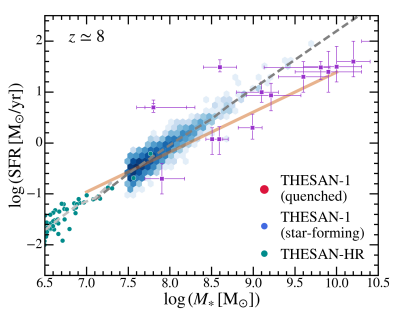
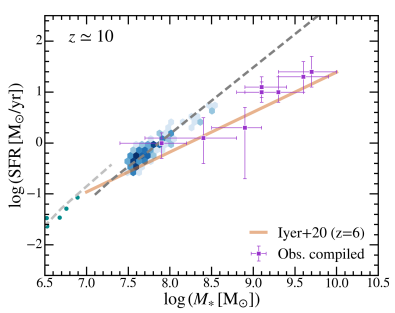
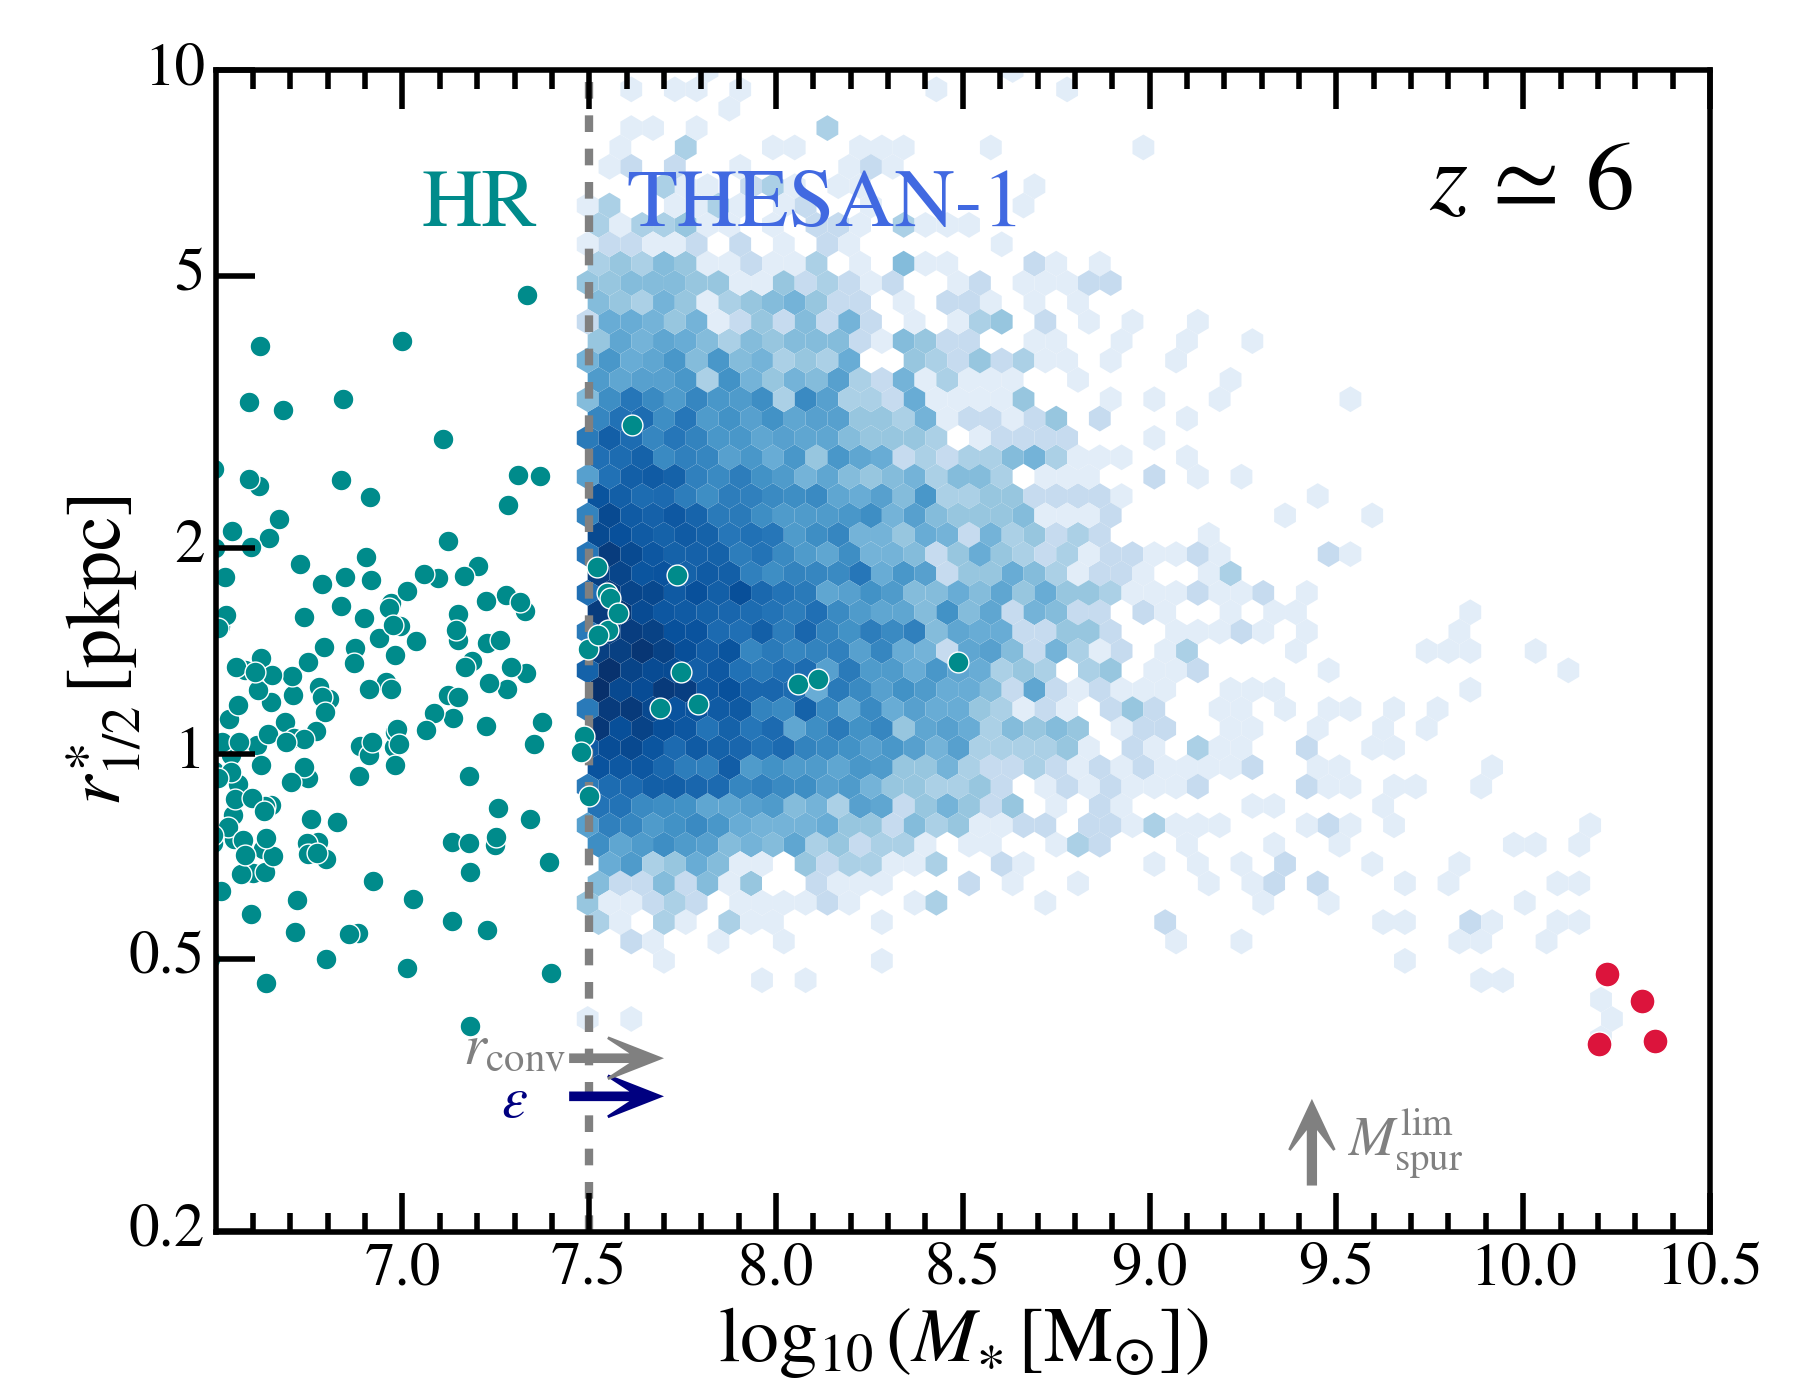
Following common practice in the observational community, we label our galaxies as star-forming versus quenched by recursively searching for the ridge line of the star-formation main sequence (SFMS, defined as the median sSFR of the star-forming galaxies). Following Pillepich et al. (2018b), we use dex bins of stellar mass and reject quenched galaxies as those whose logarithmic distance from the SFMS ridge line at their respective stellar mass lie in the range . We evaluate the SFMS in each stellar mass bin until the number of galaxies in the bin drops below , above which the reference locus of the SFMS is linearly extrapolated. Star-forming galaxies are those with . This sSFR-based classification is consistent at the percent level with commonly adopted selections in the UVJ diagram (e.g. Fang et al., 2018; Donnari et al., 2019). Furthermore, as discussed in Appendix A, the lower envelope of the SFR- distribution could be subject to numerical effects at the low-mass end. Therefore, we conservatively remove the population of spurious quenched galaxies at the low-mass end from our analysis. In Figure 1, we show the identified SFMS at for thesan-1 and thesan-hr, respectively. Four massive quenched galaxies are found at and are highlighted as red circles.
3.3 Mock galaxy images
We generate images and datacubes (full spectra in pixels) for simulated galaxies. These images will be used for the comparison with observational results in Section 6. Following our definition of galaxies in Section 3.1, we generate images only for galaxies with stellar mass larger than , and specifically for thesan-1 at and 8, we increase the stellar mass limit of galaxies to (for thesan-1) to save computational cost.
Following Vogelsberger et al. (2020b); Shen et al. (2020b); Kannan et al. (2022b), we use the Monte Carlo dust radiative transfer code Skirt (version 8; Baes et al., 2011; Camps & Baes, 2015) to generate images of simulated galaxies. We assigned intrinsic emission to stellar particles in the simulations according to their ages and metallicities using the stellar population synthesis method. All stellar particles within a (physical ) aperture are included in this calculation. We adopt the Flexible Stellar Population Synthesis (Fsps) model (Conroy et al., 2009) for continuum stellar emission. For the nebular emission originating from the birth cloud of young star clusters, we use the Byler et al. (2017) model built-in Fsps, where line luminosities are generated with Cloudy and tabulated for grids of age, metallicity, gas density, and ionization parameter of the birth cloud. Following Byler et al. (2017), we assume an ionization parameter 111Although thesan can self-consistently model the radiative transfer of ionizing photons from young massive stars and the non-equilibrium coupling to gas, HII regions are not fully resolved. Therefore, the effective treatment of nebular emission is still required. We note that the galaxy sizes studied in this paper are not sensitive to the choice of the detailed treatment of nebular emissions. , which agrees well with the ionization properties of recently JWST-identified high-redshift galaxies (e.g. Reddy et al., 2023). The gas-phase metallicity of the HII regions is chosen to be the same as the initial metallicity of the stellar particles, which is inherited from the gas cell from which a stellar particle is created. Photon packages are randomly released based on the smoothed source distribution characterized by the positions and SEDs of stellar particles. Each stellar particle has been smoothed with softening length determined by the distance to the th nearest neighbour. Radiative transfer is conducted on a wavelength grid with points spanning from to , refined around emission lines, as designed in Kannan et al. (2022b).
The emitted photon packages will further interact with the dust in the ISM. We assume that dust is traced by metals in the cold, star-forming gas and turn the metal mass distribution into the dust mass distribution with a constant, averaged dust-to-metal ratio of all galaxies at a fixed redshift. This dust-to-metal ratio depends on redshift as , which has been calibrated based on the observed UV luminosity functions at (Vogelsberger et al., 2020b) and resulted in consistent predictions when applied to thesan (Kannan et al., 2022b). The radiative transfer calculations are performed on an adaptively refined octree grid (Saftly et al., 2014) with the minimum and maximum refinement levels set to and . The grid spans on each dimension and the resulting minimum Octree cell size is about . Dust emission is modelled assuming thermal equilibrium with the local radiation field. We adopt the Draine & Li (2007) dust mix, which includes a composition of graphite, silicate, and polycyclic aromatic hydrocarbon (PAH) grains. This model reproduces the average Milky Way extinction curve and is widely used (e.g. Jonsson et al., 2010; Rémy-Ruyer et al., 2014).
For each wavelength on the wavelength grid, photon packets are launched isotropically. Compared to Kannan et al. (2022b), we increase to to reduce the Poisson noises in mock images. The photon packets then propagate through the resolved gas (dust) distribution in the ISM and interact with the dust cells randomly before they are finally collected by a pre-defined photon detector, which is placed at a distance of from the galaxy centre in the positive direction. The pixel-wise galaxy spectra are then recorded, which can be processed to integrated SED, imaging, or integrated field unit data. For rest-frame broadband photometry, galaxy SEDs are convolved with the transmission curves using the Sedpy code. For the calculation of apparent band magnitudes, the rest-frame flux is redshifted, corrected for intergalactic medium absorption (Madau, 1995), and converted to the observed spectra. The final images have a field-of-view of and pixels. Convolution with the point spread function (PSF) of observational instruments or background noises has not been considered here.
4 Galaxy intrinsic size–mass relation
The intrinsic size of a galaxy is represented by the 3D stellar half-mass radius (as defined in Table 2). This is the preferred quantity for our analysis of the physical evolution of galaxy sizes, as it is less affected by geometrical/projection effects and tracer biases (e.g. using light in certain bands as a tracer for stellar mass). Therefore, the analysis will begin with and we leave the discussions on observed galaxy sizes to Section 6.1.
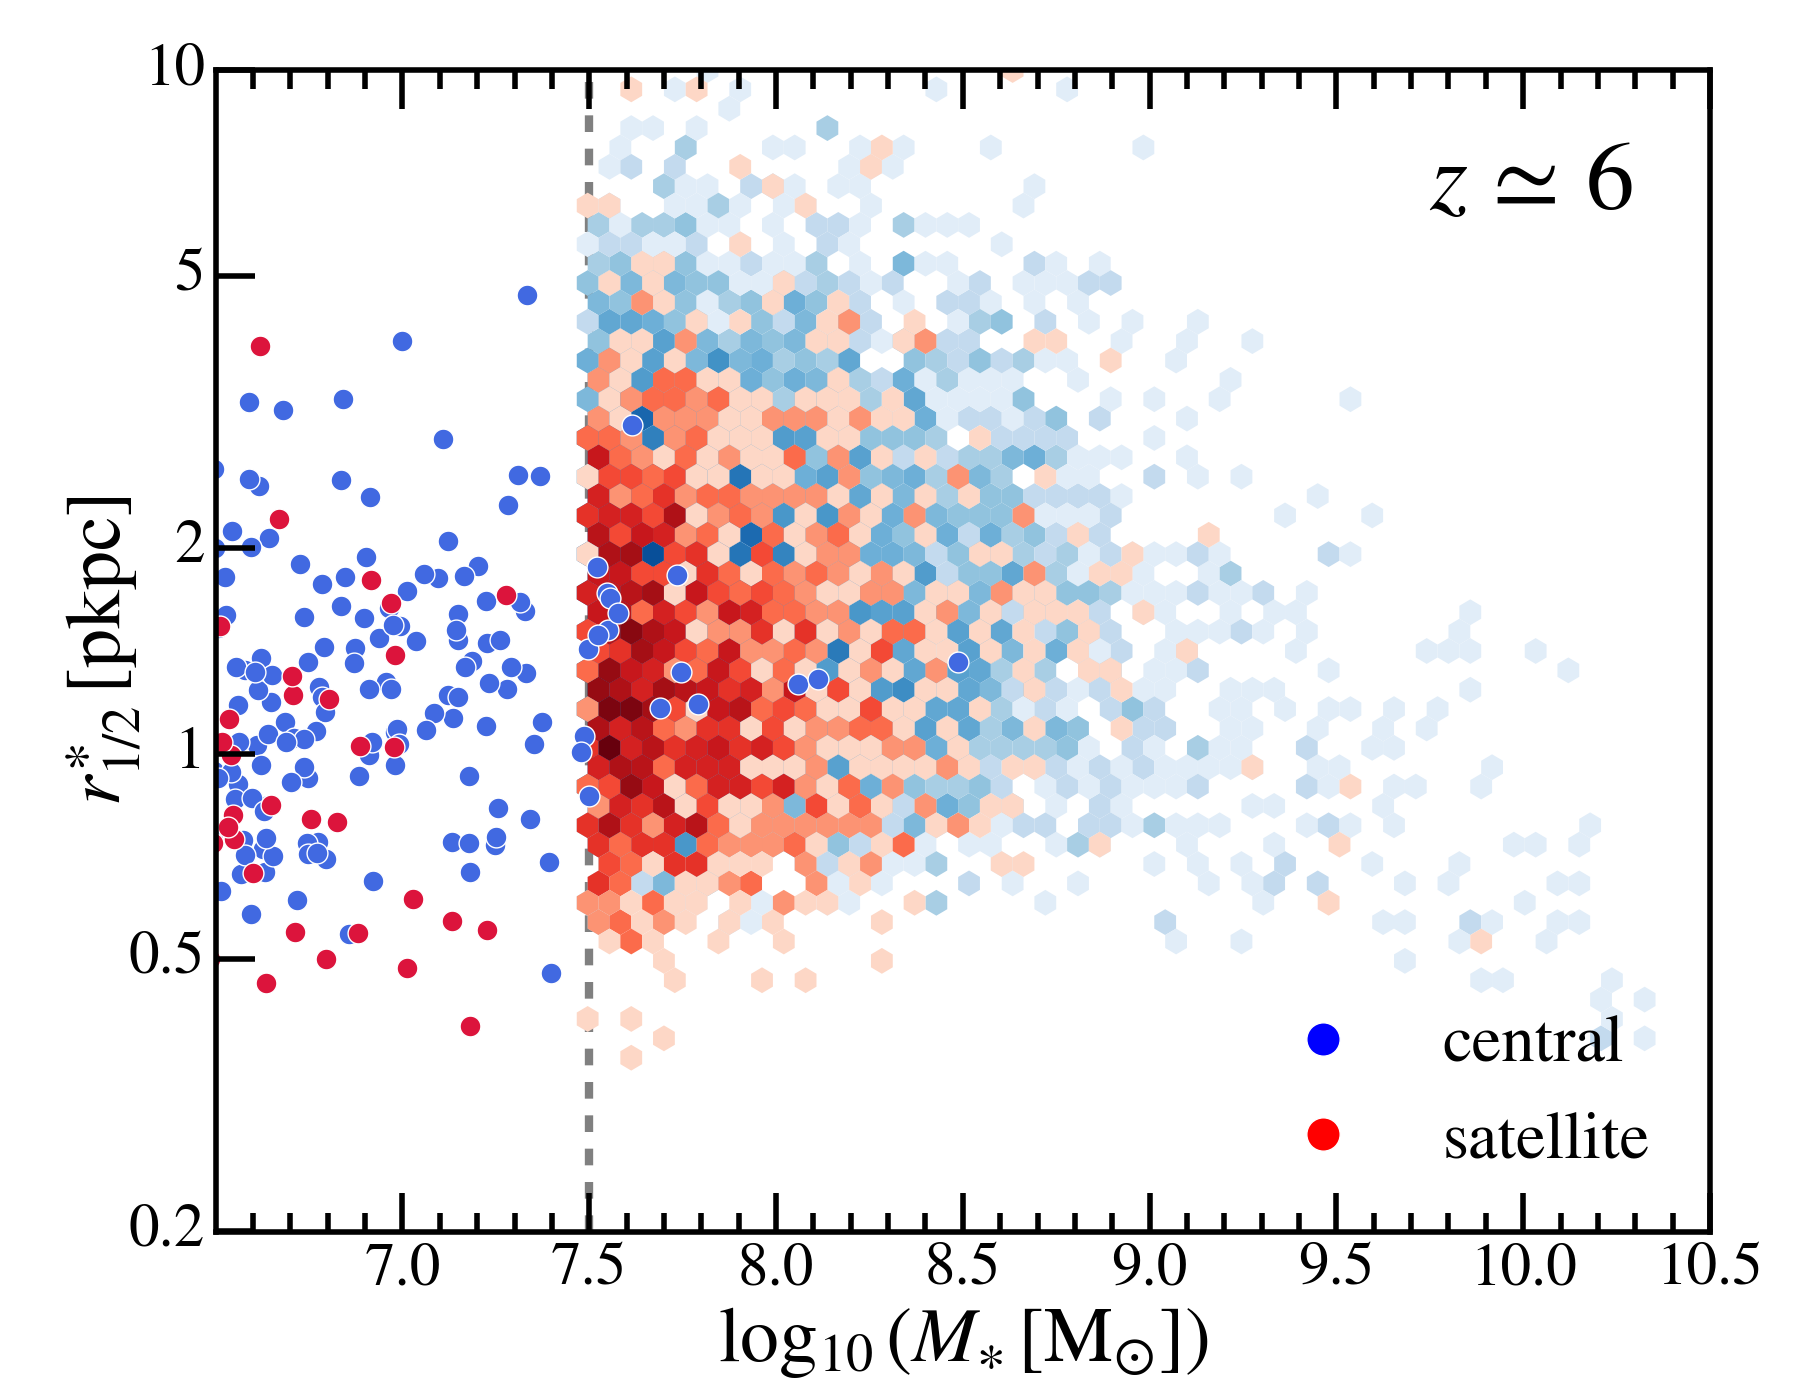
In the top panel of Figure 2, we show the intrinsic size–mass relation of galaxies in the thesan simulations. The intrinsic sizes of galaxies show a mild increase with stellar mass at the low-mass end () while displaying a negative correlation with stellar mass towards the massive end. Notably, all galaxies at the massive end () are compact (). Four massive compact galaxies in thesan-1 are quenched at . The scatter of galaxy sizes at the low-mass end is substantial. A population of low-mass compact galaxies exists at the same time with extended galaxies with sizes as large as . Due to the limited mass and spatial resolution of the simulations, numerical effects can affect galaxy sizes in non-trivial ways (e.g. Power et al., 2003; Ludlow et al., 2019a, 2023). This is discussed in detail in Appendix A. In Figure 2, we show two relevant spatial scales for numerical effects, the convergence radius () and the physical gravitational softening length () of stars as well as the mass limit below which galaxy size can be affected by spurious heating of DM particles. In this regime, we could miss a population of low-mass compact galaxies in our simulations. However, in terms of the median relation, the numerical convergence is decent when comparing thesan-1 and thesan-hr results. We refer readers to Appendix A for a more thorough discussion.
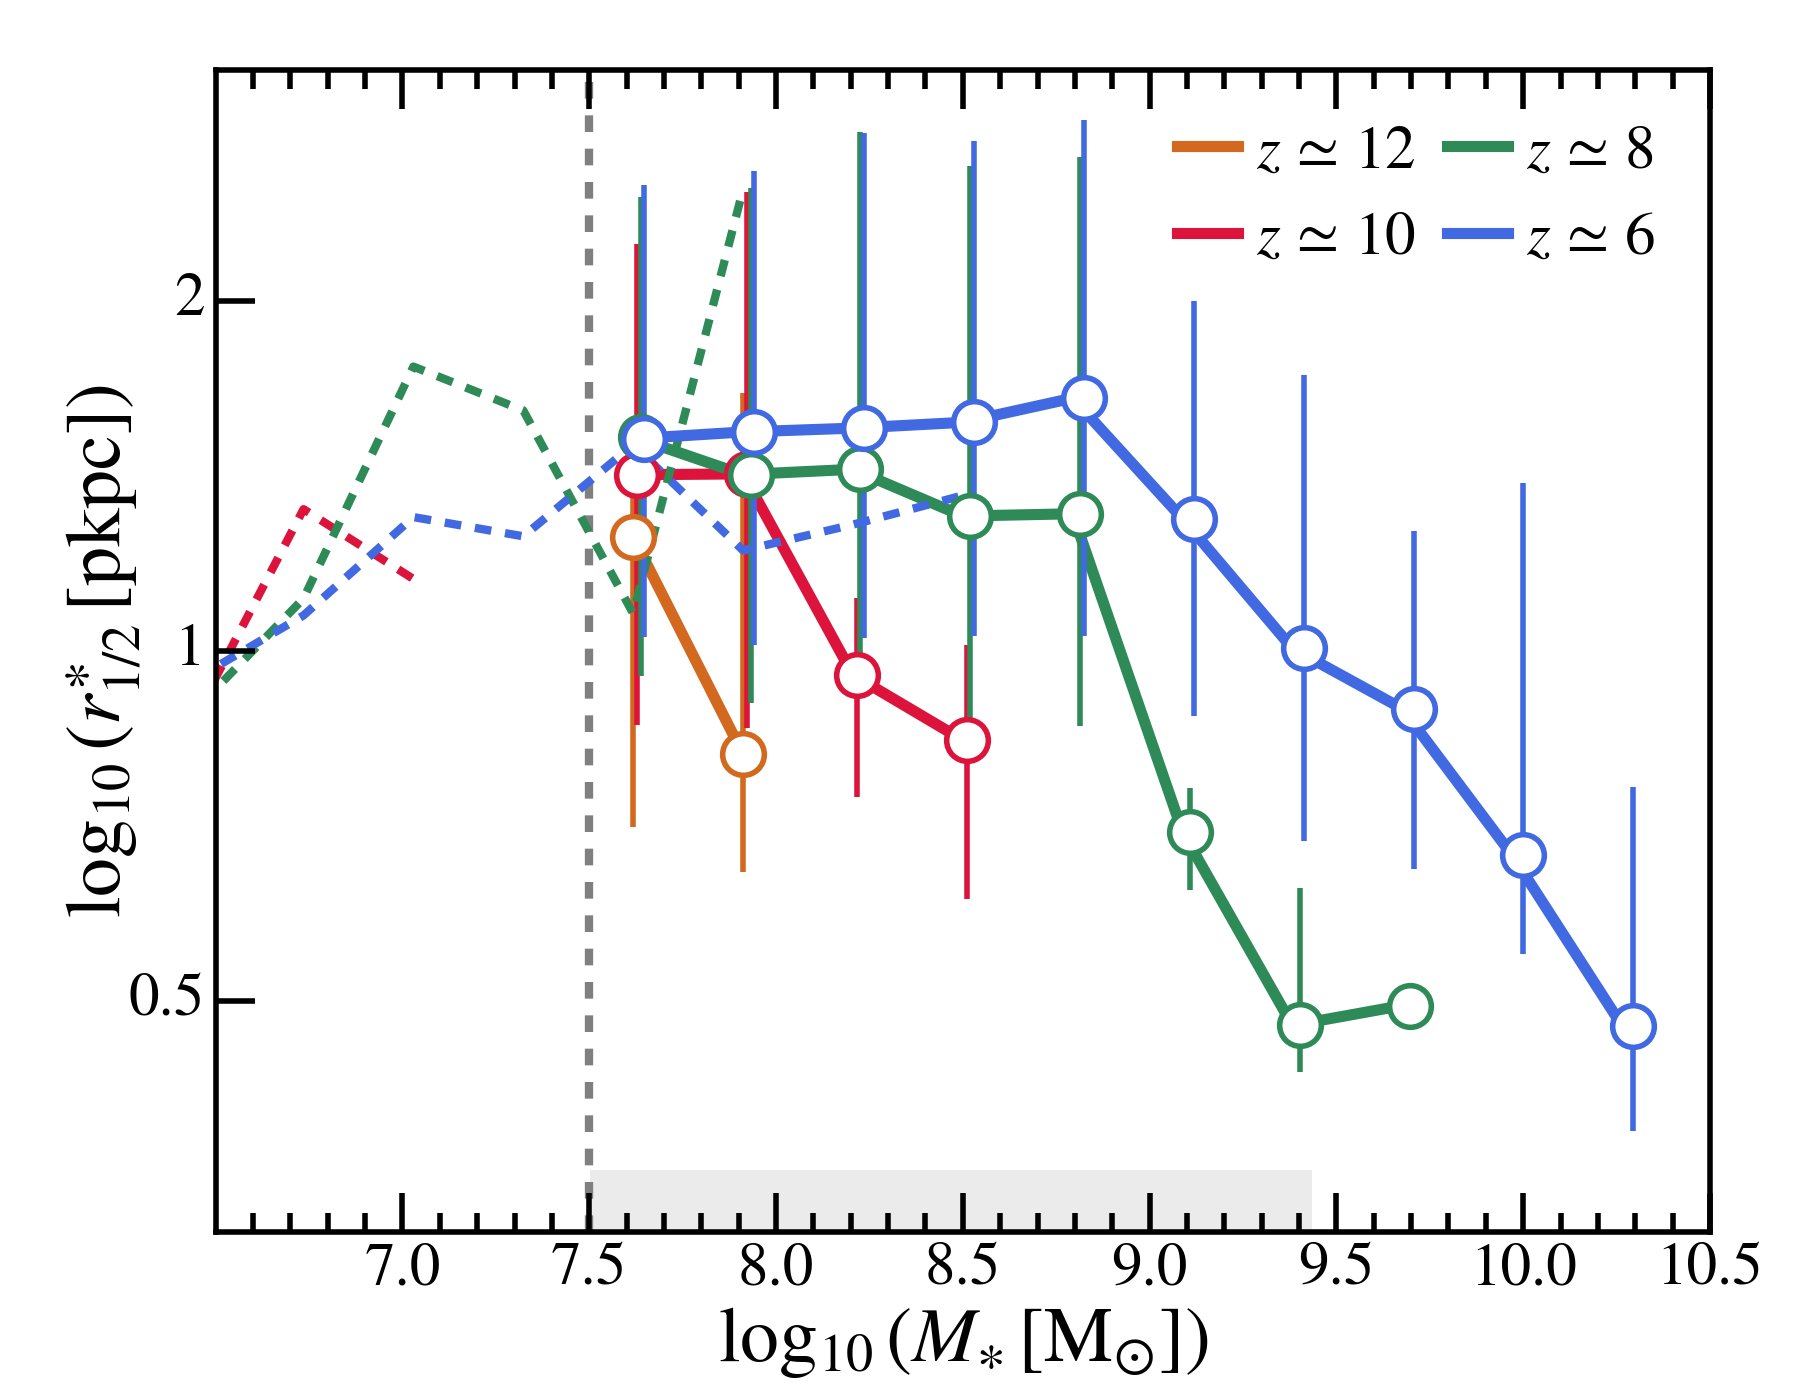
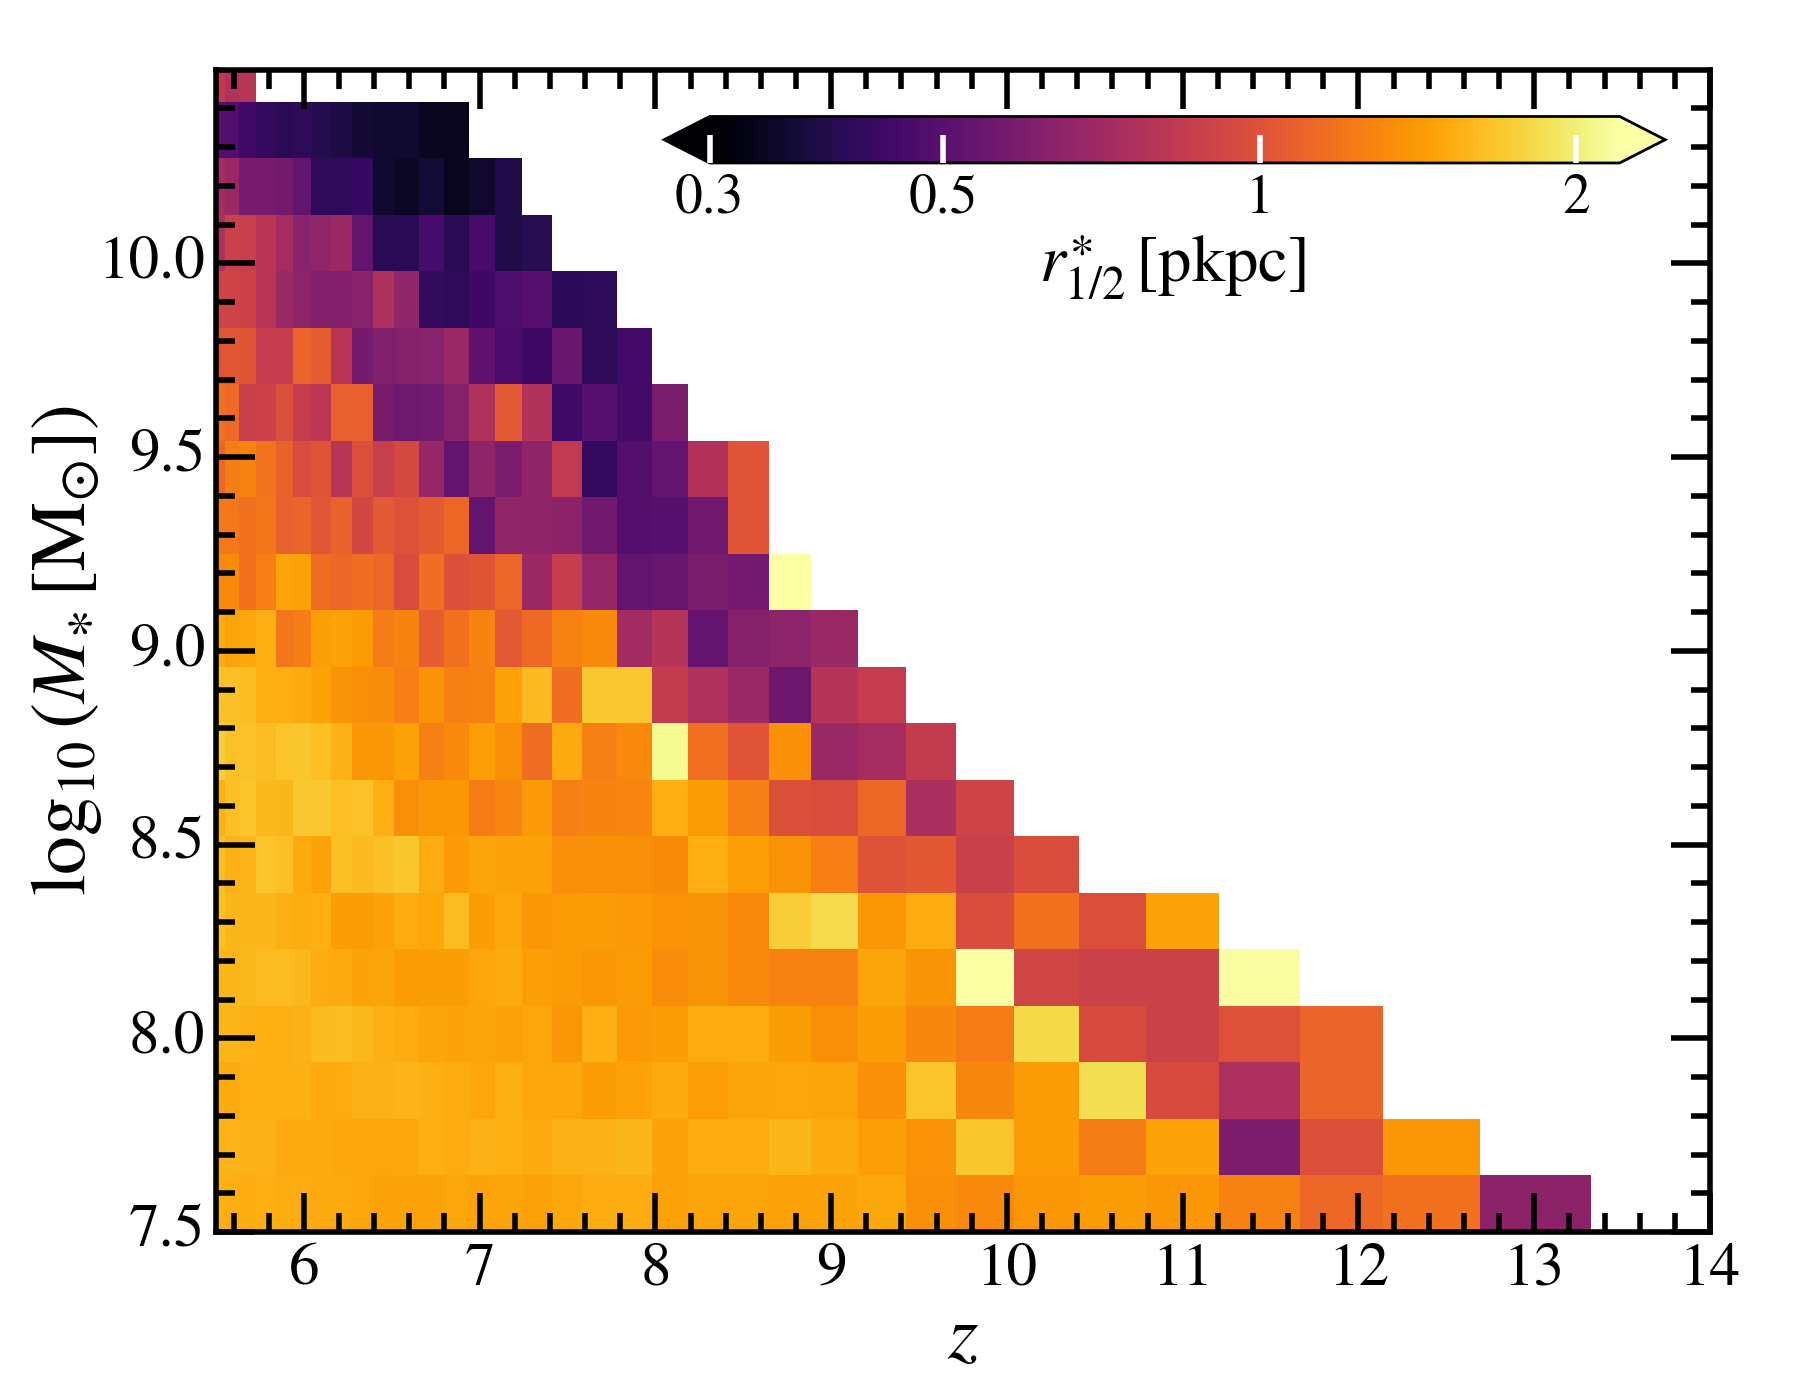
In the bottom panel of Figure 2, we show the evolution of the intrinsic size–mass relation from to . The shaded regions show the regime affected by spurious heating at (as characterized by and the spurious heating mass limit). At all redshifts, galaxies at the massive end have their sizes negatively correlated with stellar mass. The massive compact tail continuously evolves towards the massive compact end. As we will discuss later, the tail is represented by galaxies that consistently stay in the compact end of the galaxy population and some of them are quenched at . However, at the low-mass end, there is limited evolution. The scatters of the size–mass relation increase with cosmic time. In Figure 3, we present a more thorough view of galaxy size as a function of stellar mass and redshift. The upper edge of this colormap can be interpreted as the main progenitor mass growth history of the most massive galaxies in the thesan-1 simulation. These massive galaxies become increasingly more compact through time since . The compaction phase is similar for slightly lower-mass galaxies but with a delayed starting time. At fixed stellar mass and at , galaxy sizes are larger at lower redshift but this is primarily due to their different phases on the track of compaction. On the other hand, the sizes of low-mass galaxies have little evolution and are consistently above , suggesting fundamentally different physical mechanisms controlling galaxy sizes at different mass scales.
The negative slope of the size–mass relation at the massive end is consistent with findings in previous theoretical studies using simulations (e.g. Roper et al., 2022; Popping et al., 2022; Costantin et al., 2022; Marshall et al., 2022). However, it is contradictory to the positive correlations found in observations at low redshifts (though at sightly larger stellar masses; e.g. Mosleh et al., 2012; van der Wel et al., 2014; Lange et al., 2015) and some more recent constraints at (e.g. Shibuya et al., 2015; Kawamata et al., 2018; Ormerod et al., 2023; Morishita et al., 2023). The contradiction could be due to the concentrated dust attenuation in massive galaxies, resulting in less cuspy surface brightness profiles and larger apparent sizes (e.g. Roper et al., 2022; Marshall et al., 2022; Popping et al., 2022). In addition, the intrinsic 3D sizes we find in thesan are generally larger than the effective radii reported for observed galaxies. A combination of projection effects, tracer biases, and dust attenuation could lead to this discrepancy. This will be discussed in detail in Section 6.2.
4.1 Compare to other simulations
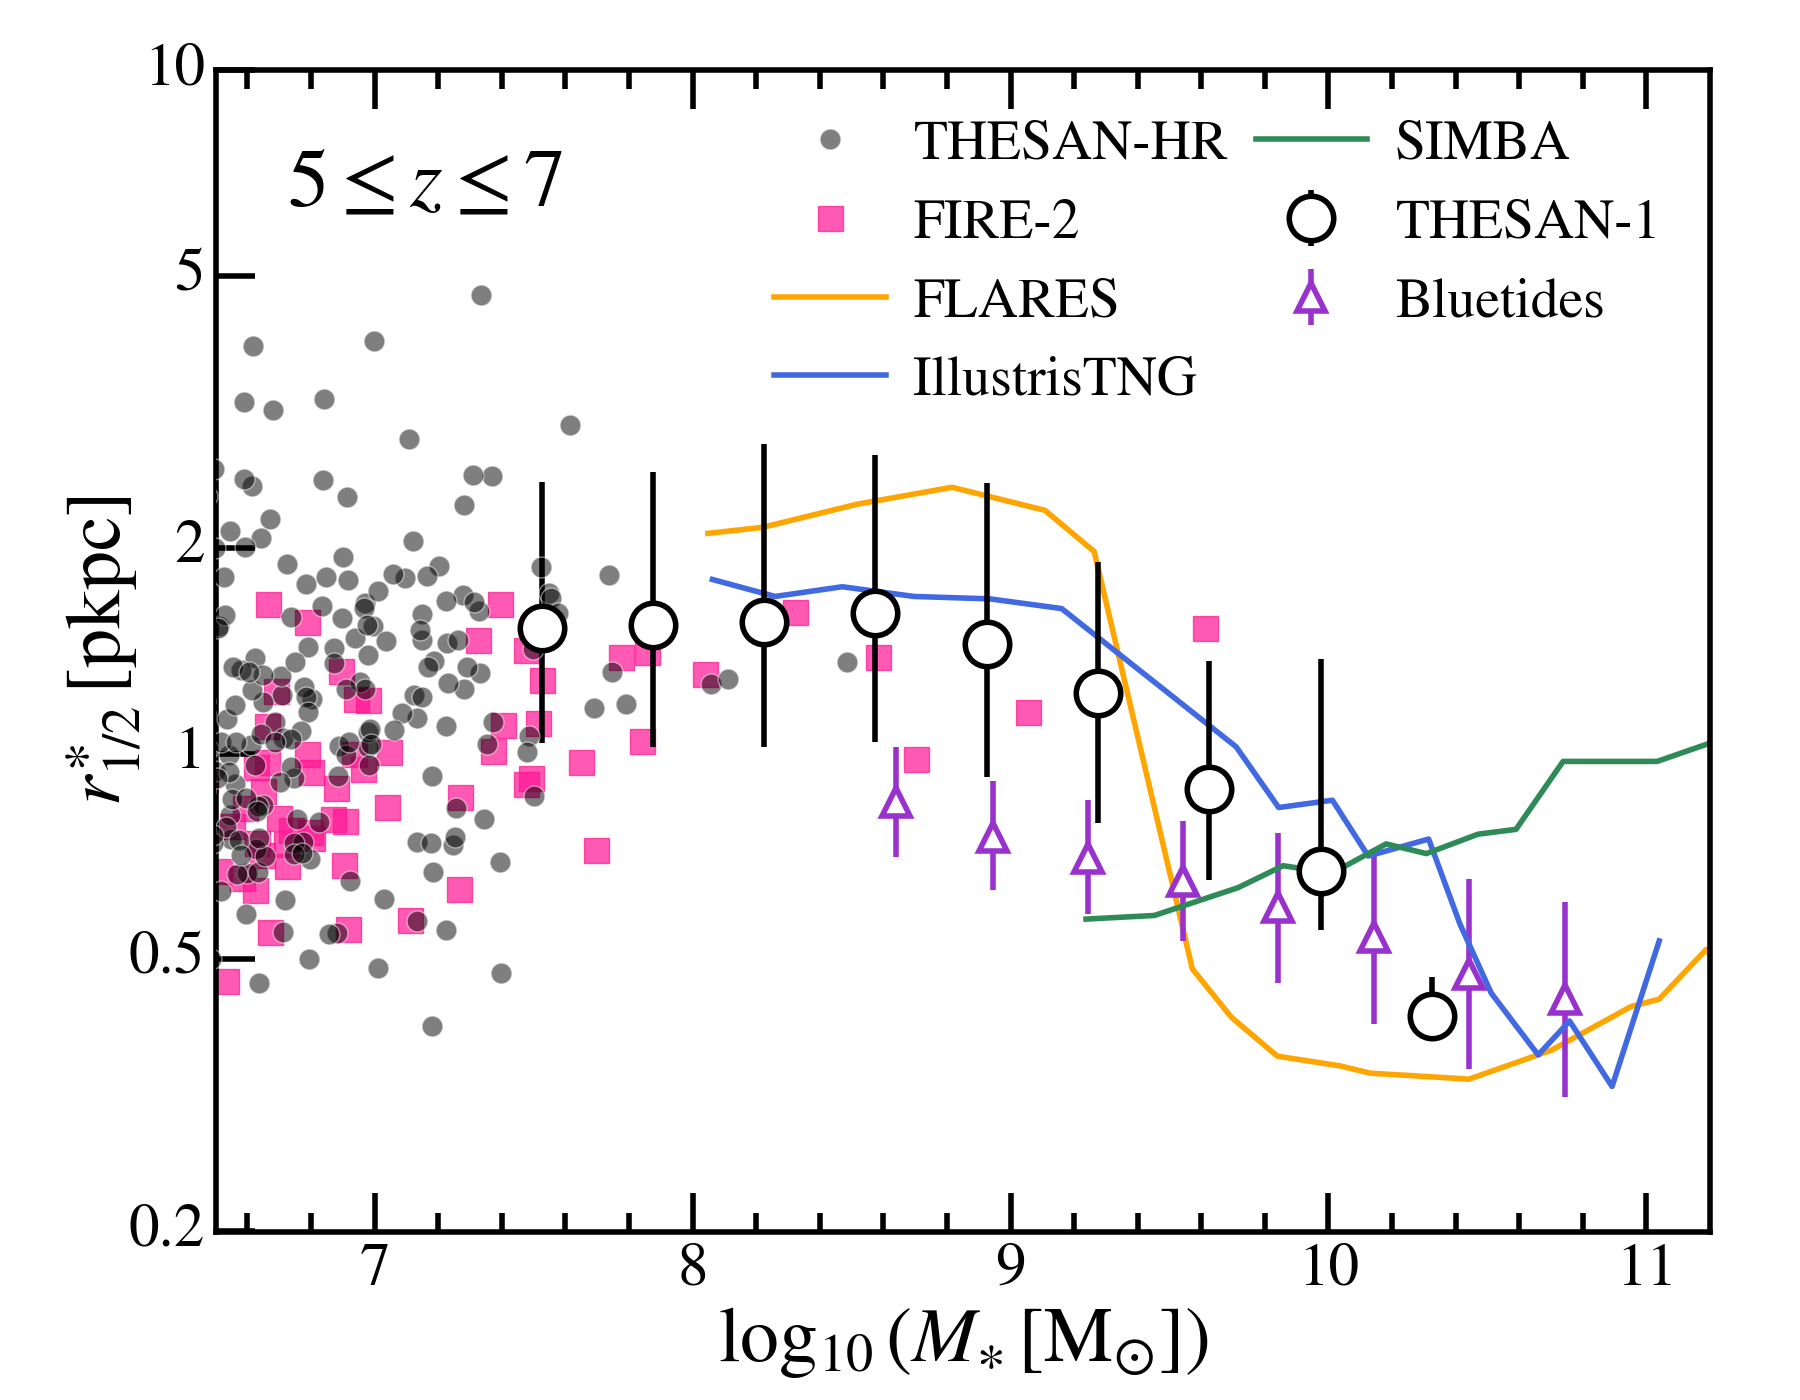
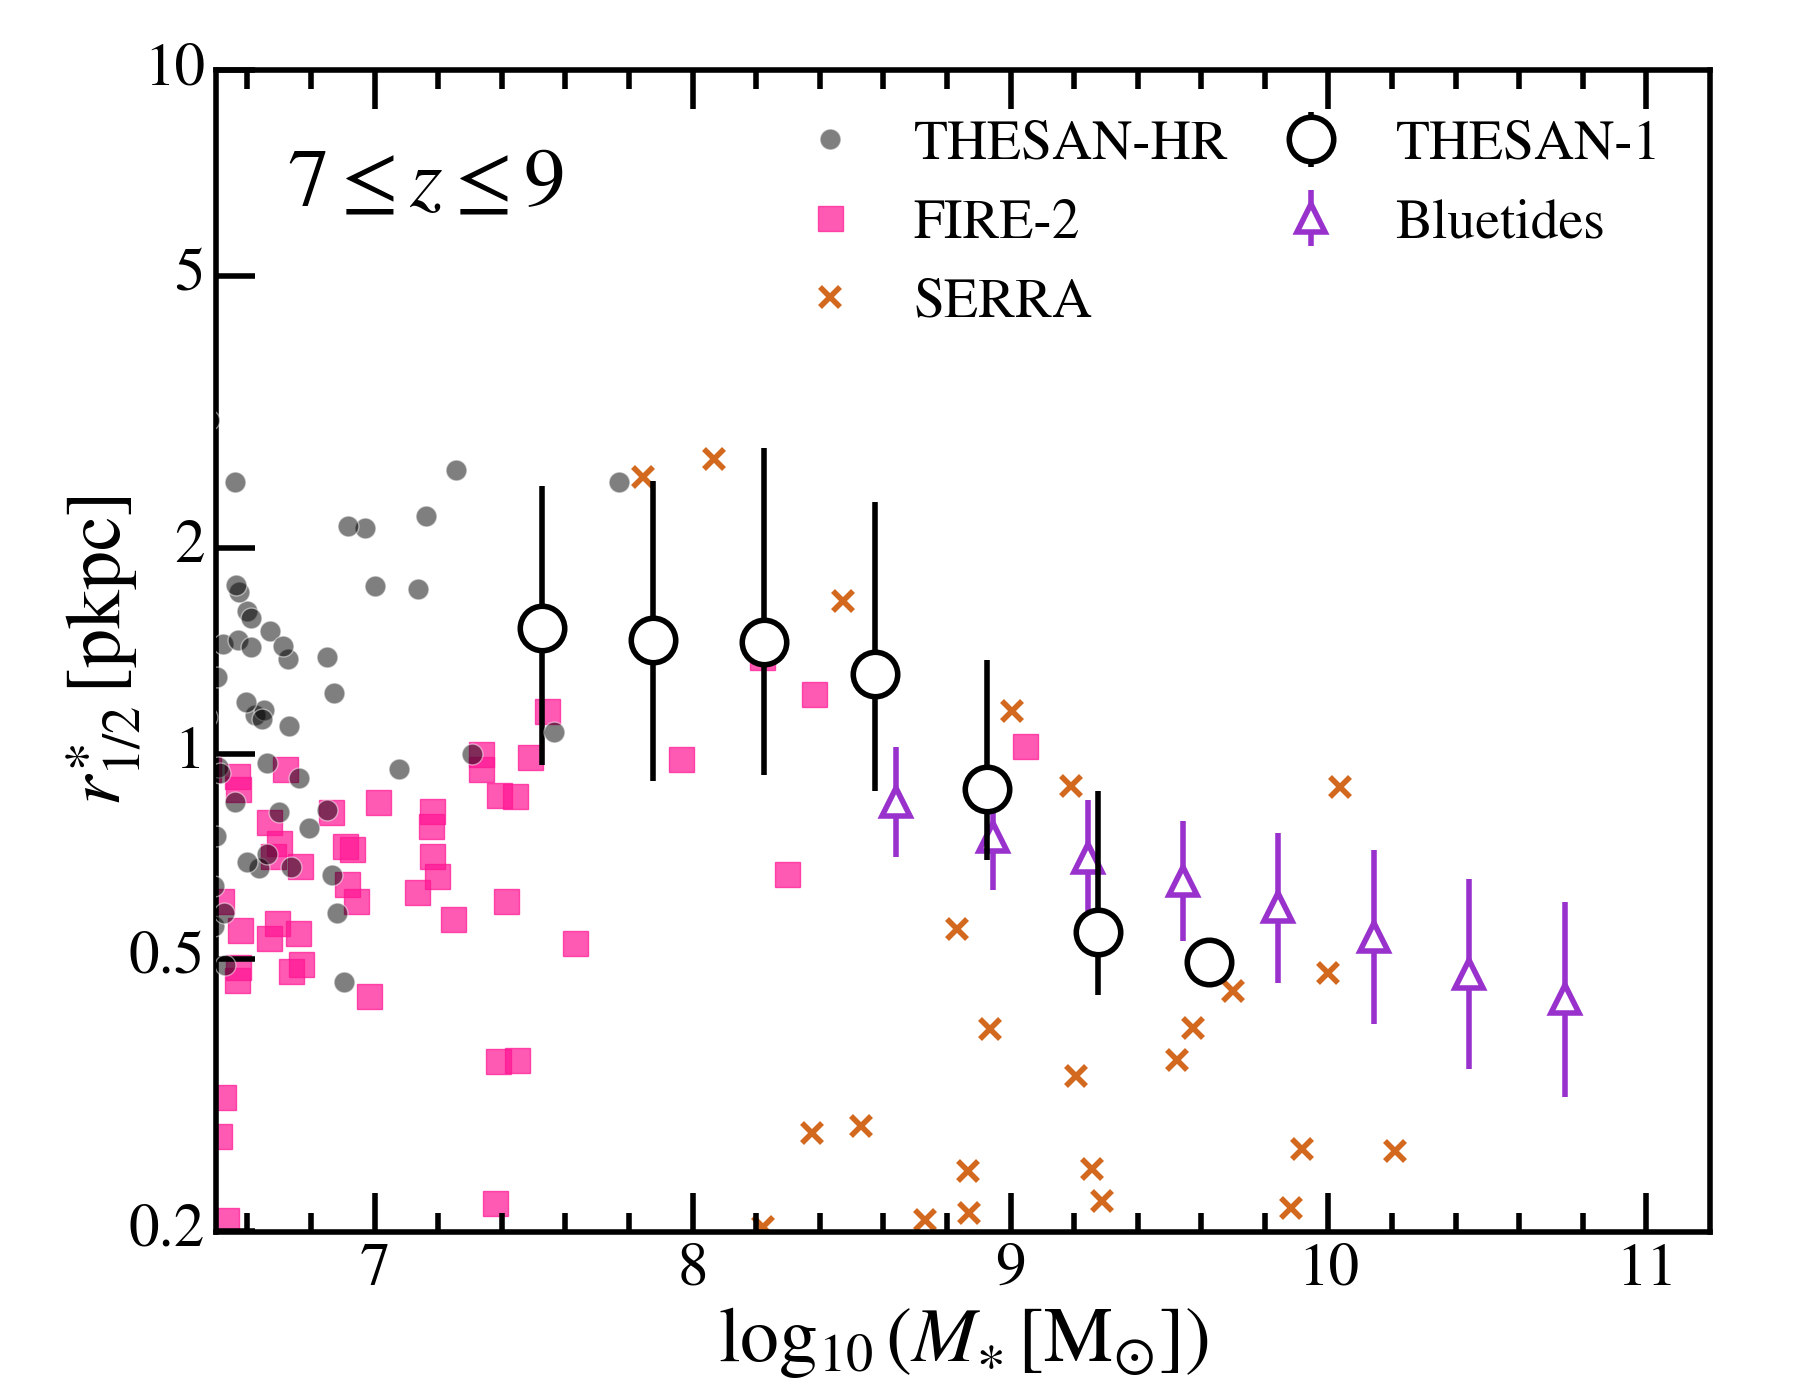
In Figure 4, we compare the thesan results with other cosmological hydrodynamic simulations using diverse numerical setups and galaxy formation physics models. We include predictions from the FLARES simulation (Vijayan et al., 2021; Lovell et al., 2021) at , the IllustrisTNG simulation (specifically TNG100-1; Pillepich et al., 2018a) at , the SIMBA simulation (m100n1024; Davé et al., 2019) at , as shown and compared in Roper et al. (2023). In addition, we include predictions of the 2D projected half-stellar-mass radius from the FIRE-2 simulations (Ma et al., 2018b; Ma et al., 2018a) and the Bluetides simulations (Marshall et al., 2022). The 2D half-mass radius is converted to the 3D half-mass radius using a constant multiplication factor, , as will be motivated in Section 6.2. We also include the UV effective radius predictions of central galaxies from the SERRA simulations (Pallottini et al., 2022), for which we adopt the same multiplication factor and effectively assume that the UV light is a perfect tracer of stellar mass.
The thesan predictions are in good agreement with IllustrisTNG as expected due to the same galaxy formation model employed. Compared to FLARES, thesan-1 predicts roughly the same normalization and negative dependence of size versus mass, but thesan-1 does not predict the sharp galaxy size transition at as seen in FLARES. Compared to Bluetides, thesan-1 results are in good agreement with it at the massive end while giving about a factor of two larger sizes at at . Predictions from SIMBA exhibit a positive slope of size–mass relation, in contrast with the results of all other simulations. This could be due to the poorer mass resolution of the m100n1024 run of SIMBA (Roper et al., 2023) but also details in the feedback model.
Compared to FIRE-2, which is a suite of high-resolution () zoom-in simulations, the results from thesan-1 and thesan-hr are consistent with it at . This consistency is non-trivial given the drastically different simulation strategy, numerical resolution, star-formation, and feedback model employed. However, FIRE-2 did not predict the relatively extended galaxy population () at the low-mass end and this discrepancy becomes more apparent at . For IllustrisTNG, the effective ISM model does not resolve the cold molecular phase, and the spatial and time clustering of star-formation may be suppressed compared to simulations employing a high-density threshold and more explicit criteria for star-formation (e.g. Pontzen & Governato, 2014). Therefore, the thesan simulations may miss the temporary extremely compact phase of galaxies, especially at the low-mass end where the stellar component of a galaxy can be dominated by a single compact star cluster (e.g. Yajima et al., 2017; Ma et al., 2018a).
Even within high-resolution zoom-in simulations employing resolved ISM physics, predicted sizes can differ substantially due to the detailed implementation of star-formation and feedback. An example is the outlier in our size comparison in Figure 4, the SERRA simulations (Pallottini et al., 2022), which predicts increasingly more compact galaxies at than all other simulations. As will be discussed later in Section 6, this result turns out to agree better with the observational constraints. These comparisons here highlight the potential of galaxy sizes at high redshifts as a channel to constrain physics models of galaxy formation and evolution.
We note that the simulations compared here together indicate a hump feature in the intrinsic size mass relation of galaxies at in the stellar mass range of to . In the mass range, the majority of the galaxies have . This means that a single power-law relation is not adequate to describe the connection between and at , in contrast to the common practice in observational studies (e.g. van der Wel et al., 2014; Shibuya et al., 2015). Meanwhile, as will be demonstrated in Section 6.1, the extended galaxy sizes around the hump feature are in tension with the latest observational constraints, including the ones based on JWST spectroscopically confirmed galaxy samples.


4.2 Correlation of size with galaxy properties
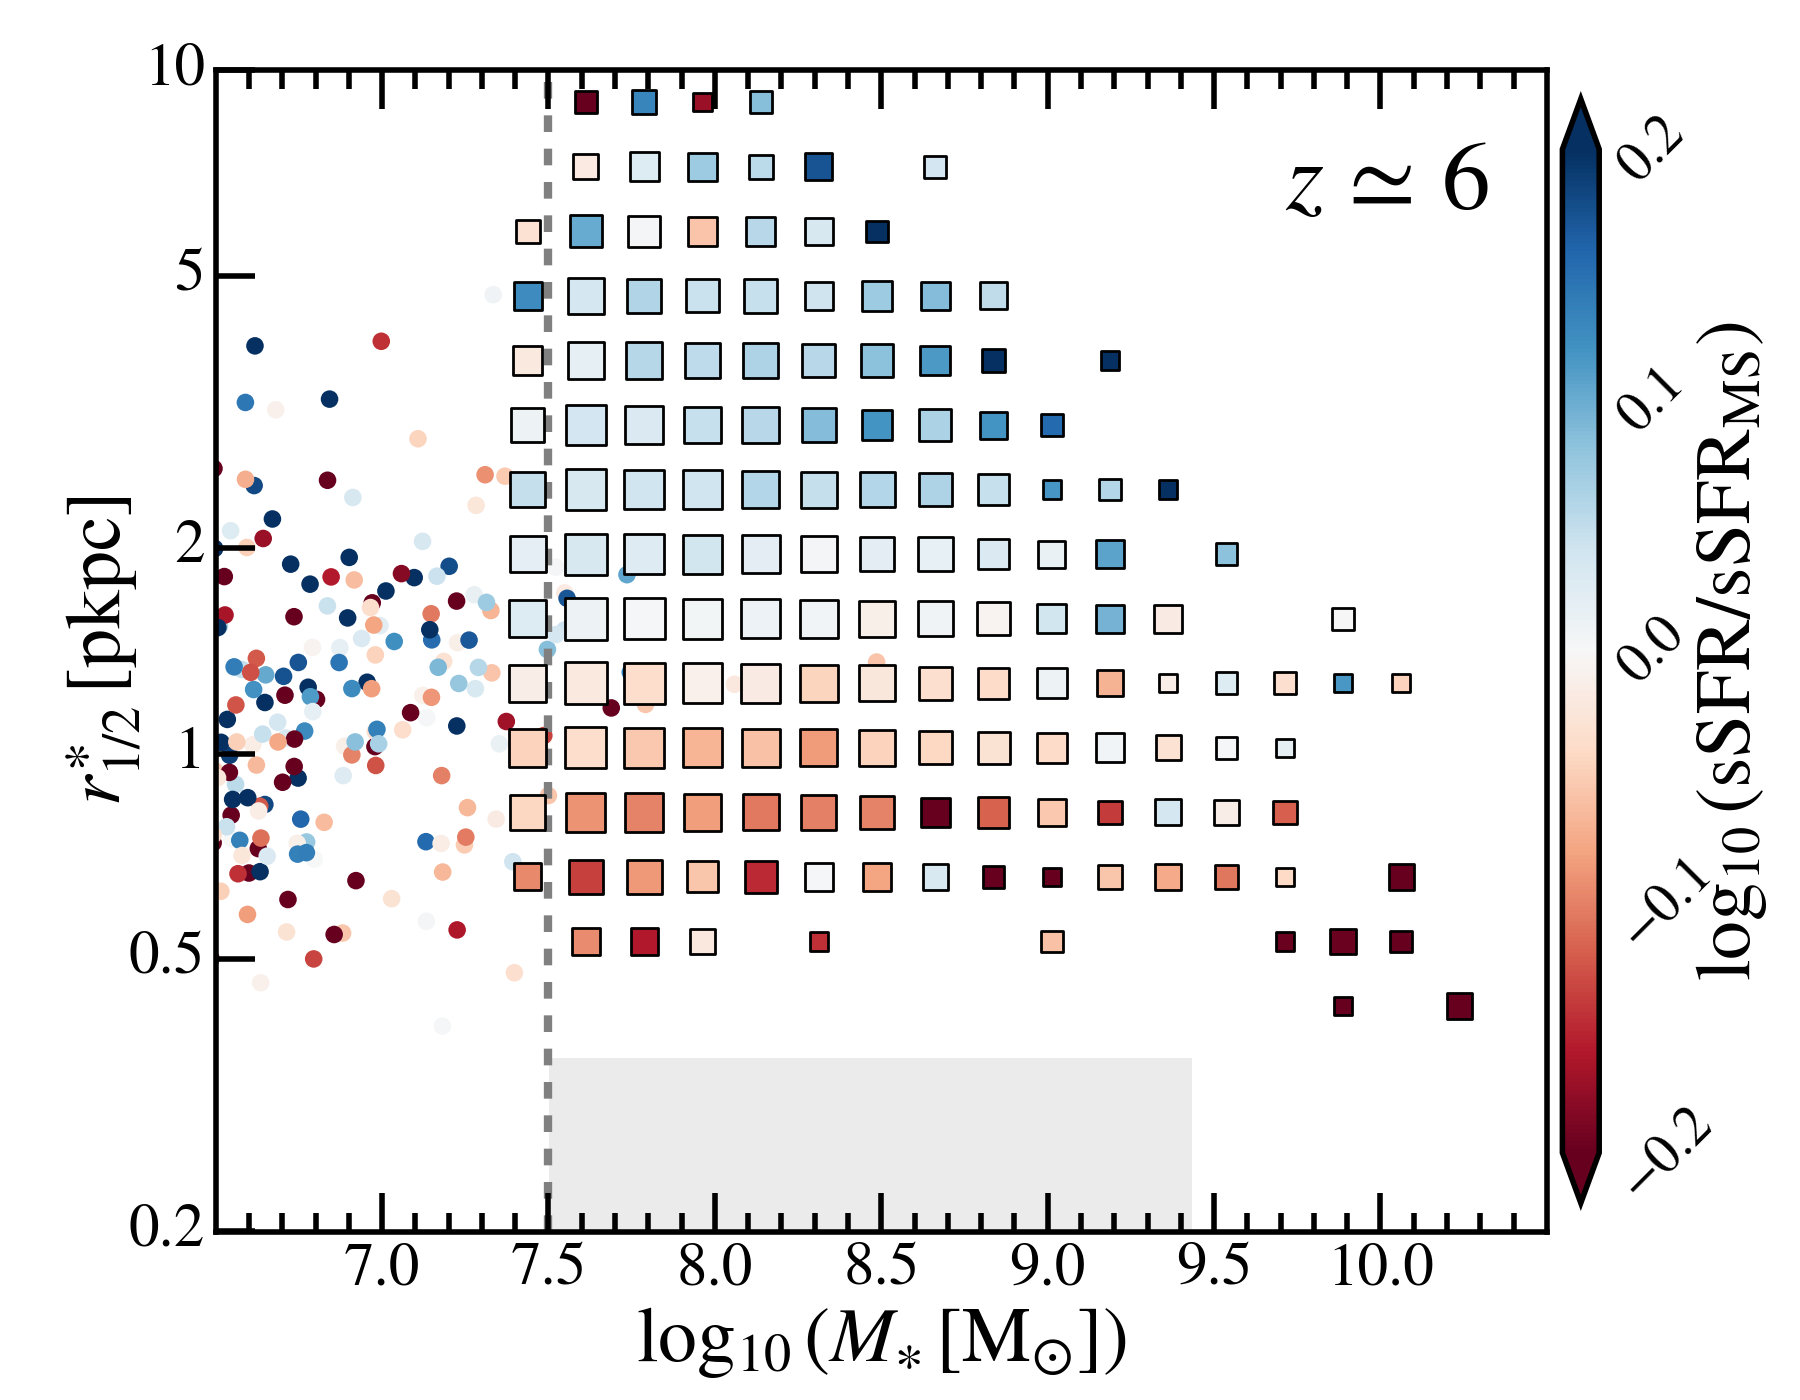
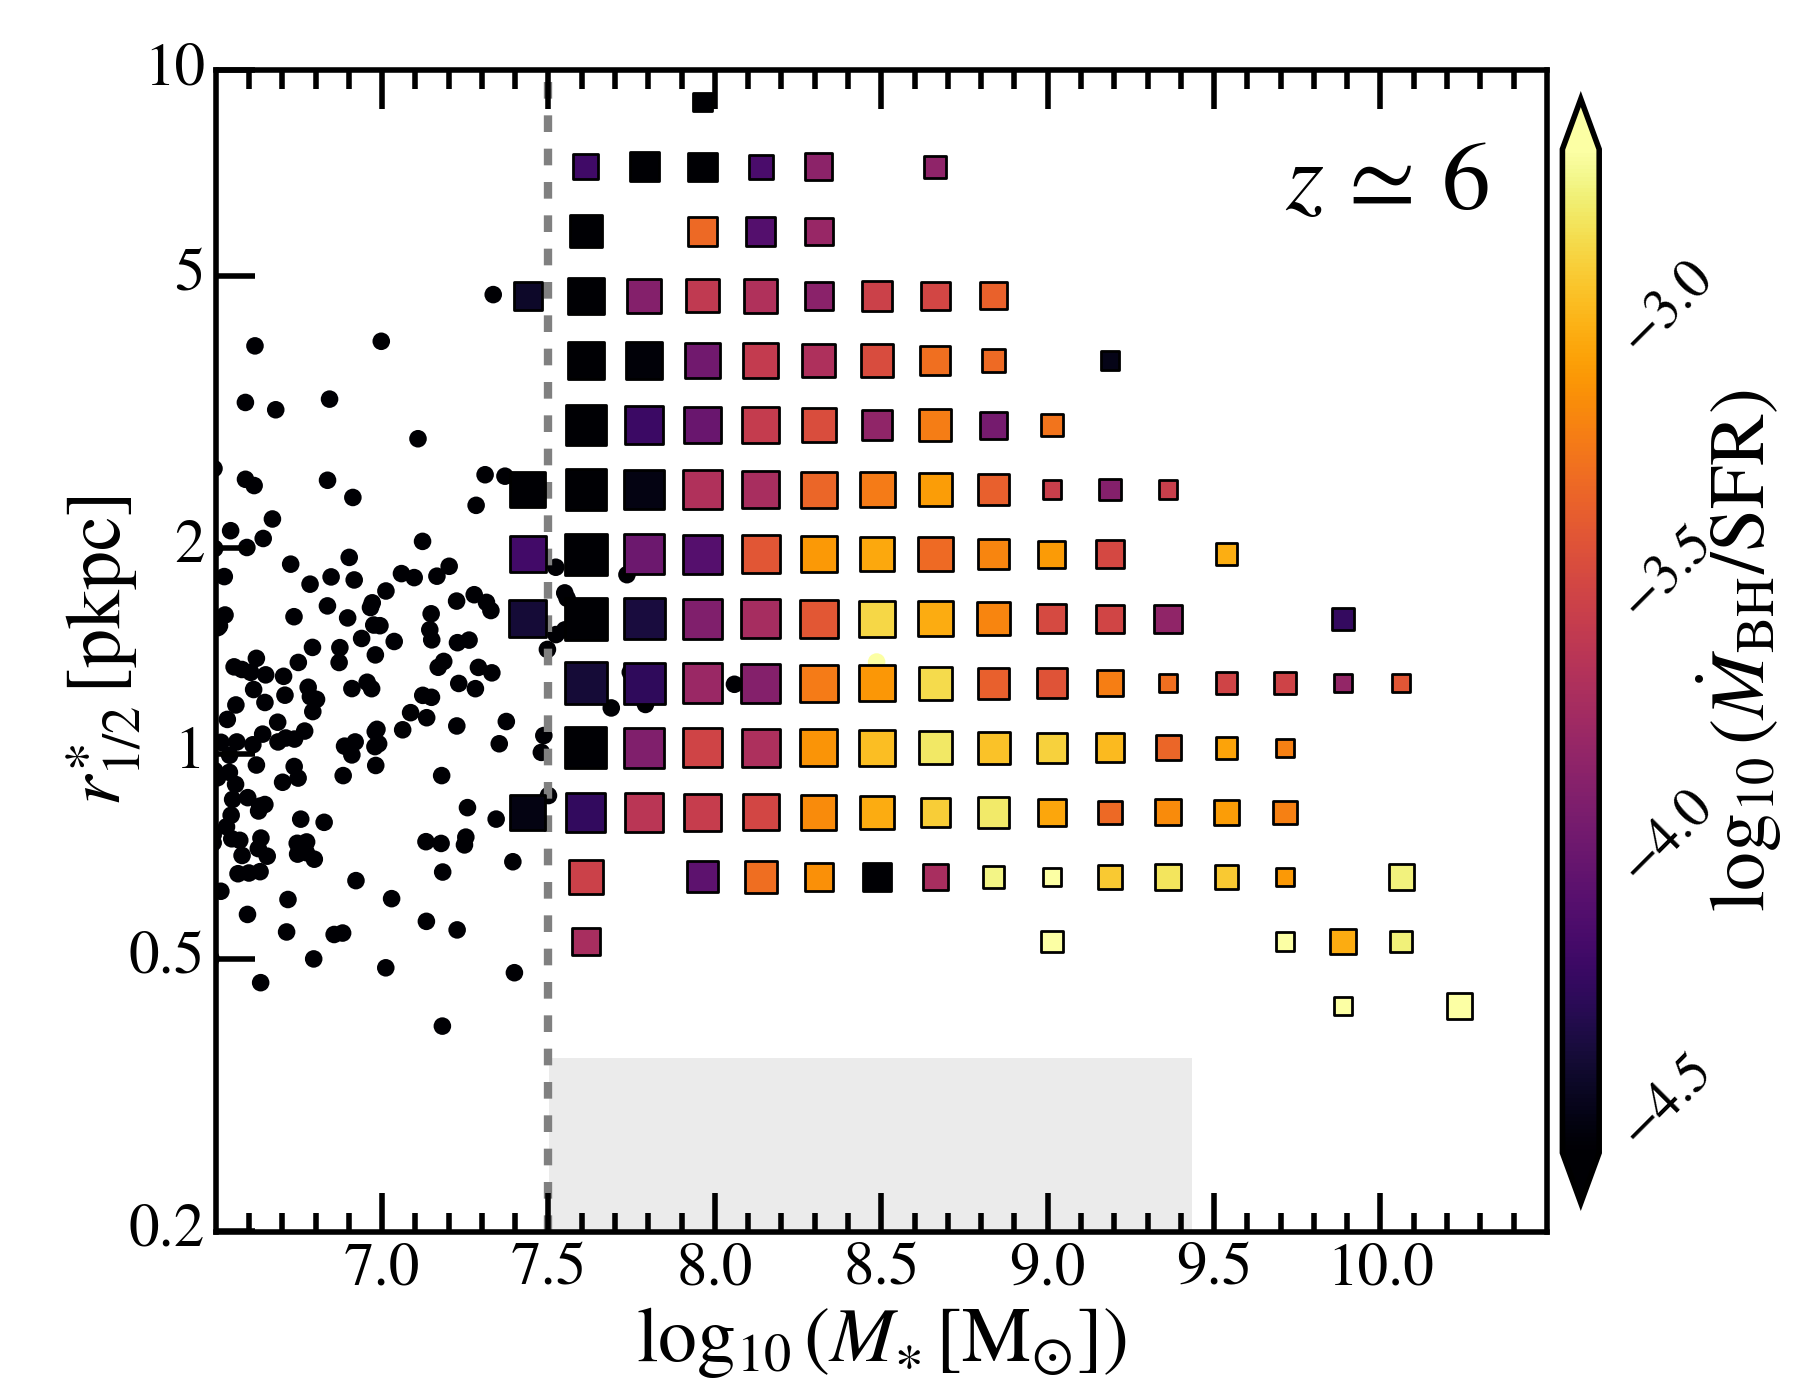
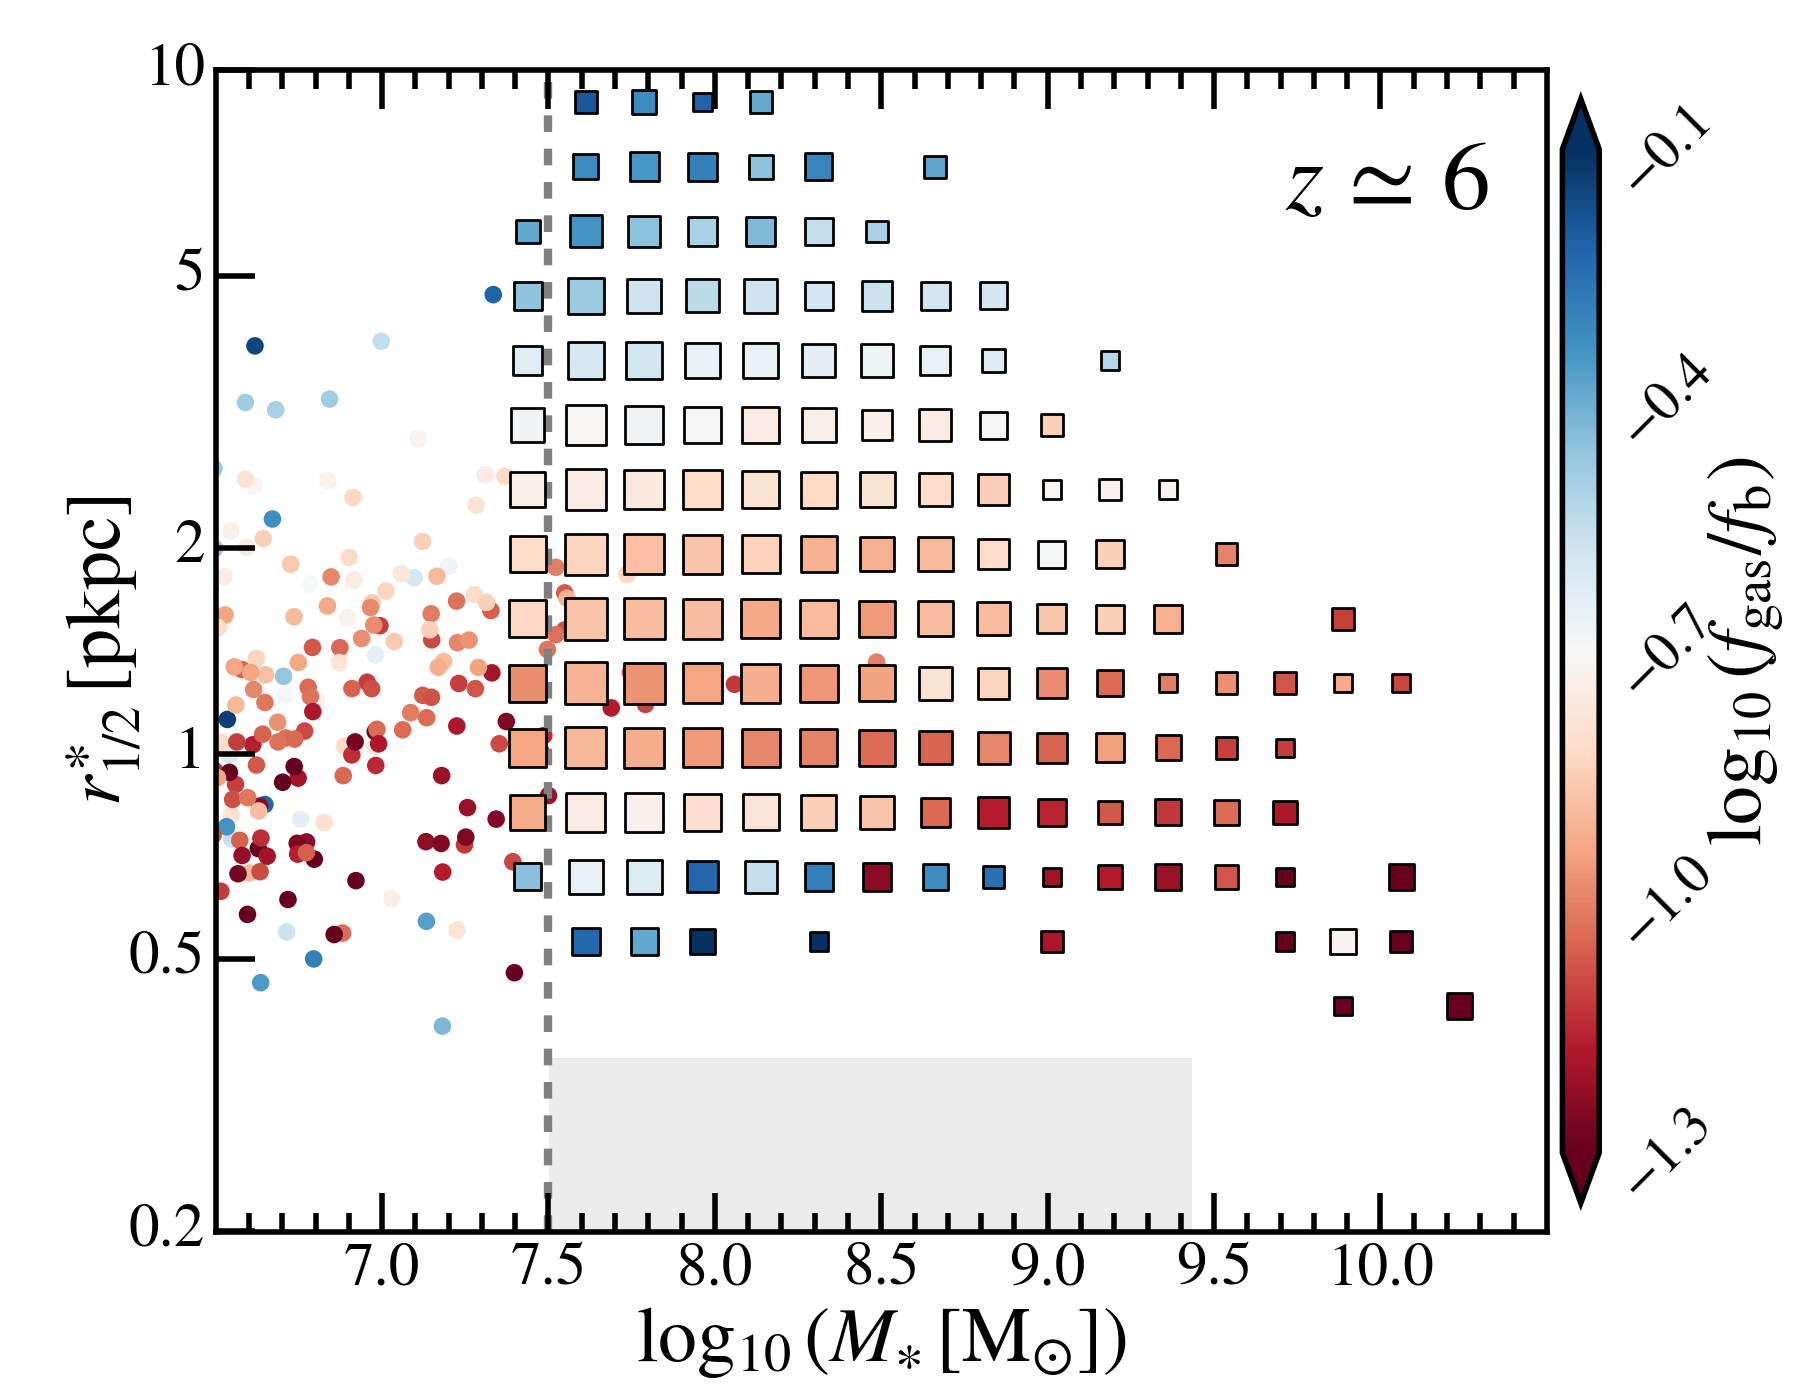
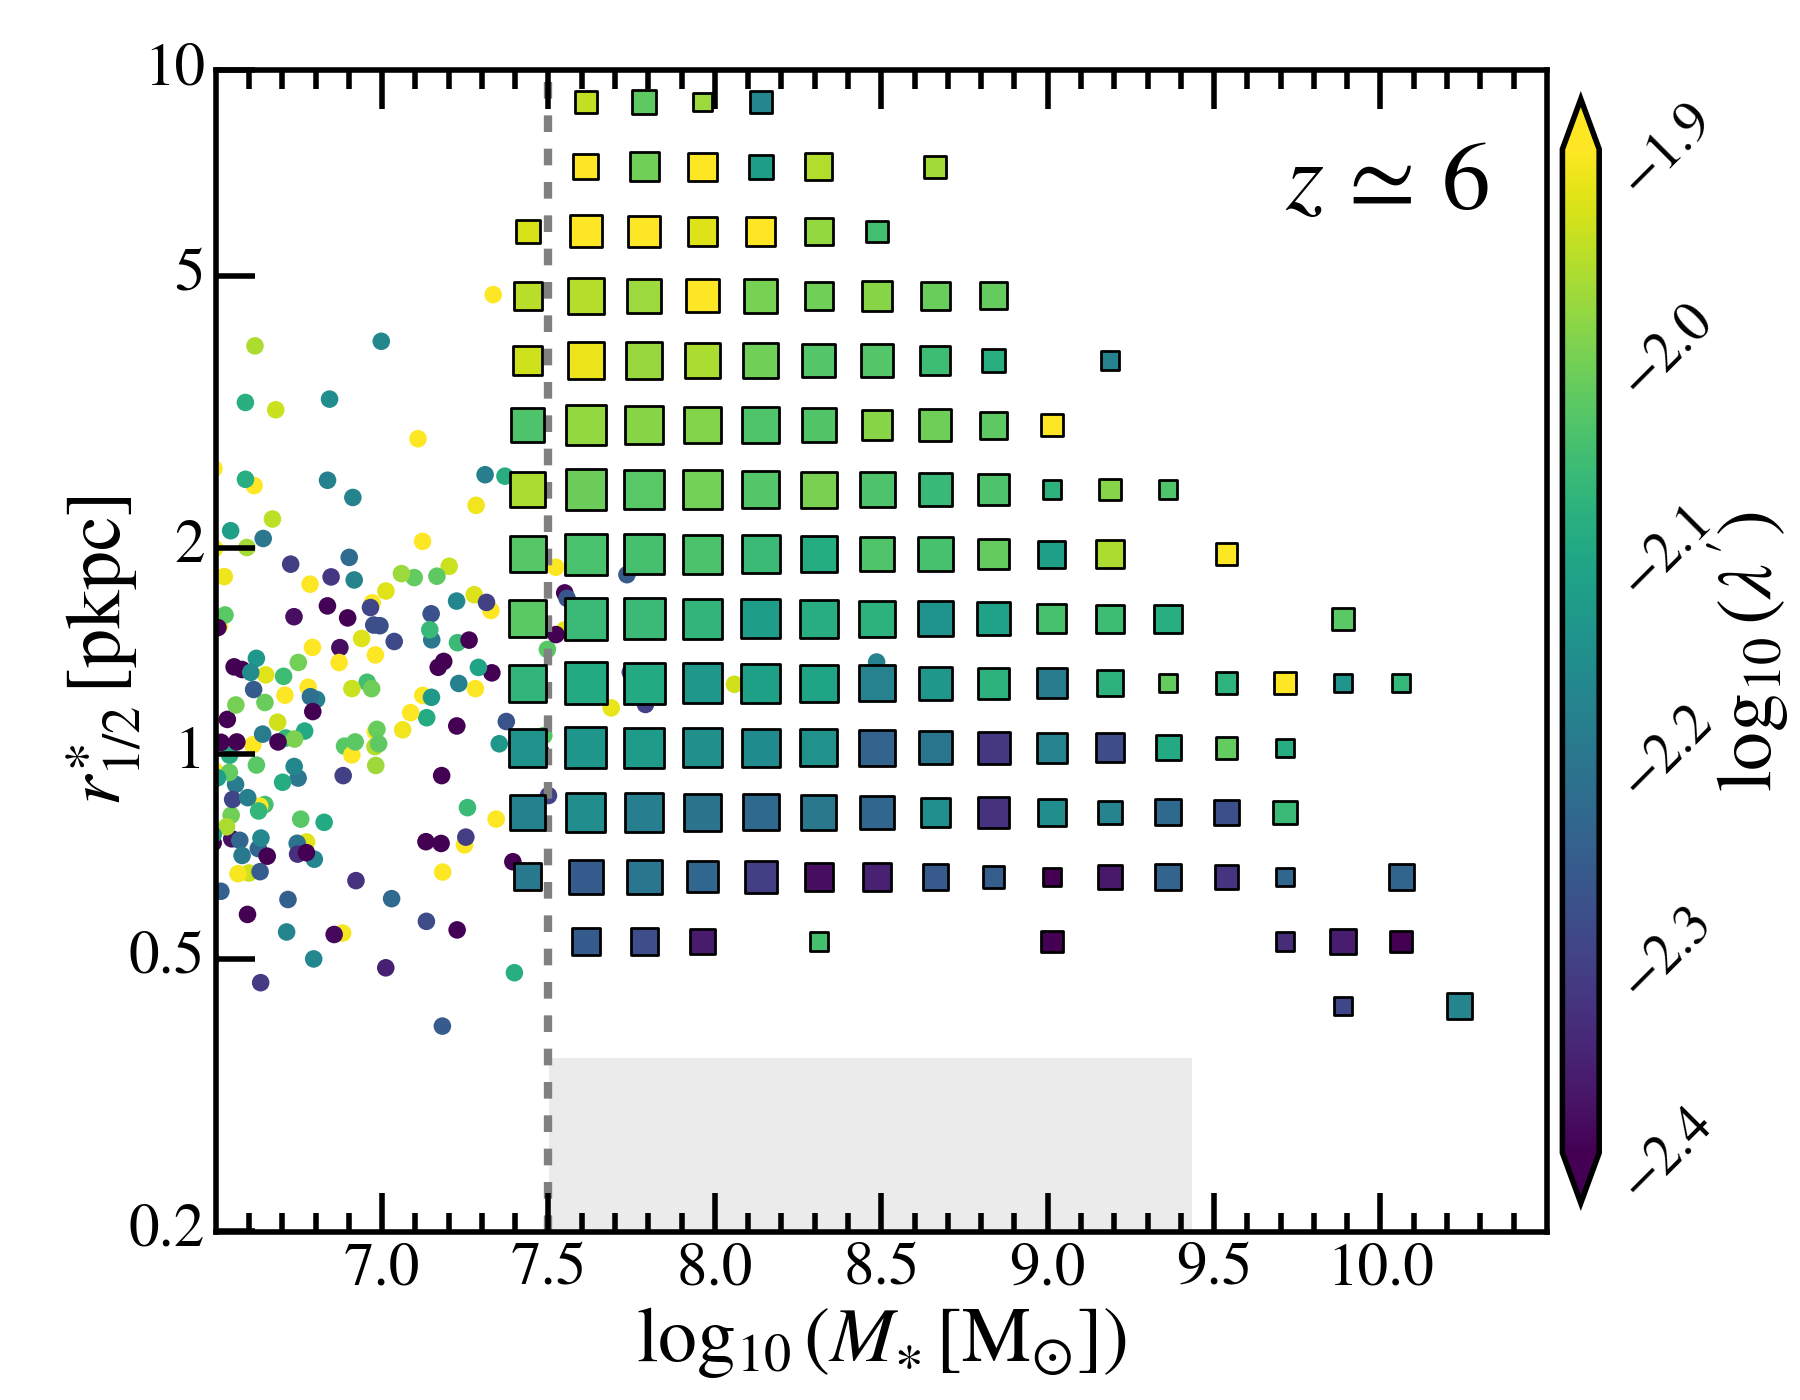
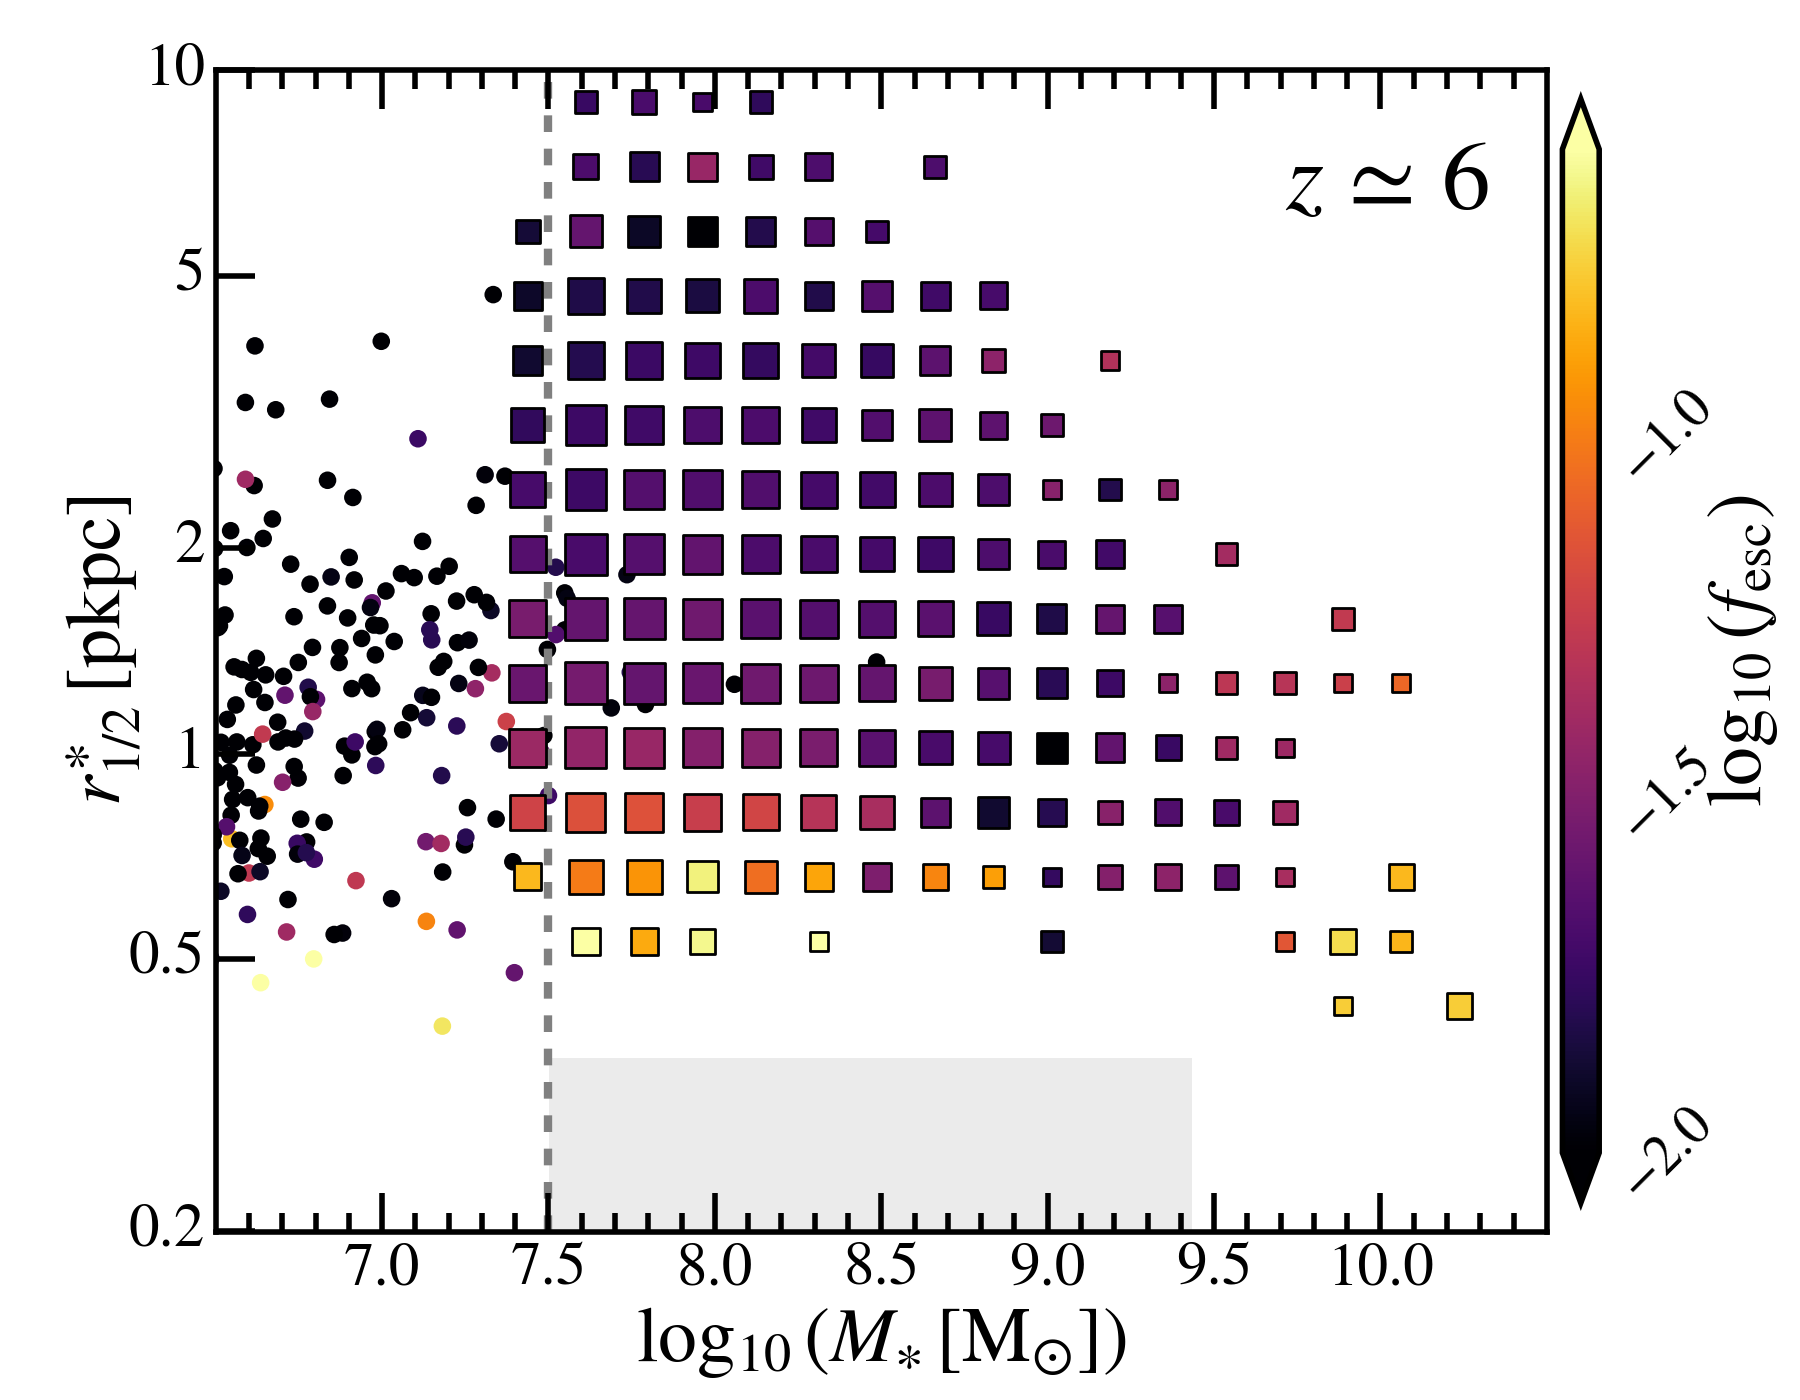
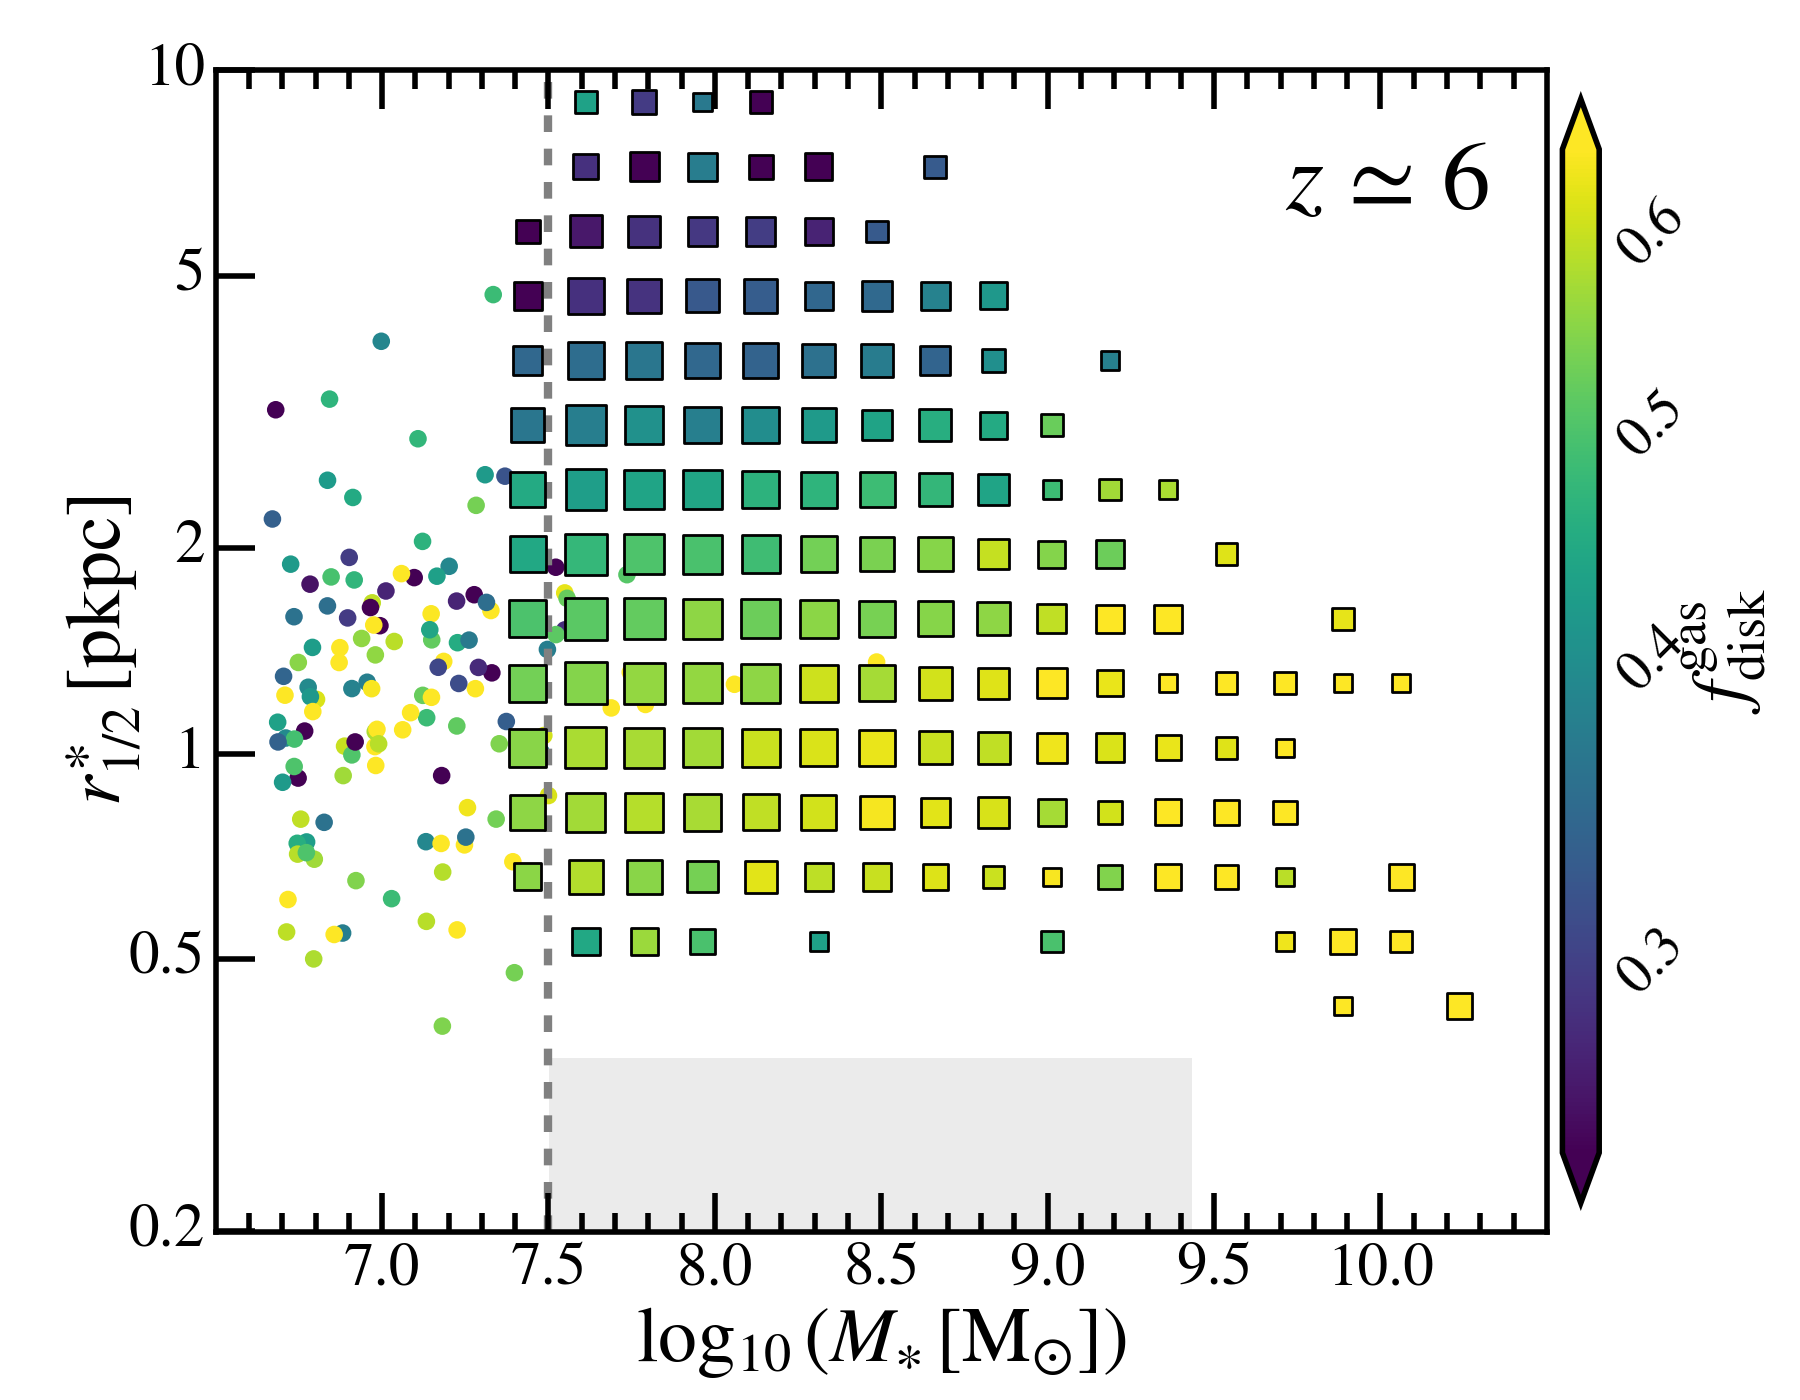
To understand the physical driver of galaxy size evolution found above, we will first check the correlation of with different galaxy properties. In Figure 5, we show the intrinsic size–mass relation of galaxies at in the thesan simulations. The sizes of the square markers are proportional to the logarithm of galaxy number densities in the size–mass plane. The colors map various galaxy properties, including (1) the relative positions of galaxies to the SFMS (top left), (2) the accretion rates of SMBHs normalized by galaxy SFR (top right), (3) the halo gas fraction normalized by the universal baryon fraction (; middle left), (4) the halo spin (middle right), (5) the Lyman continuum escape fraction (; bottom left), and (6) the gas disk fraction (bottom right). We remind the readers about definitions of relevant galaxy properties provided in Table 2. In addition to them, is defined as the ratio between the number of ionizing photons that escape and are intrinsically emitted from all sources within the virial radius. This is calculated using the method outlined in Yeh et al. (2023).
In the top left panel, we find that galaxies at fixed stellar mass below the SFMS tend to be more compact than the ones above the SFMS. The extreme version of this is the compact quenched galaxies at the massive end, which appear smoothly connected to the compact star-forming population. Similar trends are found at redshift up to . This indicates a potential casual correlation between compaction and quenching of galaxies. This is supported by the trends in the middle left panel, where compact galaxies show lower halo gas mass fractions. In one way, the compact sizes of galaxies could be driven by concentrated starbursts from rapid gas inflow and depletion. Meanwhile, the stellar and AGN feedback associated with the central starburst can drive gas outflows that further decrease the gas abundance and eventually lead to the quenching of galaxies. The causal connection of these signatures will be explored in Section 5 below.
In the top right panel, we find that compact galaxies at tend to have larger SMBH accretion rates with respect to the galaxy SFR. The SMBH accretion and the concentrated starburst are likely sustained by the same gas inflow towards the centre of the galaxies. We will show a clear relationship between compaction and the ignition of AGN activity in Section 5.1 below.
In the middle right panel, we find that galaxy sizes show a positive correlation with halo spin, which is expected from the classical disk formation theory (e.g. Mo et al., 1998). The role of halo spin in determining galaxy size will be investigated in detail in Section 4.4 below. As supporting evidence, in the bottom right panel, we find massive and compact galaxies display prominent disk morphology with more than half of their gas content in a co-rotating component (in terms of angular momentum alignment and within the aperture as defined in Table 2). More massive and more compact galaxies tend to have higher gas disk fractions. A similar trend exists also for the disk fraction of the stellar component. These findings are qualitatively consistent with the picture of disk instability-driven compaction, as will be discussed in Section 5.3.
In the bottom left panel, we find that the most compact galaxies tend to have orders of magnitude higher Lyman continuum escape fractions than extended galaxies at the same stellar mass. This is consistent with earlier findings in simulations that the gas outflow driven by concentrated starbursts can leave young massive stars (temporarily) transparent to neutral gas absorption and act as the main channel of ionizing photon escape (e.g. Smith et al., 2019; Ma et al., 2020; Barrow et al., 2020; Rosdahl et al., 2022).
4.3 Correlation of size with environments
With the on-the-fly radiative transfer method, the thesan simulations can self-consistently track the ionization states of the intergalactic medium around galaxies and enable detailed studies of the relationship between galaxy formation and large-scale environments (e.g. Borrow et al., 2022; Garaldi et al., 2022). We utilize the so-called Cartesian outputs of the thesan simulations (Kannan et al., 2022a; Garaldi et al., 2023) at , which save a subset of gas/dark matter properties on a 3D Cartesian grid. This includes the total matter overdensity () and the redshift of reionization (), calculated following the method described in Garaldi et al. (2022); Neyer et al. (2023) and Zhao et al. 2024 in prep.. For each halo, we define as the latest time at which the (mass-weighted) ionized fraction of the gas in the closest grid cell exceeds the threshold value . For matter overdensity, we take the grid resolution of (cell size ). For , we take the grid resolution of (cell size ). We take a smoothing length of for relevant fields. The results have no significant dependence on the choice of grid resolution or smoothing length.
In Figure 6, we show the size–mass relation at color-coded by variables related to the environment in which galaxies reside. In the top panel, we show the dependence on the local matter overdensity (normalized by the mean in each stellar mass bin to remove the leading-order stellar mass dependence). In general, at fixed stellar mass, more compact galaxies are more likely to be found in underdense regions. This suggests that the compaction of galaxies should be driven by internal processes rather than external perturbations, such as tidal torques and mergers. Meanwhile, the low-mass diffuse galaxies preferentially stay in overdense regions. In this case, mergers could play an important role as supported by the larger gas fractions and perturbed morphology of these galaxies as seen in Figure 5. The exception is the population of extremely compact galaxies at , which resides in extremely overdense regions. As shown in Figure 20, these galaxies are mostly satellite galaxies and are likely affected by the tidal fields and ram pressure of their hosts.
In the bottom panel, we show the dependence on the redshift of reionization of gas in the environment (with respect to the mean at the mass scale). At , the gas around more compact galaxies tends to experience earlier reionization. This is consistent with the relatively underdense regions they reside in. Low-density regions are more likely affected by growing ionized bubbles and experience an outside-in reionization. Higher-density regions, although typically containing more ionizing sources, are more difficult to ionize due to their initially higher neutral gas density (Neyer et al., 2023). This trend diminishes at the massive end as galaxies experience inside-out reionization (Garaldi et al., 2022) and are the centres of ionized bubbles.
As a summary of the size correlations, in Table 3, we present the Pearson and Spearman rank-order correlation coefficient between and the galaxy or environmental properties discussed above. We perform the measurements around two stellar masses and . Out of all the variables considered, the gas fraction has the strongest correlation with galaxy size, followed by halo spin, sSFR, and gas disk fraction. The overdensity shows a strong correlation only at the massive end because of the tip of compact satellite galaxies at the low-mass end. These correlations suggest that (1) a causal connection could exist between compaction, gas depletion, and quenching, (2) external perturbations are likely not the driver for compact but instead generally make galaxies puffier, (3) internal processes related to the disk morphology are likely the trigger of compaction. These aspects will be discussed in more detail in Section 5.
| Properties | |||||
|---|---|---|---|---|---|
| Galaxy: | |||||
| 0.689 | 0.756 | 0.451 | 0.597 | Figure 5 | |
| 0.347 | 0.393 | 0.289 | 0.298 | Figure 5 | |
| 0.366 | 0.388 | 0.269 | 0.285 | Figure 5 | |
| Figure 5 | |||||
| Figure 5 | |||||
| 0.238 | 0.265 | Figure 5 | |||
| Environment: | |||||
| 0.291 | 0.391 | 0.030 | 0.208 | Figure 6 | |
| -0.256 | -0.255 | -0.105 | -0.210 | Figure 6 |
4.4 Compare to analytical model predictions
4.4.1 Disk formation theory
The correlation of galaxy size with halo spin we see in Figure 5 is expected from the classical theory of disk formation (e.g. Mo et al., 1998; Kravtsov, 2013). In this theory, the half-mass radius of the stellar disk is predicted to be
| (1) |
where is the scale length of the exponential disk, () is the angular momentum (mass) ratio of the stellar disk with respect to the host halo, and are functions defined in Mo et al. (1998), and the virial radius of a halo has been defined in Table 2. We also note the difference between the two definitions of spin ( and ) as discussed in Table 2. If we assumed that the baryons and dark matter initially share the same distribution of specific angular momentum (Fall & Efstathiou, 1980) and the disk formation process conserves the angular momentum (Mestel, 1963) (i.e. ), the disk size will be mainly determined by the DM halo properties. In practice, the disk mass fraction , which enters , has little impact on the disk size. The halo concentration also has a mild influence on galaxy size. According to the canonical halo mass-concentration relations (e.g. Wechsler et al., 2002; Dutton & Macciò, 2014; Diemer & Joyce, 2019), high-redshift haloes have at with a weak dependence on halo mass. On the other hand, the halo spin parameter was thought to be the dominant factor for disk sizes (e.g. Somerville et al., 2008; Guo et al., 2011; Benson, 2012; Somerville et al., 2018).
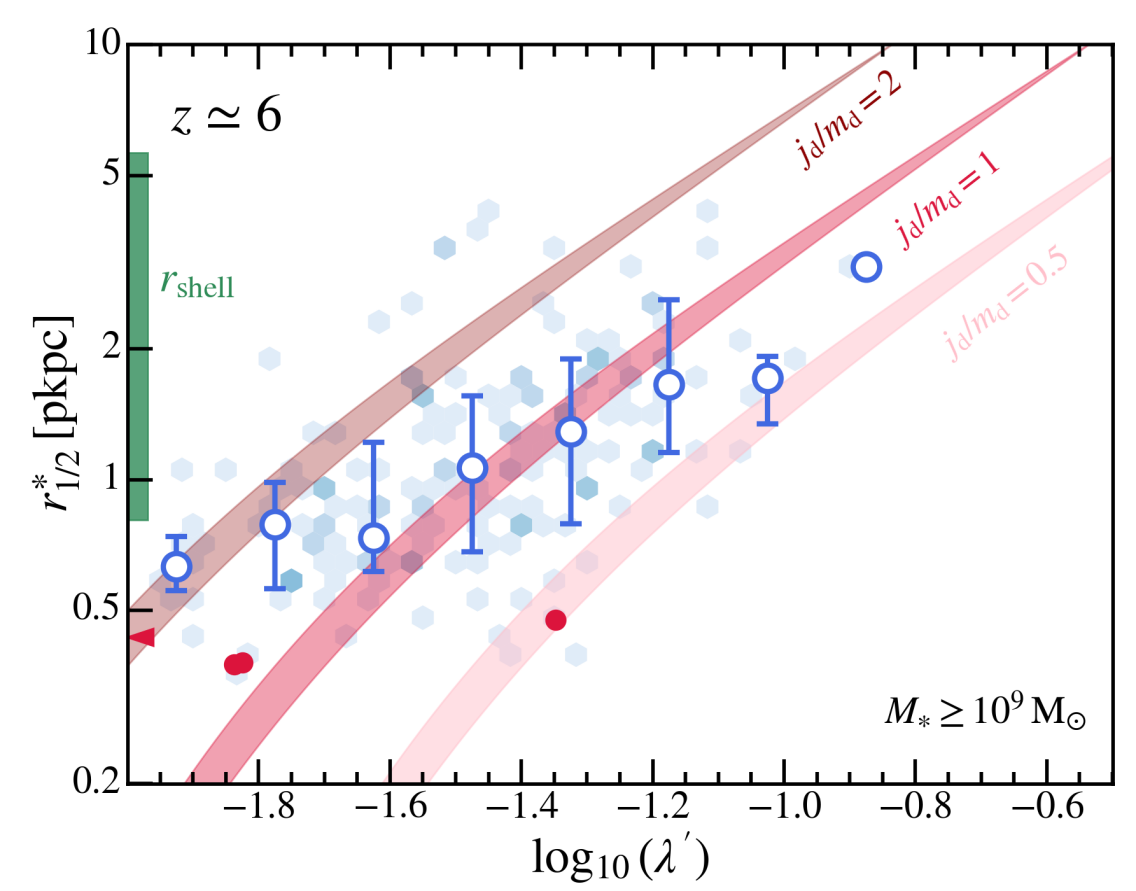
To quantitatively compare galaxy sizes in the thesan simulations with the disk formation theory predictions, in Figure 7, we show versus halo spin (as defined in Table 2) in different stellar mass bins in thesan-1. First, the spin parameter distribution from the simulation is consistent with previous studies using N-body simulations that follows a log-normal distribution with median value and 1- scatter dex (e.g. Bullock et al., 2001; van den Bosch et al., 2002; Macciò et al., 2007). We also show the predicted from disk formation theory, given the median halo mass of galaxies in the stellar mass bin and assuming in the range , or .
For galaxies with , they on the bulk agree with the disk formation model with conserved specific angular momentum (). Galaxies with lower halo spin have smaller sizes. However, we need to note that, within this mass range at fixed halo spin, more massive galaxies tend to have smaller sizes and agree better with model predictions with lower . This could be due to many non-adiabatic processes that can affect the angular momentum of gas fueling star-formation, which will be discussed in Section 5. The four compact quenched galaxies are typically hosted by low-spin haloes.
4.4.2 Spherical shell model
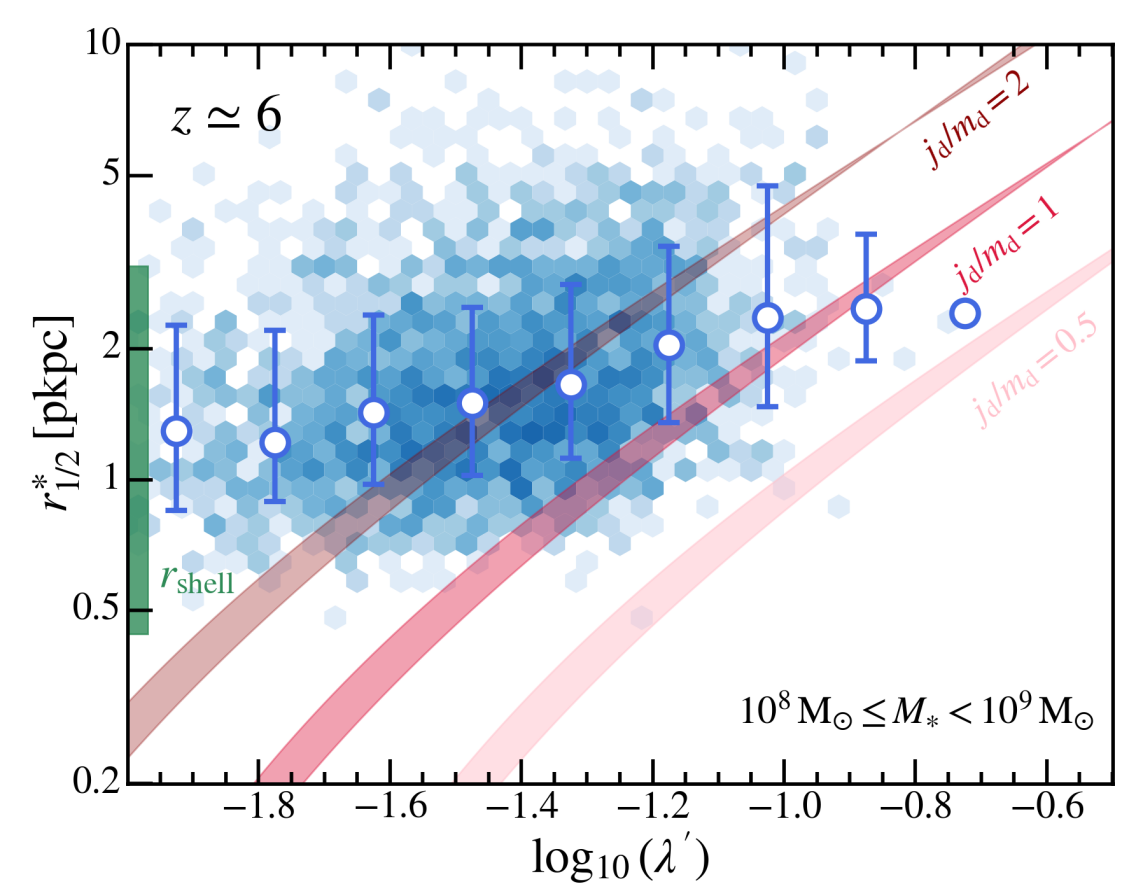
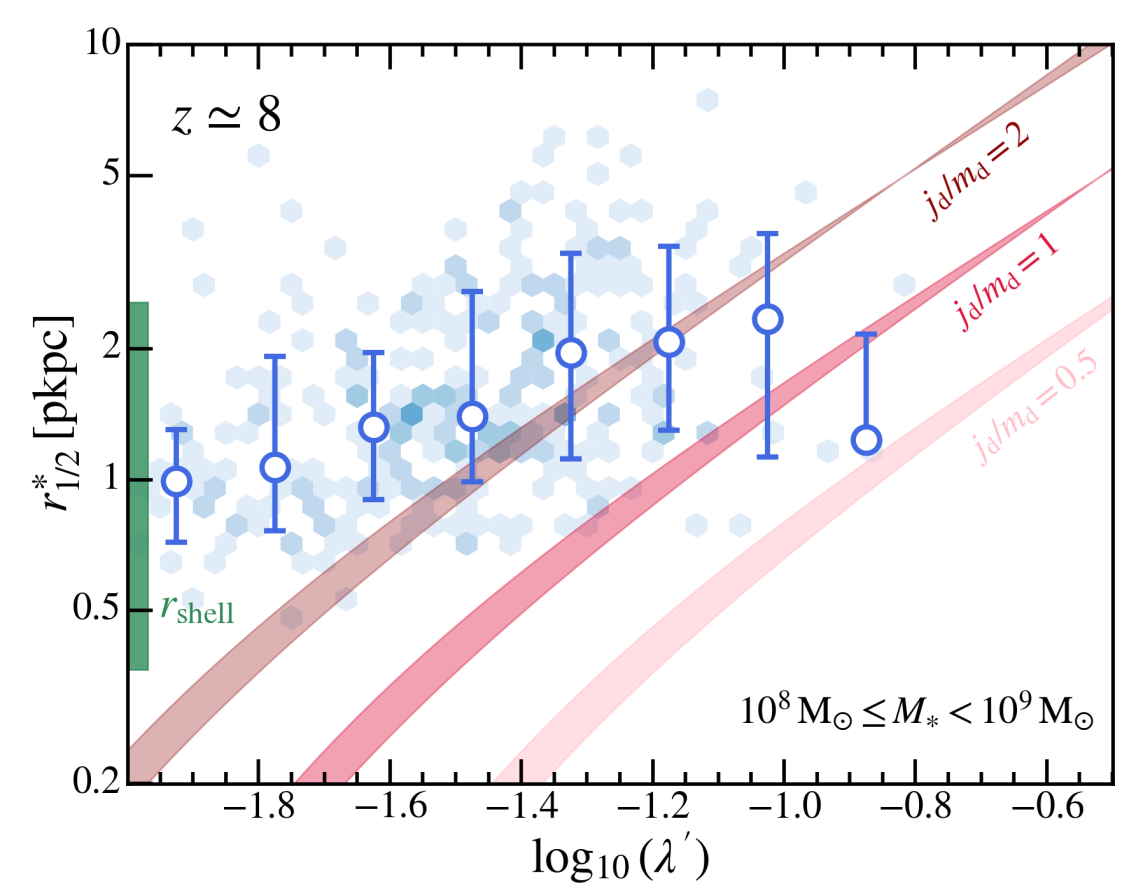
However, galaxies with lower stellar masses () display almost no dependence on in the low-spin end and only a mild positive dependence in the high-spin end. In the low-mass, low-spin haloes, the geometrical assumption of a stellar disk may break down in the first place. The morphology of the galaxy can be severely disturbed by more frequent mergers and stronger impact of feedback given the shallower potential well of early low-mass haloes (e.g. El-Badry et al., 2018; Jiang et al., 2019).
An alternative proxy for galaxy size is the radius where feedback-driven outflow encounters the cold gas inflow from CGM and creates a shock. This will be referred to as the spherical shell model. The balance of ram pressure at the shock radius gives (Dekel et al., 2023; Li et al., 2023)
| (2) |
where is the gas inflow velocity approximated as the halo virial velocity , is the inflow rate estimated to be (SFE is the galaxy-averaged star-formation efficiency, for which we take the empirical parameterization SFE() outlined in Shen et al. 2023). is the effective radius of accreting gas streams, which can be estimated as (Mandelker et al., 2018; Dekel et al., 2023)
| (3) |
where is the contraction factor between the gas stream and dark matter filament and we vary it between (Mandelker et al., 2018). is the wind velocity, which for the IllustrisTNG galaxy formation model adopted by the simulations, has an empirical dependence on halo mass as (Pillepich et al., 2018a)
| (4) |
where and . is the outflow rate and is related to SFR via the mass loading factor . In the IllustrisTNG model, at low-metallicities (),
| (5) |
where and are constants as defined in Pillepich et al. (2018a), is the number of core-collapse supernovae (SNII) per formed stellar mass, is the available energy per SNII.
In Figure 7, we show with the green band and the value agrees well with the size plateau reached by low-spin galaxies in the stellar mass bin at both and . At fixed halo mass, has no dependence on halo spin and only a mild dependence on redshift. This is consistent with the slow redshift evolution of galaxy sizes at the low-mass end we found in Section 4. Meanwhile, Equation 2-5 imply that at fixed halo mass. This indicates the potentially strong influence of the feedback prescription on the sizes of low-mass galaxies. Since the wind prescription in the IllustrisTNG model adopted is tightly correlated with halo mass as well, this reduces to is qualitatively consistent with our findings that galaxy size correlates with their position relative to the main sequence.
5 Physical drivers of compact galaxy formation
5.1 Evolution of massive compact galaxies
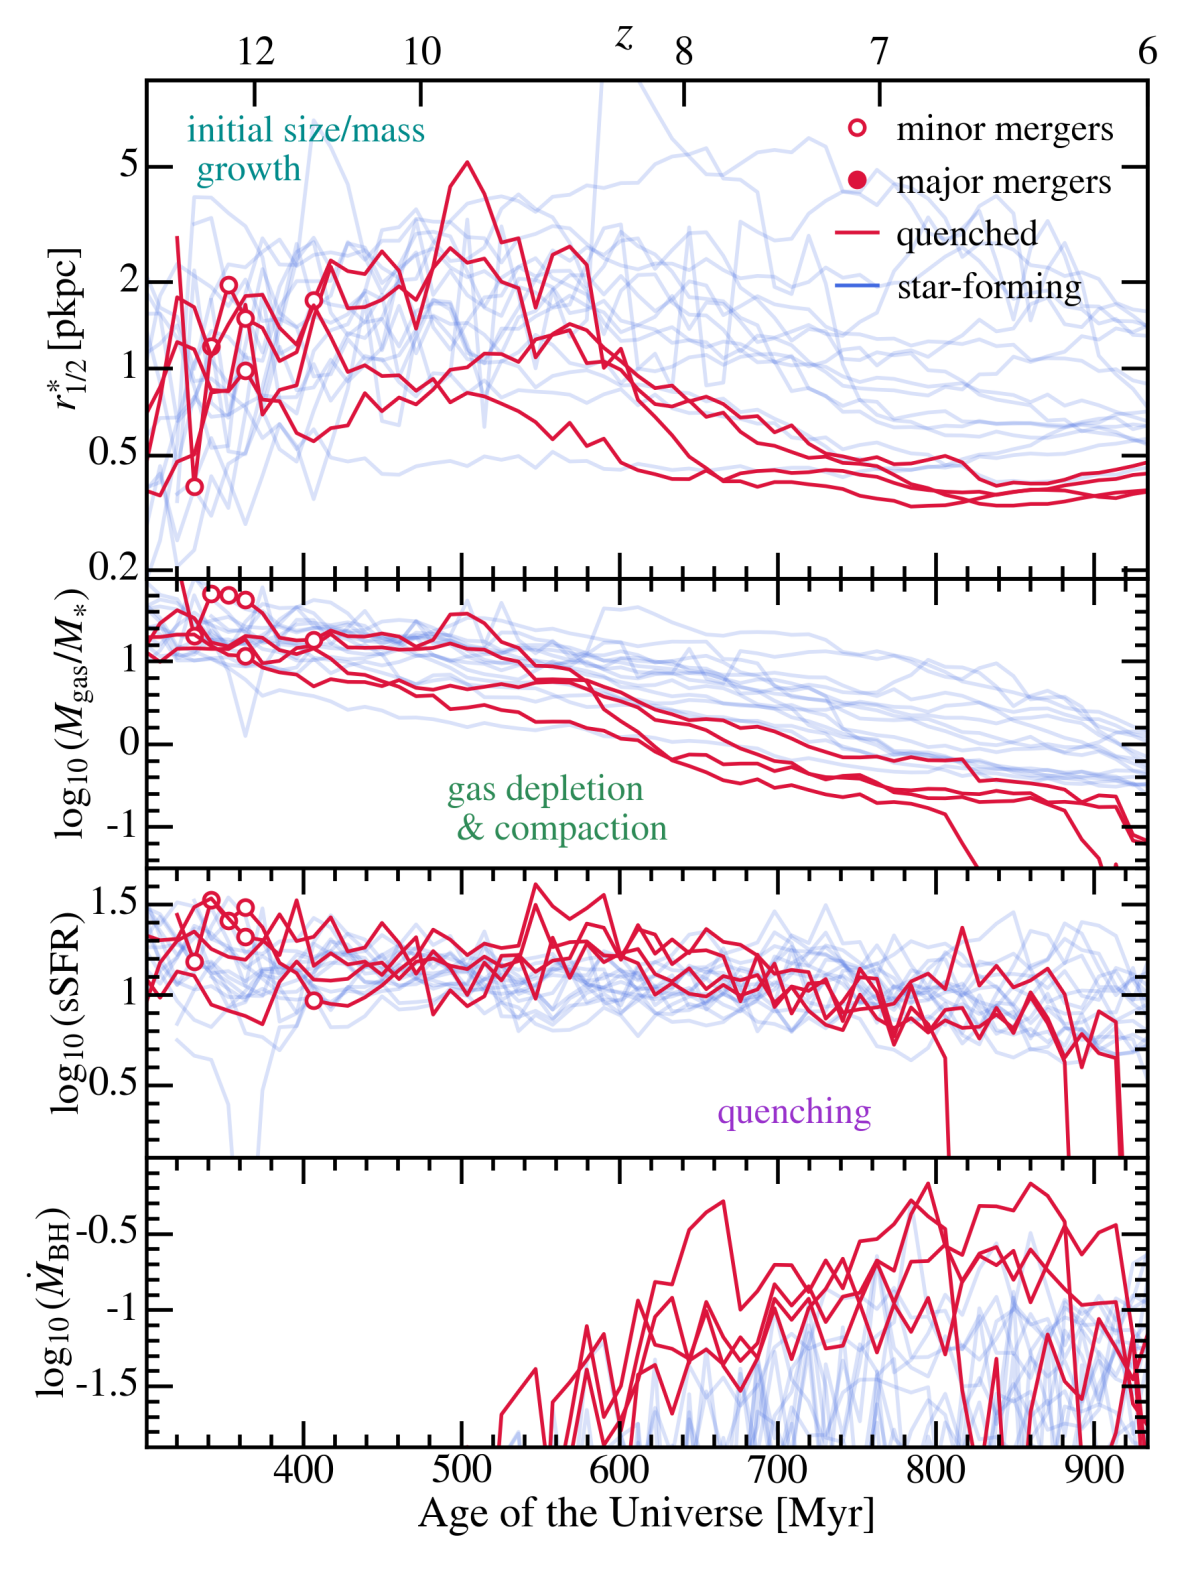
In this section, we explore the causal connections between galaxy sizes and various galaxy/environment properties found in previous sections. We will first investigate the most compact galaxies at the massive end and follow their evolution history. To achieve this, we subtract the main progenitor branches from the merger trees of galaxies constructed using the LHaloTree algorithm (described fully in the supplementary information of Springel, 2005). We track various galaxy properties and identify major (minor) mergers with a merging halo mass ratio threshold of (). The analysis here focuses on massive well-resolved galaxies () with unambiguous merger histories. We classify these galaxies into three categories: extended () star-forming galaxies, compact () star-forming galaxies, and quenched galaxies (all turn out to be compact).
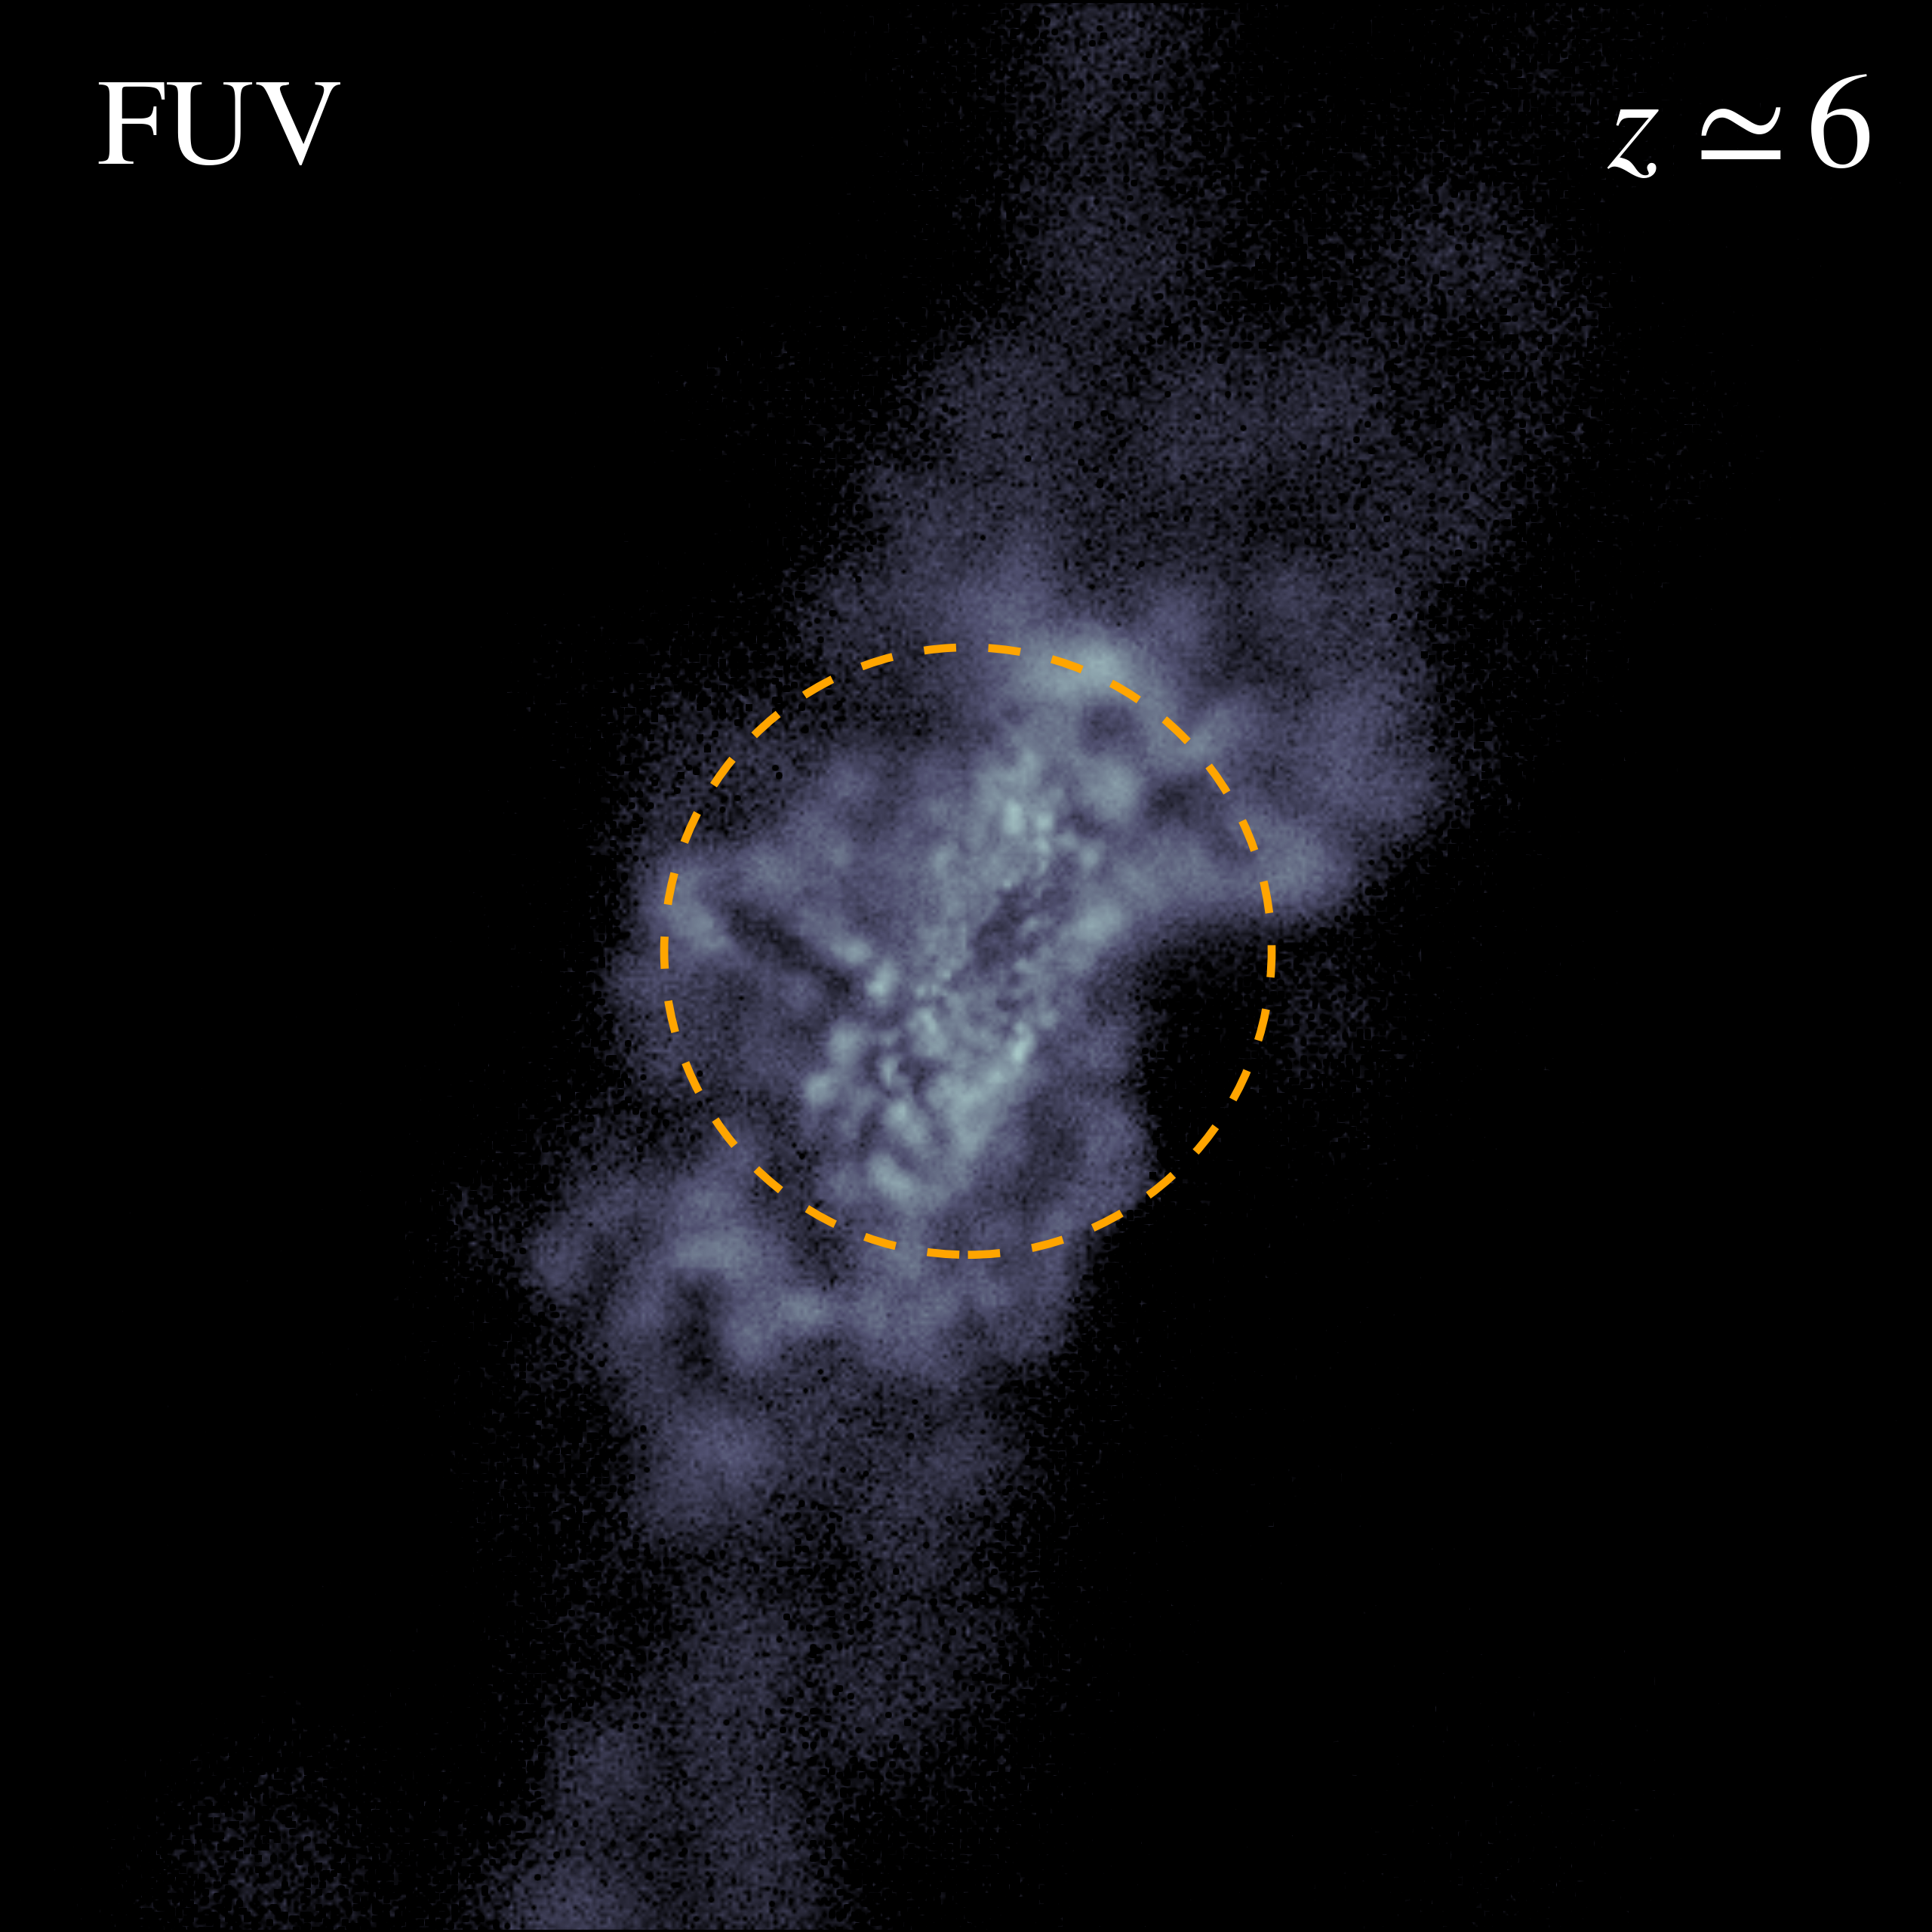
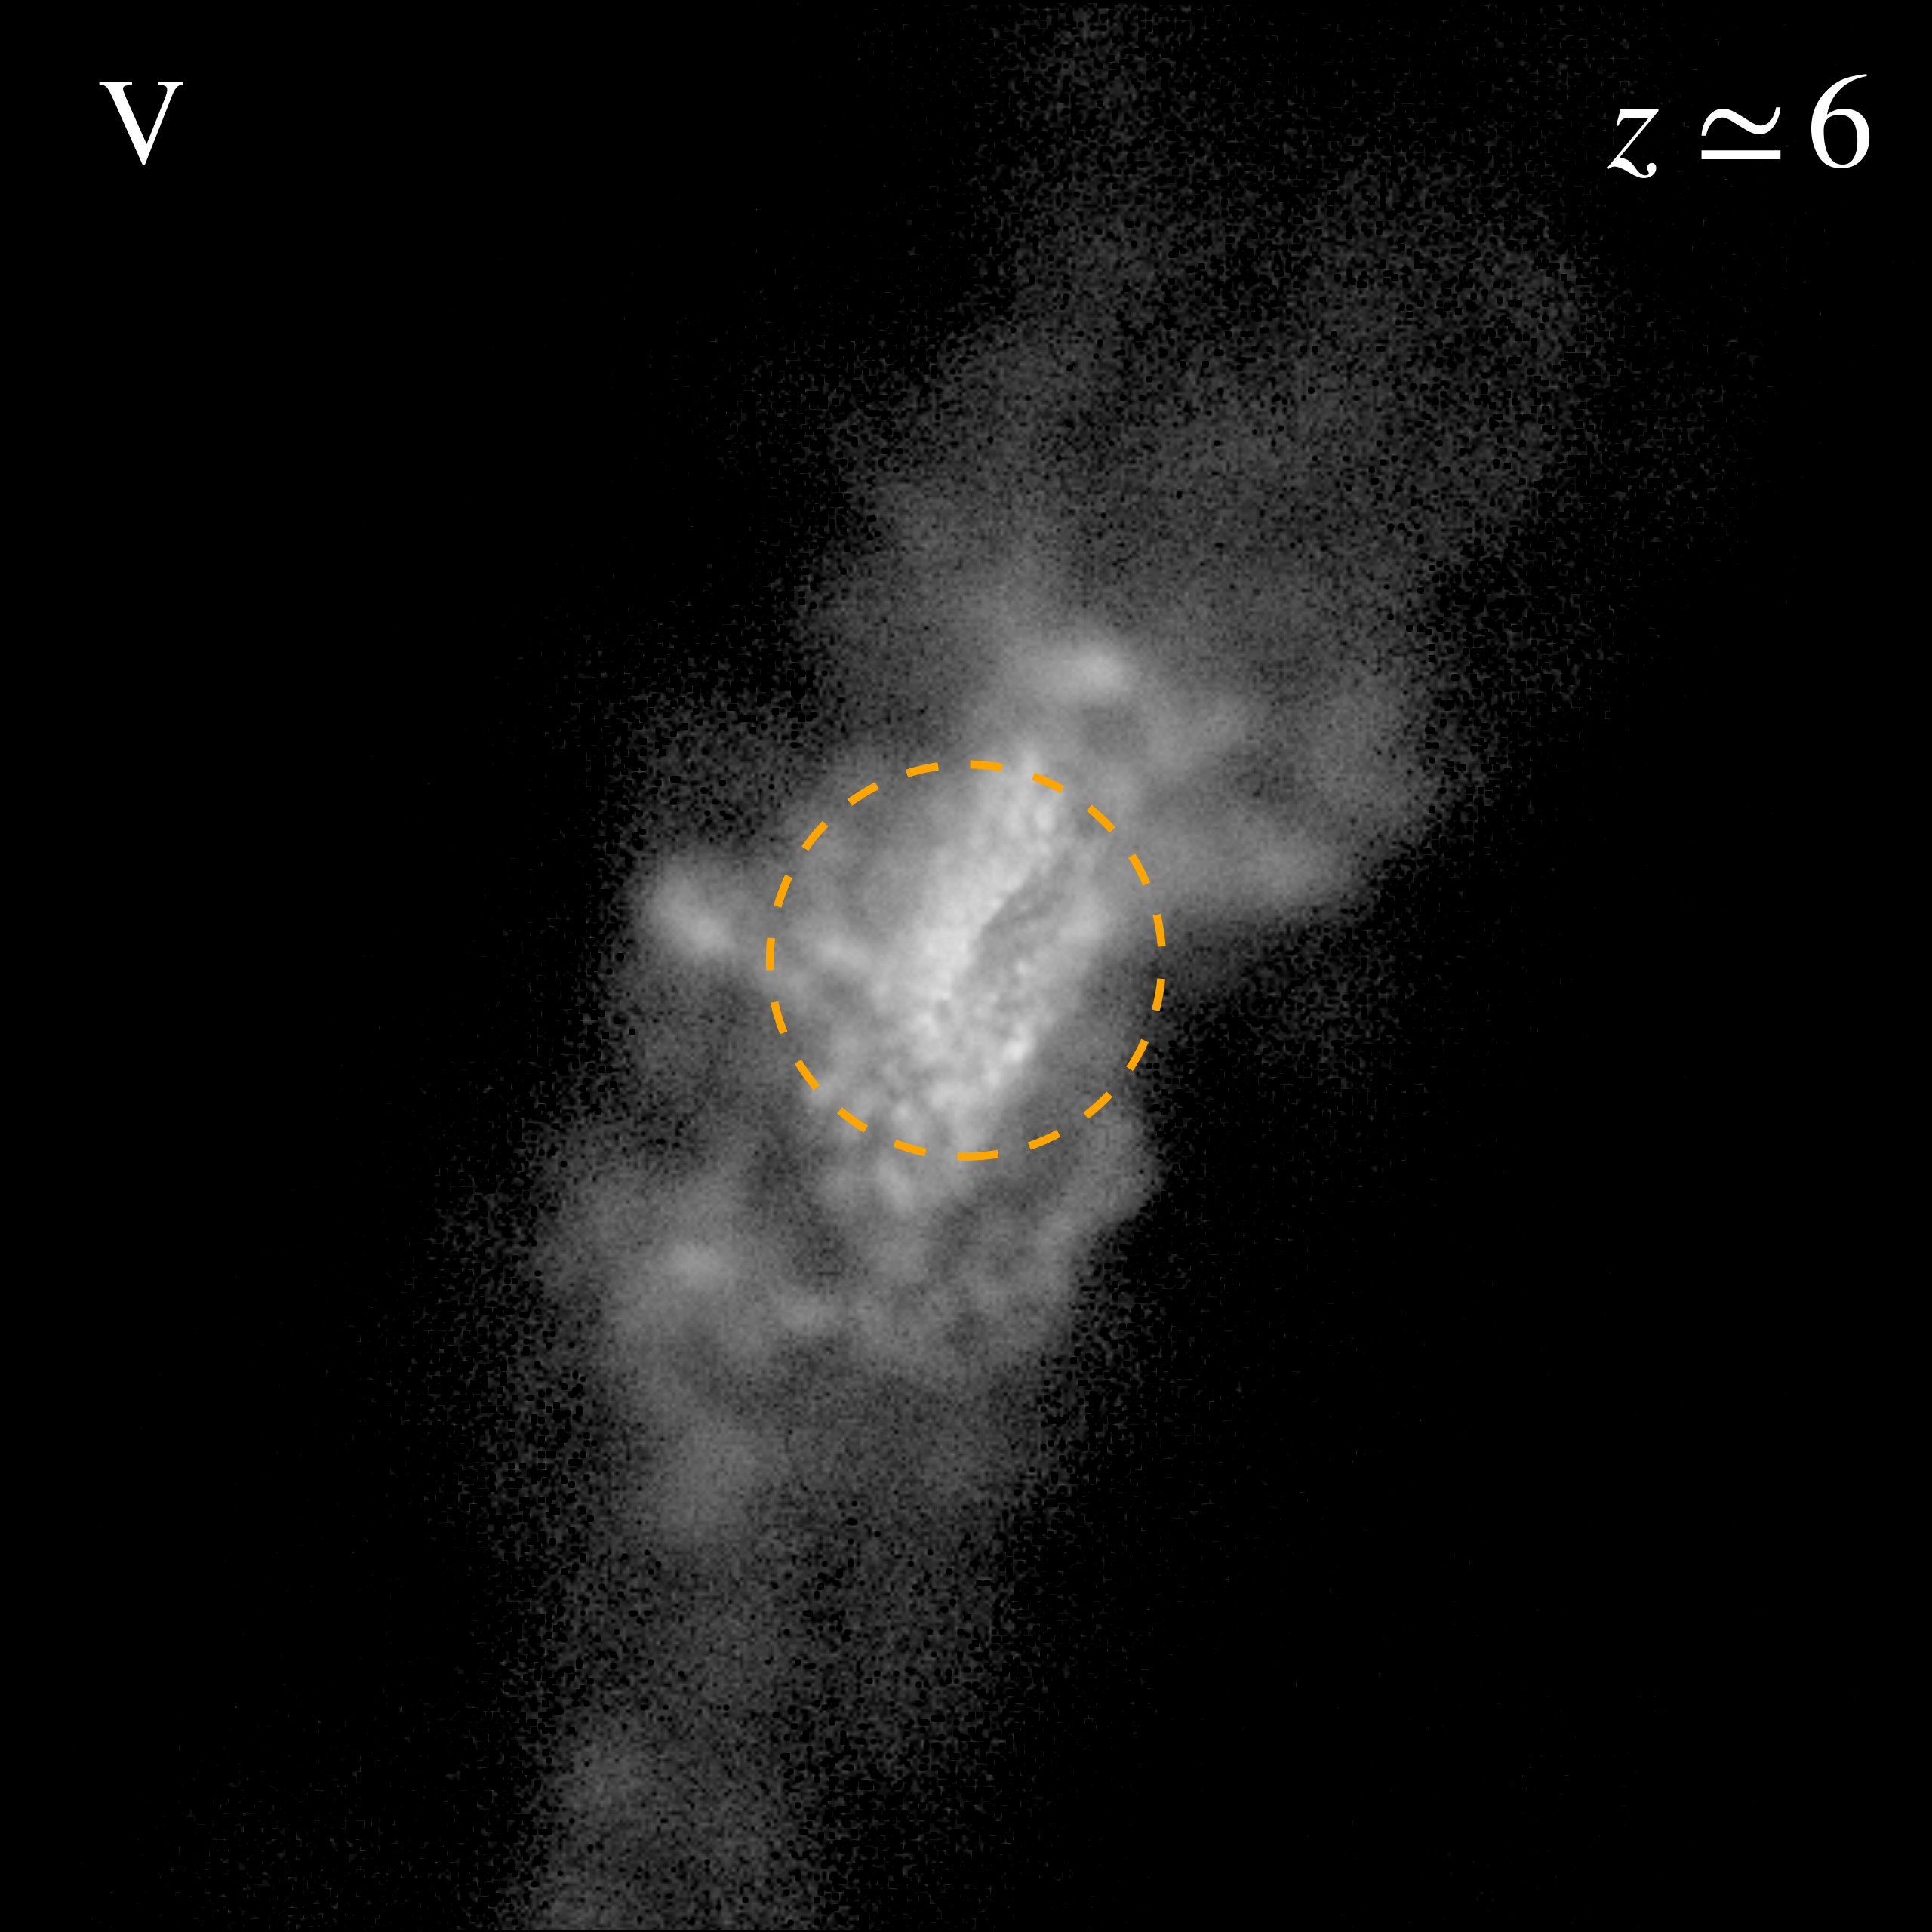
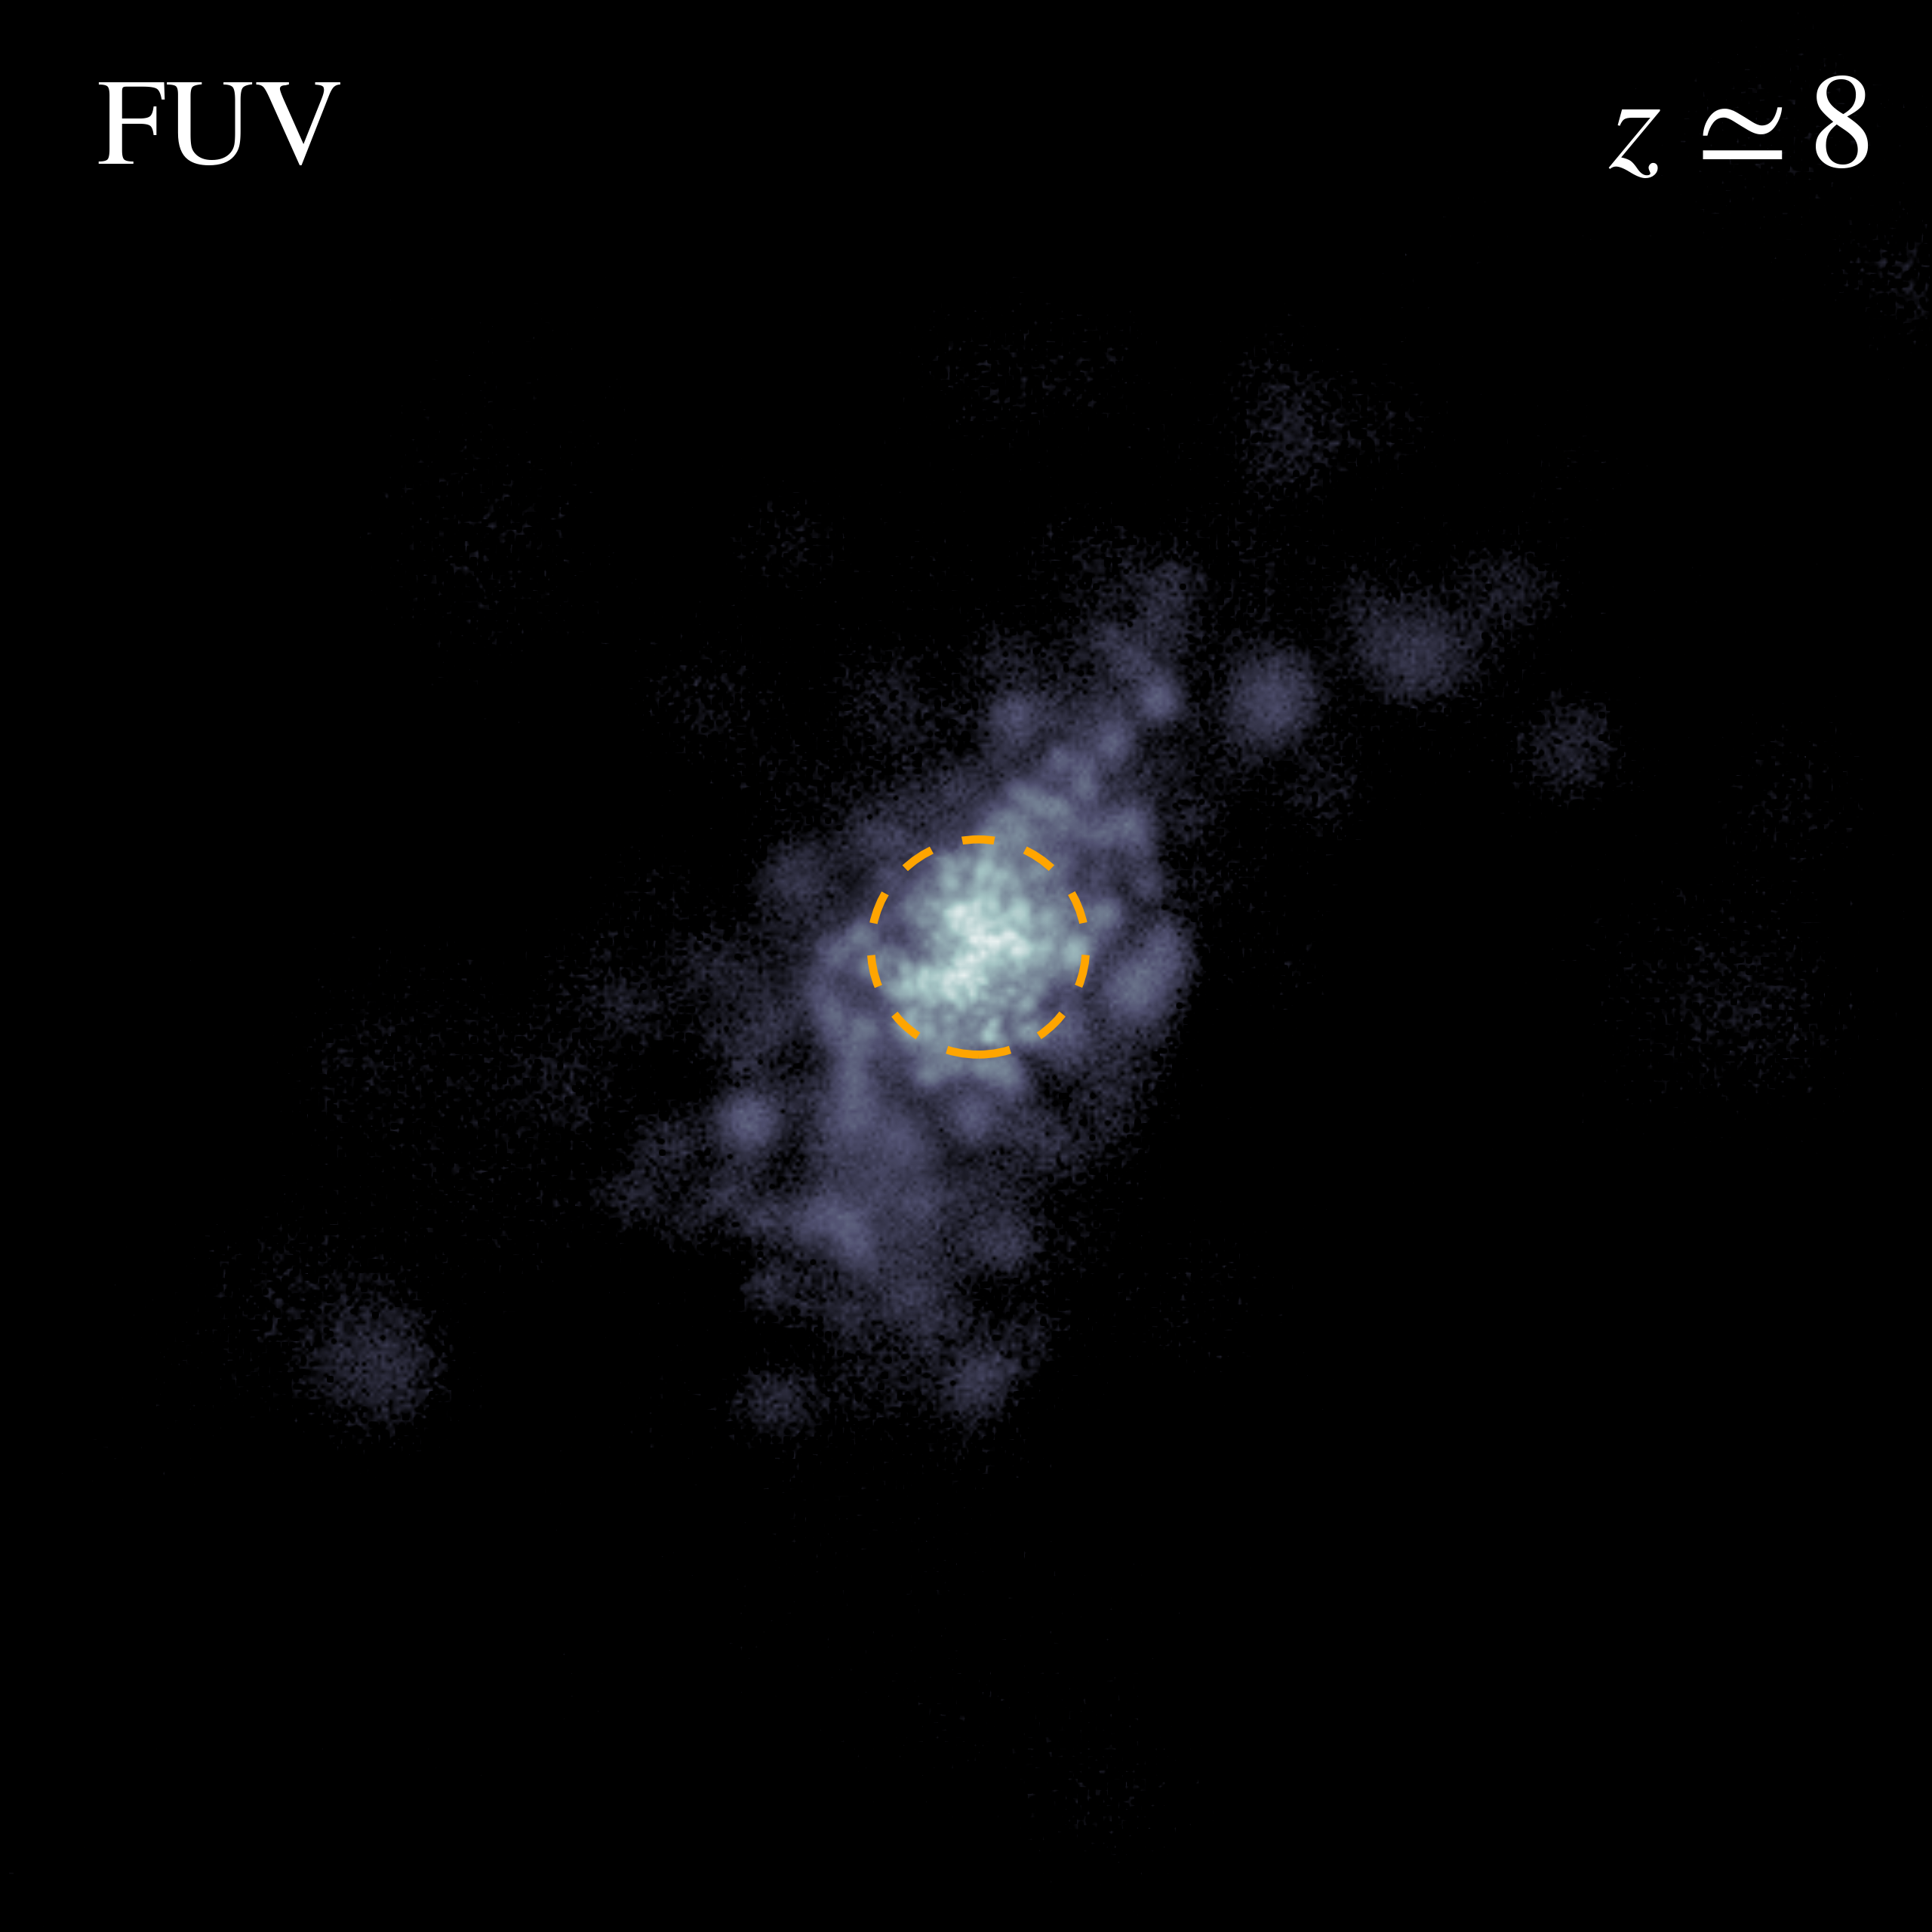
In the top panel of Figure 8, we show the time evolution of the sizes of four quenched galaxies selected at , compared to all the star-forming galaxies at a similar mass scale. In the bottom three panels, we show the time evolution of the galaxy gas abundance (normalized by stellar mass, ), sSFR, and SMBH accretion rates of the same galaxies, respectively. The major and minor mergers of the quenched galaxies are shown by solid and open circles. We identify three phases of the evolution of a compact quenched galaxy in the first Gyr of the universe. The later quenched population is initially indifferent from the star-forming galaxies with stellar mass and size growth dominated by minor mergers and smooth accretion. During this epoch, the baryon content of the galaxies is dominated by gas and galaxies grow in a self-similar fashion maintaining a stable sSFR. In the second phase beginning around , rapid gas depletion and compaction of the stellar content happen at the same time in these later quenched galaxies. Right after compaction starts, the sSFRs of these galaxies rise temporarily compared to the normal star-forming counterparts followed by a mild decline. During this phase, SMBH accretion gets activated at the same time as concentrated star-formation happens. None of these phenomena are associated with major or minor merger events, suggesting internal processes dominating the size evolution. In the final phase, the sSFR drops in quenched galaxies in an extremely short time scale () and so does the SMBH accretion. The gas is completely depleted and the sizes of these quenched galaxies stabilize at later on.
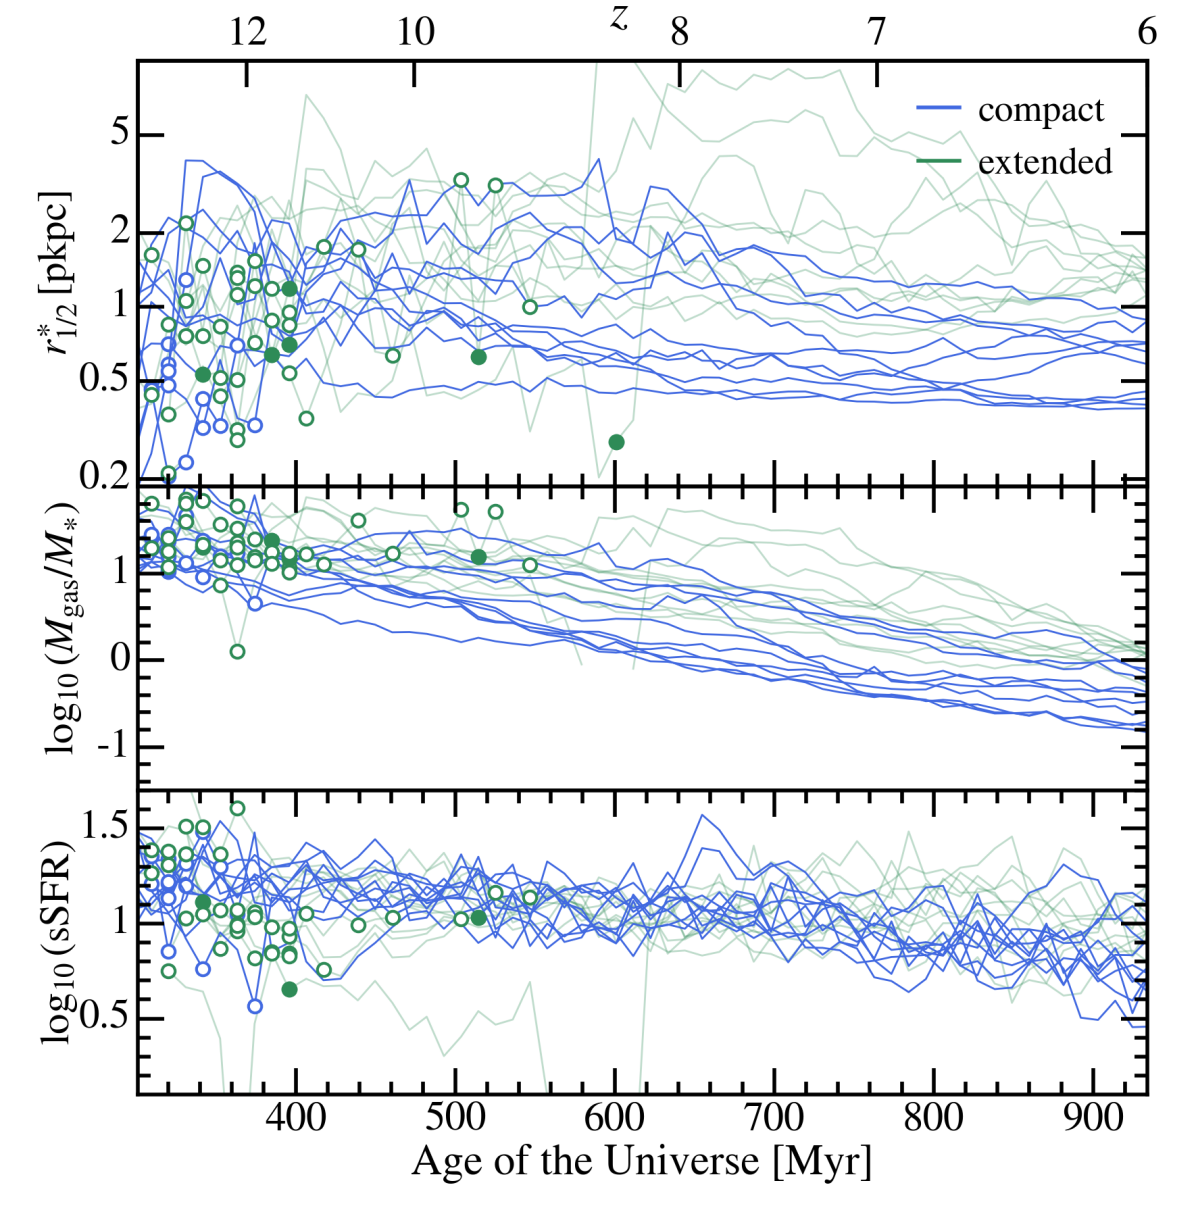
In Figure 9, we show the same type of evolution history for the star-forming galaxies at , divided into compact and extended populations. Within the star-forming galaxies, we find a distinction between the compact and the extended populations and the trend is similar to what we found for quenched and star-forming galaxies above. Starting around , the compact star-forming galaxies have comparably lower gas abundance as their sizes deviate from the extended population, followed by declined sSFRs later on. These findings are broadly consistent with the trends we found in Figure 5 that compact galaxies tend to have lower sSFR and gas abundance. These compact star-forming galaxies might have gone through a similar gas depletion and compaction process to the quenched population but to a milder extent or at shifted timings due to lower masses or higher spins. Compared to the extended ones, the compact star-forming galaxies also have quieter merger histories, which is consistent with the underdense environments they reside in as found in Figure 6. This again suggests that internal processes are responsible for the compaction of galaxies rather than external perturbations.
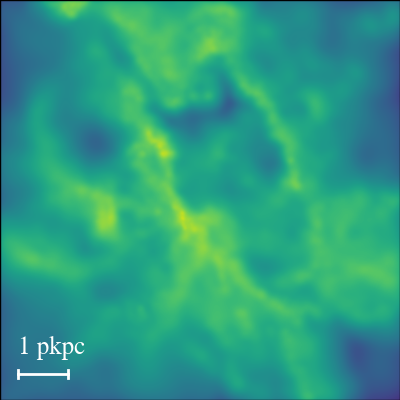
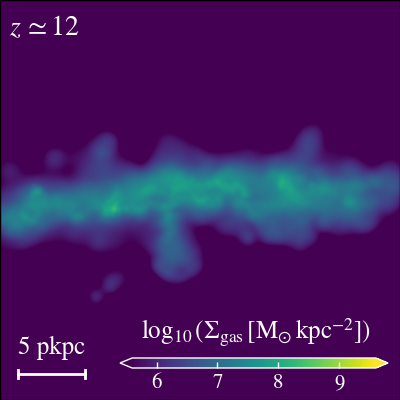
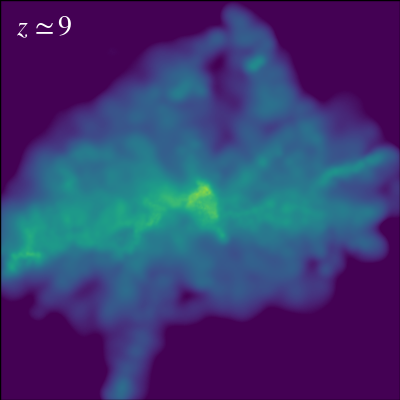
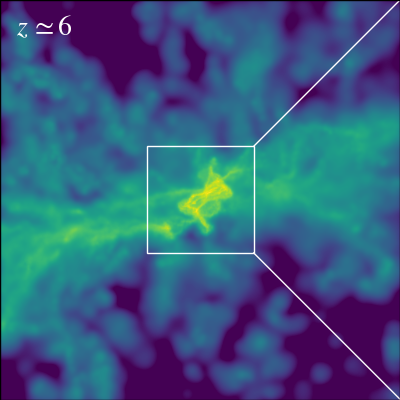
The rapid quenching of the few compact galaxies is likely driven by the rapid removal of cold gas reservoirs by stellar and AGN feedback. Evidences are shown in the gas images in Figure 11, where the central gas distribution of the quenched galaxy is disturbed and displays shock-like features. However, we are not able to disentangle the relative contribution of stellar and AGN feedback in quenching. In addition, the development of a compact bulge can help stabilize the disk instability and drive morphological quenching (e.g. Martig et al., 2009). However, this may not completely shut down star-formation in the entire galaxy but only prevents mass inflow and central starburst. Other external mechanisms for quenching will operate on longer time scales than we observe in these simulations. For example, a secular halo quenching can happen due to the development of a hot virialized inner CGM, which suppresses cold gas fueling the galaxy. These could be relevant for the mild decrease in sSFR in compact star-forming galaxies.
a quenched compact galaxy
a star-forming extended galaxy
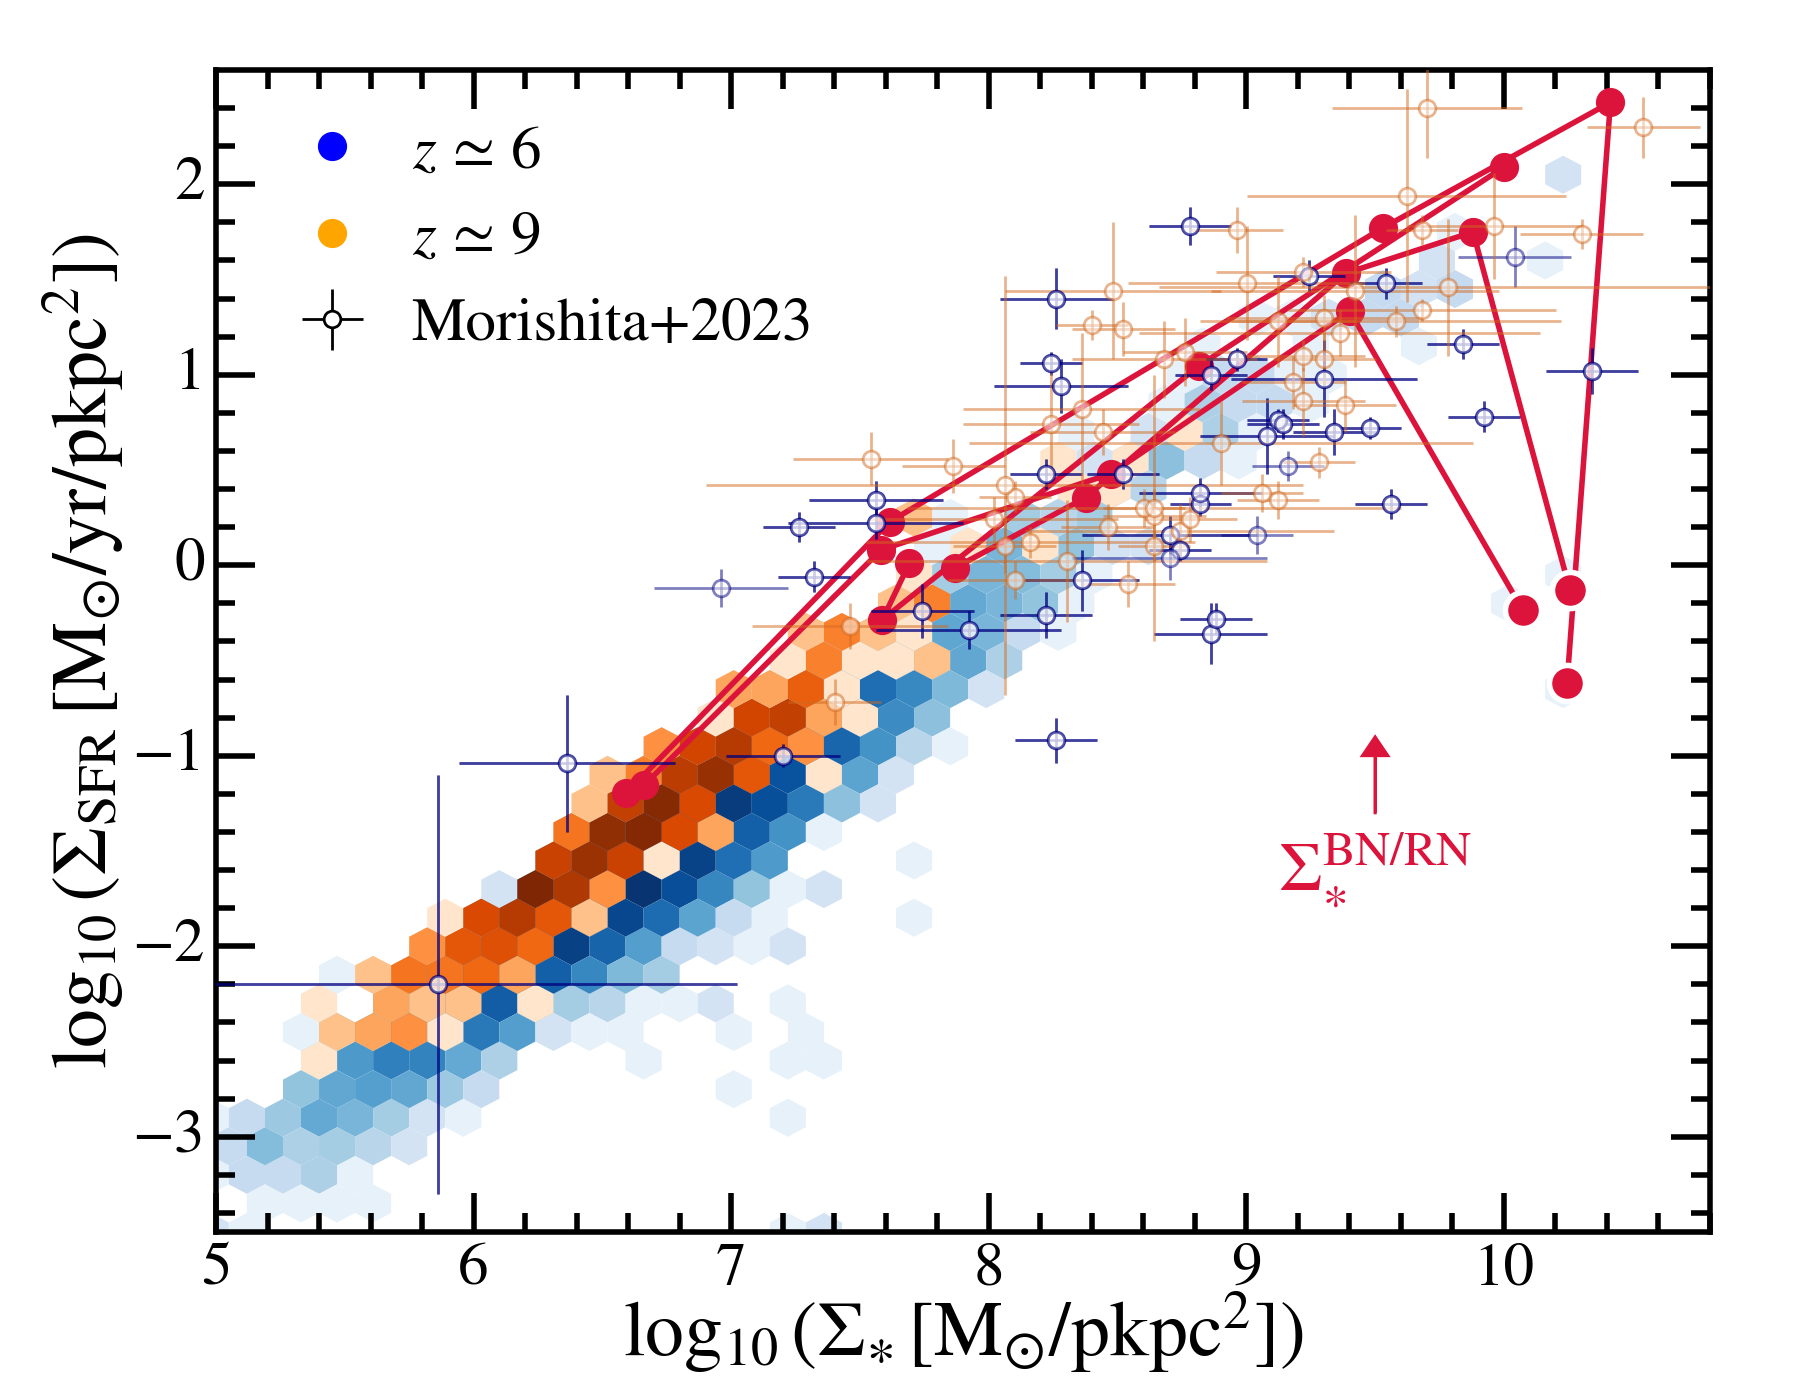
In Figure 10, we show the SFR surface density () versus stellar mass surface density () of galaxies in the thesan-1 simulation. They are compared to the observational constraints from JWST (Morishita et al., 2023). We highlight the evolution trajectories of the quenched galaxies from to . follows a tight correlation with with little redshift evolution and shows good agreement with the observed sample despite lower scatter. The later quenched galaxies grow their stellar mass following this correlation until reaching a stellar mass surface density threshold and become quenched afterward. This threshold is about , corresponding to . This threshold happens to be consistent with the compaction and quenching phases discussed extensively in literature for galaxies at cosmic noon (e.g. Dekel et al., 2009b; Dekel & Burkert, 2014; Zolotov et al., 2015; Tacchella et al., 2016; Lapiner et al., 2023) as well as the early proto-bulge formation found in observations (e.g. Baggen et al., 2023; Baker et al., 2023).
5.2 Gas angular momentum
To understand the physical reason for compaction, we need to start from the beginning when the gas fueling star-formation is accreted into the halo. The angular momentum of the gas has long been considered one of the most important factors for regulating galaxy sizes. We can gain insights into the time evolution of gas angular momentum by examining the specific angular momentum (or equivalently spin) profile of the halo.
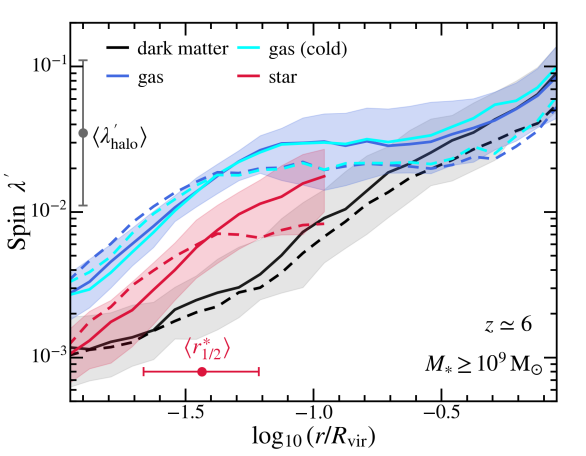
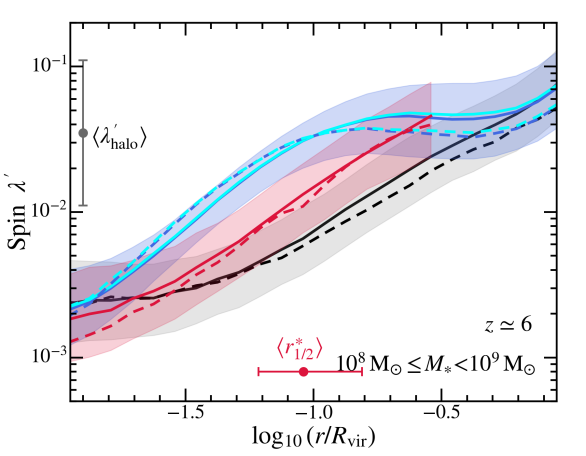
In Figure 12, we show the spin profile of galaxies in thesan-1 at grouped in two stellar mass bins. The spin of a particle species is defined as , where is the specific angular momentum of the corresponding particle species. This definition is chosen such that, for dark matter, it becomes equivalent to the halo spin defined in Table 2. Here we consider the spin profile of dark matter, stars (restricted to ), all gas, and specifically cold gas (). The spin of dark matter increases nearly linearly with radius and the central angular momentum has little correlation with the outskirts. Similar spin or specific angular momentum profiles have been found in previous cosmological -body simulations (e.g. Bullock et al., 2001; Bett et al., 2010) and is consistent with a toy model for halo buildup by tidal stripping of satellites as they spiral inward via dynamical friction (Bullock et al., 2001; Maller et al., 2002).
In the classical theory, haloes acquire angular momentum from the gravitational tidal torques exerted by neighbouring density perturbations (e.g. Hoyle, 1951; Peebles, 1969; Doroshkevich, 1970; White, 1984; Barnes & Efstathiou, 1987) and through mergers (e.g. Vitvitska et al., 2002; Maller et al., 2002). Baryons were expected to initially follow the dark matter mass distribution and share the same specific angular momentum distribution. This motivates the classical disk formation theory described in Section 4.4. In this picture, halo gas goes through a joint semi-spherical infall with dark matter from outside the halo before being heated to by a virial shock and becoming pressure-supported. The halo gas then cools down, contracts to the bottom of the halo potential while conserving angular momentum, and eventually forms a rotation-supported disk (e.g. Fall & Efstathiou, 1980; Mo et al., 1998; Bullock et al., 2001).
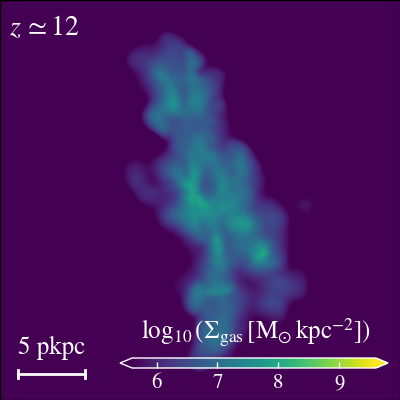
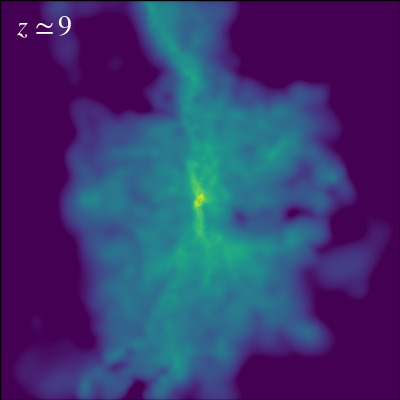
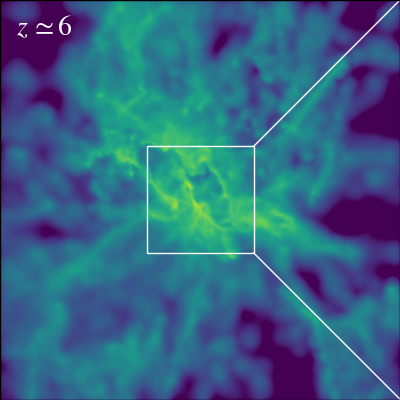
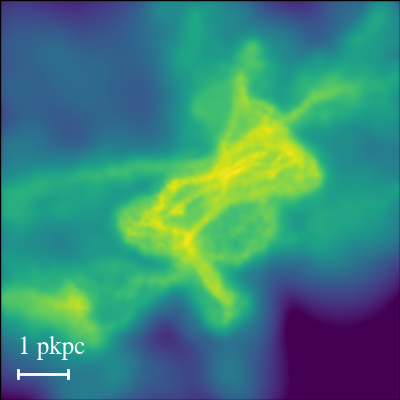
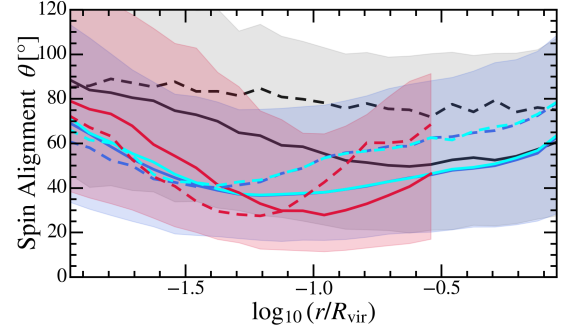
However, at high redshifts, halo gas accretion is dominated by the “cold mode” (e.g. Kereš et al., 2005; Dekel & Birnboim, 2006; Kereš et al., 2009; Dekel et al., 2009a; Wetzel & Nagai, 2015) driven by supersonic cold gas streams penetrating the halo directly to the central disk (often spatially associated with dark matter filaments) as well as gas clumps in merging subhaloes. The cold gas distribution shown in Figure 11 clearly demonstrates these features. Therefore, deviations of the specific angular momentum of gas and dark matter are expected (e.g. Kereš et al., 2009; Stewart et al., 2013; Nelson et al., 2015). At the outskirt of the halo (), the specific angular momentum of initially accreted cold gas can be larger than the dark matter due to stronger quadruple torques experienced by the gas (Danovich et al., 2015), but this difference will be weak at high redshifts. In the thesan simulations, we do find a small enhancement of the spin of cold gas compared to dark matter at the halo outskirts. Meanwhile, we also find that the gas spin is generally higher than that of the dark matter component at and often features a plateau-like feature until reaching . This is consistent with many earlier studies (e.g. Sharma & Steinmetz, 2005; Kimm et al., 2011; Danovich et al., 2015; Teklu et al., 2015). This is because the newly accreted cold gas has not yet mixed with the earlier accreted ones that have lower angular momentum and cluster in the central region due to cooling. The inflowing gas streams roughly conserve their angular momentum (Stewart et al., 2013; Danovich et al., 2015). The plateau of gas spin happens to be similar to the halo average spin even for the relatively compact population. This suggests that there is enough angular momentum and rotation support of accreted gas before reaching the vicinity of the galaxy, and it should be the physical processes within the galactic radius that drive the compaction of the stellar content.
In the messy region below the impact parameter of the streams, , tidal torques from the inner galactic structure as well as complex interactions of streams with other streams and feedback-driven outflows can substantially decrease the angular momentum of gas (e.g. Ceverino et al., 2010; Danovich et al., 2015; Nelson et al., 2015). Closer to the star-forming region, the spin of gas starts be aligned with the stellar disk. Further loss of gas angular momentum at smaller radii is driven by the disk instability (e.g. Dekel et al., 2009b; Dekel & Burkert, 2014, discussed later in Section 5.3). These processes together result in the decline of gas spin profile at small galactocentric radii, which can be substantially smaller than the overall averaged halo spin. Disk instability is more likely to be the driver of the compaction of massive galaxies where feedback-driven outflows are less effective and disk morphologies show up.
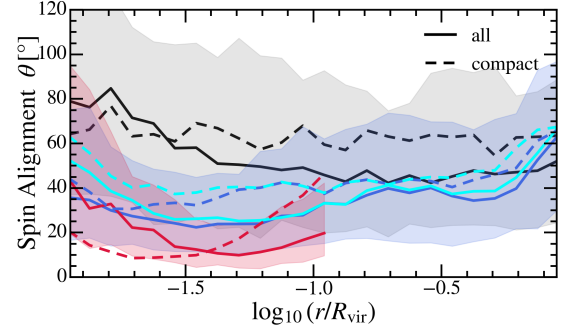
At similar radial ranges, we find the spin alignment of gas and stars becomes poorer below , which is a consequence of the proto-bulge formation from concentrated star-formation. We also find that the spin of gas is about times larger than that of the stellar disk. Similar gaps have been found in observational studies as well (Obreschkow & Glazebrook, 2014; Cortese et al., 2016). As a more direct tracer of the recently arrived mass, gas is expected to come in with a higher specific angular momentum, while stars are made of baryons that arrived earlier with lower specific angular momentum (e.g. Danovich et al., 2015; Teklu et al., 2015). In addition, feedback from young massive stars and potentially AGN can drive galactic outflows, which preferentially remove the low-angular momentum gas in the dense central regions of the galaxy and effectively increase the specific angular momentum of the remaining gas (e.g. Maller et al., 2002; Governato et al., 2010; Brook et al., 2011; Brook et al., 2012; Guedes et al., 2011; Romanowsky & Fall, 2012; Agertz & Kravtsov, 2016; Lagos et al., 2017). Such effects are likely more prominent at high redshifts, where star-formation is more clustered and bursty (e.g. Smit et al., 2016; Sparre et al., 2017; Emami et al., 2019; Iyer et al., 2020; Tacchella et al., 2020; Flores Velázquez et al., 2021; Hopkins et al., 2023; Shen et al., 2023; Sun et al., 2023b).
Compared to galaxies in the low-mass bin, massive galaxies have better alignments of gas and stellar angular momentum at and clear signatures of a co-rotating stellar disk at . This is consistent with the fact that massive galaxies are better described by the classical disk formation theory while low-mass galaxies are better described by the spherical shell model shown in the section above. This change in geometry could be due to the more frequent mergers and stronger impact of feedback-driven outflows of low-mass galaxies. Compared to the overall galaxy population, compact galaxies tend to have lower spins of both dark matter and gas upon accretion but similar spin profiles in the inner region of the halo. The initial lower spin makes these haloes more prone to disk instability (Dekel & Burkert, 2014) and enters the compaction phase earlier.
5.3 Disk instability
One important driver for the compaction of massive galaxies at is disk instability. As shown in Figure 5 and Figure 12, we find more prevalent signatures of disk morphology for both the stellar and gas components of these galaxies. This is expected from disk formation theory as massive galaxies tend to have deeper and more concentrated gravitational potentials (e.g. Hopkins et al., 2023) and increased pressured confinement from the hot virialized CGM (e.g. Stern et al., 2021). However, the gaseous disks in high-redshift star-forming galaxies are likely not stable or in a marginally stable state.
The large cold gas abundance and rapid gas cooling can trigger global instability in the disk. This can be understood through a modified turbulent Toomre instability 222Here we focus on the gas-rich early phase and neglect the stellar content (e.g. Romeo & Wiegert, 2011). criterion of a differentially rotating disk (Toomre, 1964)
| (6) |
where is the epicyclic frequency (e.g. for a flat rotation curve, where is the angular circular velocity), is the thermal sound speed, is the radial velocity dispersion, is the total matter surface density, and is an order-unity constant. Disk instability happens if the LHS drops below , which can be a consequence of either cooling or increased from gas accretion. Note that even when turbulence dominates over the thermal support, turbulence cascade to the viscous scale can still turn turbulent energy into thermal energy, which is eventually carried away by cooling radiation.
In high-redshift galaxies, both scenarios are highly possible. For example, in the standard CDM cosmology, the typical gas accretion time scale can be estimated as (Dekel et al., 2009b), where the gas accretion rate of a halo has been assumed to scale with the total mass growth rate by a constant factor. The ratio of to the Hubble time will become lower at higher redshift and can drop significantly below unity at to allow instabilities to develop in disks. A similar thing applies to the typical cooling time in the star-forming disk (e.g. Dekel et al., 2023) which is almost always below .
Once instabilities get triggered, clumps with sizes comparable to the Jeans length will form over a dynamical crossing time scale
| (7) |
where is the characteristic size of the disk and is the circular velocity at . These clumps will migrate toward the centre of the galaxy through clump-clump interactions and meanwhile drive general mass inflows 333At the same time, there exists some feedback mechanism to keep the disk in a marginally stable state, including the mass inflow that reduces , clump-clump encounters stirring up the disk and increasing turbulence, and thermal or mechanical feedback from star-formation. In this self-regulated state, mass inflow and clump migration can be sustained.. In a self-regulated state, Dekel et al. (2009b) showed that the evacuation time scale of the disk due to clump migration is
| (8) |
where is the disk mass to total mass ratio within , is the disk mass locked in giant gas clumps as defined in Dekel et al. (2009b), and for an isothermal thick disk (Goldreich & Lynden-Bell, 1965). The compaction happens faster in gas-rich environments with high . Since baryons dominate the mass budget in the central halo and gas dominates over stars in the early phase of galaxy growth (see Figure 8), is comparable to the measured in Figure 5 and can reach in massive galaxies on the track of compaction. The time scale for instability-driven compaction will be of order a few hundred Myr, which is quite consistent with the evolution track shown in Figure 8. As argued in Dekel & Burkert (2014), once disk instability gets triggered, will monotonically increase during the gas contraction phase and this will be a runaway process. This could create a bimodal track of galaxy size evolution that depends on halo spin, which has been discussed extensively in the context of compact galaxies at (e.g. Dekel & Burkert, 2014; Zolotov et al., 2015; Lapiner et al., 2023). However, at higher redshifts, the compaction track will quickly become much more likely to happen (Dekel & Burkert, 2014).
The gas inflow is also likely to be “wet” (Dekel & Burkert, 2014; Krumholz et al., 2018). In the self-regulated marginally stable disk, star-formation happens at the time scale , where is the star-formation efficiency in molecular phase per free-fall times and we take the value suggested by observations (e.g. Sun et al., 2023a, needs to be distinguished from the galaxy-scale SFE defined above), is the free-fall time assuming star-formation happens in regions that are denser than the mean density of the disk by a factor of few (Dekel & Burkert, 2014). is usually longer than , especially when is large, cold gas inflow can be sustained against local star-formation in the disk, and therefore, fuels the starburst at galaxy centres and helps form compact galaxies.
6 Comparison with observations
6.1 Apparent size-mass(luminosity) relations
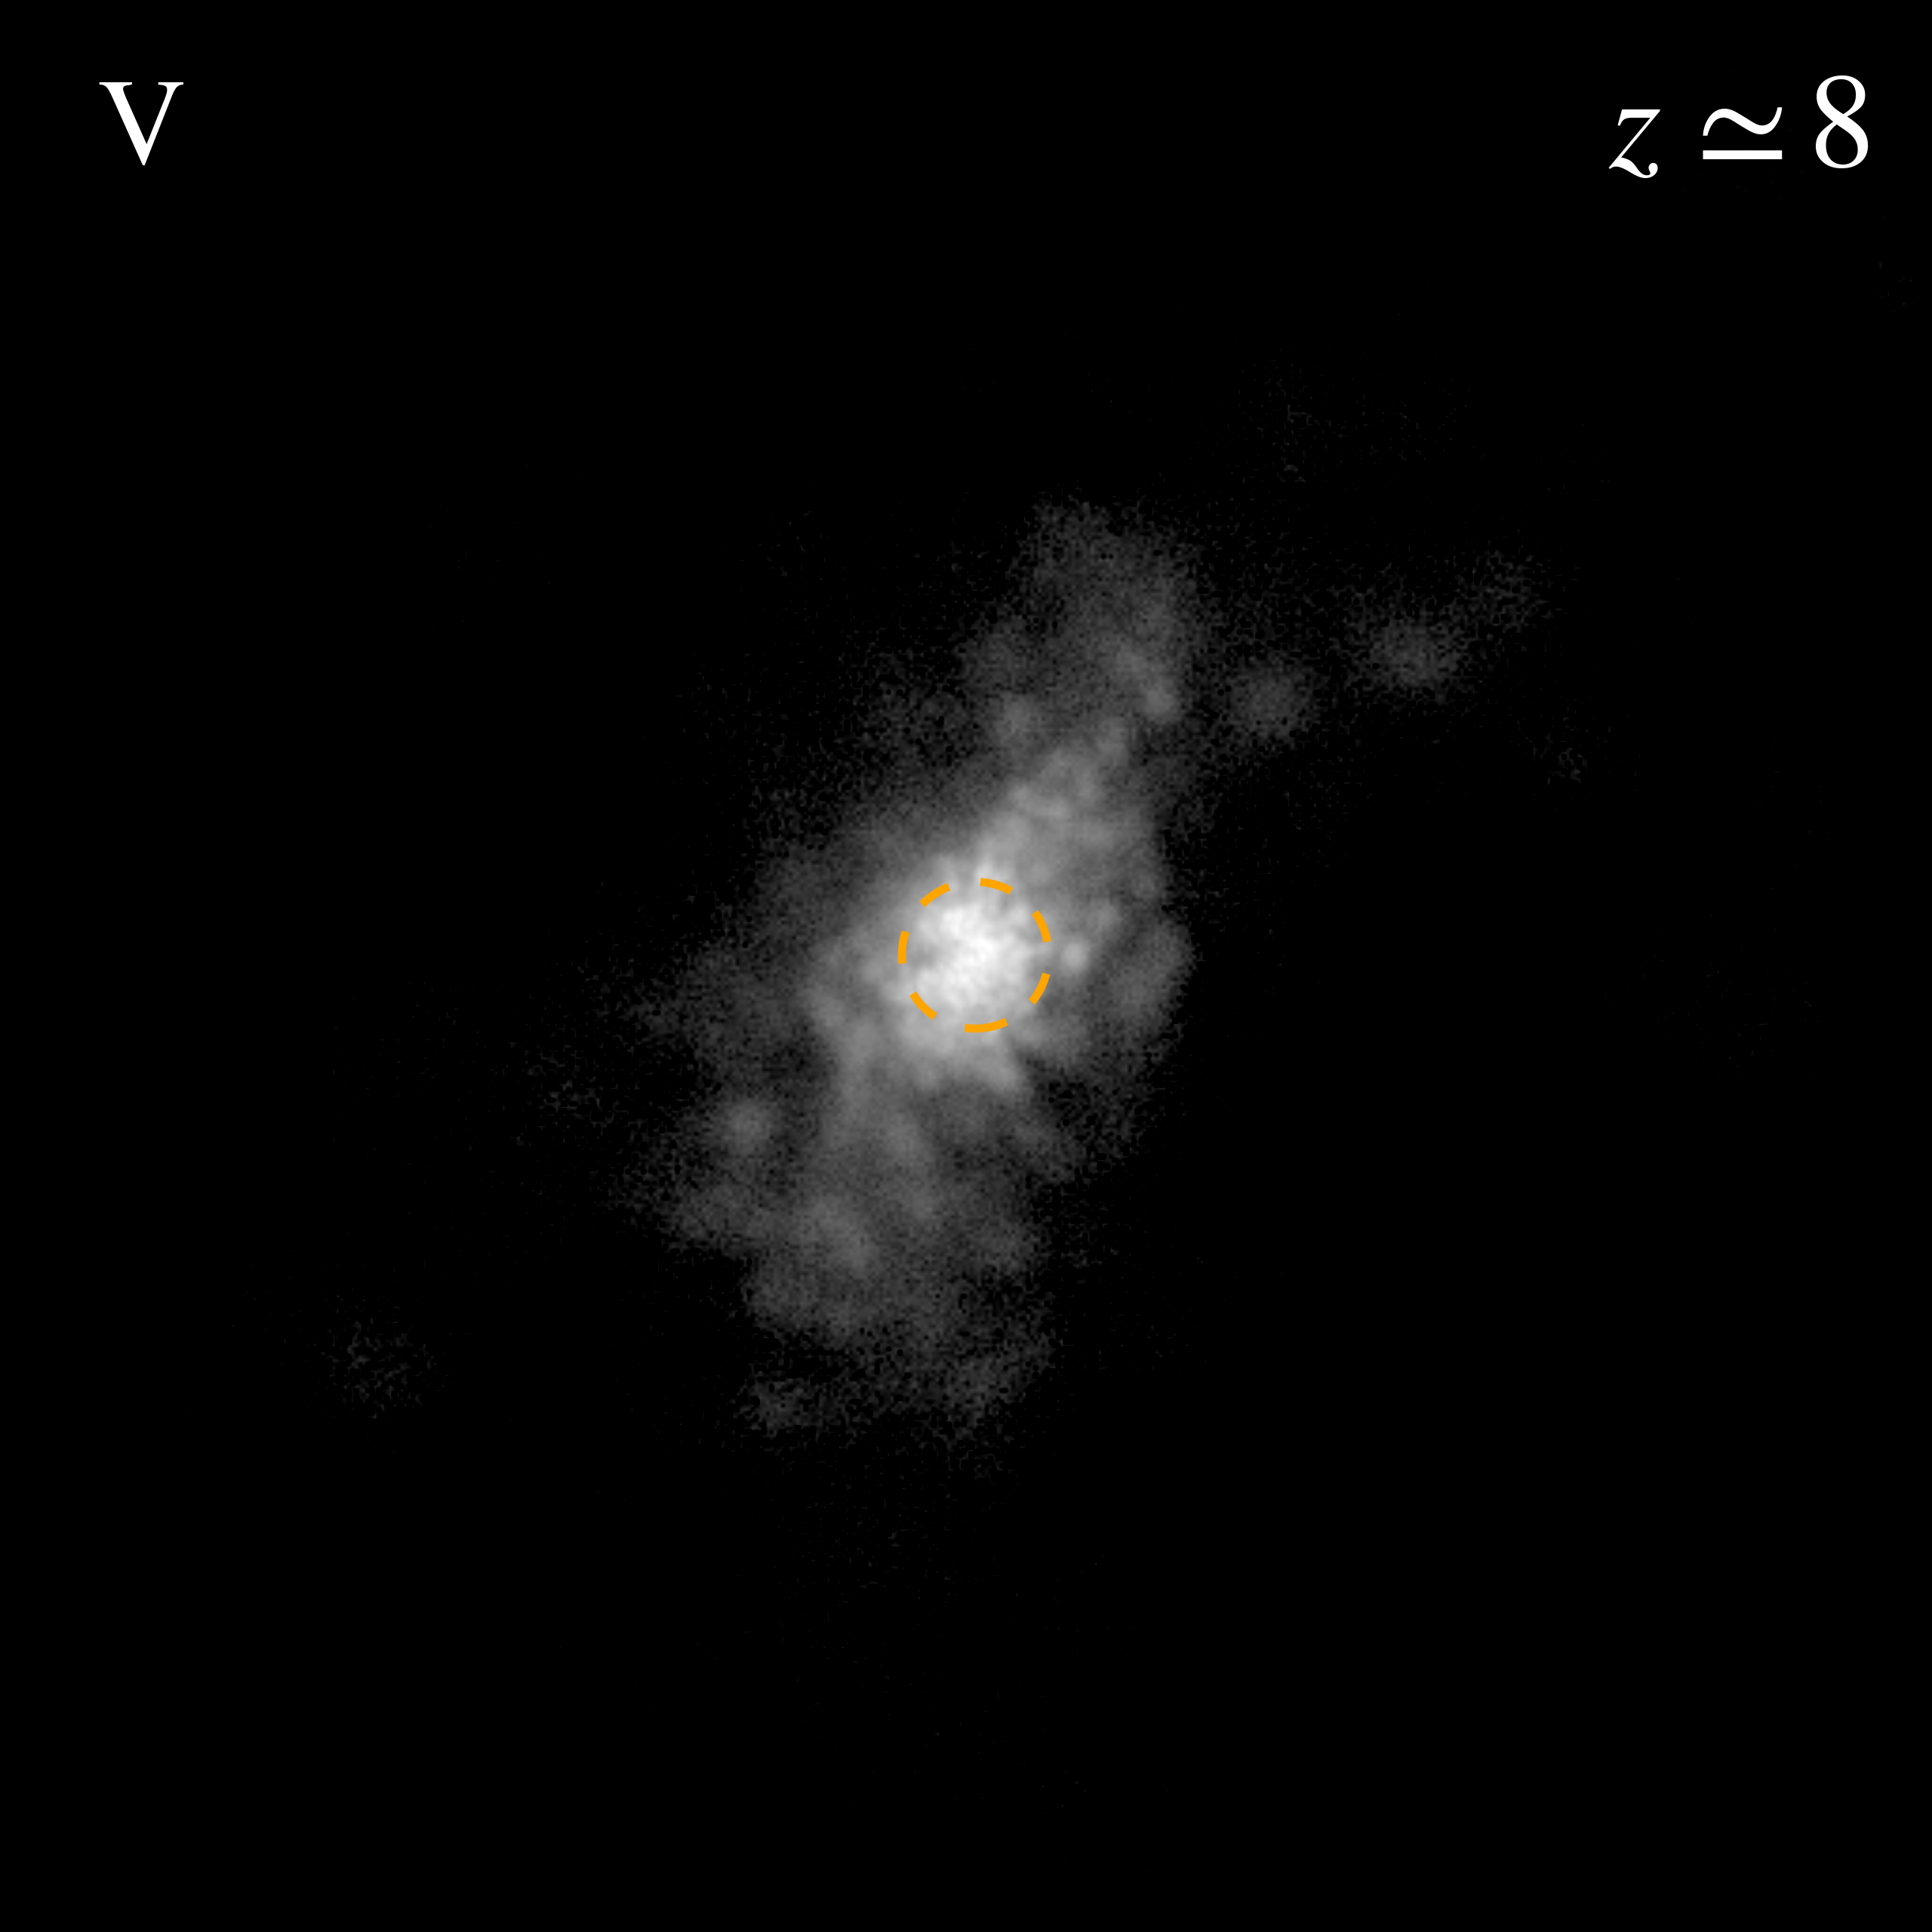
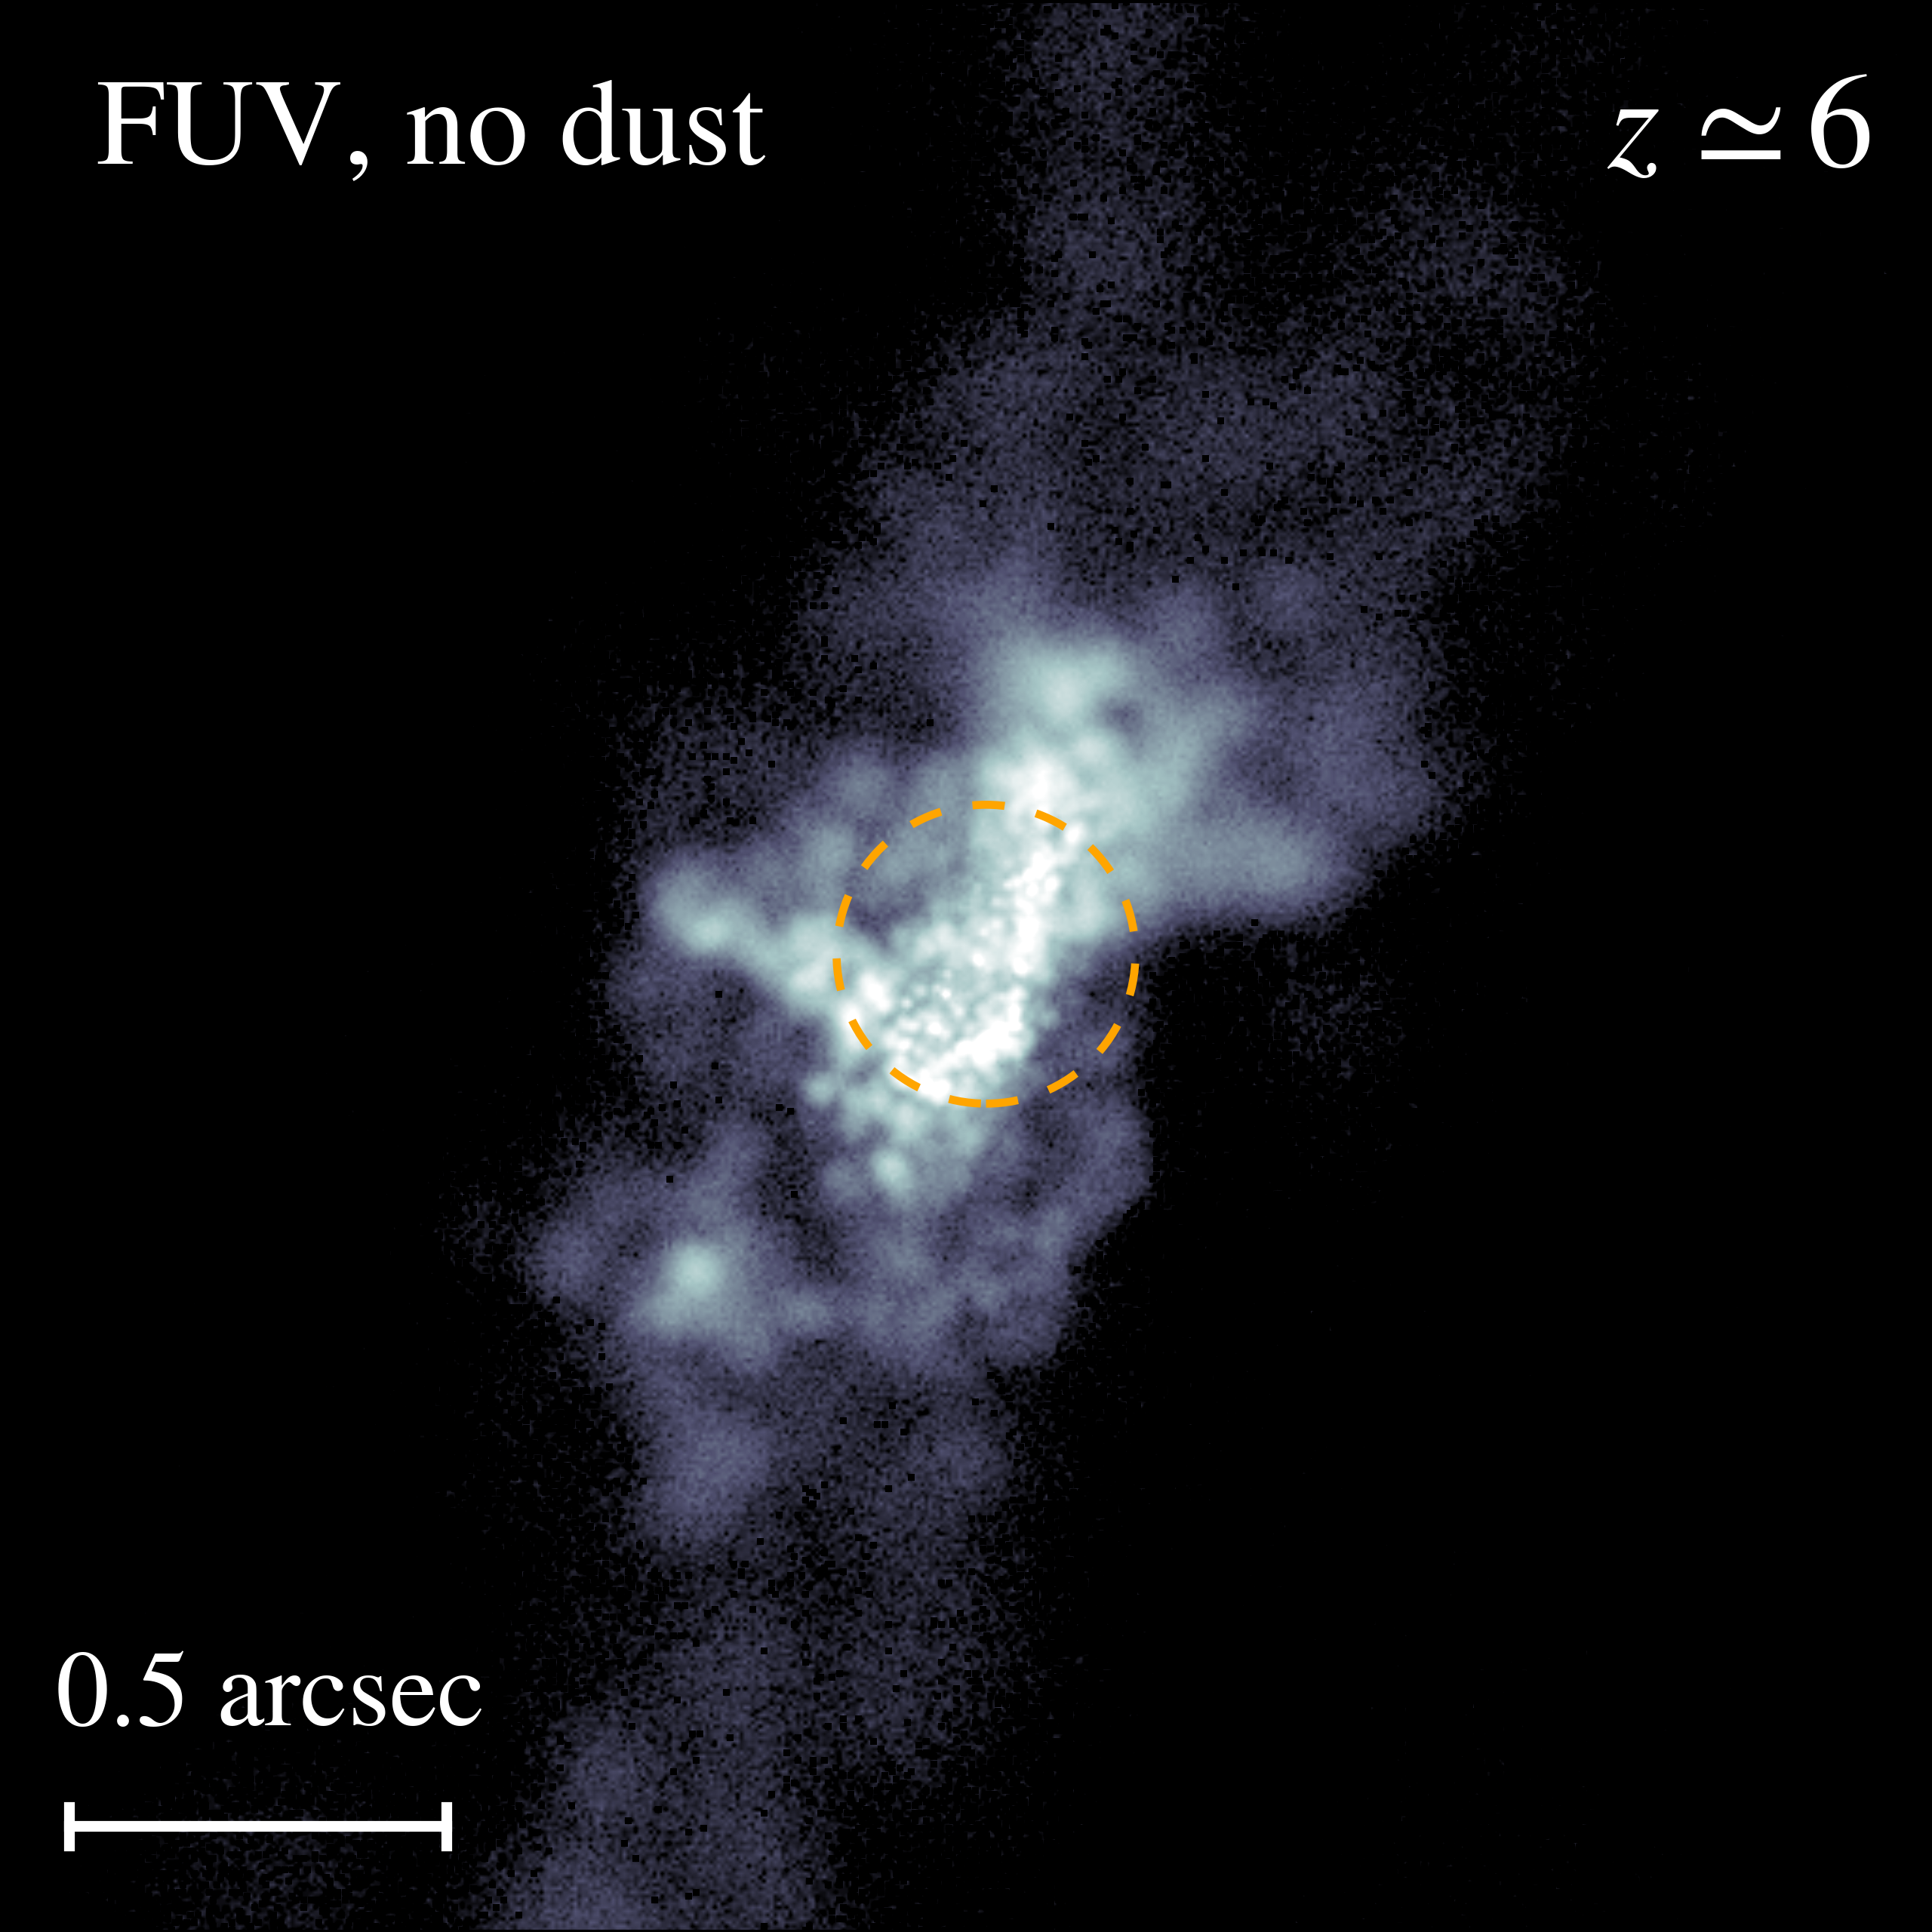
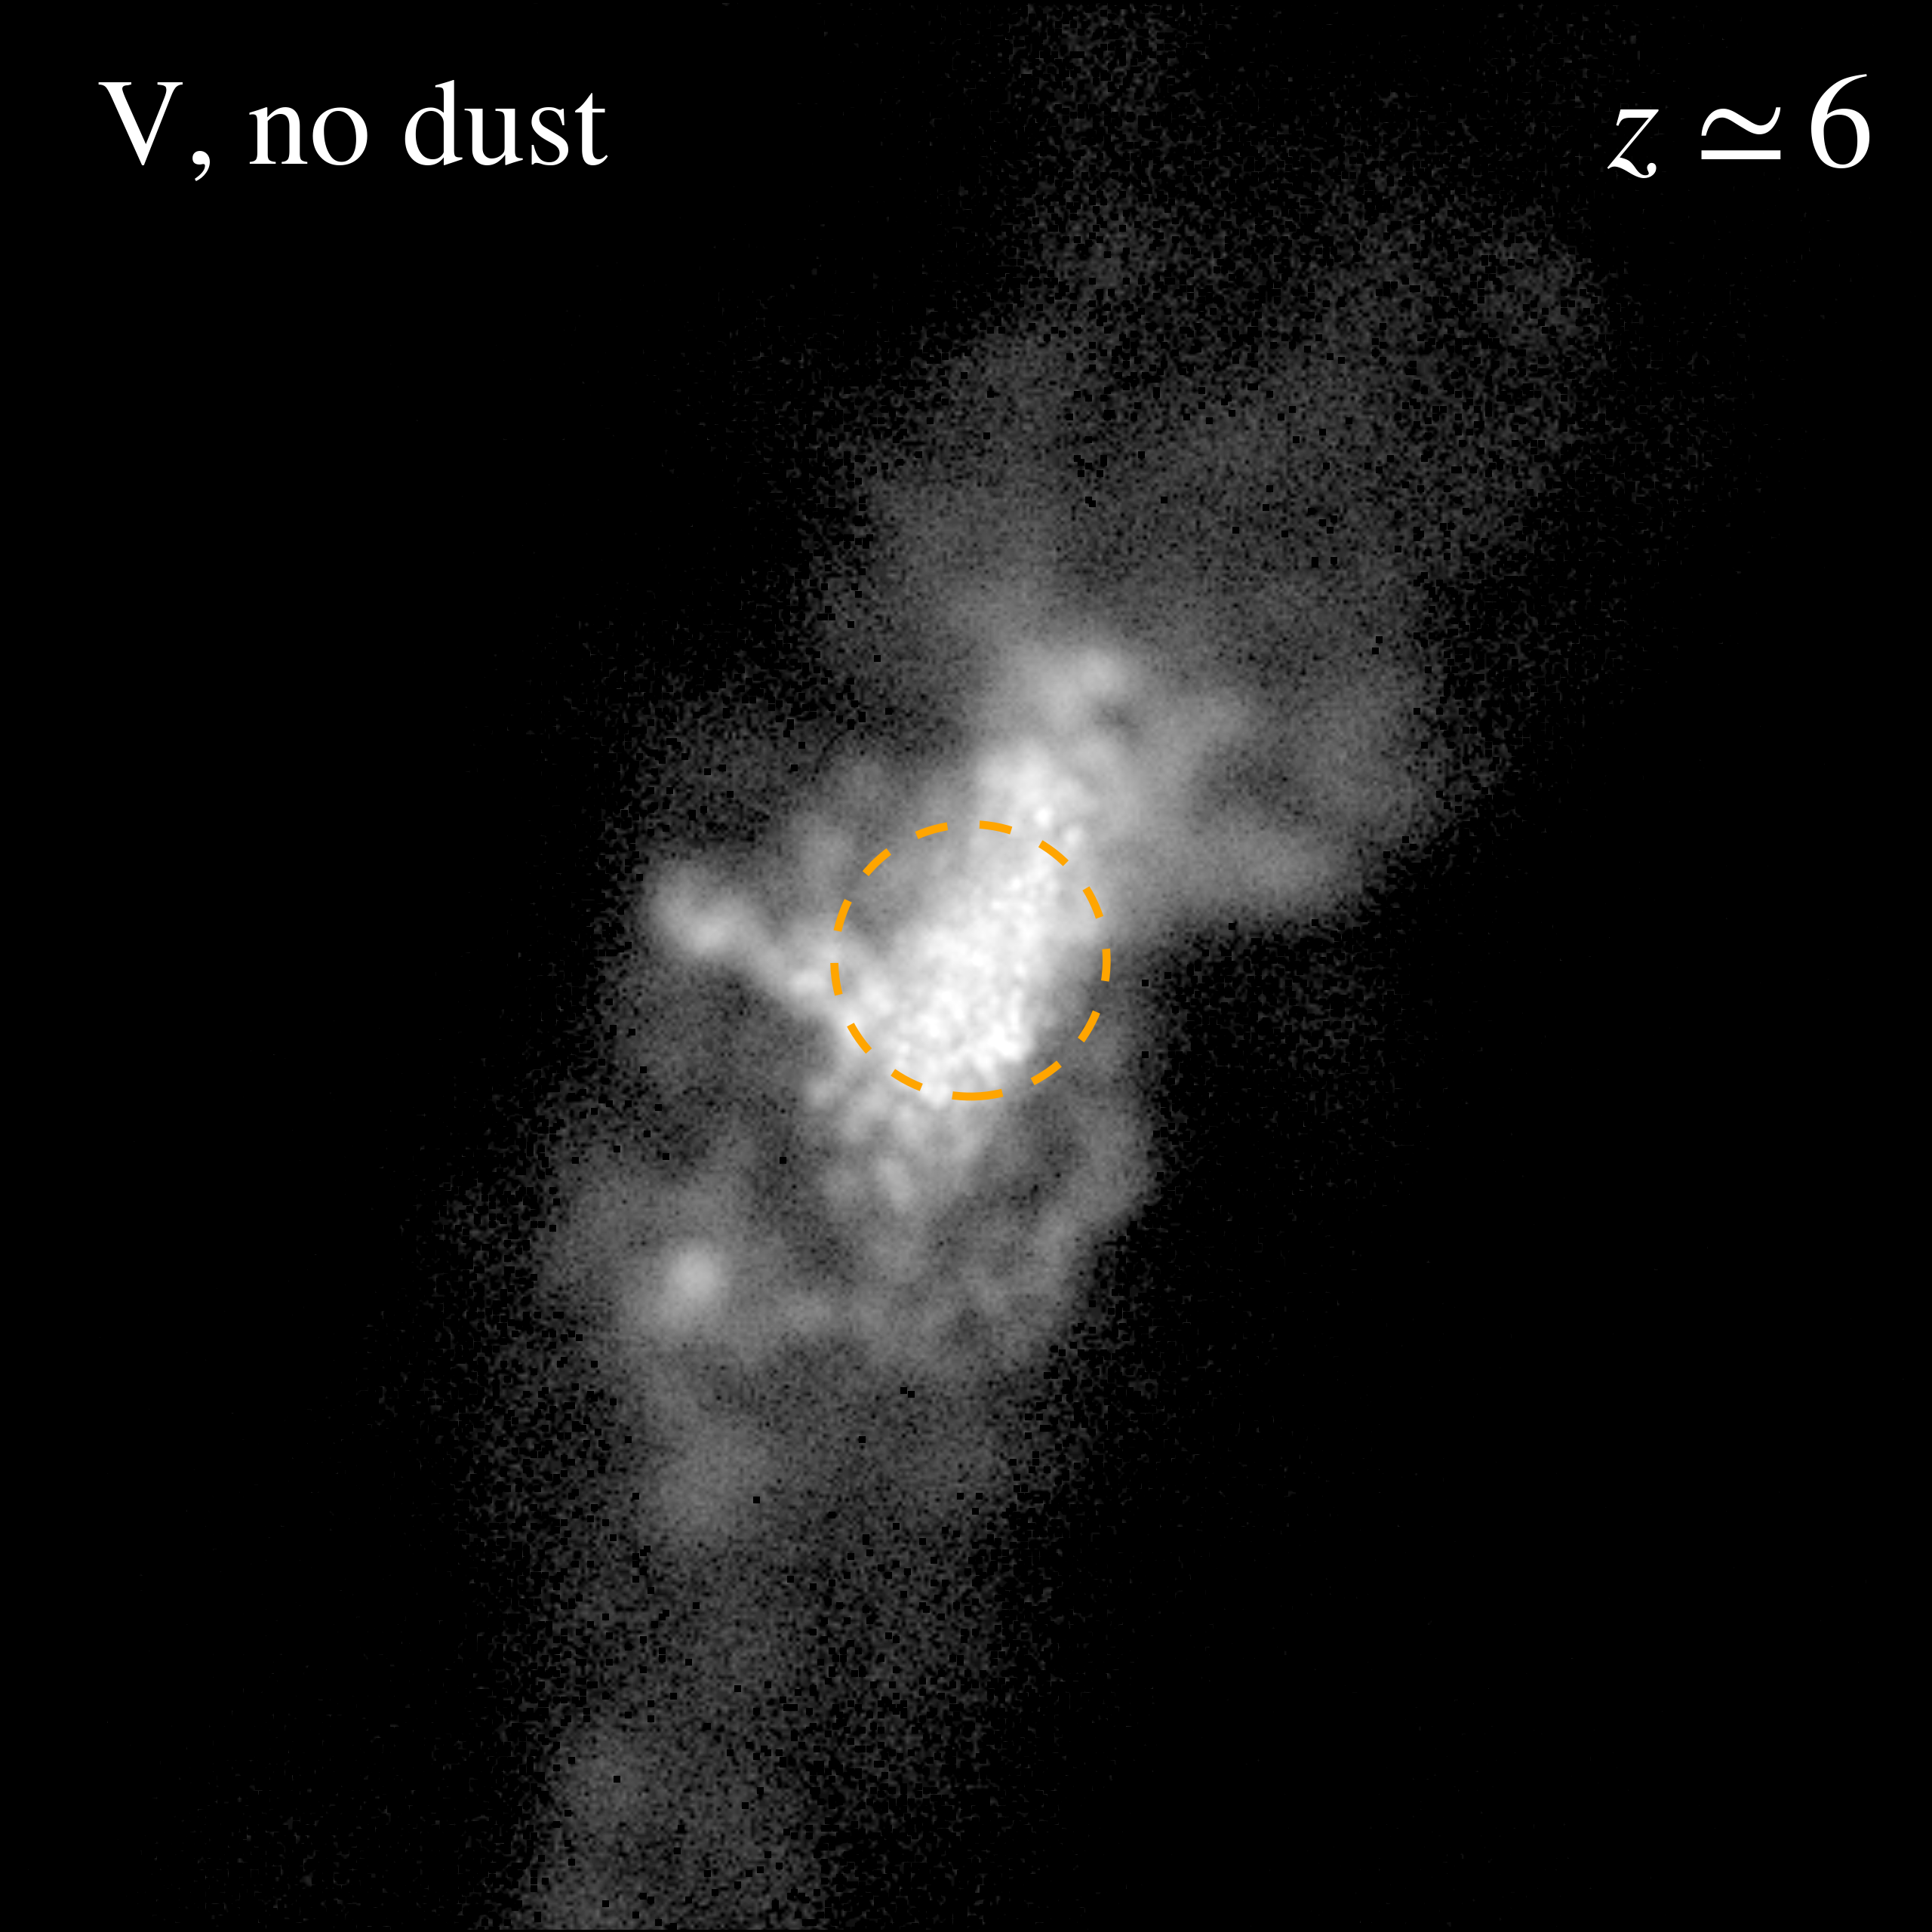
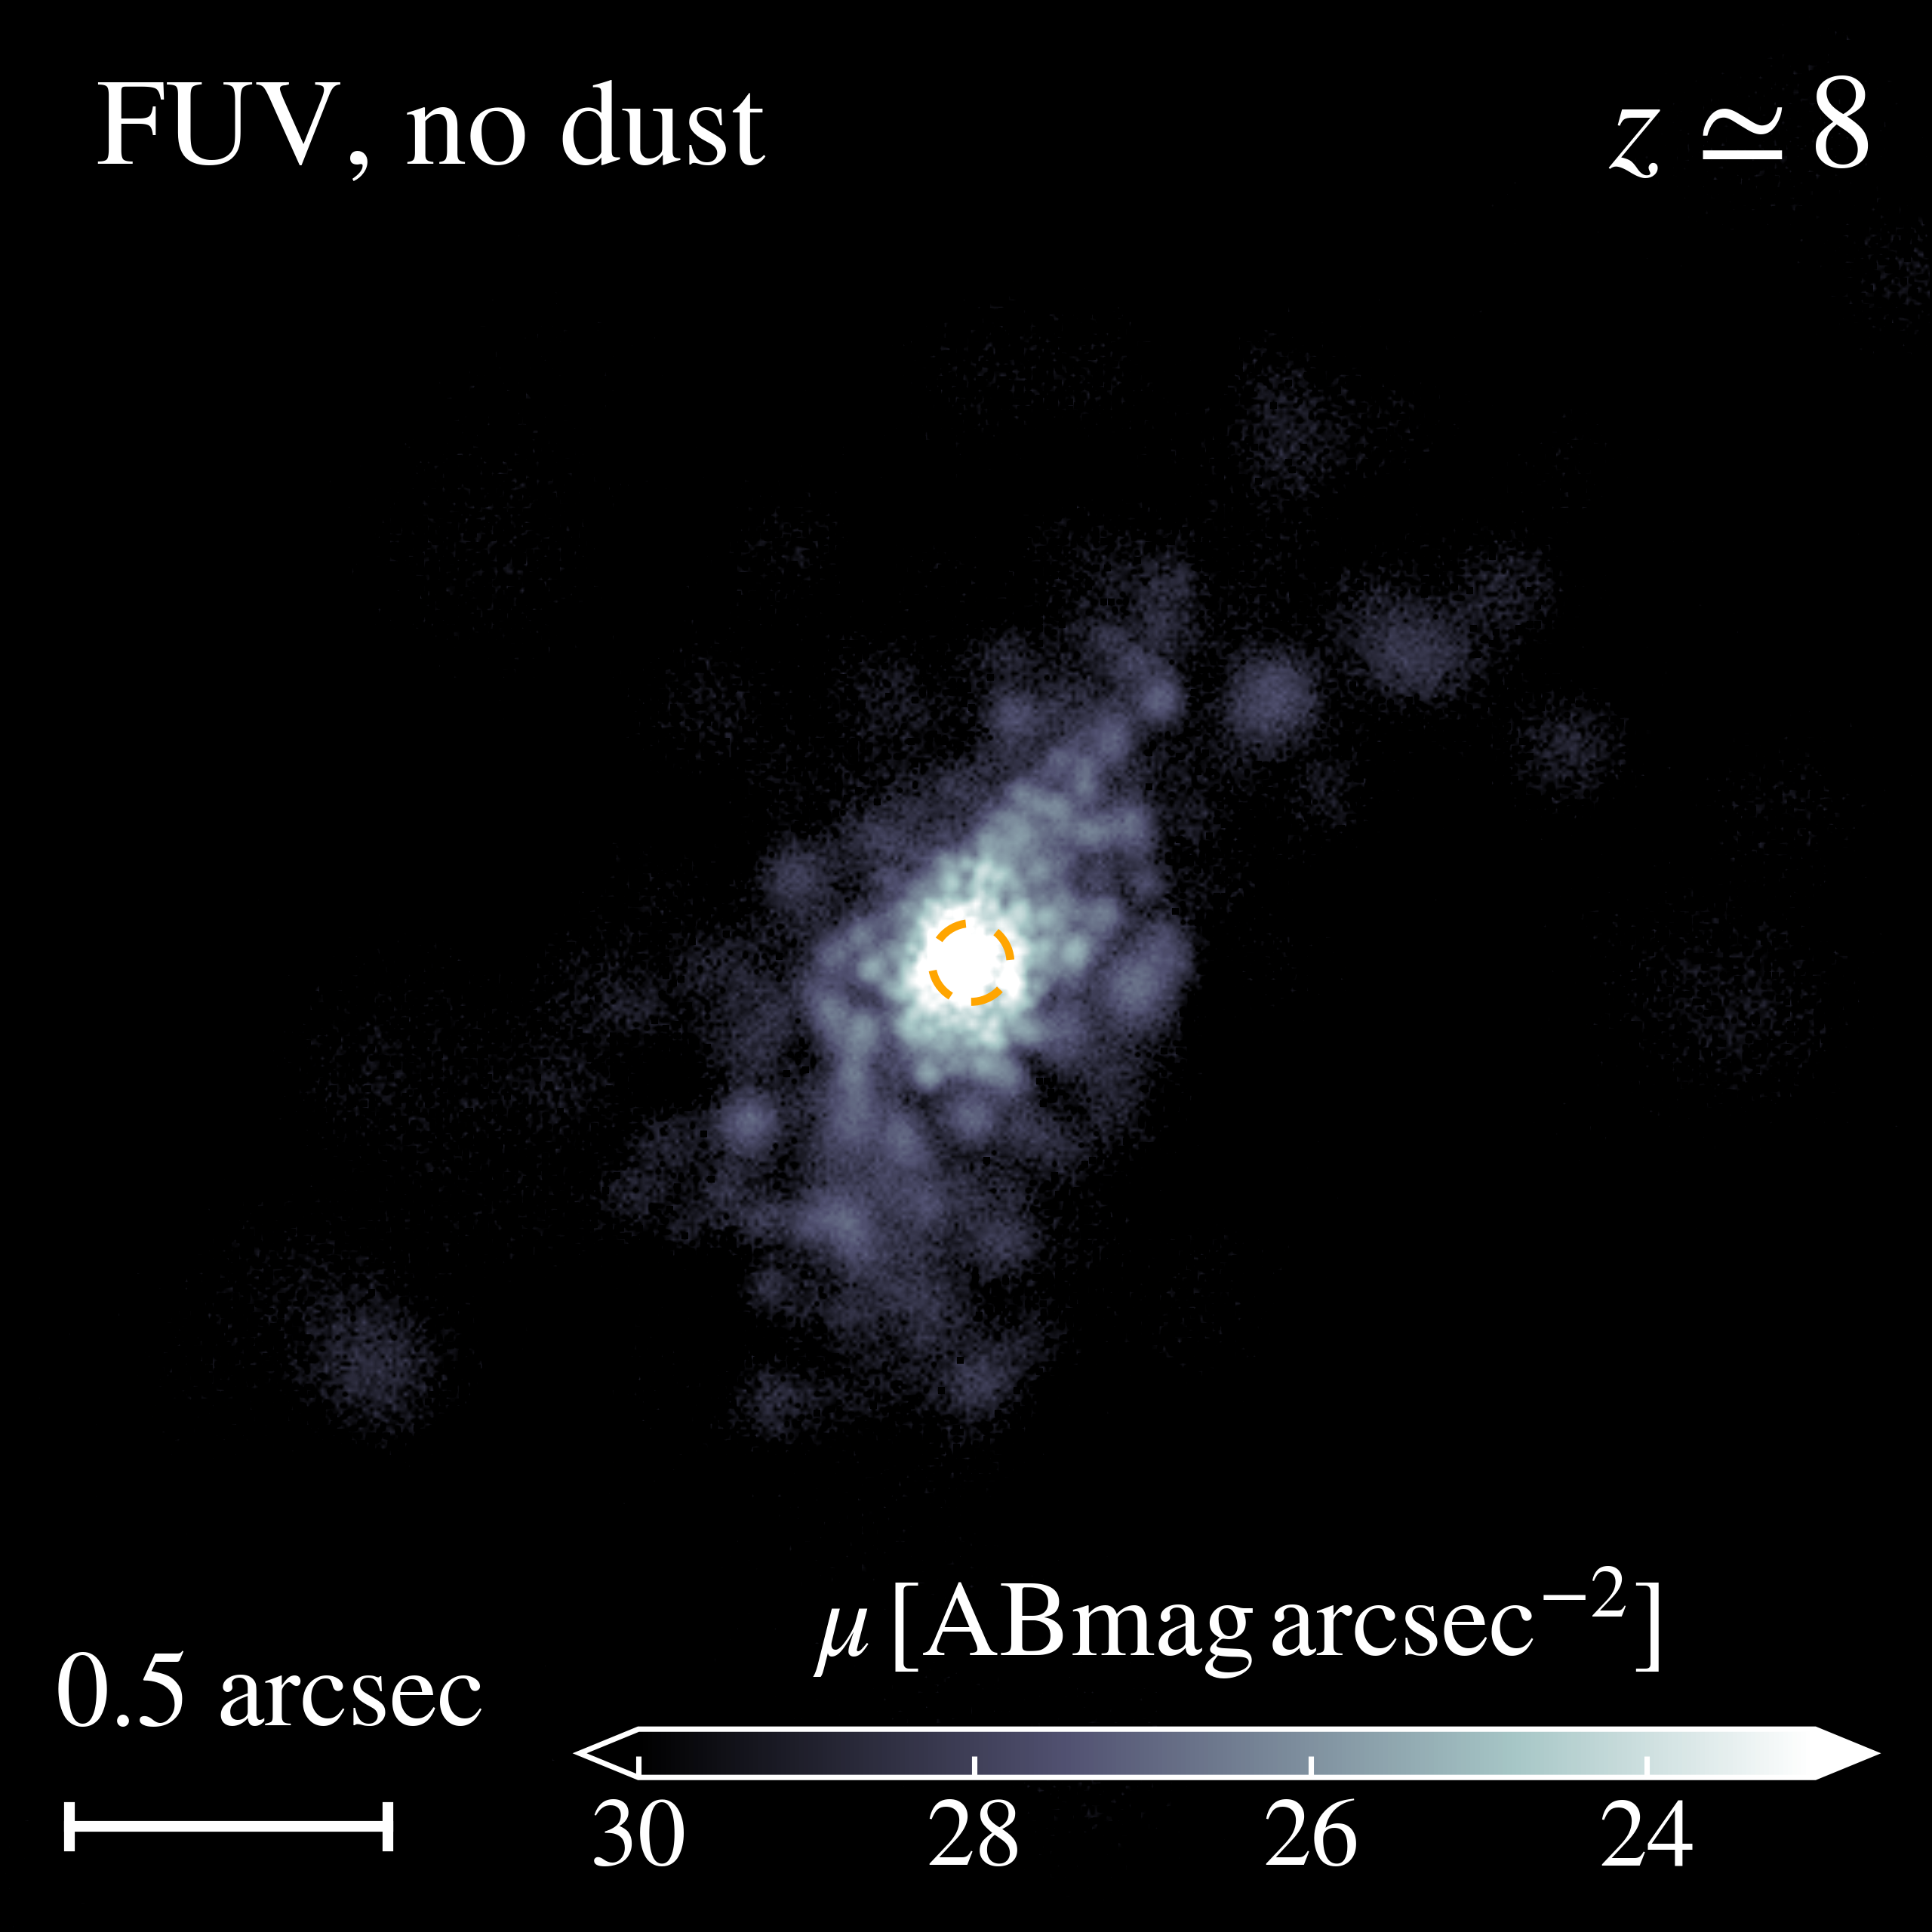
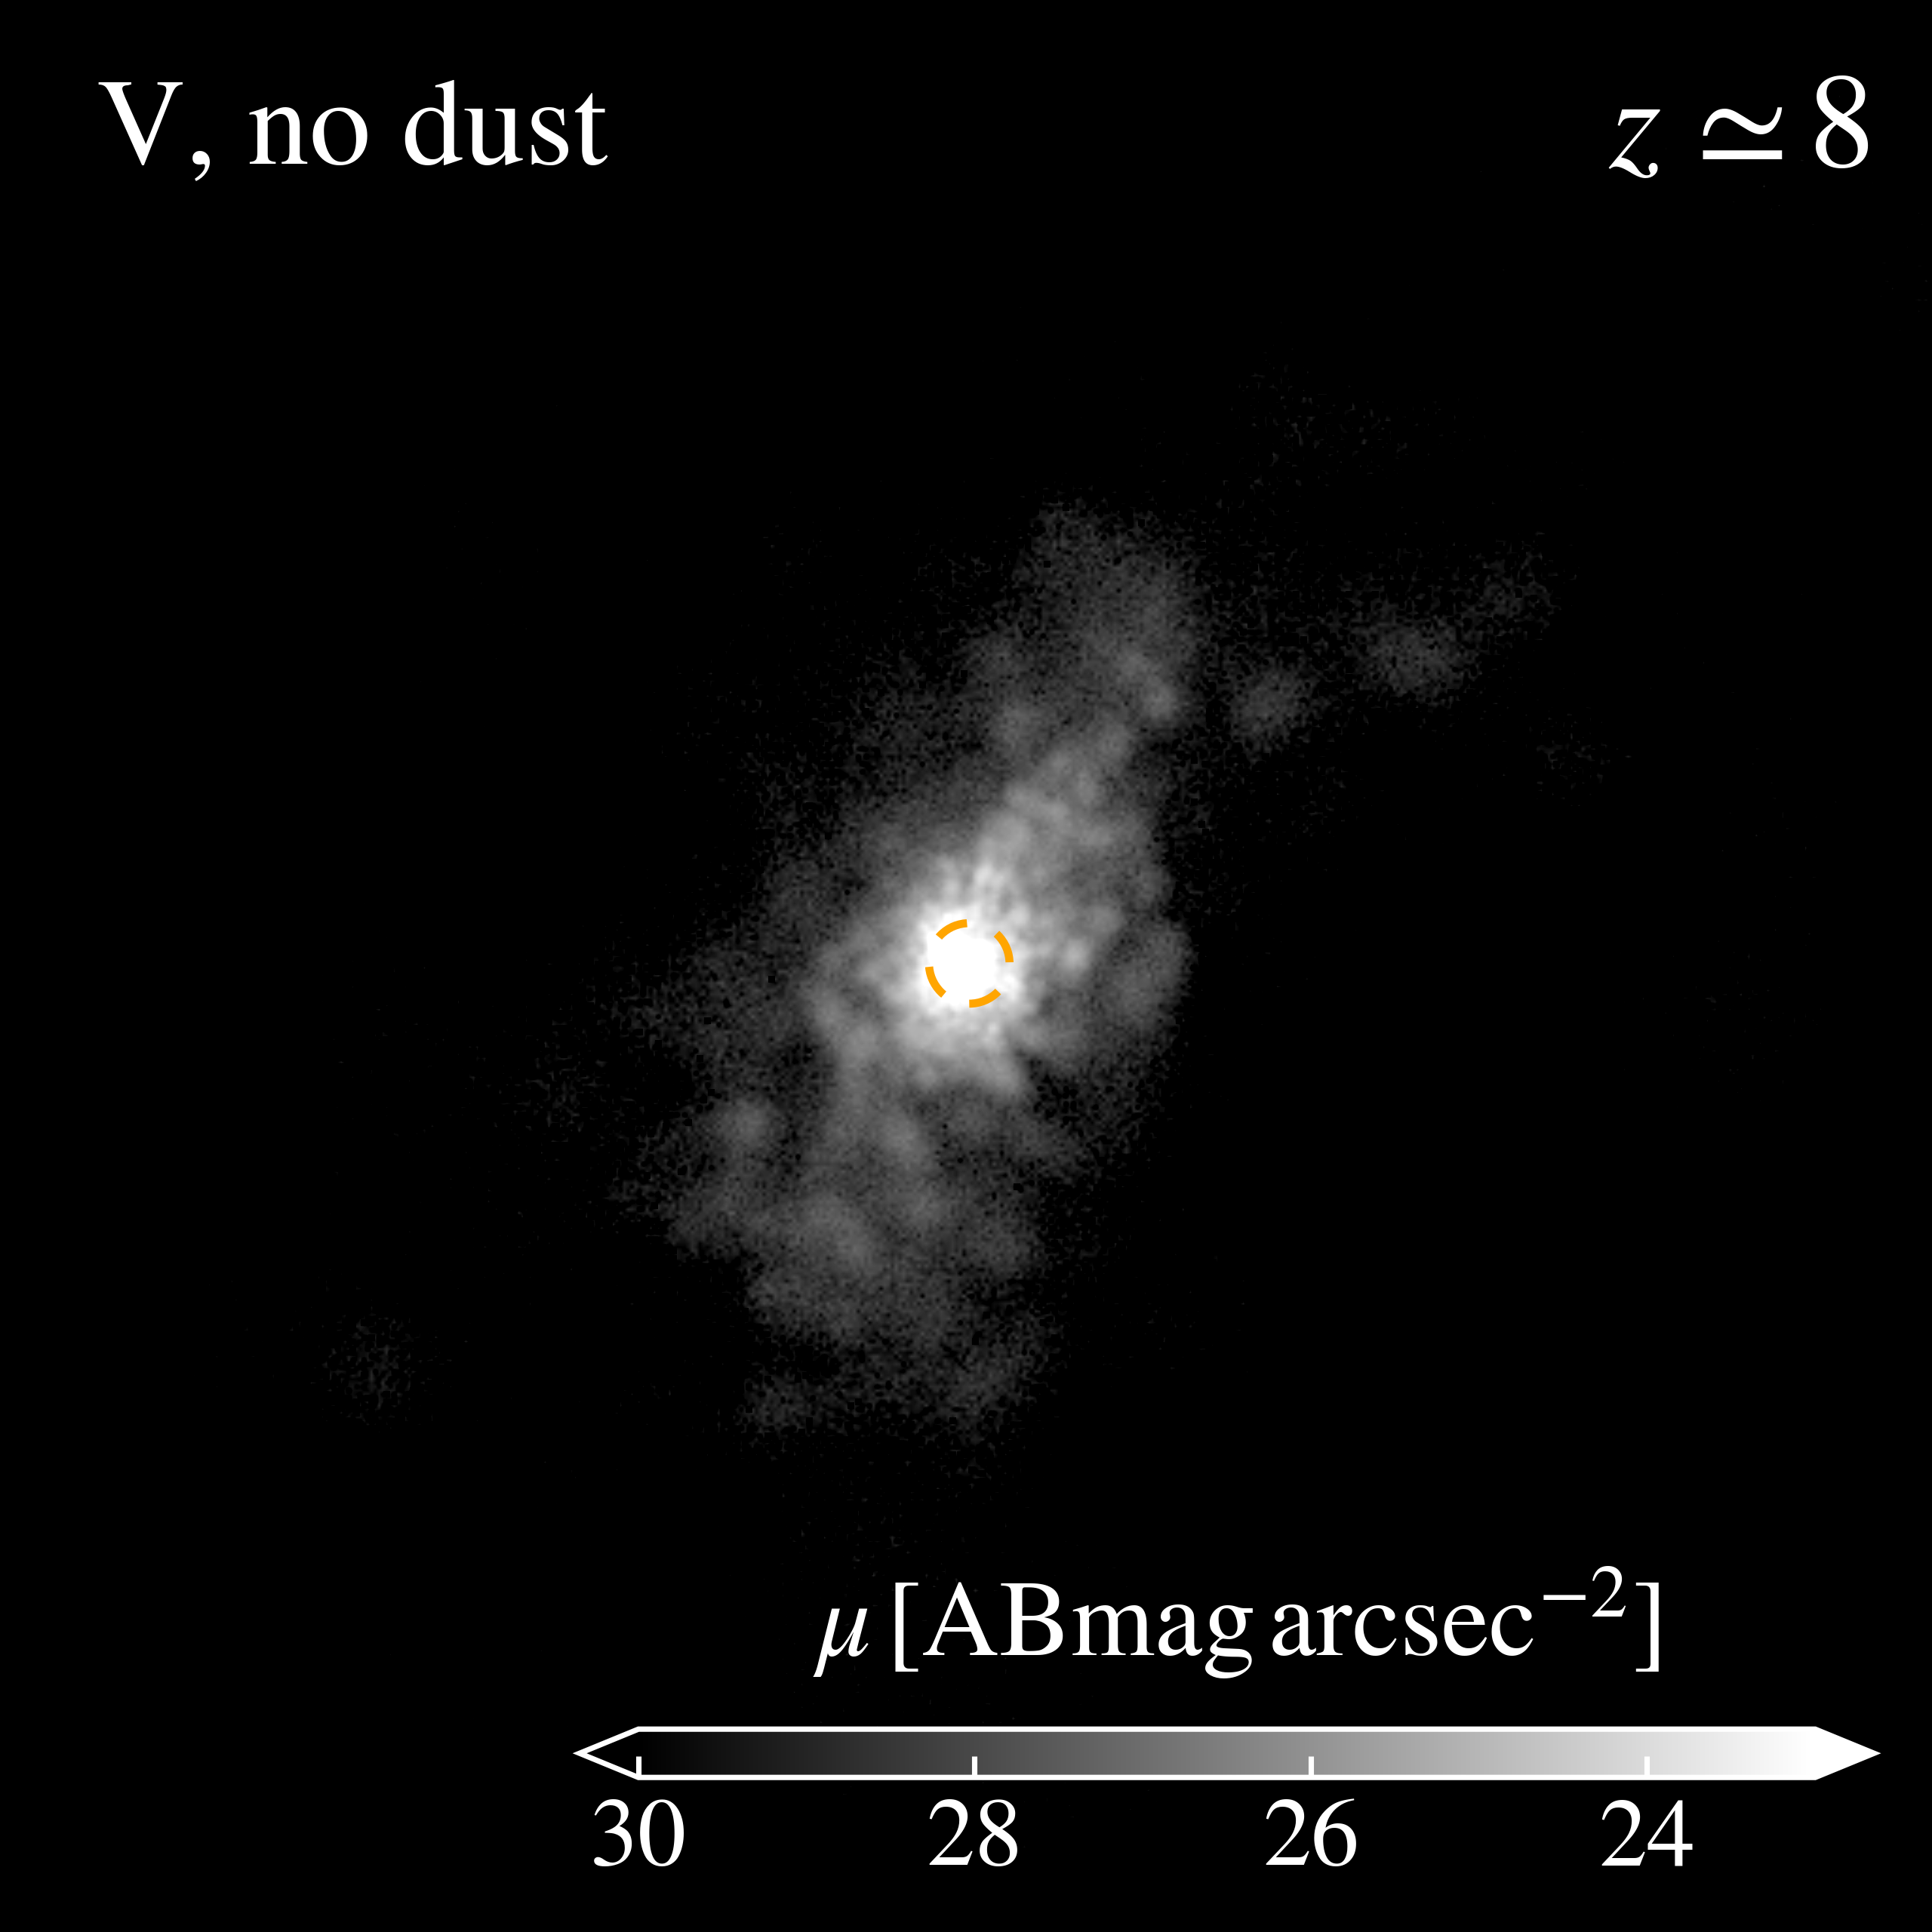
The analyses above focus on the intrinsic physical sizes of galaxies. However, in the observations, galaxy sizes are often measured by fitting the surface brightness profile/distribution of galaxies in certain bands and quoted in terms of the effective radius (, 2D “half-light” radius). To enable a fair comparison of simulation results with observations, we utilize the mock galaxy images described in Section 3.3. We find as the circular aperture centered on the pixel flux-averaged centre of the image that contains half of the total light of all image pixels. In Figure 13, we show examples of these mock galaxy images in rest-frame UV and optical V band with and without dust attenuation. The galaxy in UV and V bands are fairly close to each other before dust attenuation. However, dust attenuation increases the apparent size of galaxies preferentially in UV, which will be discussed in detail below.
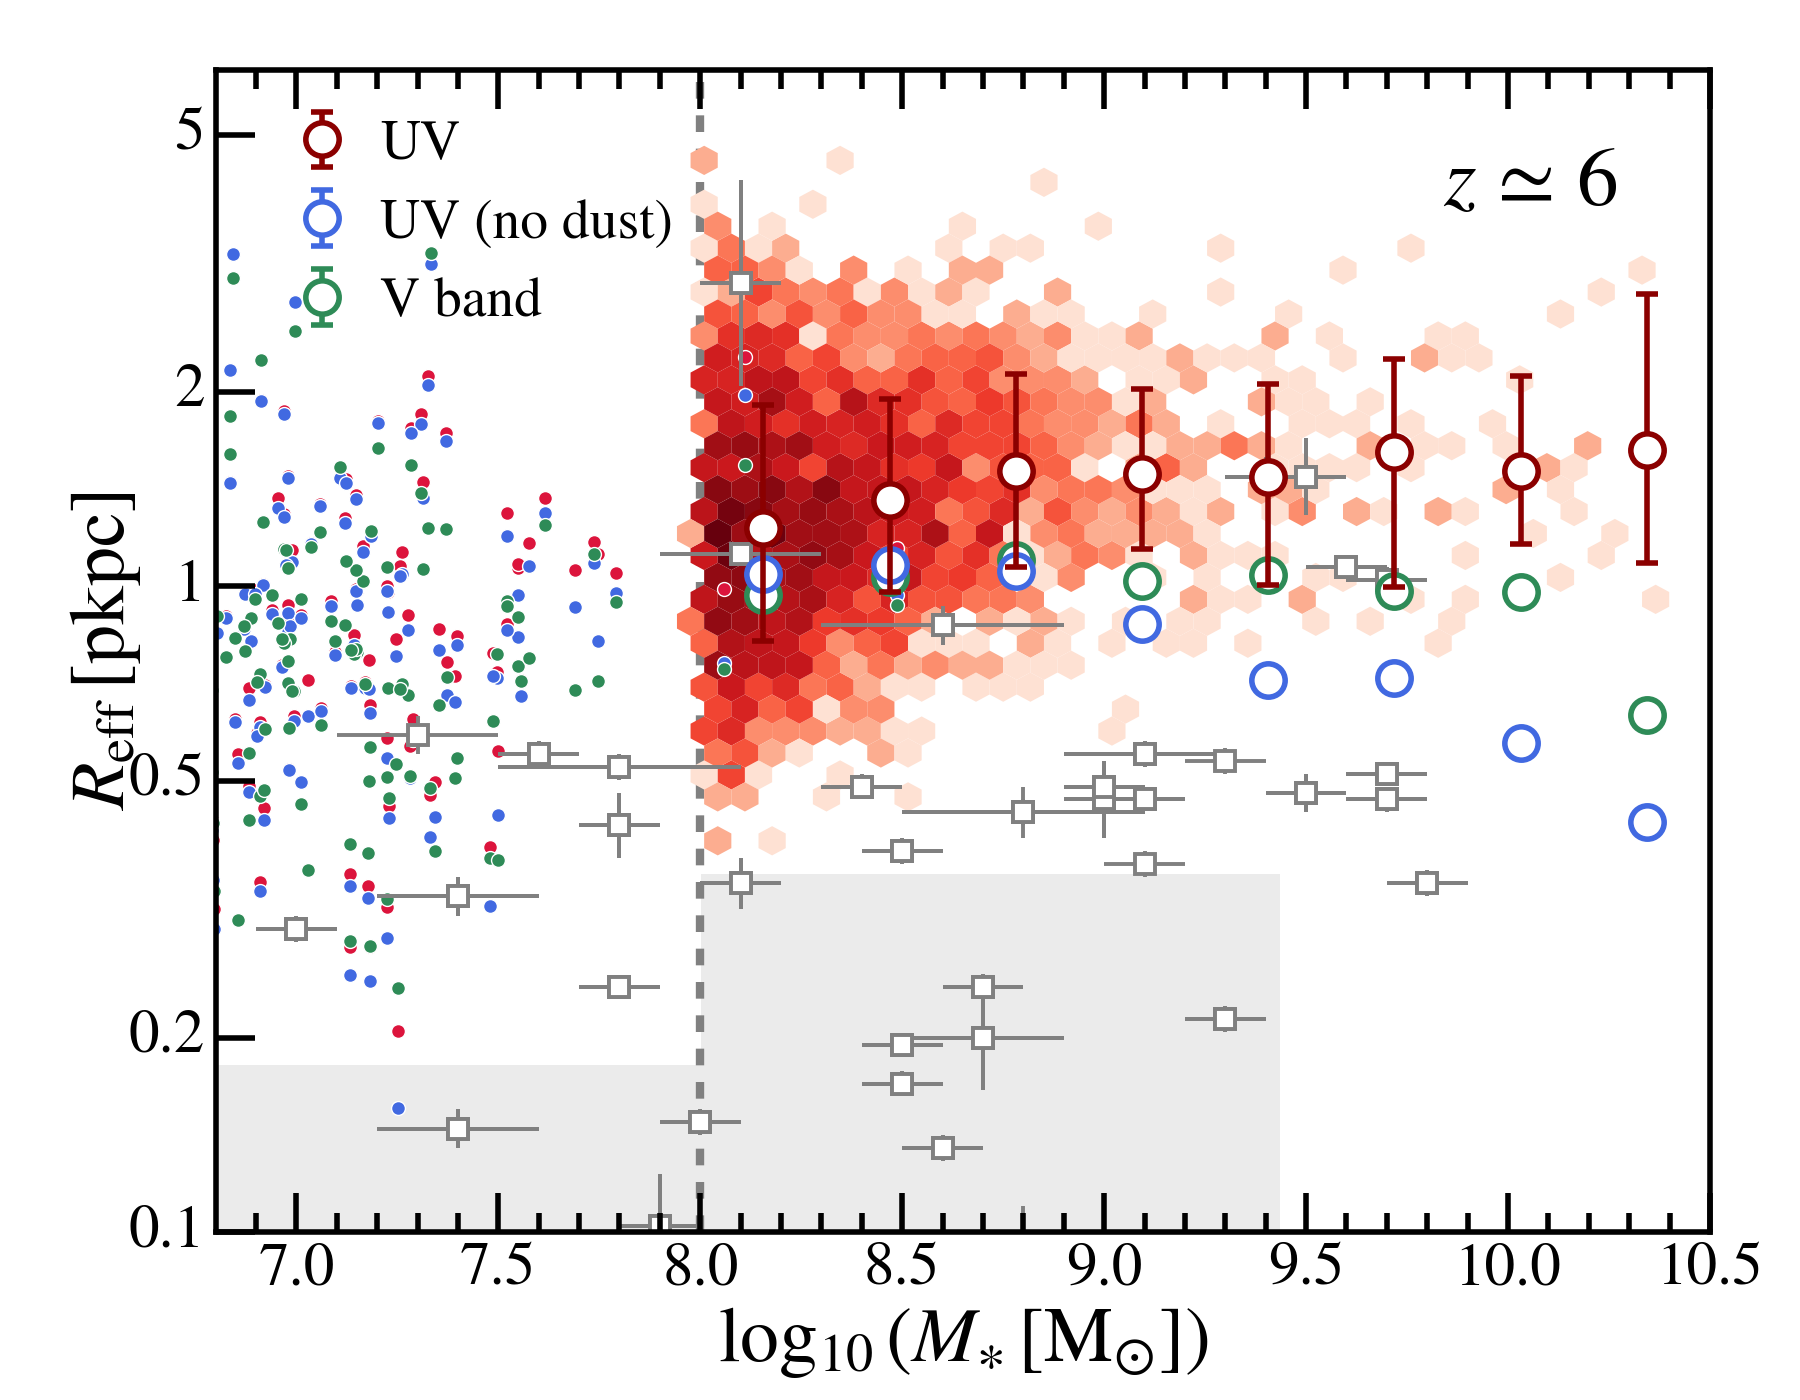
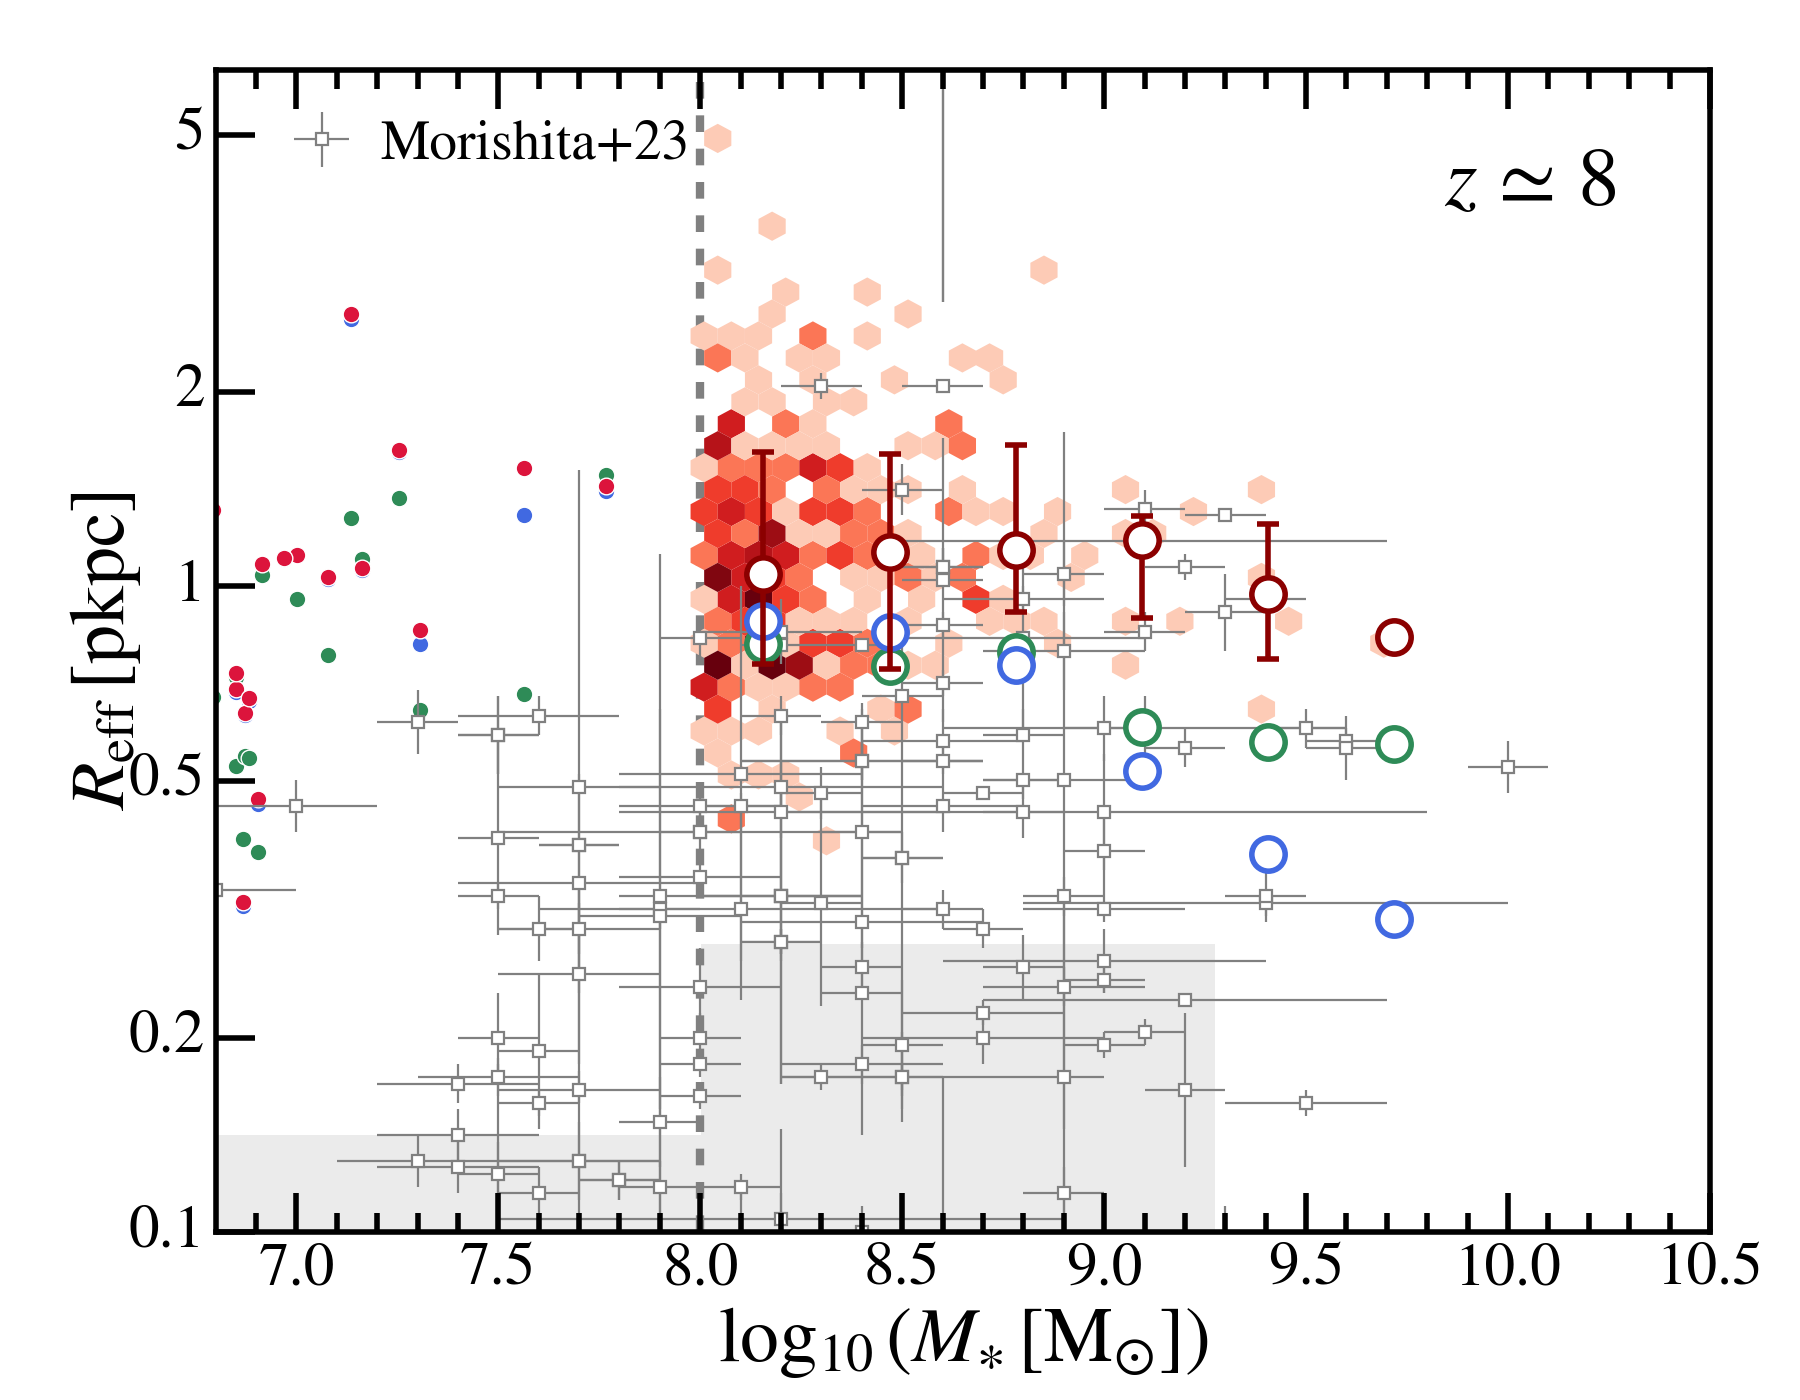
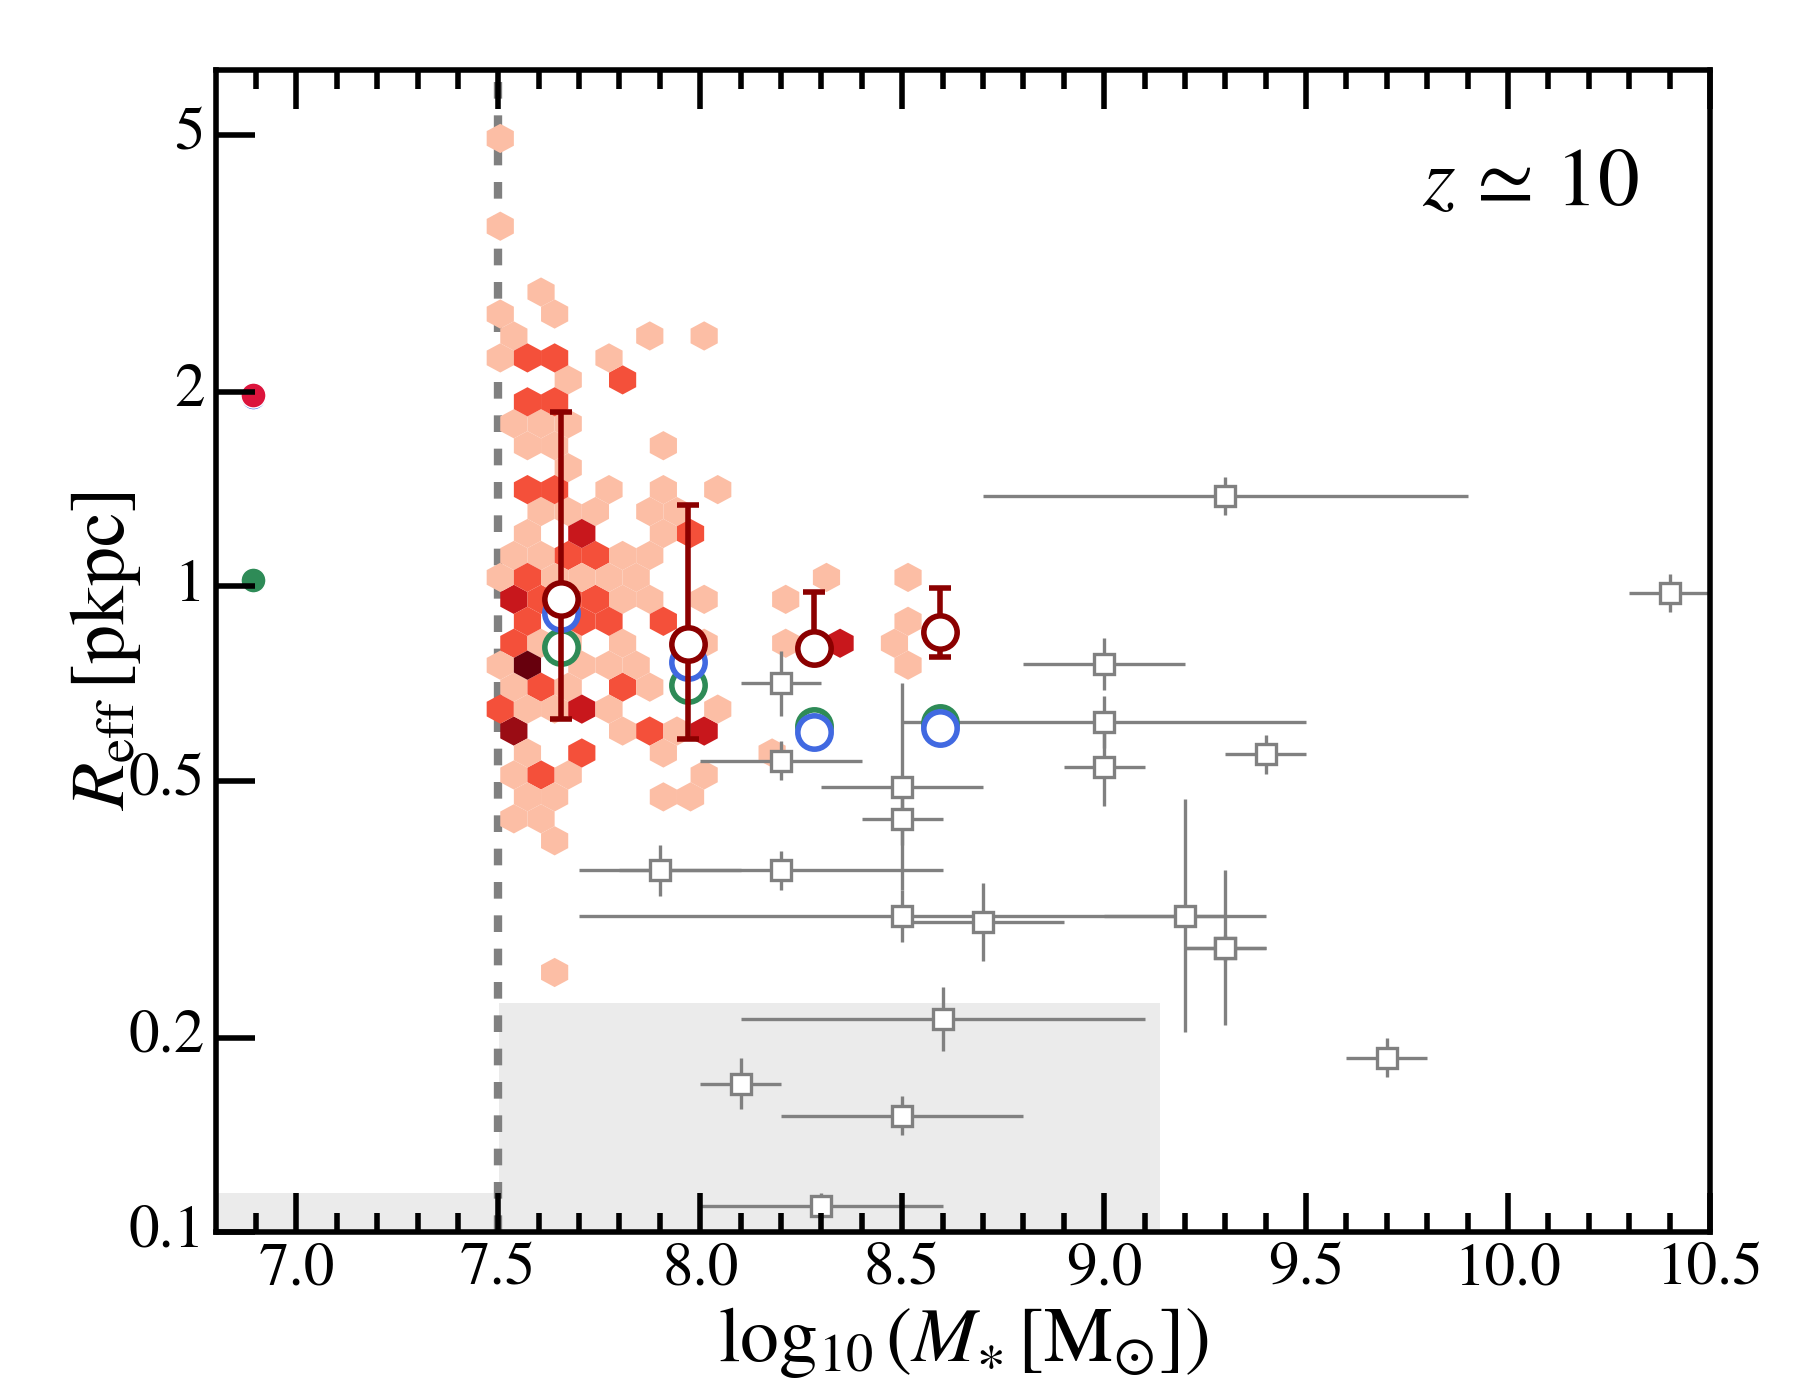
In Figure 14, we show the galaxy versus stellar mass relations in rest-frame UV and V band in the thesan simulations. We also show the UV when dust attenuation is not taken into account. The discrepancies of size from band choice or dust attenuation mainly show up in massive galaxies. Unlike the intrinsic , the in UV display a mild positive correlation with galaxy stellar mass. The simulation results are compared to the measurements in Morishita et al. (2023), which were based on 341 galaxies at in a suite of nine public JWST extragalactic fields in Cycle 1. We find that the observed galaxies are systematically more compact than the simulated ones. A large population of compact galaxies exists at with . We note that they are still larger than the full width at half maximum (FWHM) of the PSF of short-wavelength NIRCam filters (e.g. for F070W, F090W, F115W, FWHM arcsec at ; Rigby et al. 2023).
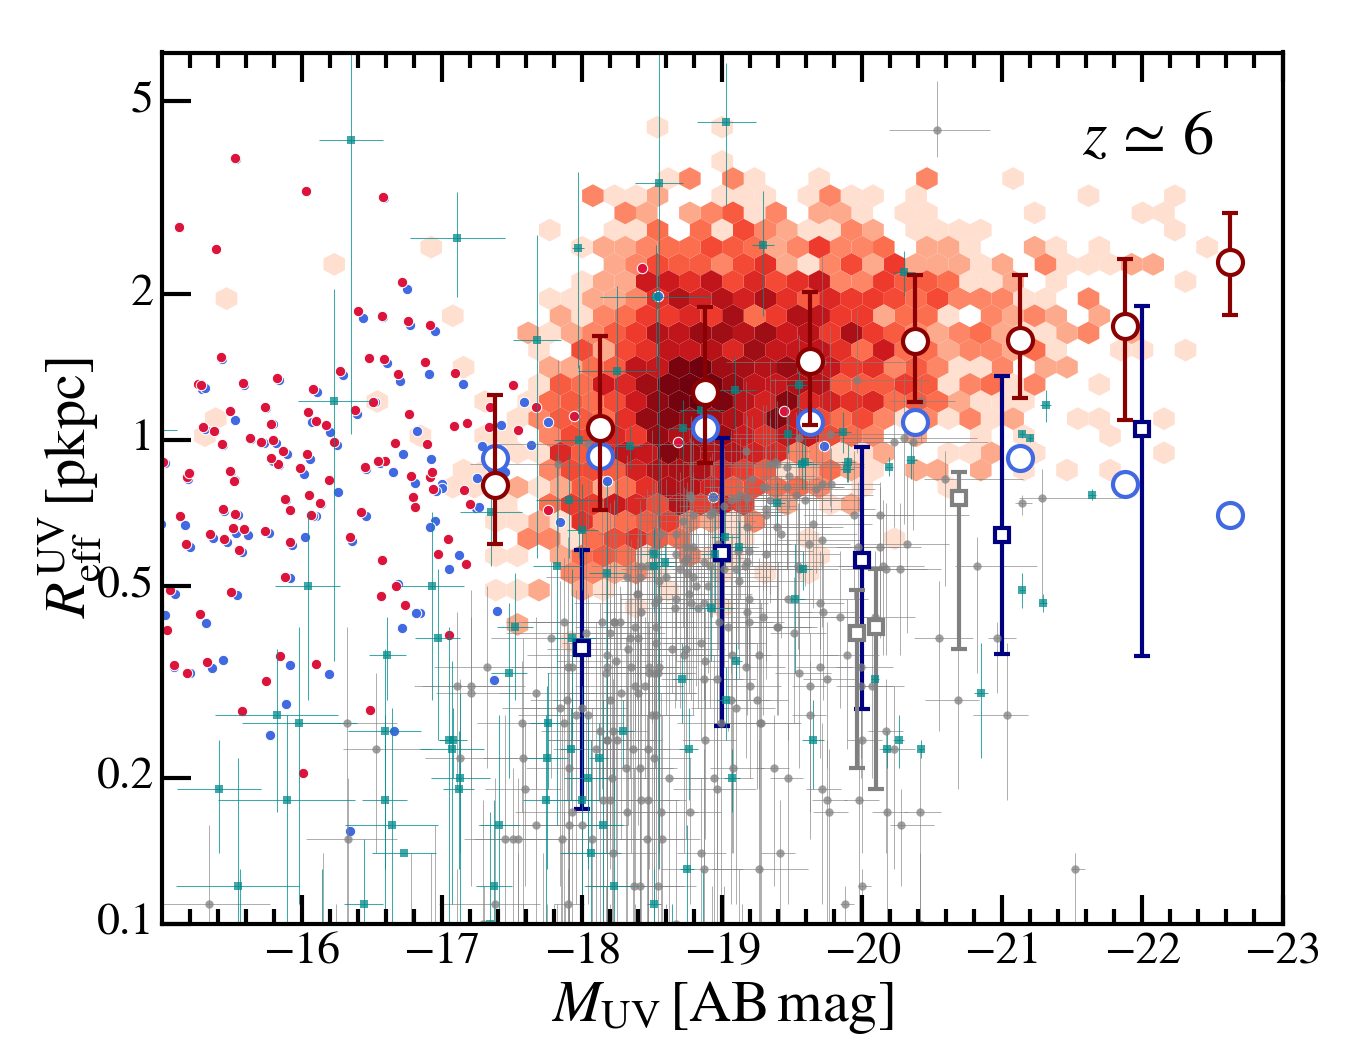
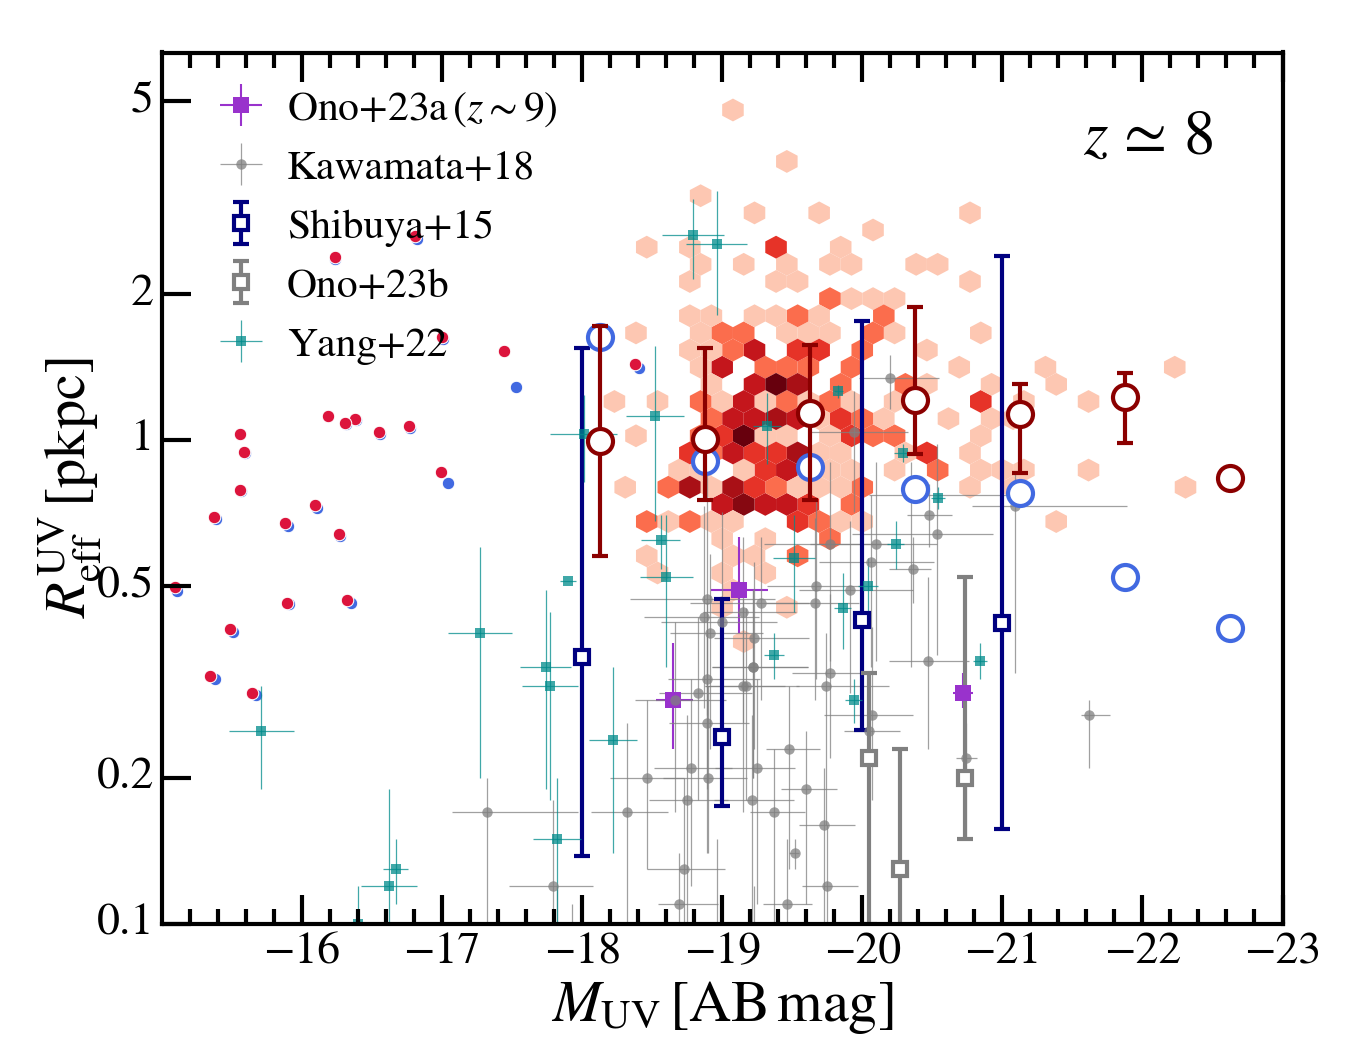
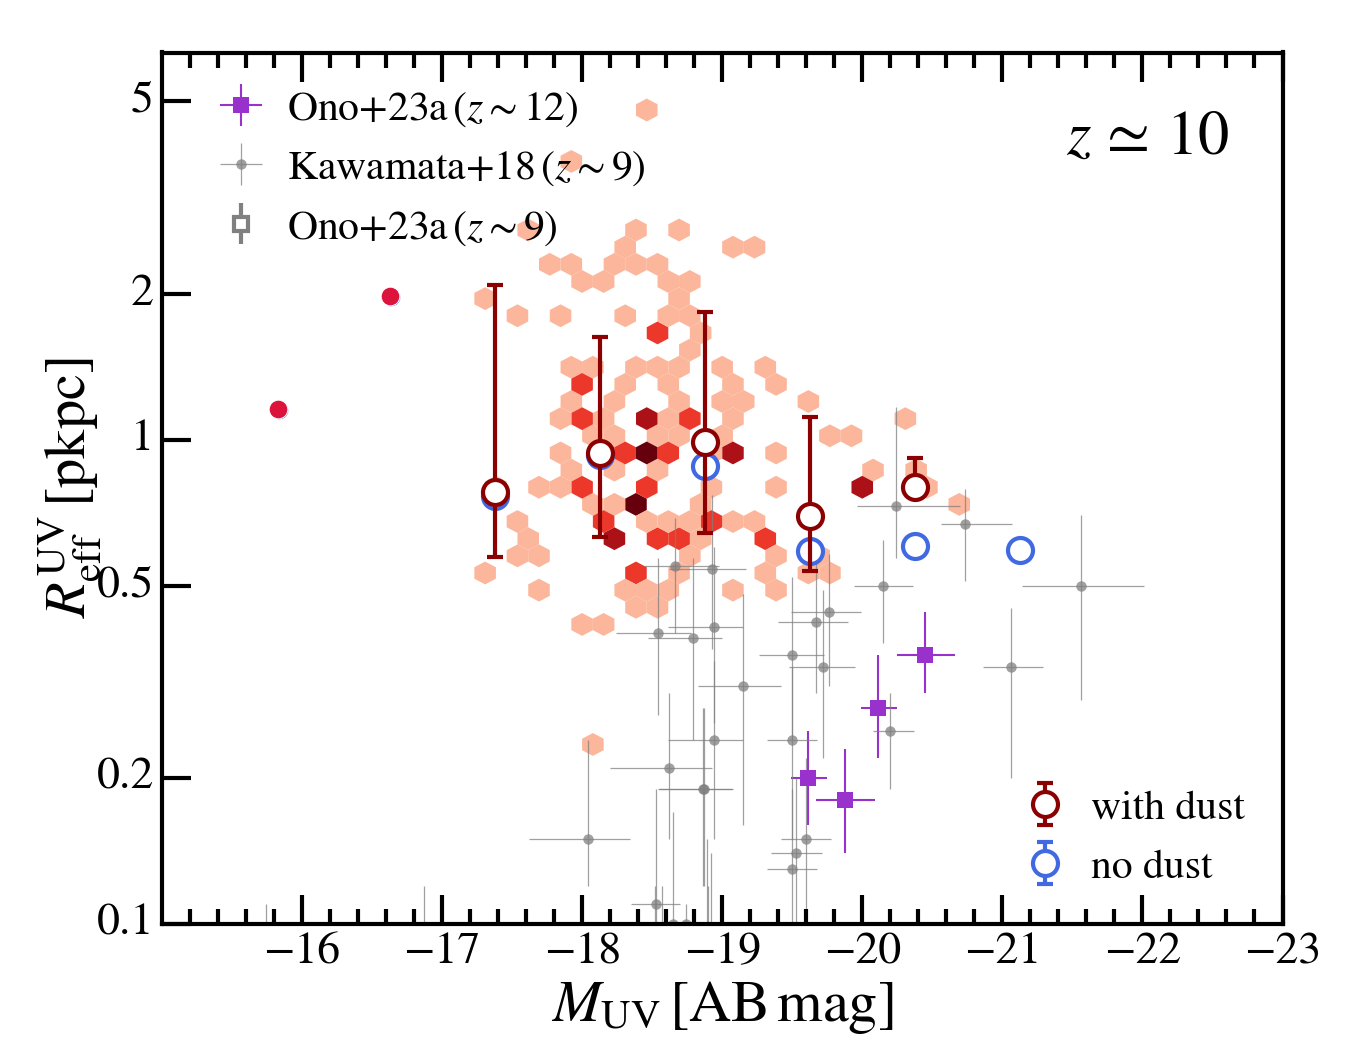
In Figure 15, we show the galaxy relation from the thesan simulations. The absolute UV magnitude is derived by integrating the fluxes of galaxy images in rest-frame UV. Similar to the size–mass relation, the size-luminosity relations after dust attenuation show a mildly positive slope at and are almost flat at . We compare the simulation results with observational data based on HST from Shibuya et al. (2015) and Kawamata et al. (2018) as well as the ones based on JWST from Yang et al. (2022); Ono et al. (2023a, b). Similar discrepancies between simulations and observations are found at the faint end () at about 1- level.
Due to the numerical limitation, the thesan simulations could miss a population of compact galaxies below the convergence scale and the gravitational softening length (as discussed in Section 4), which is indicated by the gray shaded region in the figure. However, the offset between the median relations is robust against numerical effects when taking the thesan-hr results into account. On the other hand, the discrepancy in size could indicate limitations of the feedback model employed by the thesan simulations (and also IllustrisTNG). We note this is not restricted to thesan, but essentially many other simulations shown in Figure 4 fail to produce compact () galaxies at the stellar mass at .
In Ono et al. (2023b), a population of extremely compact () galaxies was compared to the FOREVER22 (Yajima et al., 2022) and Renaissance simulations (Xu et al., 2016; Barrow et al., 2017), which produced a few analogs at higher redshifts () in overdense regions. These galaxies were argued to be formed under the impact of galaxy mergers or interactions. This scenario is similar to the subpopulation of compact galaxies at we find in thesan in extremely overdense regions (see Figure 6). However, they are not representative of the general galaxy population. In contrast, we find that the sizes of the majority of the low-mass galaxies increase during the phase of merger-driven growth and are positively correlated with matter overdensity.
In the SERRA simulation (Pallottini et al., 2022), compact galaxies were consistently produced at with at and were on the other hand slightly below the observational constraints. In the high-resolution variants of the Simba simulations (Davé et al., 2019; Wu et al., 2020), galaxy sizes were found to decrease down to at at . These dramatic and qualitative differences between size predictions of different simulations may indicate incompleteness in many current feedback implementations. The prescriptions configured to prevent excessive star-formation at a similar level might result in rather different kinematic behavior of the gas that fuels star-formation (Rosdahl et al., 2017; Hopkins et al., 2018) and different stellar morphology. This highlights the potential of using galaxy morphology to constrain galaxy formation models at high redshifts.


6.2 Observational factors shaping apparent sizes
In addition to the theoretical uncertainties discussed above, several observational effects could be relevant and cause order unity differences between the intrinsic and observed sizes. We will discuss them in this section. In Figure 16, we show the ratios of galaxy sizes with various definitions. The projection of the galaxy is taken to be the positive direction in the simulation coordinates and effectively represents a random viewing angle when analyzing an ensemble of galaxies. We summarize several key effects that set the difference between the observed galaxy size in certain band (usually rest-frame UV) and the intrinsic half-mass radius.
Projection effects: Since a spherical aperture always contains less mass or light than a cylindrical aperture, projection tends to make galaxies appear smaller. We find that the ratio between the 2D half-mass radius (with random projection) and the 3D one is insensitive to galaxy stellar mass and takes a median value of . This roughly agrees with the estimates in Wolf et al. (2010) assuming spherical symmetry and a variety of surface brightness profiles. This also motivates the multiplication factor we used in comparing different simulations in Section 4.1.
Tracer effects: We compare the in UV (before dust attenuation) with the 2D half-mass radius under the same viewing angle. We aim at understanding how well UV light acts as a tracer of the stellar mass in observations. We find that, at , the UV effective radius is smaller than the stellar mass effective radius and differs by a constant factor of . This is because recent starbursts take place in the central part of the galaxy while the old and potentially ex-situ stars reside in the outer part. At , the ratio gradually increases to unity due to the compaction of the galaxies and that most of the stellar mass is dominated by the recent central starburst.
Dust attenuation: We find that the UV effective radius after dust attenuation is larger than that before dust attenuation. The ratio between the two increases monotonically with stellar mass and can reach at . This is mainly due to the relatively large abundance of dust in dense ISM and their spatial correlation with the young stellar populations. Therefore, dust attenuation is more concentrated in the central region of the galaxy and smooth out the surface brightness profiles of galaxies. As seen in Figure 14, it qualitatively changes the slope of the relation from intrinsically negative to positive, which is more consistent with observations. Similar effects have been discussed extensively in many earlier works (e.g. Wu et al., 2020; Roper et al., 2022; Marshall et al., 2022; Popping et al., 2022; Cochrane et al., 2023).
Observing band: We find a mild ( percent) increase in galaxy in UV compared to the optical V band. The tracer effect discussed above could have a minor impact on the sizes at different wavelengths. However, the trend here is primarily driven by stronger dust attenuation in rest-frame UV. At the mass range around , there is almost no difference between the two since the dust attenuation is minimal in low-mass galaxies. This is in good agreement with observational results at a similar mass scale (Morishita et al., 2023).
Surface brightness bias: Given the background noise, observations could completely miss sources if their peak surface brightness is below the detection limit. We find some signatures of this in Figure 10 as the observed sample cuts off at . This can be translated to the UV surface brightness (using the same Kennicutt 1998 relation adopted in Morishita et al. 2023) , which is close to the detection limit of current JWST surveys 444We perform a simple estimate by taking the 5- point source limiting magnitudes in e.g. Morishita et al. (2023); Ormerod et al. (2023), dividing the corresponding flux limit by the area of the assumed aperture , and converting it to 1- limit. We obtain .. The impact of this incompleteness has been discussed in Kawamata et al. (2018) and can lead to a dex increase in median galaxy sizes at as well as increasing the steepness of the size-luminosity relation.
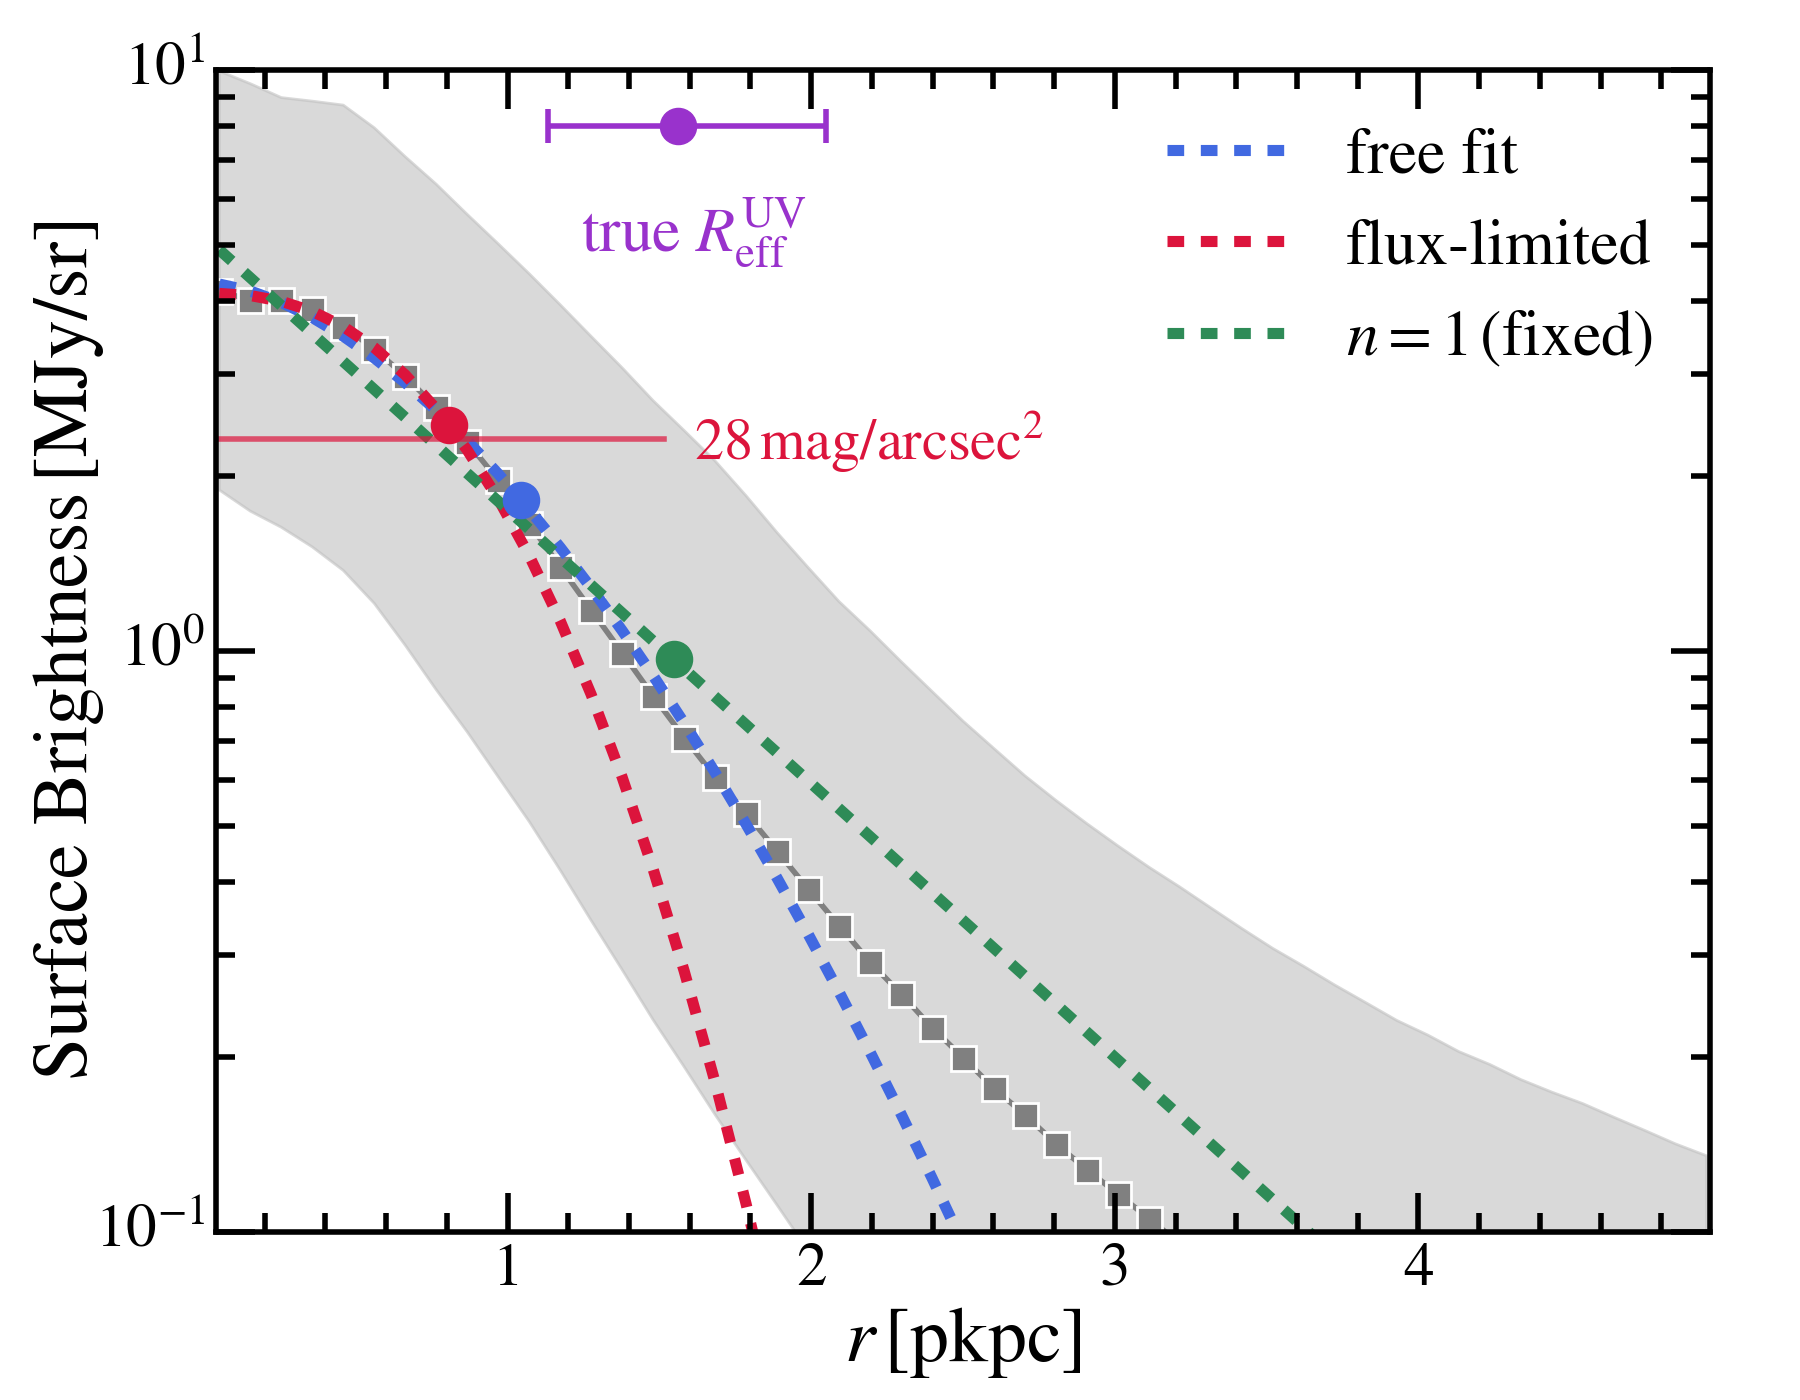
Even for identified sources, the surface brightness profile can only be probed out to a certain radius beyond which extrapolations of the Sérsic profile are required. This can introduce a bias as the fits derived on the central region may fail dramatically at the wings and lead to artificially smaller apparent sizes for intrinsically diffuse galaxies (Roper et al., 2022). In the top panel of Figure 17, we show the stacked surface brightness profile of 200 galaxies with at in thesan-1. After stacking, the surface brightness distribution is roughly axially symmetric and we measure the surface brightness profile in a set of linearly-spacing annuli. We then fit the profile with the Sérsic model. We find that the free fit is already biased by the central bright component and underpredicts the surface brightness at the wing, yielding a small Sérsic index and smaller than the true value. Fixing results in larger fitted that is surprisingly more consistent with the true value, but the fitting overpredicts the surface brightness at the wing. If we limit the fitting to where the flux is above , the best-fit is further biased to smaller values and is about a factor of two smaller than the true . Similar trends are found for galaxies at other stellar mass scales as well. This highlights the potential uncertainties in measuring galaxy sizes by fitting the surface brightness distribution. Optimistically speaking, the simulation predictions and observations could be reconciled by a combination of selection effects and fitting biases associated with the surface brightness limit.
In addition, the clumpy nature of high-redshift galaxies can also bias the size measurements to the separation of individual star-forming complexes or young star clusters (e.g. Vanzella et al., 2017, 2023; Chen et al., 2023; Claeyssens et al., 2023). As discussed in e.g. Curtis-Lake et al. (2016); Ma et al. (2018a), an alternative way to measure size is by calculating the effective area (not necessarily continuous) enclosing half of the total surface brightness. The effective radius is then . This non-parametric approach will be more sensitive to the sizes of individual stellar clumps and less biased by their separations. We compare this with the fiducial method in the bottom panel of Figure 17. We find that the size measured with this approach can be slightly smaller than our fiducial approach, but not enough to explain the discrepancy between simulations and observations. But we cannot rule out the possibility that thesan underpredicts the clumpiness of the stellar distribution.
Unresolved sources: AGN acts as a point source in galaxy photometry. In the observational sample, Morishita et al. (2023) used the [OIII]–H ratios and the mass-extinction diagram to demonstrate that their compact sources are not AGN or have little light contribution from AGN. From simulations, we calculate the bolometric luminosities of the SMBH in simulations as
| (9) |
where is the feedback efficiency in the high-accretion quasar mode (Weinberger et al., 2017) and is the radiative efficiency, assumed to be in thesan (Kannan et al., 2022a). We then convert this to the rest-frame UV luminosity using the bolometric corrections in Shen et al. (2020a). We neglect dust extinction here and the AGN luminosity should be interpreted as an upper limit.
As previously shown in section 4.2, SMBH accretion rates are found higher in massive compact galaxies. However, even neglecting dust extinction, we find that the UV luminosities of AGN in thesan-1 are at least one order of magnitude smaller than the UV luminosities of galaxies at all stellar masses. If the AGN luminosity is subdominant compared to the galaxy luminosity, it should not have any impact on the half-light radius of the galaxy. But this statement strongly depends on the physics model for SMBH growth and feedback employed in thesan, and is subjected to great uncertainties. The actual impact of unresolved AGN contamination could be significant. For example, in the case study of GN-z11, the two-component (a point source plus an extended component) fitting leads to about three times larger effective radius of the galaxy (Tacchella et al., 2023b).
We can estimate the potential impact of unresolved sources by computing the radius containing () percent of the total light, which corresponds to the contamination of a point source at the centre of the galaxy with () percent of the total galaxy light. We show the comparison in the bottom panel of Figure 17. We find that percent of contamination can result in about a factor of two smaller galaxy sizes across the whole stellar mass range. However, even with this ambitious assumption of point source contamination, this is not enough to explain the discrepancy with observations.
7 Conclusions
In this paper, we provide a thorough analysis of galaxy intrinsic and apparent sizes at based on the thesan simulations. We study the correlation of galaxy size with various galaxy properties and the large-scale environments they reside in. We investigate the physical mechanisms that determine the angular momentum transport in galaxies and drive the compaction in massive galaxies. Through comparison with observations, we find a discrepancy between the galaxy size predictions of thesan and observations at the low-mass/faint end. Our key findings can be summarized below.
-
•
Intrinsic size–mass relation: The intrinsic half-mass radius increases (decreases) with galaxy stellar mass in low-mass (massive) galaxies. The breaking point of the two trends is around and is insensitive to redshift. The redshift evolution at the low-mass end is mild. The most massive galaxies in the simulation volume continuously become more compact from to and eventually reach . In the volume of thesan-1, four of these compact massive galaxies at are found to be quenched. Although the limitation of numerical resolution of the thesan-1 simulation could make the simulation miss a subpopulation of extremely compact galaxies, the median size mass relations derived from our simulations show good agreement with the high-resolution thesan-hr simulation using identical physics and other cosmological simulations with different physics input and resolution.
-
•
Correlation with galaxy properties: More compact galaxies tend to have lower halo spin at fixed stellar mass, which qualitatively agrees with the classical disk formation theory. In addition, more compact galaxies have lower sSFR, stronger AGN activity, lower gas abundance, and larger gas disk fraction. This suggests stronger feedback regulation after a period of centralized star-formation and rapid gas depletion, likely driven by the gravitational instability in gas disks. By tracking the evolution of the main progenitors of galaxies selected at , we find that compact (quenched) galaxies typically undergo three phases of size evolution, the initial growth of mass and size driven by mergers and accretion, the rapid gas depletion and compaction phase, and quenching after reaching a characteristic stellar surface density.
-
•
Correlation with environmental properties: Galaxies in denser environments tend to have more extended stellar distributions. The evolution track of massive galaxies all show an early phase of size growth with frequent minor or major mergers, and later more compact galaxies have quieter merger histories.
-
•
Comparison to analytical models: A deeper analysis of the size-spin correlation shows that the sizes of massive galaxies agree roughly with the prediction of the analytical disk formation theory. Though the most massive compact galaxy population experiences substantial loss in specific angular momentum. However, the sizes of low-mass galaxies barely correlate with the halo spin and are more consistent with a spherical shell model with galaxy sizes set by the shock radius of cold gas inflow and feedback-driven outflow. Therefore, the hump-like feature in the intrinsic size–mass relation can be explained by a merger-driven, spherical shock model for size growth of low-mass galaxies and a disk instability-driven compaction track of massive galaxies.
-
•
Gas angular momentum profile: We investigate the specific angular momentum profiles of dark matter, gas, and stars of simulated galaxies, We find a clear decoupling of gas and dark matter at and the slow alignment of gas angular momentum with the central stellar disk. This phenomenon likely corresponds to the inflowing cold gas streams that roughly conserve angular momentum before mixing with the lower-angular momentum gas accreted earlier at radii below the impact parameter. The stellar specific angular momentum is about times smaller than that of gas, which is a consequence of both feedback-driven outflow and disk instability. Low-mass galaxies have poorer spin alignment with the overall spin of the galaxy and this is consistent with their sizes better determined by the spherical shell model.
-
•
Discrepancy with observations: We compute the apparent sizes of galaxies based on mock images generated using the Monte-Carlo radiative transfer method. The negative slope of the intrinsic size–mass relation is overturned by dust attenuation and we find a mild positive correlation between the UV effective radius and galaxy stellar mass as found in observations. A combination of projection effects, tracer effects, dust attenuation, and band selection can lead to order unity differences between the measured galaxy size and the intrinsic one, with non-trivial stellar mass dependence. The median apparent sizes of galaxies in rest-frame UV are at least three times larger than the observed ones at or at . Such a discrepancy is robust against numerical uncertainties and exists in many other cosmological simulations with various physics inputs, simulation techniques, and numeric resolutions. Other than physical reasons, the selection effects and fitting biases associated with the surface brightness limit of existing galaxy surveys could be the major observational factors driving this discrepancy.
The size–mass and size–luminosity relations during the epoch of reionization in the thesan simulations show distinct features compared to those observed at lower redshifts. These relations reveal a two-phase behavior where the sizes of low-mass galaxies are significantly influenced by the strength of feedback-driven outflows, whereas the sizes of more massive galaxies are affected by internal disk instability. These findings are especially relevant in the era of JWST, providing an opportunity to enhance our understanding of galaxy formation through observations of galaxy sizes or morphology in general at high redshifts.
Acknowledgements
The computations in this paper were run on the Engaging cluster at Massachusetts Institute of Technology (MIT). MV acknowledges support through the National Aeronautics and Space Administration (NASA) Astrophysics Theory Program (ATP) 19-ATP19-0019, 19-ATP19-0020, 19-ATP19-0167, and the National Science Foundation (NSF) grants AST-1814053, AST-1814259, AST-1909831, AST-2007355, and AST-2107724.
Software citations:
Data Availability
The data underlying this paper can be shared upon request to the corresponding author of this paper. The thesan simulation data is publicly available at https://www.thesan-project.com/. The post-processed data and analysis scripts are stored on the Engaging cluster at MIT.
References
- Agertz & Kravtsov (2016) Agertz O., Kravtsov A. V., 2016, ApJ, 824, 79
- Allen et al. (2017) Allen R. J., et al., 2017, ApJ, 834, L11
- Astropy Collaboration et al. (2013) Astropy Collaboration et al., 2013, A&A, 558, A33
- Astropy Collaboration et al. (2018) Astropy Collaboration et al., 2018, AJ, 156, 123
- Astropy Collaboration et al. (2022) Astropy Collaboration et al., 2022, ApJ, 935, 167
- Baes et al. (2011) Baes M., Verstappen J., De Looze I., Fritz J., Saftly W., Vidal Pérez E., Stalevski M., Valcke S., 2011, ApJS, 196, 22
- Baggen et al. (2023) Baggen J. F. W., et al., 2023, arXiv e-prints, p. arXiv:2305.17162
- Baker et al. (2023) Baker W. M., et al., 2023, arXiv e-prints, p. arXiv:2306.02472
- Barnes & Efstathiou (1987) Barnes J., Efstathiou G., 1987, ApJ, 319, 575
- Barnes & Hut (1986) Barnes J., Hut P., 1986, Nature, 324, 446
- Barrow et al. (2017) Barrow K. S. S., Wise J. H., Norman M. L., O’Shea B. W., Xu H., 2017, MNRAS, 469, 4863
- Barrow et al. (2020) Barrow K. S. S., Robertson B. E., Ellis R. S., Nakajima K., Saxena A., Stark D. P., Tang M., 2020, ApJ, 902, L39
- Benson (2012) Benson A. J., 2012, New Astronomy, 17, 175
- Bett et al. (2010) Bett P., Eke V., Frenk C. S., Jenkins A., Okamoto T., 2010, MNRAS, 404, 1137
- Binney & Tremaine (1987) Binney J., Tremaine S., 1987, Galactic dynamics. Princeton University Press
- Borrow & Borrisov (2020) Borrow J., Borrisov A., 2020, Journal of Open Source Software, 5, 2430
- Borrow & Kelly (2021) Borrow J., Kelly A. J., 2021, arXiv e-prints, p. arXiv:2106.05281
- Borrow et al. (2022) Borrow J., Kannan R., Garaldi E., Smith A., Vogelsberger M., Pakmor R., Springel V., Hernquist L., 2022, arXiv e-prints, p. arXiv:2212.03255
- Bouwens et al. (2022) Bouwens R. J., Illingworth G. D., van Dokkum P. G., Oesch P. A., Stefanon M., Ribeiro B., 2022, ApJ, 927, 81
- Bromm & Yoshida (2011) Bromm V., Yoshida N., 2011, ARA&A, 49, 373
- Brook et al. (2011) Brook C. B., et al., 2011, MNRAS, 415, 1051
- Brook et al. (2012) Brook C. B., Stinson G., Gibson B. K., Roškar R., Wadsley J., Quinn T., 2012, MNRAS, 419, 771
- Bruce et al. (2012) Bruce V. A., et al., 2012, MNRAS, 427, 1666
- Bullock et al. (2001) Bullock J. S., Dekel A., Kolatt T. S., Kravtsov A. V., Klypin A. A., Porciani C., Primack J. R., 2001, ApJ, 555, 240
- Byler et al. (2017) Byler N., Dalcanton J. J., Conroy C., Johnson B. D., 2017, ApJ, 840, 44
- Camps & Baes (2015) Camps P., Baes M., 2015, Astronomy and Computing, 9, 20
- Ceverino et al. (2010) Ceverino D., Dekel A., Bournaud F., 2010, MNRAS, 404, 2151
- Chen et al. (2023) Chen Z., Stark D. P., Endsley R., Topping M., Whitler L., Charlot S., 2023, MNRAS, 518, 5607
- Claeyssens et al. (2023) Claeyssens A., Adamo A., Richard J., Mahler G., Messa M., Dessauges-Zavadsky M., 2023, MNRAS, 520, 2180
- Cochrane et al. (2023) Cochrane R. K., et al., 2023, MNRAS, 523, 2409
- Conroy et al. (2009) Conroy C., Gunn J. E., White M., 2009, ApJ, 699, 486
- Cortese et al. (2016) Cortese L., et al., 2016, MNRAS, 463, 170
- Costantin et al. (2022) Costantin L., et al., 2022, ApJ, 929, 121
- Curtis-Lake et al. (2016) Curtis-Lake E., et al., 2016, MNRAS, 457, 440
- Danovich et al. (2015) Danovich M., Dekel A., Hahn O., Ceverino D., Primack J., 2015, MNRAS, 449, 2087
- Davé et al. (2019) Davé R., Anglés-Alcázar D., Narayanan D., Li Q., Rafieferantsoa M. H., Appleby S., 2019, MNRAS, 486, 2827
- Davis et al. (1985) Davis M., Efstathiou G., Frenk C. S., White S. D. M., 1985, ApJ, 292, 371
- Dekel & Birnboim (2006) Dekel A., Birnboim Y., 2006, MNRAS, 368, 2
- Dekel & Burkert (2014) Dekel A., Burkert A., 2014, MNRAS, 438, 1870
- Dekel et al. (2009a) Dekel A., et al., 2009a, Nature, 457, 451
- Dekel et al. (2009b) Dekel A., Sari R., Ceverino D., 2009b, ApJ, 703, 785
- Dekel et al. (2023) Dekel A., Sarkar K. C., Birnboim Y., Mandelker N., Li Z., 2023, MNRAS, 523, 3201
- Diemer & Joyce (2019) Diemer B., Joyce M., 2019, ApJ, 871, 168
- Donnari et al. (2019) Donnari M., et al., 2019, MNRAS, 485, 4817
- Doroshkevich (1970) Doroshkevich A. G., 1970, Astrophysics, 6, 320
- Draine & Li (2007) Draine B. T., Li A., 2007, ApJ, 657, 810
- Dutton & Macciò (2014) Dutton A. A., Macciò A. V., 2014, MNRAS, 441, 3359
- Dutton et al. (2007) Dutton A. A., van den Bosch F. C., Dekel A., Courteau S., 2007, ApJ, 654, 27
- El-Badry et al. (2018) El-Badry K., et al., 2018, MNRAS, 473, 1930
- Eldridge et al. (2017) Eldridge J. J., Stanway E. R., Xiao L., McClelland L. A. S., Taylor G., Ng M., Greis S. M. L., Bray J. C., 2017, Publ. Astron. Soc. Australia, 34, e058
- Emami et al. (2019) Emami N., Siana B., Weisz D. R., Johnson B. D., Ma X., El-Badry K., 2019, ApJ, 881, 71
- Faisst et al. (2017) Faisst A. L., Carollo C. M., Capak P. L., Tacchella S., Renzini A., Ilbert O., McCracken H. J., Scoville N. Z., 2017, ApJ, 839, 71
- Fall & Efstathiou (1980) Fall S. M., Efstathiou G., 1980, MNRAS, 193, 189
- Fang et al. (2018) Fang J. J., et al., 2018, ApJ, 858, 100
- Ferrara (2023) Ferrara A., 2023, arXiv e-prints, p. arXiv:2310.12197
- Finkelstein et al. (2022) Finkelstein S. L., et al., 2022, ApJ, 940, L55
- Flores Velázquez et al. (2021) Flores Velázquez J. A., et al., 2021, MNRAS, 501, 4812
- Franx et al. (2008) Franx M., van Dokkum P. G., Förster Schreiber N. M., Wuyts S., Labbé I., Toft S., 2008, ApJ, 688, 770
- Fujimoto et al. (2023) Fujimoto S., et al., 2023, ApJ, 949, L25
- Garaldi et al. (2022) Garaldi E., Kannan R., Smith A., Springel V., Pakmor R., Vogelsberger M., Hernquist L., 2022, MNRAS, 512, 4909
- Garaldi et al. (2023) Garaldi E., et al., 2023, arXiv e-prints, p. arXiv:2309.06475
- Genel et al. (2018) Genel S., et al., 2018, MNRAS, 474, 3976
- Gnedin (2014) Gnedin N. Y., 2014, ApJ, 793, 29
- Godunov & Bohachevsky (1959) Godunov S. K., Bohachevsky I., 1959, Matematičeskij sbornik, 47(89), 271
- Goldreich & Lynden-Bell (1965) Goldreich P., Lynden-Bell D., 1965, MNRAS, 130, 97
- Governato et al. (2010) Governato F., et al., 2010, Nature, 463, 203
- Greene et al. (2023) Greene J. E., et al., 2023, arXiv e-prints, p. arXiv:2309.05714
- Guedes et al. (2011) Guedes J., Callegari S., Madau P., Mayer L., 2011, ApJ, 742, 76
- Guo et al. (2011) Guo Q., et al., 2011, MNRAS, 413, 101
- Harikane et al. (2023) Harikane Y., et al., 2023, ApJ, 959, 39
- Harris et al. (2020) Harris C. R., et al., 2020, Nature, 585, 357
- Hill et al. (2017) Hill A. R., et al., 2017, ApJ, 837, 147
- Hopkins et al. (2018) Hopkins P. F., et al., 2018, MNRAS, 477, 1578
- Hopkins et al. (2023) Hopkins P. F., et al., 2023, MNRAS, 525, 2241
- Hoyle (1951) Hoyle F., 1951, in Problems of Cosmical Aerodynamics. p. 195
- Huertas-Company et al. (2023) Huertas-Company M., et al., 2023, arXiv e-prints, p. arXiv:2305.02478
- Hunter (2007) Hunter J. D., 2007, Computing in Science & Engineering, 9, 90
- Iyer et al. (2020) Iyer K. G., et al., 2020, MNRAS, 498, 430
- Jiang et al. (2019) Jiang F., et al., 2019, MNRAS, 488, 4801
- Jonsson et al. (2010) Jonsson P., Groves B. A., Cox T. J., 2010, MNRAS, 403, 17
- Kannan et al. (2019) Kannan R., Vogelsberger M., Marinacci F., McKinnon R., Pakmor R., Springel V., 2019, MNRAS, 485, 117
- Kannan et al. (2022a) Kannan R., Garaldi E., Smith A., Pakmor R., Springel V., Vogelsberger M., Hernquist L., 2022a, MNRAS, 511, 4005
- Kannan et al. (2022b) Kannan R., Smith A., Garaldi E., Shen X., Vogelsberger M., Pakmor R., Springel V., Hernquist L., 2022b, MNRAS, 514, 3857
- Kannan et al. (2023) Kannan R., et al., 2023, MNRAS, 524, 2594
- Katz et al. (2020) Katz H., et al., 2020, MNRAS, 494, 2200
- Kauffmann et al. (2003) Kauffmann G., et al., 2003, MNRAS, 341, 54
- Kawamata et al. (2018) Kawamata R., Ishigaki M., Shimasaku K., Oguri M., Ouchi M., Tanigawa S., 2018, ApJ, 855, 4
- Kennicutt (1998) Kennicutt Robert C. J., 1998, ARA&A, 36, 189
- Kereš et al. (2005) Kereš D., Katz N., Weinberg D. H., Davé R., 2005, MNRAS, 363, 2
- Kereš et al. (2009) Kereš D., Katz N., Fardal M., Davé R., Weinberg D. H., 2009, MNRAS, 395, 160
- Kimm et al. (2011) Kimm T., Devriendt J., Slyz A., Pichon C., Kassin S. A., Dubois Y., 2011, arXiv e-prints, p. arXiv:1106.0538
- Kocevski et al. (2023) Kocevski D. D., et al., 2023, ApJ, 954, L4
- Kokorev et al. (2024) Kokorev V., et al., 2024, arXiv e-prints, p. arXiv:2401.09981
- Kravtsov (2013) Kravtsov A. V., 2013, ApJ, 764, L31
- Krumholz et al. (2018) Krumholz M. R., Burkhart B., Forbes J. C., Crocker R. M., 2018, MNRAS, 477, 2716
- Kulkarni et al. (2019) Kulkarni G., Worseck G., Hennawi J. F., 2019, MNRAS, 488, 1035
- Labbe et al. (2023) Labbe I., et al., 2023, arXiv e-prints, p. arXiv:2306.07320
- Lagos et al. (2017) Lagos C. d. P., Theuns T., Stevens A. R. H., Cortese L., Padilla N. D., Davis T. A., Contreras S., Croton D., 2017, MNRAS, 464, 3850
- Lange et al. (2015) Lange R., et al., 2015, MNRAS, 447, 2603
- Lapiner et al. (2023) Lapiner S., et al., 2023, MNRAS,
- Levermore (1984) Levermore C. D., 1984, J. Quant. Spectrosc. Radiative Transfer, 31, 149
- Li et al. (2023) Li Z., Dekel A., Sarkar K. C., Aung H., Giavalisco M., Mandelker N., Tacchella S., 2023, arXiv e-prints, p. arXiv:2311.14662
- Lovell et al. (2021) Lovell C. C., Vijayan A. P., Thomas P. A., Wilkins S. M., Barnes D. J., Irodotou D., Roper W., 2021, MNRAS, 500, 2127
- Ludlow et al. (2019a) Ludlow A. D., Schaye J., Schaller M., Richings J., 2019a, MNRAS, 488, L123
- Ludlow et al. (2019b) Ludlow A. D., Schaye J., Bower R., 2019b, MNRAS, 488, 3663
- Ludlow et al. (2020) Ludlow A. D., Schaye J., Schaller M., Bower R., 2020, MNRAS, 493, 2926
- Ludlow et al. (2023) Ludlow A. D., Fall S. M., Wilkinson M. J., Schaye J., Obreschkow D., 2023, arXiv e-prints, p. arXiv:2306.05753
- Ma et al. (2018a) Ma X., et al., 2018a, MNRAS, 477, 219
- Ma et al. (2018b) Ma X., et al., 2018b, MNRAS, 478, 1694
- Ma et al. (2020) Ma X., Quataert E., Wetzel A., Hopkins P. F., Faucher-Giguère C.-A., Kereš D., 2020, MNRAS, 498, 2001
- Macciò et al. (2007) Macciò A. V., Dutton A. A., van den Bosch F. C., Moore B., Potter D., Stadel J., 2007, MNRAS, 378, 55
- Madau (1995) Madau P., 1995, ApJ, 441, 18
- Maiolino et al. (2023) Maiolino R., et al., 2023, arXiv e-prints, p. arXiv:2308.01230
- Maller et al. (2002) Maller A. H., Dekel A., Somerville R., 2002, MNRAS, 329, 423
- Mandelker et al. (2018) Mandelker N., van Dokkum P. G., Brodie J. P., van den Bosch F. C., Ceverino D., 2018, ApJ, 861, 148
- Marinacci et al. (2018) Marinacci F., et al., 2018, MNRAS, 480, 5113
- Marshall et al. (2022) Marshall M. A., Wilkins S., Di Matteo T., Roper W. J., Vijayan A. P., Ni Y., Feng Y., Croft R. A. C., 2022, MNRAS, 511, 5475
- Martig et al. (2009) Martig M., Bournaud F., Teyssier R., Dekel A., 2009, ApJ, 707, 250
- Matthee et al. (2023) Matthee J., et al., 2023, arXiv e-prints, p. arXiv:2306.05448
- Mestel (1963) Mestel L., 1963, MNRAS, 126, 553
- Mo et al. (1998) Mo H. J., Mao S., White S. D. M., 1998, MNRAS, 295, 319
- Morishita et al. (2014) Morishita T., Ichikawa T., Kajisawa M., 2014, ApJ, 785, 18
- Morishita et al. (2023) Morishita T., et al., 2023, arXiv e-prints, p. arXiv:2308.05018
- Mosleh et al. (2012) Mosleh M., et al., 2012, ApJ, 756, L12
- Mosleh et al. (2020) Mosleh M., Hosseinnejad S., Hosseini-ShahiSavandi S. Z., Tacchella S., 2020, ApJ, 905, 170
- Mowla et al. (2019) Mowla L. A., et al., 2019, ApJ, 880, 57
- Naidu et al. (2022) Naidu R. P., et al., 2022, ApJ, 940, L14
- Naiman et al. (2018) Naiman J. P., et al., 2018, MNRAS, 477, 1206
- Nelson et al. (2015) Nelson D., Genel S., Vogelsberger M., Springel V., Sijacki D., Torrey P., Hernquist L., 2015, MNRAS, 448, 59
- Nelson et al. (2018) Nelson D., et al., 2018, MNRAS, 475, 624
- Nelson et al. (2019) Nelson D., et al., 2019, Computational Astrophysics and Cosmology, 6, 2
- Neyer et al. (2023) Neyer M., et al., 2023, arXiv e-prints, p. arXiv:2310.03783
- Niida et al. (2020) Niida M., et al., 2020, ApJ, 904, 89
- Obreschkow & Glazebrook (2014) Obreschkow D., Glazebrook K., 2014, ApJ, 784, 26
- Oesch et al. (2010) Oesch P. A., et al., 2010, ApJ, 709, L21
- Ono et al. (2013) Ono Y., et al., 2013, ApJ, 777, 155
- Ono et al. (2023a) Ono Y., et al., 2023a, arXiv e-prints, p. arXiv:2309.02790
- Ono et al. (2023b) Ono Y., et al., 2023b, ApJ, 951, 72
- Ormerod et al. (2023) Ormerod K., et al., 2023, arXiv e-prints, p. arXiv:2309.04377
- Pallottini et al. (2022) Pallottini A., et al., 2022, MNRAS, 513, 5621
- Pawlik et al. (2017) Pawlik A. H., Rahmati A., Schaye J., Jeon M., Dalla Vecchia C., 2017, MNRAS, 466, 960
- Peebles (1969) Peebles P. J. E., 1969, ApJ, 155, 393
- Pillepich et al. (2018a) Pillepich A., et al., 2018a, MNRAS, 473, 4077
- Pillepich et al. (2018b) Pillepich A., et al., 2018b, MNRAS, 475, 648
- Pillepich et al. (2019) Pillepich A., et al., 2019, MNRAS, 490, 3196
- Planck Collaboration et al. (2016) Planck Collaboration et al., 2016, A&A, 594, A13
- Pontzen & Governato (2014) Pontzen A., Governato F., 2014, Nature, 506, 171
- Popping et al. (2022) Popping G., et al., 2022, MNRAS, 510, 3321
- Power et al. (2003) Power C., Navarro J. F., Jenkins A., Frenk C. S., White S. D. M., Springel V., Stadel J., Quinn T., 2003, MNRAS, 338, 14
- Reddy et al. (2023) Reddy N. A., Topping M. W., Sanders R. L., Shapley A. E., Brammer G., 2023, ApJ, 952, 167
- Rémy-Ruyer et al. (2014) Rémy-Ruyer A., et al., 2014, A&A, 563, A31
- Rigby et al. (2023) Rigby J., et al., 2023, PASP, 135, 048001
- Robertson et al. (2023a) Robertson B. E., et al., 2023a, Nature Astronomy, 7, 611
- Robertson et al. (2023b) Robertson B. E., et al., 2023b, ApJ, 942, L42
- Romanowsky & Fall (2012) Romanowsky A. J., Fall S. M., 2012, ApJS, 203, 17
- Romeo & Wiegert (2011) Romeo A. B., Wiegert J., 2011, MNRAS, 416, 1191
- Roper et al. (2022) Roper W. J., Lovell C. C., Vijayan A. P., Marshall M. A., Irodotou D., Kuusisto J. K., Thomas P. A., Wilkins S. M., 2022, MNRAS, 514, 1921
- Roper et al. (2023) Roper W. J., et al., 2023, MNRAS, 526, 6128
- Rosdahl et al. (2017) Rosdahl J., Schaye J., Dubois Y., Kimm T., Teyssier R., 2017, MNRAS, 466, 11
- Rosdahl et al. (2018) Rosdahl J., et al., 2018, MNRAS, 479, 994
- Rosdahl et al. (2022) Rosdahl J., et al., 2022, MNRAS, 515, 2386
- Saftly et al. (2014) Saftly W., Baes M., Camps P., 2014, A&A, 561, A77
- Schaye et al. (2015) Schaye J., et al., 2015, MNRAS, 446, 521
- Sharma & Steinmetz (2005) Sharma S., Steinmetz M., 2005, ApJ, 628, 21
- Shen et al. (2003) Shen S., Mo H. J., White S. D. M., Blanton M. R., Kauffmann G., Voges W., Brinkmann J., Csabai I., 2003, MNRAS, 343, 978
- Shen et al. (2020a) Shen X., Hopkins P. F., Faucher-Giguère C.-A., Alexander D. M., Richards G. T., Ross N. P., Hickox R. C., 2020a, MNRAS, 495, 3252
- Shen et al. (2020b) Shen X., et al., 2020b, MNRAS, 495, 4747
- Shen et al. (2022) Shen X., Vogelsberger M., Nelson D., Tacchella S., Hernquist L., Springel V., Marinacci F., Torrey P., 2022, MNRAS, 510, 5560
- Shen et al. (2023) Shen X., Vogelsberger M., Boylan-Kolchin M., Tacchella S., Kannan R., 2023, MNRAS, 525, 3254
- Shen et al. (2024) Shen X., et al., 2024, MNRAS, 527, 2835
- Shibuya et al. (2015) Shibuya T., Ouchi M., Harikane Y., 2015, ApJS, 219, 15
- Smit et al. (2016) Smit R., Bouwens R. J., Labbé I., Franx M., Wilkins S. M., Oesch P. A., 2016, ApJ, 833, 254
- Smith et al. (2008) Smith B., Sigurdsson S., Abel T., 2008, MNRAS, 385, 1443
- Smith et al. (2019) Smith A., Ma X., Bromm V., Finkelstein S. L., Hopkins P. F., Faucher-Giguère C.-A., Kereš D., 2019, MNRAS, 484, 39
- Smith et al. (2022) Smith A., Kannan R., Garaldi E., Vogelsberger M., Pakmor R., Springel V., Hernquist L., 2022, MNRAS, 512, 3243
- Somerville et al. (2008) Somerville R. S., Hopkins P. F., Cox T. J., Robertson B. E., Hernquist L., 2008, MNRAS, 391, 481
- Somerville et al. (2018) Somerville R. S., et al., 2018, MNRAS, 473, 2714
- Sparre et al. (2017) Sparre M., Hayward C. C., Feldmann R., Faucher-Giguère C.-A., Muratov A. L., Kereš D., Hopkins P. F., 2017, MNRAS, 466, 88
- Springel (2005) Springel V., 2005, MNRAS, 364, 1105
- Springel (2010) Springel V., 2010, MNRAS, 401, 791
- Springel & Hernquist (2003) Springel V., Hernquist L., 2003, MNRAS, 339, 289
- Springel et al. (2001) Springel V., Yoshida N., White S. D. M., 2001, New Astronomy, 6, 79
- Springel et al. (2018) Springel V., et al., 2018, MNRAS, 475, 676
- Springel et al. (2021) Springel V., Pakmor R., Zier O., Reinecke M., 2021, MNRAS, 506, 2871
- Stern et al. (2021) Stern J., et al., 2021, ApJ, 911, 88
- Stewart et al. (2013) Stewart K. R., Brooks A. M., Bullock J. S., Maller A. H., Diemand J., Wadsley J., Moustakas L. A., 2013, ApJ, 769, 74
- Sun et al. (2023a) Sun J., et al., 2023a, ApJ, 945, L19
- Sun et al. (2023b) Sun G., Faucher-Giguère C.-A., Hayward C. C., Shen X., Wetzel A., Cochrane R. K., 2023b, ApJ, 955, L35
- Tacchella et al. (2016) Tacchella S., Dekel A., Carollo C. M., Ceverino D., DeGraf C., Lapiner S., Mandelker N., Primack J. R., 2016, MNRAS, 458, 242
- Tacchella et al. (2019) Tacchella S., et al., 2019, MNRAS, 487, 5416
- Tacchella et al. (2020) Tacchella S., Forbes J. C., Caplar N., 2020, MNRAS, 497, 698
- Tacchella et al. (2022) Tacchella S., et al., 2022, ApJ, 927, 170
- Tacchella et al. (2023a) Tacchella S., et al., 2023a, MNRAS, 522, 6236
- Tacchella et al. (2023b) Tacchella S., et al., 2023b, ApJ, 952, 74
- Teklu et al. (2015) Teklu A. F., Remus R.-S., Dolag K., Beck A. M., Burkert A., Schmidt A. S., Schulze F., Steinborn L. K., 2015, ApJ, 812, 29
- Toomre (1964) Toomre A., 1964, ApJ, 139, 1217
- Treu et al. (2023) Treu T., et al., 2023, ApJ, 942, L28
- Vanzella et al. (2017) Vanzella E., et al., 2017, MNRAS, 467, 4304
- Vanzella et al. (2023) Vanzella E., et al., 2023, ApJ, 945, 53
- Vijayan et al. (2021) Vijayan A. P., Lovell C. C., Wilkins S. M., Thomas P. A., Barnes D. J., Irodotou D., Kuusisto J., Roper W. J., 2021, MNRAS, 501, 3289
- Virtanen et al. (2020) Virtanen P., et al., 2020, Nature Methods, 17, 261
- Vitvitska et al. (2002) Vitvitska M., Klypin A. A., Kravtsov A. V., Wechsler R. H., Primack J. R., Bullock J. S., 2002, ApJ, 581, 799
- Vogelsberger et al. (2013) Vogelsberger M., Genel S., Sijacki D., Torrey P., Springel V., Hernquist L., 2013, MNRAS, 436, 3031
- Vogelsberger et al. (2014a) Vogelsberger M., et al., 2014a, MNRAS, 444, 1518
- Vogelsberger et al. (2014b) Vogelsberger M., et al., 2014b, Nature, 509, 177
- Vogelsberger et al. (2018) Vogelsberger M., et al., 2018, MNRAS, 474, 2073
- Vogelsberger et al. (2020a) Vogelsberger M., Marinacci F., Torrey P., Puchwein E., 2020a, Nature Reviews Physics, 2, 42
- Vogelsberger et al. (2020b) Vogelsberger M., et al., 2020b, MNRAS, 492, 5167
- Wechsler et al. (2002) Wechsler R. H., Bullock J. S., Primack J. R., Kravtsov A. V., Dekel A., 2002, ApJ, 568, 52
- Weinberger et al. (2017) Weinberger R., et al., 2017, MNRAS, 465, 3291
- Weinberger et al. (2020) Weinberger R., Springel V., Pakmor R., 2020, ApJS, 248, 32
- Wetzel & Nagai (2015) Wetzel A. R., Nagai D., 2015, ApJ, 808, 40
- White (1984) White S. D. M., 1984, ApJ, 286, 38
- Wiersma et al. (2009) Wiersma R. P. C., Schaye J., Smith B. D., 2009, MNRAS, 393, 99
- Wise et al. (2014) Wise J. H., Demchenko V. G., Halicek M. T., Norman M. L., Turk M. J., Abel T., Smith B. D., 2014, MNRAS, 442, 2560
- Wolf et al. (2010) Wolf J., Martinez G. D., Bullock J. S., Kaplinghat M., Geha M., Muñoz R. R., Simon J. D., Avedo F. F., 2010, MNRAS, 406, 1220
- Wu et al. (2020) Wu X., Davé R., Tacchella S., Lotz J., 2020, MNRAS, 494, 5636
- Xu et al. (2016) Xu H., Wise J. H., Norman M. L., Ahn K., O’Shea B. W., 2016, ApJ, 833, 84
- Yajima et al. (2017) Yajima H., Nagamine K., Zhu Q., Khochfar S., Dalla Vecchia C., 2017, ApJ, 846, 30
- Yajima et al. (2022) Yajima H., et al., 2022, MNRAS, 509, 4037
- Yang et al. (2022) Yang L., et al., 2022, ApJ, 938, L17
- Yeh et al. (2023) Yeh J. Y. C., et al., 2023, MNRAS, 520, 2757
- Zolotov et al. (2015) Zolotov A., et al., 2015, MNRAS, 450, 2327
- van den Bosch et al. (2002) van den Bosch F. C., Abel T., Croft R. A. C., Hernquist L., White S. D. M., 2002, ApJ, 576, 21
- van der Wel et al. (2014) van der Wel A., et al., 2014, ApJ, 788, 28
Appendix A Numerical convergence of galaxy size
A.1 Gravitational softening
The choice of gravitational softening imposes an effective limit on the accelerations that may be adequately reproduced in the system. The density and circular velocity profiles can deviate from the true solution when the specific radial acceleration of particles, , drops below a characteristic value of (Power et al., 2003). Therefore, an arbitrarily large can break the convergence of mass density distribution at larger radii. This typically happens at a radius of an order unity factor times .
However, for typical total mass density profiles of the halo (e.g. NFW, Hernquist), a well-defined maximum value exists for radial acceleration. If is chosen such that is always larger than this maximum value, the softening will not further affect the convergence of the mass density profile. For example, for the NFW profile, this condition is satisfied when
| (10) |
where we assume for typical high-redshift haloes. We obtain the halo mass limit where this effect becomes important as
| (11) |
For the of thesan-1 and thesan-hr, all the haloes relevant to our analysis in the main text are safely above this threshold.
The softening itself acts as a way of “smoothing” mass distribution and “puffing up” structures. A useful reference scale is , which is the radius of the compact support given the cubic spline kernel chosen by the simulations. This is where the gravitational acceleration becomes purely Newtonian. However, decreasing softening length does not lead to decreasing (and converging) galaxy sizes given the same particle mass resolution. First, an arbitrarily small softening length will inflate the integration error given the same time-stepping choice (Power et al., 2003). Secondly, small softening lengths exacerbate the segregation of stars and dark matter particles in halo centers and can counterintuitively increase galaxy sizes as softening length reduced (Ludlow et al., 2019a, 2020, 2023), which will be discussed in sections below. In simulations with sufficient mass resolution (Ludlow et al., 2020, 2023), galaxy sizes can become smaller than the canonical limit and converge in relatively massive galaxies (, where is the baryonic mass resolution) when is chosen to be slightly smaller than (introduced below).
A.2 Two-body relaxation
When a finite number of particles is used to represent a system, individual particle accelerations will inevitably deviate from the mean-field value when particles pass close to each other. Even when orbits are integrated with perfect accuracy, these “collisions” lead to changes of the order of unity in energy on the relaxation time scale (Binney & Tremaine, 1987)
| (12) |
where is the circular orbital time scale. This is more sensitive to the particle number than the gravitational softening length. Power et al. (2003) suggests the following convergence criterion for halo density profile against two-body relaxation
| (13) |
given optimized choices of softening, force accuracy, and time stepping. is an order unity constant that has been studied in detail in Ludlow et al. (2019b), and a simpler expression of was found as with little halo mass dependence, where is the comoving mean interparticle separation in cosmological simulations. Taking the thesan-1 simulation as an example, takes the value of about at .
A.3 Energy transfer between particle species
In addition to two-body relaxation, close encounters between collisionless particles in simulations can also transfer energy between different species with different particle mass (Ludlow et al., 2019a, 2020, 2023). In the thesan simulations, the dark matter particle mass is set five times larger than the initial mass of gas cells (and roughly speaking the typical mass of stellar particles). Energy equipartition of the system will tend to transfer energy from dark matter to baryonic particles and spuriously increase the size of galaxies. This can lead to a flattening in galaxy size mass relation at a scale similar to (see Figure 7 in Ludlow et al., 2020) independent of .
Ludlow et al. (2023) provided a thorough study of the typical time scale for spurious heating. By comparing this time scale with the age of the Universe, they derived convergence criteria for a range of galaxy properties including . We choose as defined in Table 2 in Ludlow et al. (2023) as a conservative estimate. We also scale it according to the change in Hubble time , which is a proxy for the age of the Universe at . We obtain the minimum halo mass scale that simulated galaxies are safe against spurious heating and convert it to stellar mass with a ratio of (conservatively large), which will be referred to as . This mass scale is marked with arrows in Figure 19 below and Figure 2 in the main text.
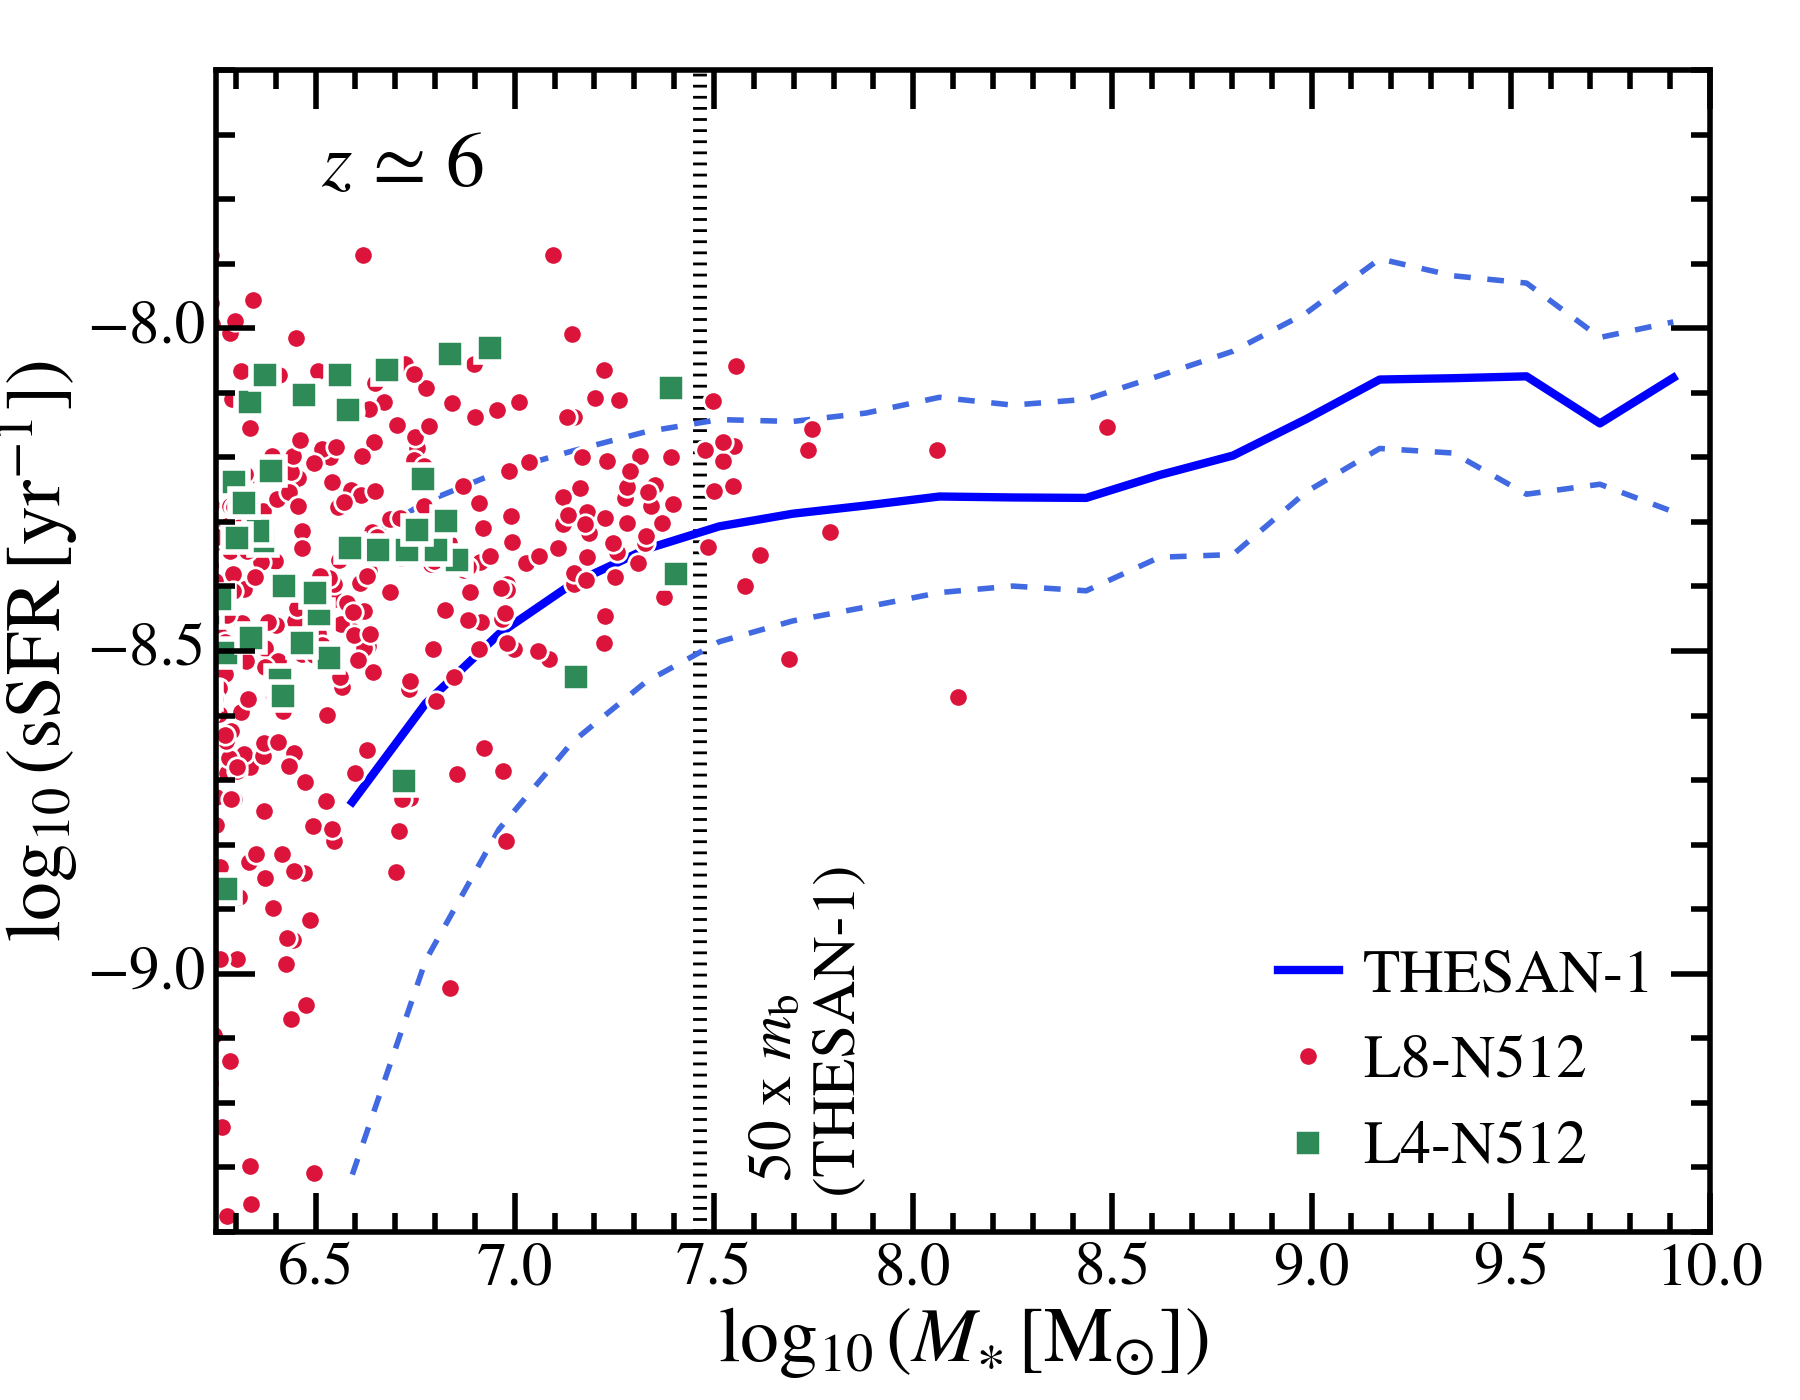
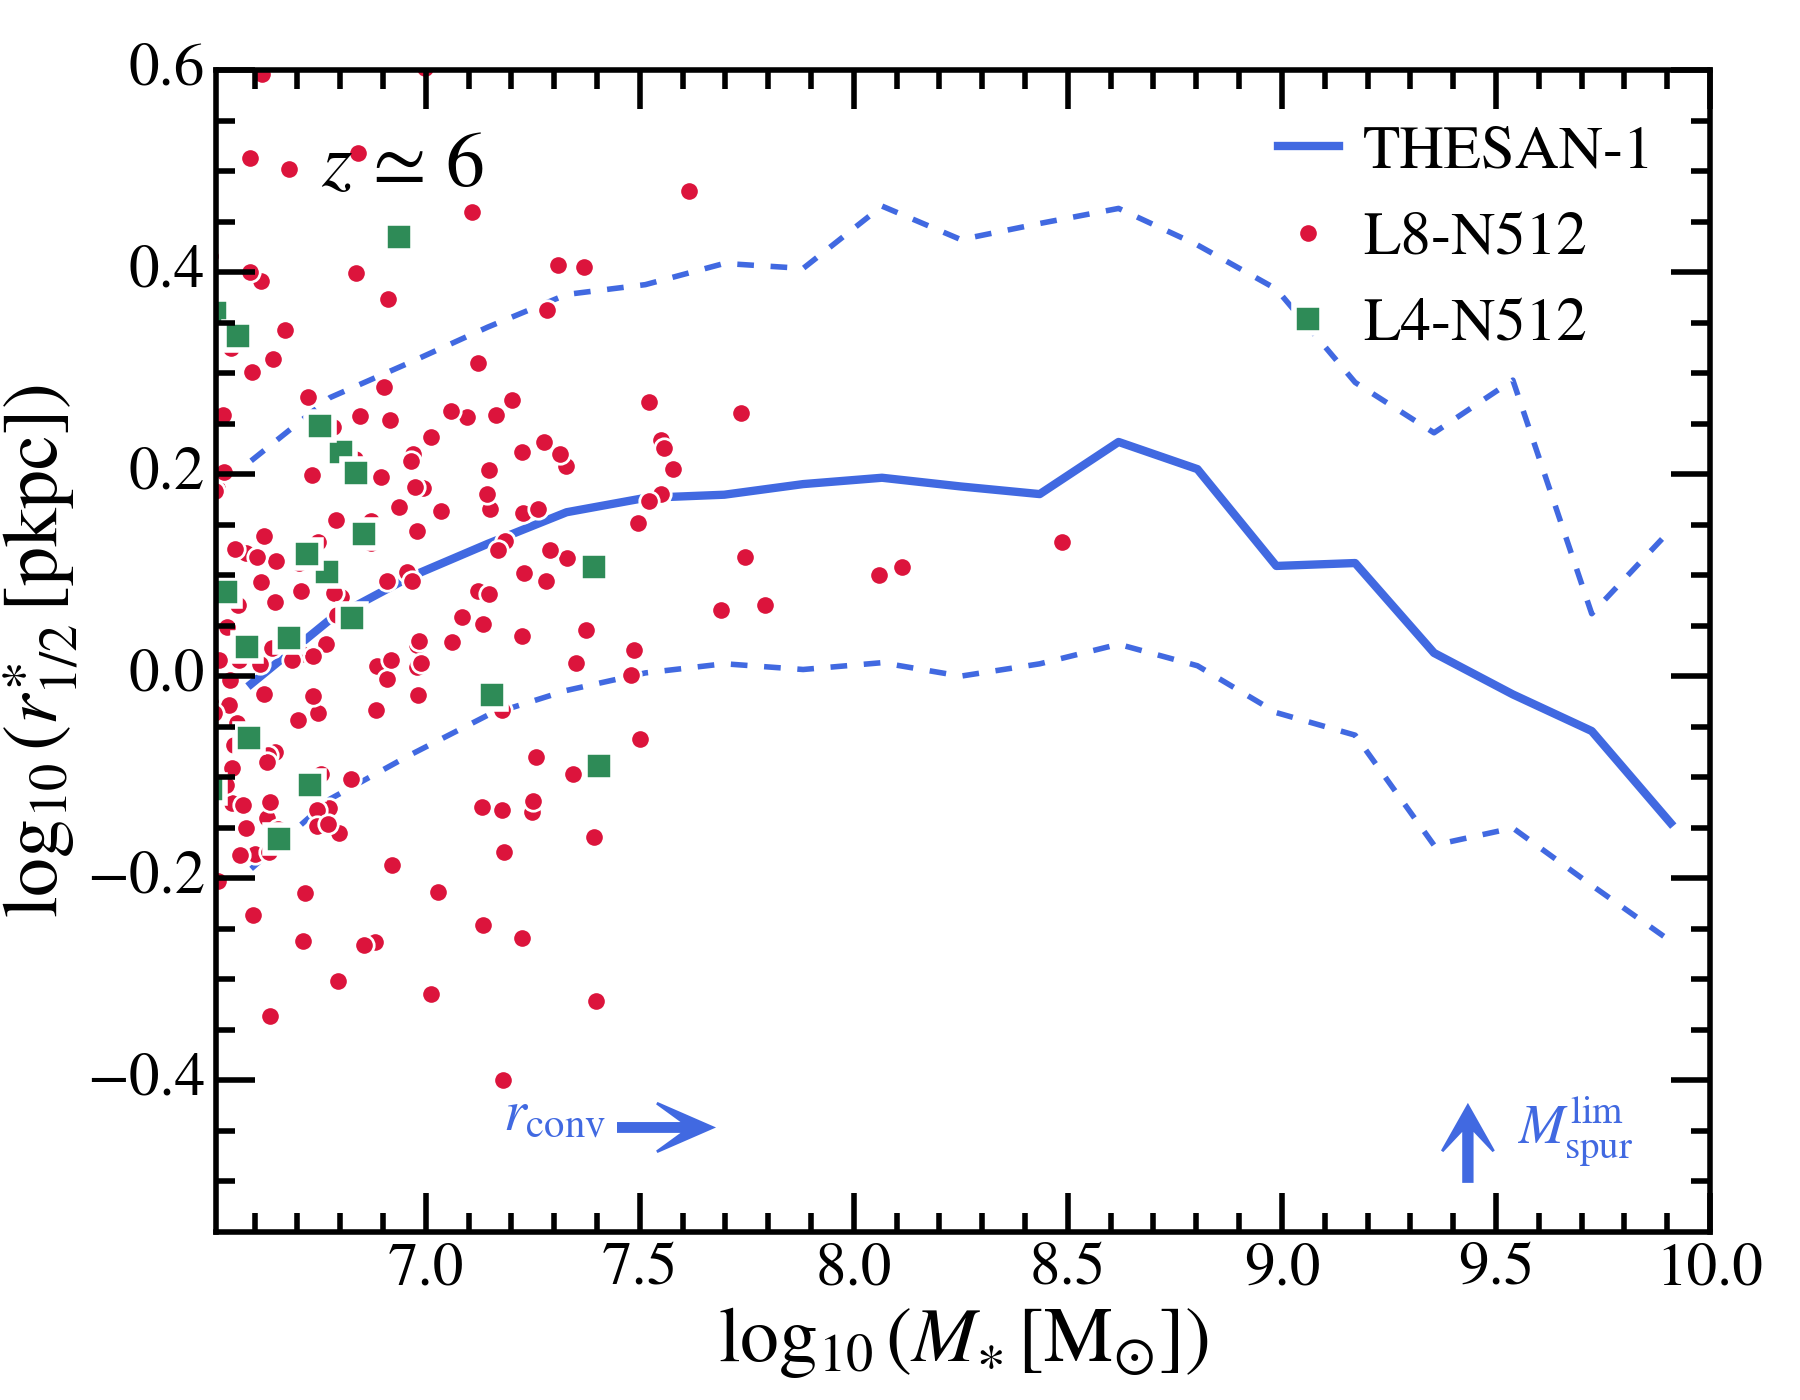
A.4 Convergence of thesan-1 and thesan-hr simulations
In Figure 18, we show the galaxy sSFR versus stellar mass relation at in thesan-1 and two thesan-hr simulations (L8-N512 and L4-N512). The numerical details of these simulations are listed in Table 1. We find that the sSFR converges at around times the baryonic mass resolution of the simulation. Below this mass, the sSFRs of galaxies are systematically suppressed in low-resolution simulations and a population of artificially quenched galaxies can show up. Therefore, in the galaxy classification step described in Section 3.2, we have specifically removed this population from our analysis. In Figure 19, we show the galaxy size–mass relation at in thesan-1 and thesan-hr simulations. We find that both the median and 1- scatter of the relation converge already at the resolution level of thesan-1. The sizes and stellar masses of simulated galaxies are safely above the spurious heating regime defined by and calculated above.
Appendix B Central versus satellite galaxies
In Figure 20, we show the size–mass relation of central versus satellite galaxies at in thesan. At fixed stellar mass, the satellites are slightly smaller than the centrals. However, this difference is small enough and it results in almost no differences in the median size of central galaxies and that of all galaxies. We also note that the small region around , is purely dominated by satellite galaxies. This explains the low-mass compact galaxy population at the same position in Figure 6, which resides in dense environments and is likely affected by the tidal fields and ram pressure of their hosts.