A Wave-Corrected Assessment of the Local Midplane
Abstract
As the number of known Galactic structures mounts thanks to the Gaia Space Telescope, it is now pertinent to study methods for disentangling structures occupying the same regions of the Milky Way. Indeed, understanding the precise form of each individual structure and the interactions between structures may aid in understanding their origins and chronology. Moreover, accounting for known structures allows one to probe still finer Galactic structure. In order to demonstrate, we have developed an Odd Low-Pass Filter (OLPF) which removes smaller, odd-parity structures like the vertical waves, and use the filtered data to examine the location of the Galaxy’s mid-plane. We find that the radial wave identified by Xu et al. (2015) continues inward to at least the Sun’s location, with an amplitude that decreases towards the inner, denser parts of the disk, consistent with a simple, qualitative simulation. Additionally, we employ the OLPF results to determine the solar offset, , with smaller structures filtered out. We find that pc.
1 Introduction
With the first light of the Gaia Space Telescope (Brown et al., 2016; Prusti et al., 2016; Lindegren et al., 2018), superb astrometric data has made it increasingly clear that the Milky Way Galaxy is not in equilibrium (Gardner et al., 2021; Hunt et al., 2022a, e.g.). This disequilibrium, apparent in spiral phase-space structures (Antoja et al., 2018), vertical waves (Widrow et al., 2012; Yanny & Gardner, 2013; Bennett & Bovy, 2018), warping (Levine et al., 2006; Skowron et al., 2019; Chen et al., 2019, e.g.), and corrugated waves proposed by Bland-Hawthorn & Tepper-García (2021) to name a few, is a direct challenge to the commonly employed assumptions of Galactic dynamics (Binney & Tremaine, 2008). Indeed, the Galaxy is not in steady state (Gardner et al., 2020), does not exhibit axial symmetry (Hinkel et al., 2020a), and its stars are not entirely uncorrelated (Hinkel et al., 2023).
Such findings, while challenging the existing theoretical framework, offer unprecedented opportunities to disentangle past events in the Galaxy’s history (Gardner et al., 2021), as different interactions imprint distinct structures within the Milky Way (Hunt et al., 2022b). In other words, the distinct pattern of how particular assumptions of symmetry or equilibrium are broken is important in determining possible causes Hinkel (2021). Such a disentangling effort is critical for understanding the individual effects in detail as well as in the search for additional structure.
The picture near the solar neighborhood, however, may be even murkier. A number of local structures near the Sun have been found, including potential resonances of the Galactic bar (Dehnen, 2000; Hunt & Bovy, 2018; Hinkel et al., 2020b; Trick et al., 2021, e.g.), the Radcliffe Wave (Alves et al., 2020), as well as a litany of other structures.
The cacophony of these effects add up so as to frustrate any measurement of a single effect. To make matters worse, interactions between observational constraints and known structures can tend to bias other measurements. That is, cutting on (e.g.) Galactic latitude, , may influence which portion of the vertical wave (Widrow et al., 2012) one observes at different distances from the Sun. This can conceivably skew measurements of the location of the Galaxy’s mid-plane due to the odd parity of the vertical waves.
In this paper, we detail a method for disentangling effects by exploiting their distinct symmetries and scales. In what follows we briefly outline the underlying theory of our method (Section 2) and develop this method for precision measurements of Galactic structure (Section 3). Finally, we close with the results of our analysis (Section 4) and discuss the possible ramifications and origins of the structures we have found (Section 5).
2 Theory
Supposing (incorrectly) for the moment that the Milky Way is in equilibrium, the vertical stellar density profile of the Milky Way would be symmetric about the mid-plane, (An et al., 2017). Indeed, the Milky Way has been described by various, simplistic models, which include contributions from both the disk and other populations like the stellar halo which all exhibit reflection symmetry about the mid-plane (Spitzer Jr., 1942; Miyamoto & Nagai, 1975; Navarro et al., 1997, e.g.). In other words, the vertical structure described by an equilibrium model would take the form:
| (1) |
where is the direction perpendicular to the Galactic plane, and are coefficients in the expansion of the equilibrium model. In this case, the mid-plane of the Galaxy is located at the position of maximal density.
However, the Milky Way is clearly in disequilibrium (Antoja et al., 2018, e.g.) and may exhibit over- and under- densities, symmetry breaking, and other effects which can skew an assessment of the local mid-plane due to odd-parity terms not considered in Eq. 1. To insulate a determination of the vertical location of the mid-plane against these effects, we start by considering the average value of for all stars in a given sector of the Milky Way:
| (2) |
where represents some bounding value of measured from the nominal, zero-latitude () plane. Notice an even-parity distribution will yield . (As is measured from the Sun and neglecting other effects for the moment, the true mid-plane will be offset from by an amount , the Sun’s height above the mid-plane.)
There are many effects in the Galaxy which appear to factor into the value of , and thus an assessment of , as motivated in Section 1. To this end, it is useful to understand the parity of the various other effects, and so we introduce a general set of basis functions, and , such that all have even parity, while all are odd. In this manner, we can describe the various effects as weighted sums of some subset of the and , as generalized for some arbitrary function, , in Eq. 3:
| (3) |
where the and represent the coefficients in the expansion of in the basis set. (In our particular case, we have chosen the Fourier basis.)
Regardless of the choice of basis functions, the explicit even and odd parity terms allow for various simplifications in the computation of . To see why, suppose we have a vertical distribution function, , describing a Milky Way in equilibrium as in Eq. 1. As Eq. 1 is expressly even, we may write it as:
| (4) |
Moreover, suppose that the various structural effects discussed above factor into the vertical distribution of stars as small corrections, so that we may add terms to the equilibrium condition as a small perturbation. While we do not a priori know the form of the perturbations, , we do know that it can contain non-zero, odd parity terms, which can act to shift the vertical location of the mid-plane. Further, there are various known effects with known parities and scales. For example, symmetric breathing modes (Ghosh et al., 2022, e.g.) would possess even parity, while the vertical waves (Widrow et al., 2012) would possess odd parity. In the case of the latter, the waves have scales on the order of half a kiloparsec (Bennett & Bovy, 2018).
Symmetric perturbations like the breathing modes mentioned above will not shift the location of the Milky Way mid-plane. Effects with odd-parity terms will shift the mid-plane111Bennett & Bovy (2018) calculate a wave-corrected assessment of based solely on the vertical star count asymmetry in a cylinder around the sun of radius 250 pc, whereas this work allows for the morphology of the vertical wave to vary between regions, as motivated by Hinkel et al. (2023)., and so we define an Odd Low Pass Filter (OLPF) such that we filter out all odd (imaginary) terms in the Fast Fourier Transform of the vertical number counts, , exceeding some wavenumber (i.e., with correspondingly small scales). More formally, the OLPF, , as a function of the linear wavenumber transforms in the following way:
| (5) |
where returns the real part of . Upon filtering the vertical star count data in Fourier space, the data is transformed back into spatial data for our assessment of the mid-plane location.
For the present study, we have determined that a linear frequency cutoff value of is sufficient to remove the vertical waves, as such a cutoff value ensures we filter out (odd-parity) vertical structures on scales less than kpc. In other words, structure that “fits” within the roughly 2 kpc vertical extent of the disk (Bovy et al., 2012, e.g.) is filtered out, while any remaining odd-parity vertical structures are passed through the filter and therefore must be large scale, gradual variations. To this end, we extend our study out to , with kpc. While this choice of bounds will allow some halo stars into our calculation, we are interested in symmetry-breaking, “macro” effects on the location of the mid-plane, and thus scales in excess of kpc.
Finally, please note that we will use and in order to distinguish between the mid-plane location (average value) for the unfiltered and filtered data, respectively.
3 Method and Data Selection
An assessment of the Milky Way mid-plane location is subject to observational biases in the Gaia data, extinction due to dust, as well as the superposition of various effects. In order to circumvent the first of these issues, we employ a similar set of cuts to Gardner et al. (2020) and Hinkel et al. (2020a), though we use Gaia DR3. Namely, we select stars with mag, mag, within a few kpc of the Sun, slightly altering the color and magnitude ranges of Gardner et al. (2020).
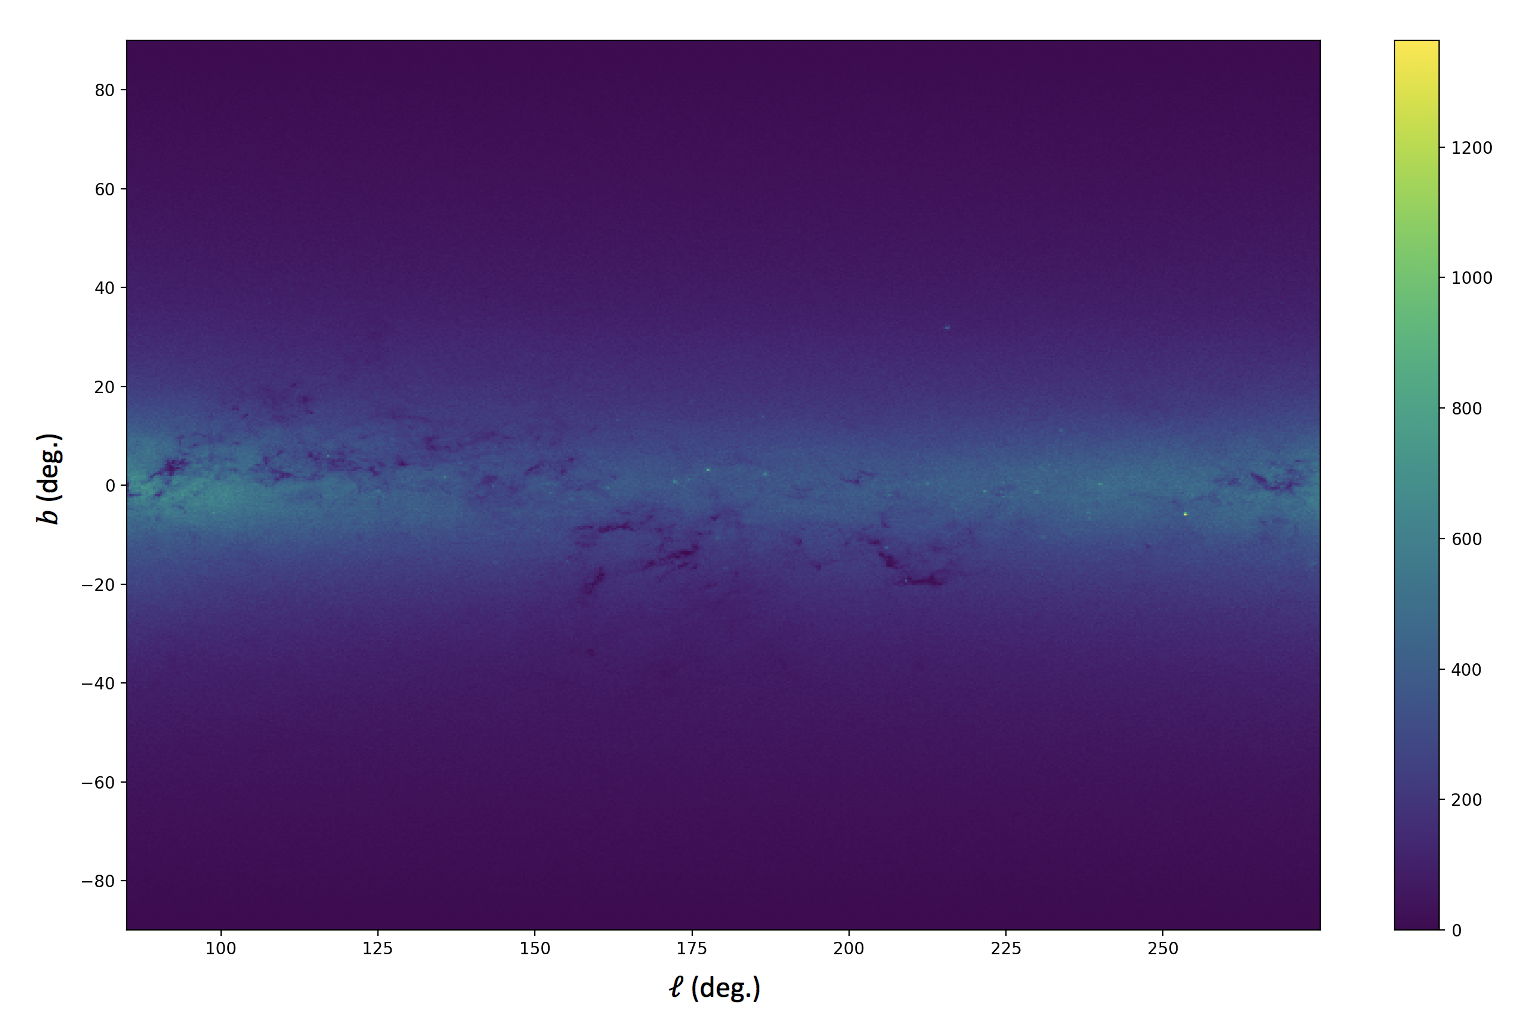
However, the data set employed by Gardner et al. (2020) and Hinkel et al. (2020a) avoids the mid-plane region with latitude cuts of , whereas we are interested in including this highly-populated, low latitude region in order to determine variations in the height of the mid-plane. This limits the lines-of-sight to those not severely impacted by dust, a relative rarity as seen in Fig. 1 as well as the studies of Lallement et al. (2022). As such, we limit our study to heliocentric longitudes of .
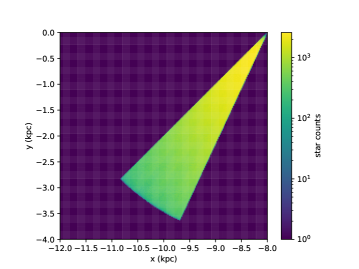
In order to confirm that the extension of the Gardner et al. (2020) and Hinkel et al. (2020a) data set to lower latitudes does not result in any newly introduced systematic errors, we reproduce figure 7a of Hinkel et al. (2020a) for the additional longitude selection motivated above. Fig. 2(a) displays this selected reproduction and indicates that no appreciable star count incompletenesses are introduced by extending the data to lower latitudes, and dust does not appear to occlude any lines of sight until about kpc from the Sun, as illustrated in Fig. 2(b). Even then, this particular line of sight is nearly free of any occluding dust out to about 4 kpc from the Sun.
4 Analysis
With our selection of data in hand, we divide the data into radial bins of width 100 pc. For each radial bin, the vertical distribution of stars is histogrammed, Fourier Transformed, passed through the OLPF detailed in Eq. 5 above, and Inverse Fourier Transformed back into position space. The filtered data are then used to compute the average (filtered) position of the mid-plane, , for each radial bin.
4.1 The Varied Morphology of the Vertical Waves
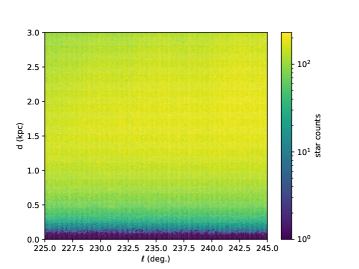
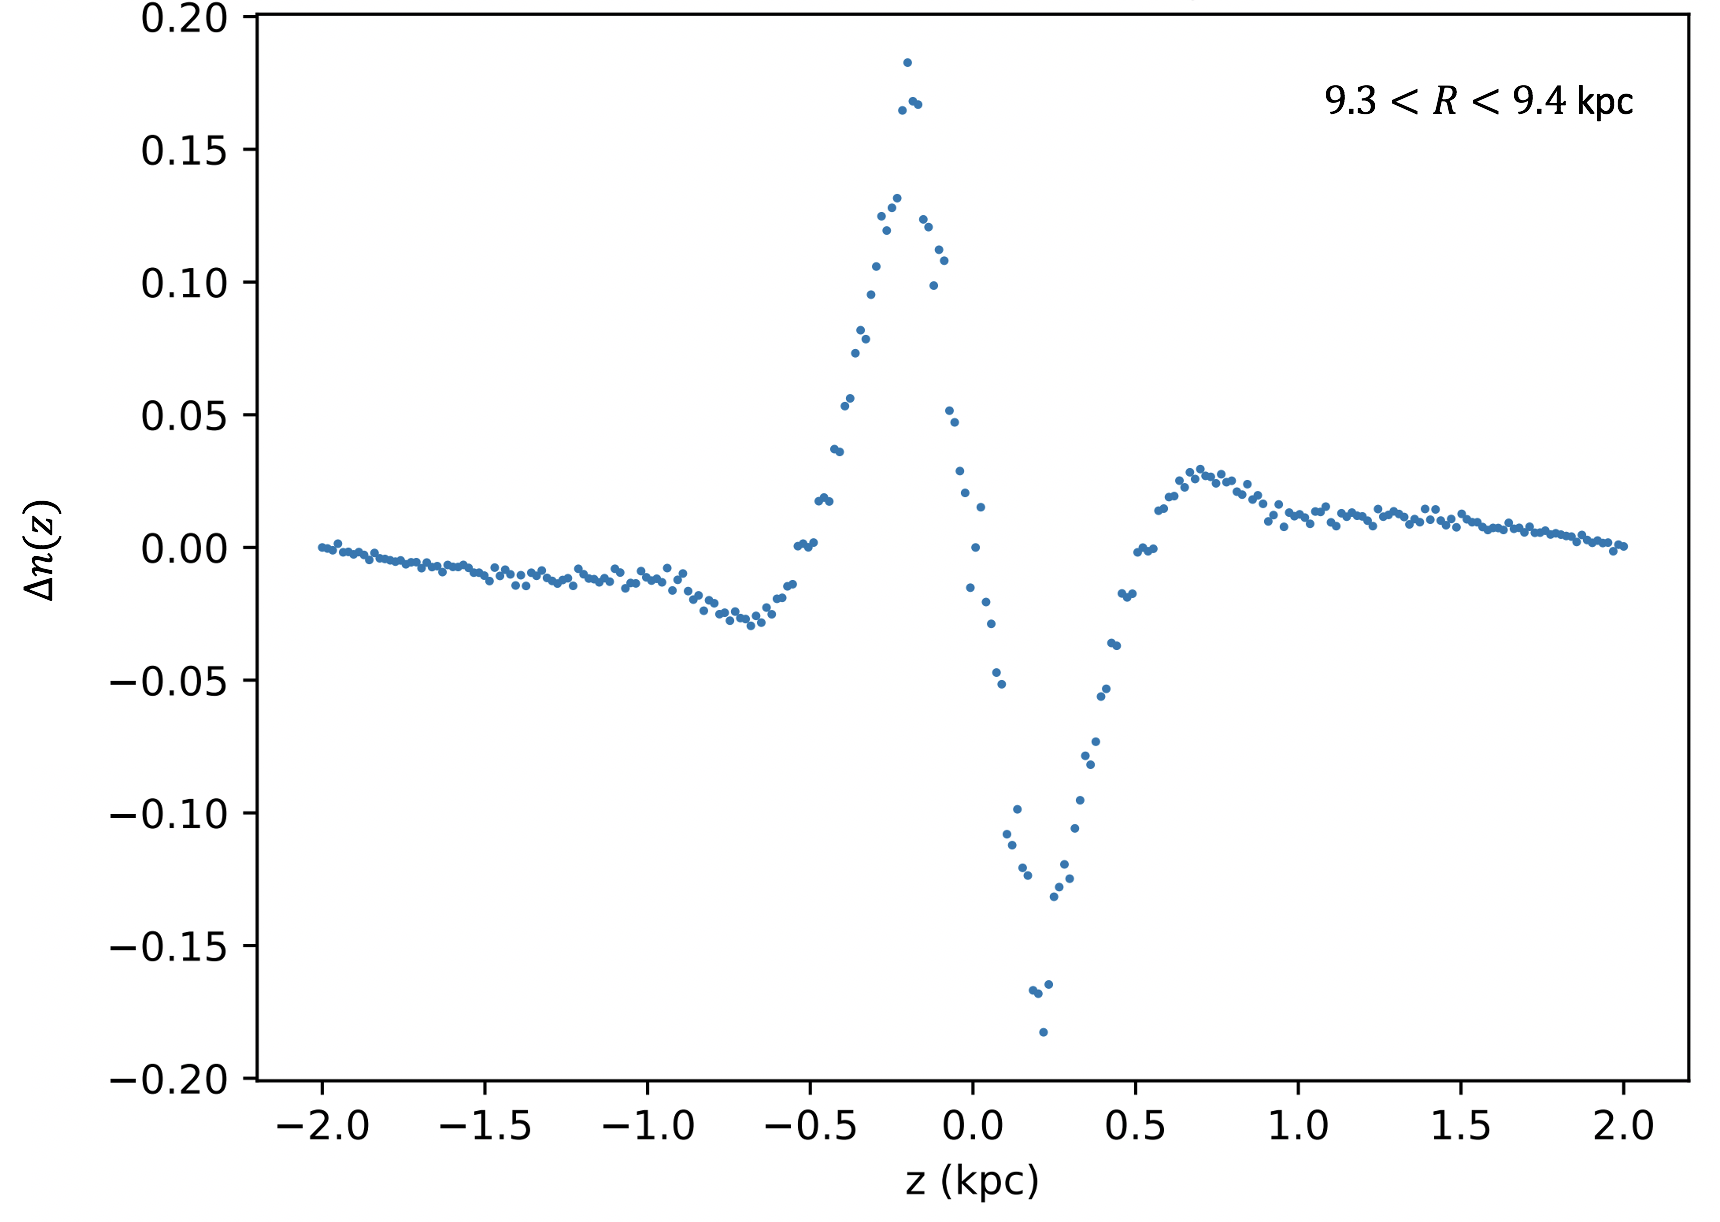
To confirm that the OLPF acts as expected, we have explored the form of the odd terms that have been filtered out from each radial bin. Namely, we isolate the filtered terms by subtracting the (normalized) filtered histogram data from the (normalized) raw histogram data: , where each term was normalized to have a maximum of 1. In doing so, we find that the vertical waves have indeed been correctly filtered out and, interestingly, that their morphology changes radially, as seen in Fig. 3.
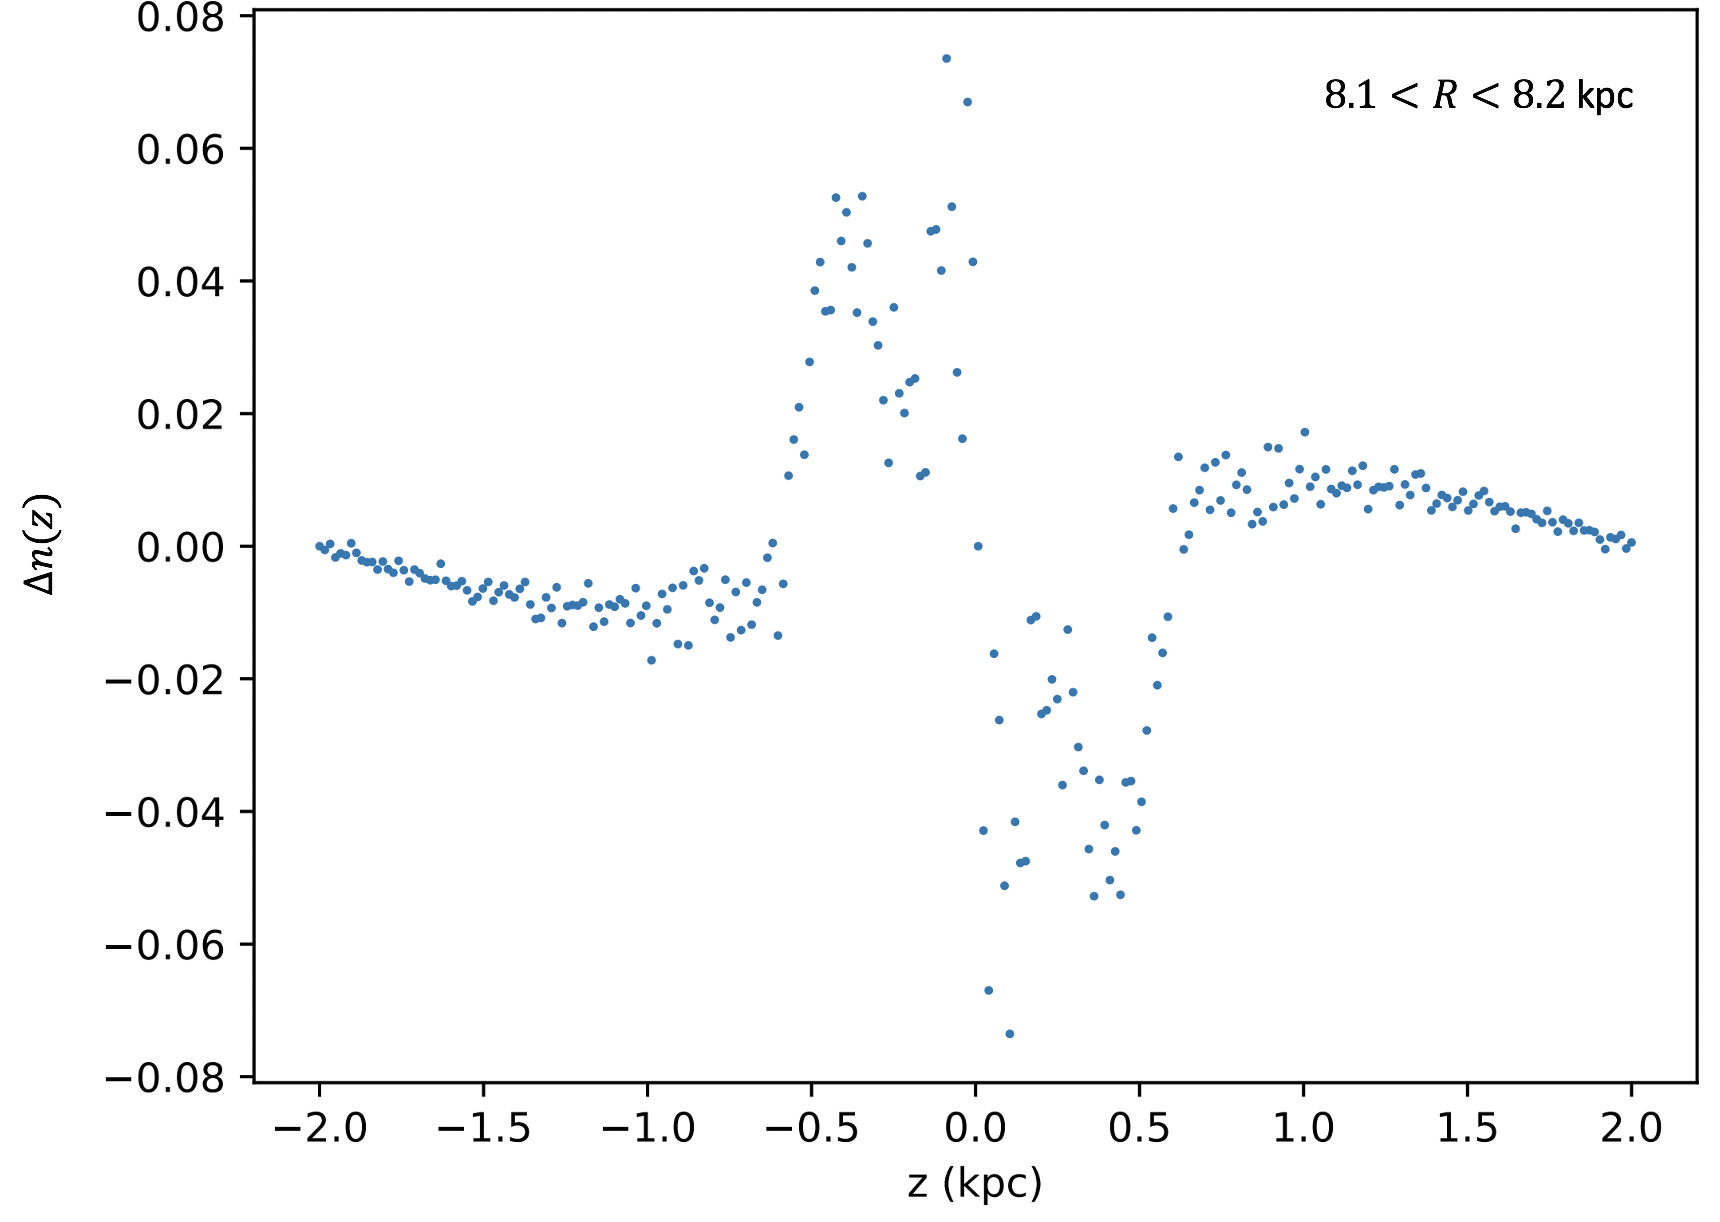
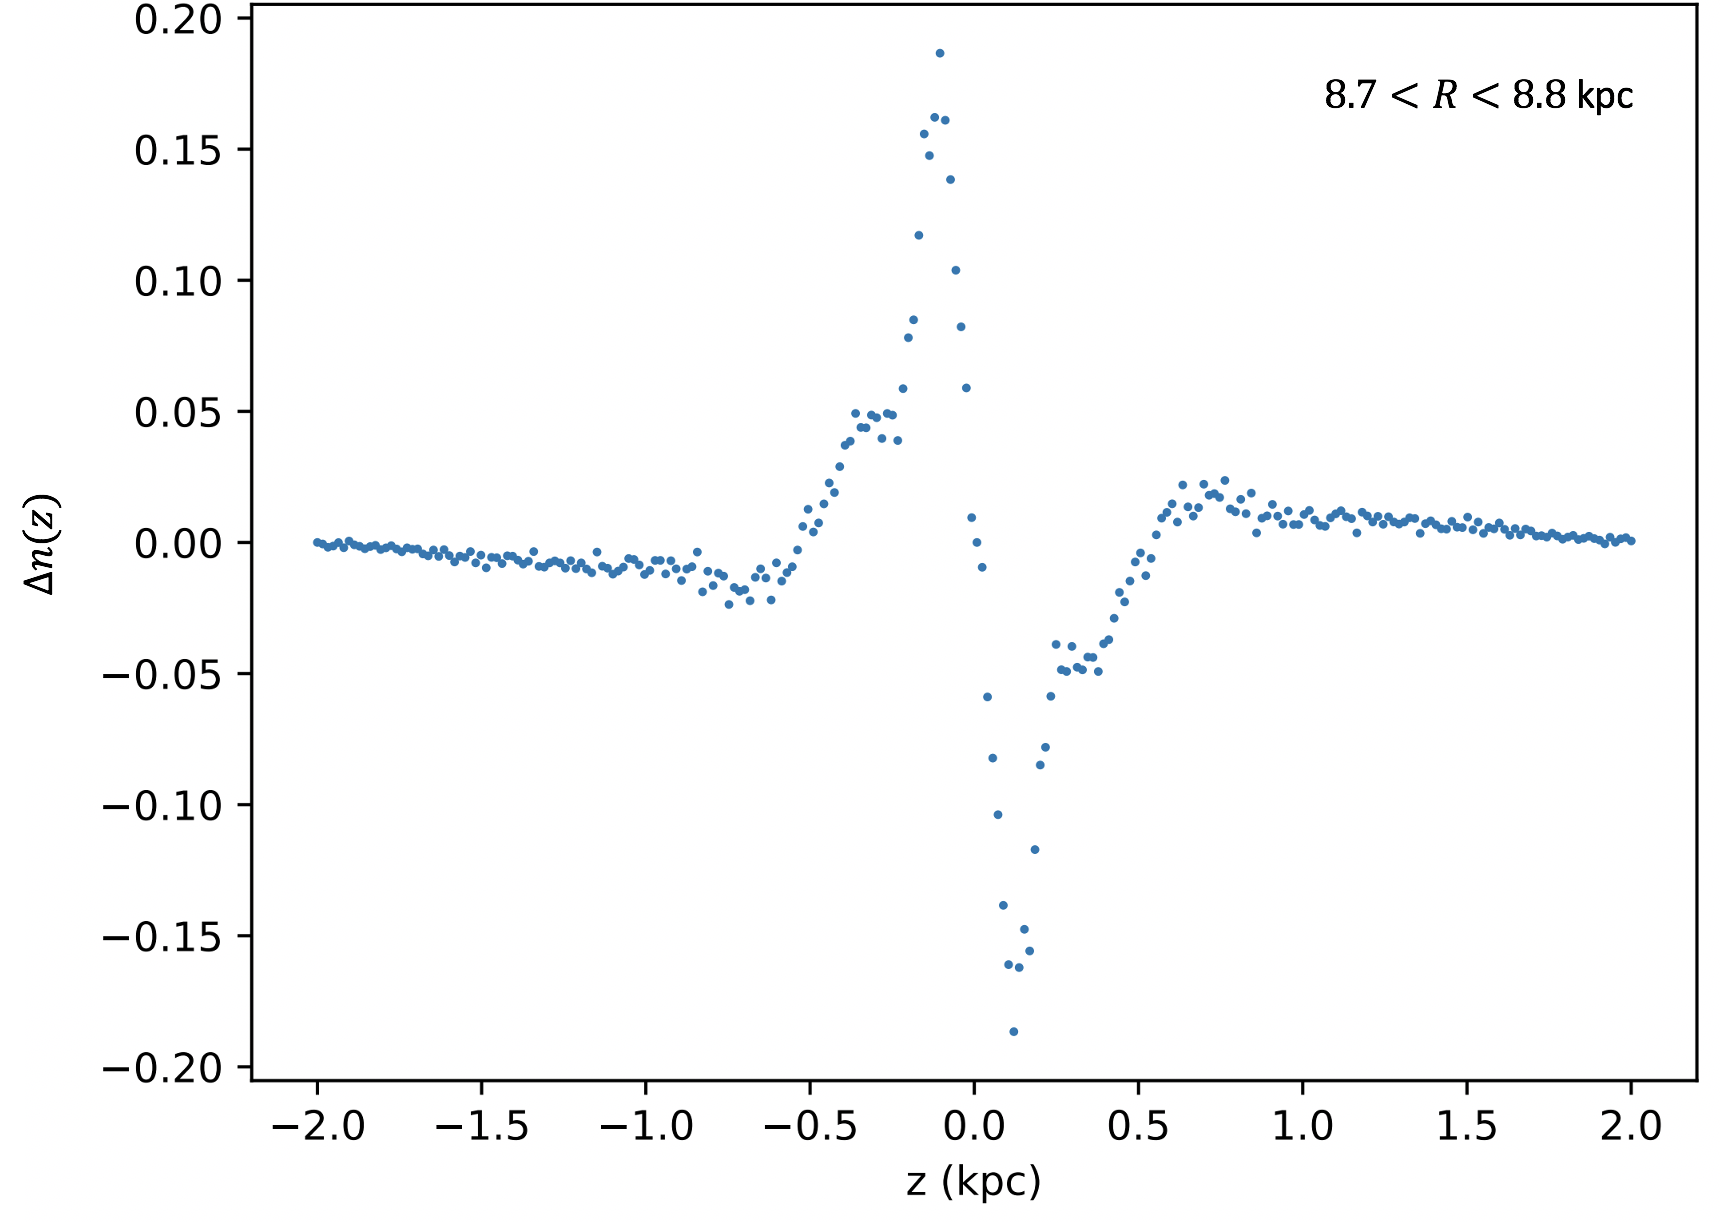
As a quick consistency check, we should expect for the radial bin closest to the Sun222We round the solar radius to kpc for this analysis, though we note Abuter et al. (2019) for a more precise measurement. to approximately match the vertical asymmetry found near the Sun in Bennett & Bovy (2018), who explore a similar yet distinct volume of space. Indeed, panels (a) and (b) of Fig. 3 depict the same extrema as Bennett & Bovy (2018) – namely kpc, kpc, and kpc, though limited statistics due to longitude cuts cloud the picture near the Sun. The Gaia data is also limited at very low latitudes () due to crowded sight lines (Lindegren et al., 2018, e.g.), which may be behind the sharp change around visible in some radial bins.
Although not a primary objective of our study, the changing morphology of the vertical waves is striking. As one explores larger Galactocentric radii, , as in panels (c) and (d) of Fig. 3, the shape of the vertical waves changes, an effect noted in the two-point correlation studies of Hinkel et al. (2023) and perhaps related to the corrugated bending waves suggested by Bland-Hawthorn & Tepper-García (2021).
4.2 A Radial Wave Extends Inward to the Solar Neighborhood
Upon computing the location of the mid-plane from the Odd, Low-pass Filtered data, we find evidence for a radial wave at galactocentric radii between kpc and kpc, firmly within the dust-free regions identified above. The wave, pictured in Fig. 4(a) exhibits an amplitude of approximately 15 pc and a wavelength of approximately 1.5 kpc. Indeed, the wave structure we have found appears to be a continuation of the radial wave discovered by Xu et al. (2015). That is, the radial wave discovered by Xu et al. (2015) warps the disk in the positive -direction between about kpc and kpc, though we note that the vertical waves have not been filtered out as they are in the present work. Additionally, Xu et al. (2015) utilize SDSS DR8 data with isochrone-derived distances, which may also contribute to the slight discrepancies in the distances to the extrema of the radial wave. Indeed, we stretch our study to kpc (Fig. 4(b)) and find the larger, previously known maximum.
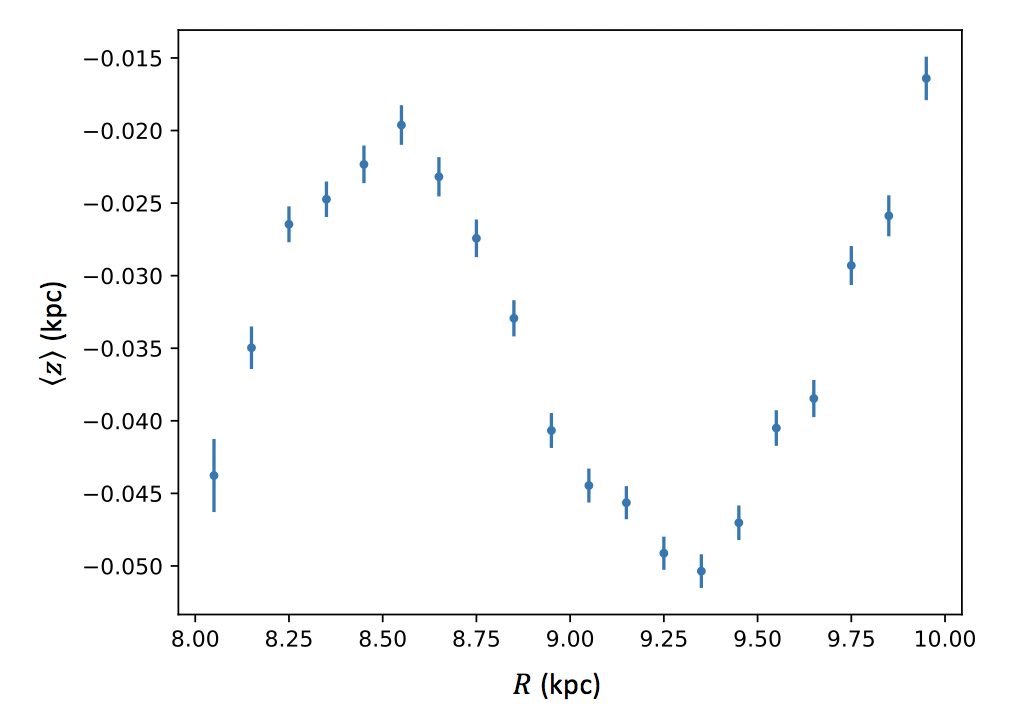
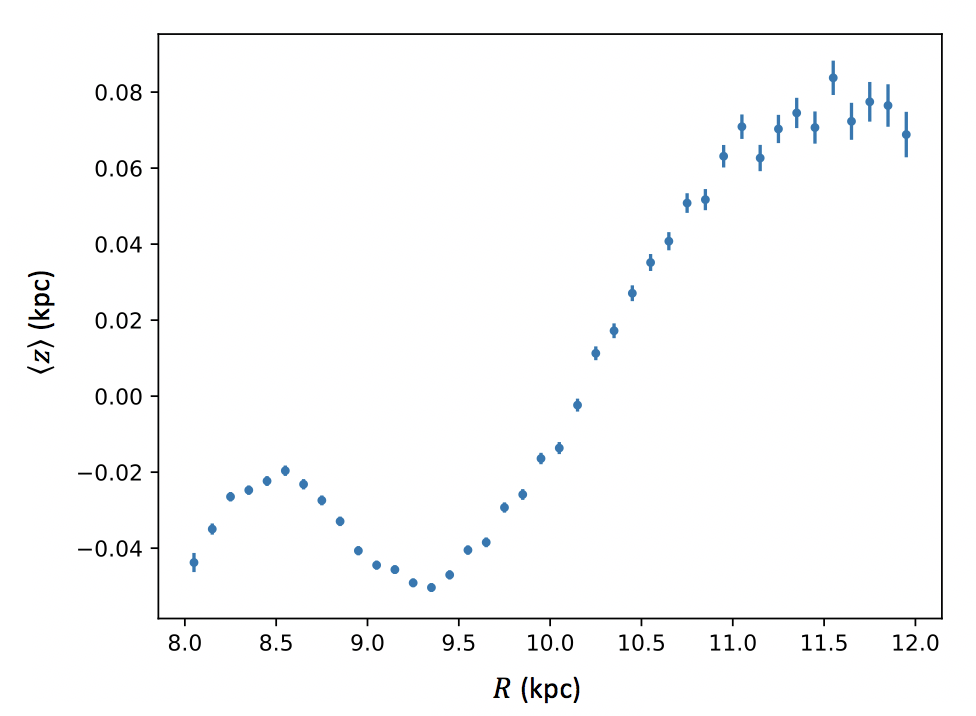
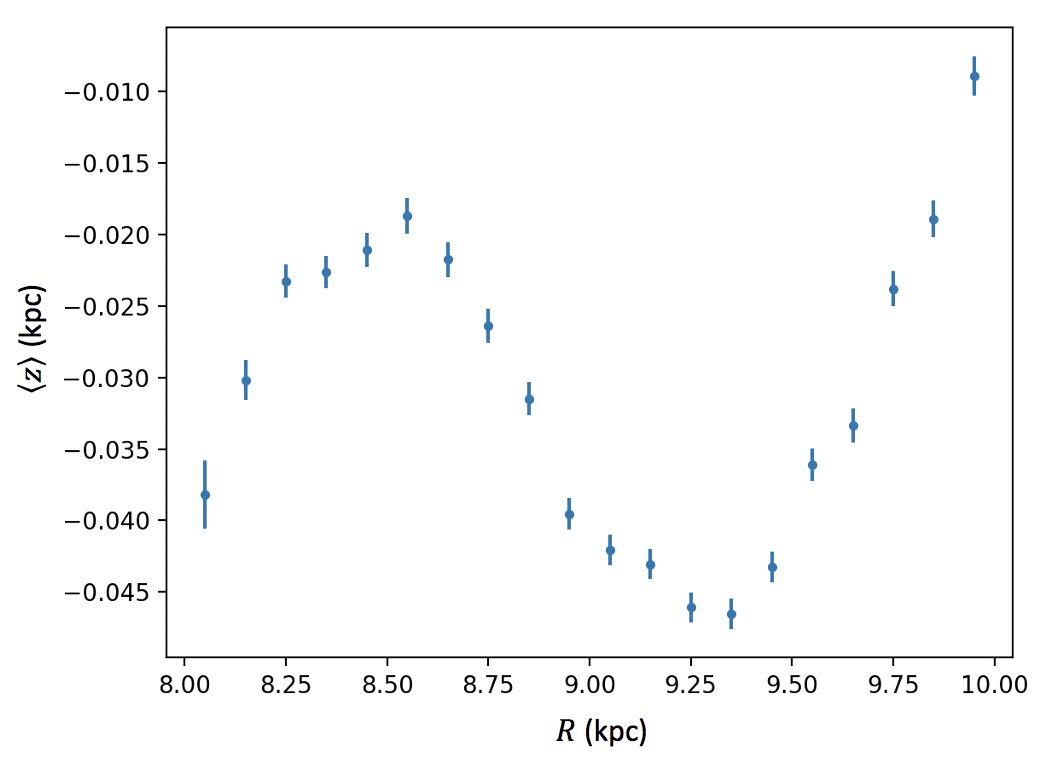
Please note that the data in Fig. 4(a) is negative as it is offset by the Sun’s position above the mid-plane, . Indeed, using the average of the Odd Low Pass Filtered data in Fig. 4(a) as a small-scale-structure-corrected average mid-plane location over kpc, we determine that the local mid-plane lies at pc, implying pc. This wave-corrected estimate is roughly double the value found by Karim & Mamajek (2016). Indeed, the present finding is more consistent with an assessment made via Cepheids (Majaess et al., 2009) than studies employing number counts (Ferguson et al., 2017), and is qualitatively consistent with the upward revision of the vertical asymmetry studies of Bennett & Bovy (2018). We confirm that the asymmetry of the vertical waves causes an over-density in the North in the highly-populated, low- region which, if not accounted for, will tend to artificially depress the value of when measured near the Sun.
As others have noted (Ferguson et al., 2017, e.g.), the determination of via star counts depends on the direction one looks, as the concept of a mid-plane in a galactic disk is necessarily a local determination in a galaxy featuring substructure and warping. Such a conclusion is reinforced here, as even upon filtering out the vertical waves and other smaller, purely vertical structures, the mid-plane of the Milky Way undulates vertically as one moves radially outward, consistent with a corrugation pattern (Bland-Hawthorn & Tepper-García, 2021) and the slightly offset vertical waves found via a Two-Point Correlation function study (Hinkel et al., 2023). That is, while our study endeavors to remove the vertical waves, there are still substantial differences in the mid-plane location along the radial direction, likely contributing (in part) to the various values found in the literature.
Moreover, the morphology of the radial wave is robust against changes to our choice of . Indeed, the overall shape of the radial wave remains about the same as depicted in Fig. 4(c), where we have changed to 1.5 kpc (c.f. Fig. 4(a)). There is, however, a small numerical change in the values of with our choice of , evident from the vertical axis scaling in panels (a) and (c) in Fig. 4 – yielding a slight downwards shift with larger values of . This small shift may be due to the warping of the disk, which may disproportionately affect the thick disk stars (Widmark et al., 2022).
4.3 A Heuristic Model for the Radial Wave
In order to qualitatively explain the radial wave feature we have resolved, we have built a simple computational model via python that employs a Verlet integrator (Verlet, 1967). We use a Miyamoto-Nagai Disk profile (Miyamoto & Nagai, 1975) as a static, background potential for the Milky Way disk, and embed small masses within this background potential333 The code for this simulation, as well as all of the code for the analysis in this manuscript can be found at https://doi.org/10.5281/zenodo.10015988. The small, embedded masses may move freely in the direction due to a perturbation, but are held fixed in the radial and azimuthal directions for simplicity.
The system described above is not entirely unlike a wave on a massive string. If we suppose the mass per unit length of the string increases monotonically in some direction, any wave pulse from the lower-mass end of the string will decrease in amplitude as it propagates toward the denser part of the string, as we expect energy to be conserved. Indeed, upon simulation, this is exactly the behavior we find (Fig. 5).
[width=loop, autoplay]5xz_plot-133
This qualitatively matches the present results and the original finding of Xu et al. (2015). To wit, we find evidence for a radial wave with larger amplitude at larger Galactic radii and a smaller amplitude at lower Galactic radii. The feature is continuous, suggesting our finding is an extension of the discovery by Xu et al. (2015).
To reiterate, this simulation is intended only to be qualitative and illustrative of the wave-like motion we are suggesting. The simulation is limited in a number of ways, including false, abrupt boundaries for the tracer populations, a static background potential inconsistent with non-steady-state behavior (Gardner et al., 2020), it ignores spiral structure and other structures, and treats the perturbed masses as a 1-D mass distribution confined to move only in the -direction. Indeed, the radial wave might be a bending wave of the disk itself, and so we do not claim to quantitatively model this wave. Instead, we have employed this simulation purely to illustrate how a vertical perturbation to the disk can propagate radially, changing amplitude at various radii. This later fact follows from conservation of energy, and although our heuristic simulation is limited, it nonetheless captures the variations in amplitude that we have found.
5 Conclusions
We have introduced a new tool for disentangling some of the myriad structures in the Milky Way via considerations of symmetry and scale. Namely, we have developed and employed an Odd Low Pass Filter (OLPF) to remove the over- and under-densities of the vertical waves (Widrow et al., 2012). Upon filtering the vertical number count data along a relatively dust-free line of sight (Lallement et al., 2022), we find evidence that the radial wave discovered by Xu et al. (2015) penetrates further inward than previously understood – to at least the Solar neighborhood.
Indeed, we show further that the behavior of the radial wave qualitatively matches what one would expect for a wave pulse travelling along a medium with continuously changing mass density. To wit: the amplitude of the wave is greater at larger Galactocentric radii and smaller in the denser, more interior regions, matching a simplistic, heuristic simulation we have built. It is unclear at present which direction the radial wave is propagating, or even if it is perhaps some form of long-lived standing wave anchored between (e.g.) spiral arms.
Refined radial velocity measurements from Gaia could potentially help to resolve the direction of propagation, revealing insights into the radial wave’s origin. If the wave propagates inward, is it a bending wave caused by an interaction with a subhalo? If so, can we extrapolate backward in time to identify if the waves arise from the Sagittarius collision or perhaps a dark subhalo? If the wave propagates radially outward, could it be due to bar buckling or some other internal process?
Intriguingly, the radial wave could also help to explain the existence of the Radcliffe Wave (Alves et al., 2020). As Swiggum et al. (2022) suggest, a velocity difference of between the spiral arm structure and the local gas and dust could explain the extent of the Radcliffe Wave. However, Swiggum et al. (2022) note that the damped oscillatory behavior of the Radcliffe Wave remains unexplained. If the spiral arms were themselves perturbed vertically by the radial wave, the gas and dust downstream from the spiral arms would have this vertical disturbance imprinted on it. In this picture, as the gas and dust moves further from the region of the radial wave, the amplitude decays.
Assuming for the moment that the connection between the Radcliffe Wave and the radial wave is indeed real, the approximately 1 kpc wavelength of the Radcliffe Wave (Fig. 2: Alves et al. (2020)) along with the velocity difference above implies a period of oscillation of about . Given that the Radcliffe Wave exhibits at least one full wavelength of structure, this would then imply that the radial wave is at least old.
Although tantalizing, the picture detailed above does not explain how the radial wave formed. Moreover, our simulation employs a static background potential, which is at odds with the non-steady-state behavior of the Milky Way disk (Gardner et al., 2020; Hinkel et al., 2020a). It would be interesting to model the system more fully in order to understand how a radially migrating bending wave might behave when interacting with the other substructures in the solar neighborhood. We leave more detailed simulations to future work.
Acknowledgements
The authors are grateful for funding from the Colorado College Faculty-Student Collaborative Grant as well as research funding from the Natural Sciences Executive Committee at Colorado College. A.H. also acknowledges Thomas More University for funding to finish and publish this work.
This work has made use of data from the European Space Agency (ESA) mission Gaia (https://www.cosmos.esa.int/gaia), processed by the Gaia Data Processing and Analysis Consortium (DPAC, https://www.cosmos.esa.int/web/gaia/dpac/consortium). Funding for the DPAC has been provided by national institutions, in particular the institutions participating in the Gaia Multilateral Agreement.
References
- Abuter et al. (2019) Abuter, R., Amorim, A., Bauböck, M., et al. 2019, Astronomy & Astrophysics, 625, L10
- Alves et al. (2020) Alves, J., Zucker, C., Goodman, A. A., et al. 2020, Nature, 578, 237
- An et al. (2017) An, J., Evans, N., & Sanders, J. 2017, Monthly Notices of the Royal Astronomical Society, 467, 1281
- Antoja et al. (2018) Antoja, T., Helmi, A., Romero-Gómez, M., et al. 2018, Nature, 561, 360
- Bennett & Bovy (2018) Bennett, M., & Bovy, J. 2018, Monthly Notices of the Royal Astronomical Society, 482, 1417
- Binney & Tremaine (2008) Binney, J., & Tremaine, S. 2008, Galactic Dynamics
- Bland-Hawthorn & Tepper-García (2021) Bland-Hawthorn, J., & Tepper-García, T. 2021, Monthly Notices of the Royal Astronomical Society, 504, 3168
- Bovy et al. (2012) Bovy, J., Rix, H.-W., & Hogg, D. W. 2012, The Astrophysical Journal, 751, 131
- Brown et al. (2016) Brown, A. G., Vallenari, A., Prusti, T., et al. 2016, Astronomy & Astrophysics, 595, A2
- Chen et al. (2019) Chen, X., Wang, S., Deng, L., et al. 2019, Nature Astronomy, 3, 320
- Dehnen (2000) Dehnen, W. 2000, The Astronomical Journal, 119, 800
- Ferguson et al. (2017) Ferguson, D., Gardner, S., & Yanny, B. 2017, The Astrophysical Journal, 843, 141, doi: 10.3847/1538-4357/aa77fd
- Gardner et al. (2020) Gardner, S., Hinkel, A., & Yanny, B. 2020, The Astrophysical Journal, 890, 110
- Gardner et al. (2021) Gardner, S., McDermott, S. D., & Yanny, B. 2021, Progress in Particle and Nuclear Physics, 103904
- Ghosh et al. (2022) Ghosh, S., Debattista, V. P., & Khachaturyants, T. 2022, Monthly Notices of the Royal Astronomical Society, 511, 784
- Harris et al. (2020) Harris, C. R., Millman, K. J., van der Walt, S. J., et al. 2020, Nature, 585, 357, doi: 10.1038/s41586-020-2649-2
- Hinkel (2021) Hinkel, A. 2021, Theses & Dissertations
- Hinkel et al. (2020a) Hinkel, A., Gardner, S., & Yanny, B. 2020a, The Astrophysical Journal, 893, 105
- Hinkel et al. (2020b) —. 2020b, The Astrophysical Journal Letters, 899, L14
- Hinkel et al. (2023) —. 2023, The Astrophysical Journal, 942, 41, doi: 10.3847/1538-4357/ac9ccc
- Hunt et al. (2022a) Hunt, J., Johnston, K., Darragh-Ford, E., Price-Whelan, A., & Gandhi, S. 2022a, A Milky Way in motion: Dealing with dynamical disequilibria
- Hunt & Bovy (2018) Hunt, J. A., & Bovy, J. 2018, Monthly Notices of the Royal Astronomical Society, 477, 3945
- Hunt et al. (2022b) Hunt, J. A., Price-Whelan, A. M., Johnston, K. V., & Darragh-Ford, E. 2022b, Monthly Notices of the Royal Astronomical Society: Letters, 516, L7
- Hunter (2007) Hunter, J. D. 2007, Computing in Science & Engineering, 9, 90, doi: 10.1109/MCSE.2007.55
- Karim & Mamajek (2016) Karim, M. T., & Mamajek, E. E. 2016, Monthly Notices of the Royal Astronomical Society, 465, 472, doi: 10.1093/mnras/stw2772
- Lallement et al. (2022) Lallement, R., Vergely, J., Babusiaux, C., & Cox, N. 2022, Astronomy & Astrophysics, 661, A147
- Levine et al. (2006) Levine, E. S., Blitz, L., & Heiles, C. 2006, The Astrophysical Journal, 643, 881
- Lindegren et al. (2018) Lindegren, L., Hernandez, J., Bombrun, A., et al. 2018, Astronomy & Astrophysics, 616, A2
- Majaess et al. (2009) Majaess, D. J., Turner, D. G., & Lane, D. J. 2009, Monthly Notices of the Royal Astronomical Society, 398, 263, doi: 10.1111/j.1365-2966.2009.15096.x
- Meurer et al. (2017) Meurer, A., Smith, C. P., Paprocki, M., et al. 2017, PeerJ Computer Science, 3, e103, doi: 10.7717/peerj-cs.103
- Miyamoto & Nagai (1975) Miyamoto, M., & Nagai, R. 1975, Publications of the Astronomical Society of Japan, 27, 533
- Navarro et al. (1997) Navarro, J. F., Frenk, C. S., & White, S. D. 1997, The Astrophysical Journal, 490, 493
- Prusti et al. (2016) Prusti, T., De Bruijne, J., Brown, A. G., et al. 2016, Astronomy & Astrophysics, 595, A1
- Skowron et al. (2019) Skowron, D. M., Skowron, J., Mróz, P., et al. 2019, Science, 365, 478
- Spitzer Jr. (1942) Spitzer Jr., L. 1942, Astrophysical Journal, 95, 329
- Swiggum et al. (2022) Swiggum, C., Alves, J., D’Onghia, E., et al. 2022, Astronomy & Astrophysics, 664, L13
- Trick et al. (2021) Trick, W. H., Fragkoudi, F., Hunt, J. A., Mackereth, J. T., & White, S. D. 2021, Monthly Notices of the Royal Astronomical Society, 500, 2645
- Verlet (1967) Verlet, L. 1967, Physical review, 159, 98
- Widmark et al. (2022) Widmark, A., Widrow, L., & Naik, A. 2022, Astronomy and Astrophysics, 668, A95
- Widrow et al. (2012) Widrow, L. M., Gardner, S., Yanny, B., Dodelson, S., & Chen, H.-Y. 2012, The Astrophysical Journal Letters, 750, L41
- Xu et al. (2015) Xu, Y., Newberg, H. J., Carlin, J. L., et al. 2015, The Astrophysical Journal, 801, 105
- Yanny & Gardner (2013) Yanny, B., & Gardner, S. 2013, The Astrophysical Journal, 777, 91