GRB 231115A - a magnetar giant flare in the M82 galaxy
Abstract
The results of a study of the short gamma-ray burst GRB 231115A in the X-ray and gamma-ray ranges are presented, based on data from the INTEGRAL and Fermi space observatories. The source of the burst is localized by the IBIS/ISGRI telescope of INTEGRAL observatory with an accuracy of , it is located in the Cigar Galaxy (M 82). Early follow-up observations of the burst localization region were carried out in the optical range with the 36-cm telescope of the ISON-Kitab observatory and the 70-cm telescope AS-32 of the Abastumani Astrophysical Observatory, the optical emission has not been detected. The proximity of the host galaxy ( Mpc) significantly limits energetics of the event ( erg) and allows us to interpret the burst as a giant flare of a previously unknown soft gamma repeater (SGR) which is an extreme manifestation of the activity of a highly magnetized neutron star (magnetar). This conclusion is confirmed by the energy spectrum atypically hard for cosmological gamma-ray bursts, as well as the absence of optical afterglow and gravitational wave signal, which should have been detected in the LIGO/Virgo/KAGRA experiments if the burst was caused by a merger of binary neutron stars. The location of the burst in the – and – diagrams also suggests that GRB 231115A was a magnetar giant flare. This is the first well-localized giant flare of an extragalactic SGR.
keywords:
gamma-ray transients, gamma-ray bursts, neutron star mergers, soft gamma repeaters, magnetarsto be20245011327[21]
18.11.2023
1 INTRODUCTION
The presence of two different types of gamma-ray bursts (GRBs) was discovered in the KONUS experiment (Mazetz et al. 1981) and later confirmed by the CGRO/BATSE detector (Kouveliotou et al. 1993) when analyzing the distribution of bursts by the duration parameter . Short bursts (lasting less than 2 s) are characterized by a harder energy spectrum (with a larger portion of high-energy emission) and a less pronounced spectral evolution (lag of low-energy emission relative to high-energy one) compared to long bursts ( s, e.g. Kouveliotou et al. 1993; Norris et al. 2005; Minaev et al. 2010a, 2012, 2014). At the same time, duration and spectral hardness distributions for these two types traditionally used for classification of gamma-ray bursts, overlap significantly, leaving the problem of burst classification in the intersection area of distributions relevant up to the present day (see, e.g., Dezalay et al. 1997; Minaev et al. 2010b; Minaev & Pozanenko 2017; Tarnopolsky 2019).
It is believed that the short gamma-ray bursts (later designated as type I bursts) are associated with a merger of two neutron stars (Blinnikov et al. 1984; Paczynski 1986; Meszaros & Rees 1992), which has been recently confirmed by the detection of the GRB/GW 170817 and GRB/GW 190425 events by the LIGO/Virgo gravitational wave detectors (Abbott et al. 2017a,b; Pozanenko et al. 2018, 2019). Some type I bursts are accompanied by an additional emission component with a duration of tens of seconds and a softer (compared to the main episode of emission) spectrum — extended emission, which nature has not yet been clarified (Connaughton 2002; Gehrels et al. 2006; Rosswog 2007; Metzger et al. 2008; Minaev et al. 2010a; Norris et al. 2010; Barkov & Pozanenko 2011).
The long (type II) gamma-ray bursts are associated with the core collapse of a massive star (Woosley 1993; Paczynski 1998; Meszaros 2006), some of them, closest to the observer, are accompanied by type Ic supernovae (see, e.g., Galama et al. 1998; Paczynski 1998; Cano et al. 2017; Volnova et al. 2017; Belkin et al. 2020, 2023).
There are anomalies in the correlation between the duration of gamma-ray bursts and their type when some short gamma-ray bursts were accompanied by supernova explosions (e.g., GRB 200826A, Rossi et al. 2022) or, conversely, the long GRB 230307A was associated with a kilonova (Levan et al. 2023). Thus, the correct classification of gamma-ray bursts, along with determining the redshift of their host galaxies, is important for studying their sources.
Short bursts of hard emission are also characteristic of some soft gamma repeaters (SGR, Golenetskij et al. 1979; Mazets et al. 1979a) during their extreme activity (the so-called giant flares, e.g. Mazets et al. 1979b, 2008; Thompson & Duncan 2001; Frederiks et al. 2007). The light curve of a giant flare consists of a short (fractions of a second), hard and very bright main episode, which may be followed by a long (hundreds of seconds) and much weaker extended emission, characterized by periodicity connected with rotation of a neutron star in which magnetosphere the giant flare occurred.
All soft gamma repeaters confirmed by long-term observations are located in the Galaxy, so far, giant flares have been detected from four of them. However, the main short episode of a giant flare could also be detected from some nearby galaxies. For example, a giant flare from SGR 1806-20 could be confidently detected at a distance of 30–50 Mpc (Hurley et al. 2005; Nakar et al. 2005). Several candidates to giant SGR flares, possibly originating in nearby galaxies, have been proposed, based on the IPN triangulation results (see, e.g., Frederiks et al. 2007; Mazets et al. 2008).
Observed properties of the giant flares (time profile, hardness and spectral evolution of the emission) and their frequency (no repeated giant flares have been observed from any known SGR so far) are largely similar to the properties of type I GRBs. This introduces some difficulty in classification of transient gamma-ray events (Mazets et al. 2008; Minaev & Pozanenko 2020b). The most reliable method for identifying SGR sources is the detection of periodicity in a tail of their light curves. Periodicity has been found for many galactic SGRs, for example: SGR 0520-66 (Mazets et al. 1979b), SGR 1806-20 (Mazets et al. 2005; Palmer et al. 2005), SGR 1900+14 (Mazets et al. 1999; Feroci et al. 1999). Periodicity was found after a few short gamma-ray bursts detected in the BATSE/CGRO experiment, for example: GRB 930905 (Pozanenko et al. 2005) and GRB 970110 (Crider 2006), and these gamma-ray bursts also may be considered as candidates to giant flares of unidentified SGRs.
Soft gamma repeaters are most likely connected with magnetars — single neutron stars with extremely strong magnetic fields ( G). The incredible power and physical origin of their giant flares remain unclear (Duncan & Thompson 1992; Thompson & Duncan 1995; Kouveliotou et al. 1999).
Localization of the short gamma-ray burst GRB 231115A with an accuracy better than 2\arcmin, carried out as part of the operational (Quick Look) analysis of telemetry data from the IBIS/ISGRI gamma-ray telescope of the INTEGRAL observatory, reliably connects it with the nearby galaxy M 82 with active star formation (Burns 2023), which allows one to suggest this event being caused not by the merger of a pair of neutron stars, but by a giant flare of a previously unknown soft gamma repeater located in this galaxy (see, for example, D’Avanzo et al. 2023a; Minaev & Pozanenko 2023b).
The paper presents the results of observations and analysis of GRB 231115A in gamma-rays based on data from INTEGRAL and Fermi observatories and our own early optical observations of the localization region in order to clarify the nature of the burst source. In particular, we used the classification based on the correlation of the total energy parameter , spectral hardness (Amati et al. 2002), and duration of gamma-ray bursts in the rest frame , proposed by Minaev & Pozanenko (2020a,b).
GRB 231115A DETECTION AND EARLY OBSERVATIONS
GRB 231115A with a duration of about 0.1 s and a hard emission spectrum, which is characteristic of both type I (short) gamma-ray bursts and giant flares of magnetars (SGRs), was detected on November 15, 2023 at 15\uh36\um21\fs20 UT by following space gamma-ray detectors: Fermi/GBM (Dalessi et al. 2023), INTEGRAL/IBIS/ISGRI (Mereghetti et al. 2023), KONUS-Wind (Frederiks et al. 2023), Glowbug (Cheung et al. 2023), Insight-HXMT/HE (Xue et al. 2023), and Swift/BAT (Roncini et al. 2023).
The burst was detected in the field of view of the IBIS/ISGRI telescope, therefore its position was determined with an accuracy better than 2\arcmin, which made it possible to identify the host galaxy — M 82 (D’Avanzo et al. 2023a; Burns 2023; Mereghetti et al. 2023). The high localization accuracy initiated a search for possible emission in other energy ranges. Attempts to observe the optical afterglow undertaken by many scientific groups at different telescopes were unsuccessful (Lipunov et al. 2023a,b; Balanutsa et al. 2023; Iskandar et al. 2023; Chen et al. 2023; Jiang et al. 2023; Hayatsu et al. 2023; Perley et al. 2023; D’Avanzo et al. 2023b; Turpin et al. 2023; An et al. 2023; Hu et al. 2023). An optical candidate discovered by the 0.7-m GROWTH-India telescope (Kumar et al. 2023a) was found to be an artifact after more in-depth analysis (Kumar et al. 2023b).
The Swift/XRT and NuSTAR X-ray telescopes detected no signs of an X-ray afterglow 2.5 and 4 hours after the trigger, respectively (Osborne et al. 2023; Grefenstette & Brightman 2023). The MAGIC experiment obtained an upper limit on the gamma-ray flux in the range above 250 GeV 8 hours after the burst (MAGIC Collaboration, 2023). The CHIME/FRB radio telescope has also not detected any activity from the source, similar to a fast radio burst (FRB) in the range of 400–800 MHz (Curtin 2023).
Finally, the LIGO/Virgo/KAGRA gravitational-wave detectors have not detected the signal that should have accompanied the merger of two neutron stars if the detected burst was indeed a short gamma-ray burst caused by such mergers (LIGO Collaboration, 2023). A neutrino signal has also not been detected in the IceCube experiment (IceCube Collaboration, 2023).
DATA ANALYSIS OF THE INTEGRAL OBSERVATORY
The INTErnational Gamma-Ray Astrophysics Laboratory INTEGRAL (Winkler et al. 2003; Kuulkers et al. 2021) has been operating in a high apogee orbit for the 22nd year. There are several wide-field telescopes on board with a coding aperture capable to obtain sky images and perform a comprehensive analysis of the energy spectra and variability of various cosmic sources: the IBIS gamma-ray telescope with two detectors: ISGRI (Lebrun et al. 2003), sensitive in the range of 20–400 keV, and PICsIT (Labanti et al. 2003), sensitive in the range of 200 keV – 10 MeV, the gamma-ray spectrometer SPI (Vedrenne et al. 2003) with cooled germanium detectors, sensitive in the range of 20 keV – 8 MeV, and two JEM-X X-ray telescopes (Lund et al. 2003), sensitive in the range of 4–30 keV. Note also the anti-coincidence shield ACS of the SPI gamma-ray spectrometer (Rau et al. 2005), which operates as a large-area omnidirectional detector in the range 85 keV – 10 MeV and records the photon count rate with a time resolution of 50 ms.
The burst was detected during the scheduled observations of the M 81 galaxy field, carried out under the INTEGRAL AO-20 proposal # 2020020 (PI I.A. Mereminsky). Immediately after the burst detection the data from all instruments in the time interval, starting from hours before the burst and up to hours after it, were transferred to the authors of this work within the framework of the AO-20 proposal # 2040014 (PI P.Yu. Minaev) for detailed analysis and comprehensive study of the burst.
Time profile of the burst
The burst GRB 231115A fell into the field of view of the main telescopes of the observatory, which allowed them to detect and study it nearly in real time using the automatic IBAS system (Mereghetti et al. 2023). The system performs the Quick Look analysis of data from the IBIS/ISGRI telescope and distributes alerts on the localized gamma-ray bursts through the Gamma-ray burst Coordinate Network (GCN) system.
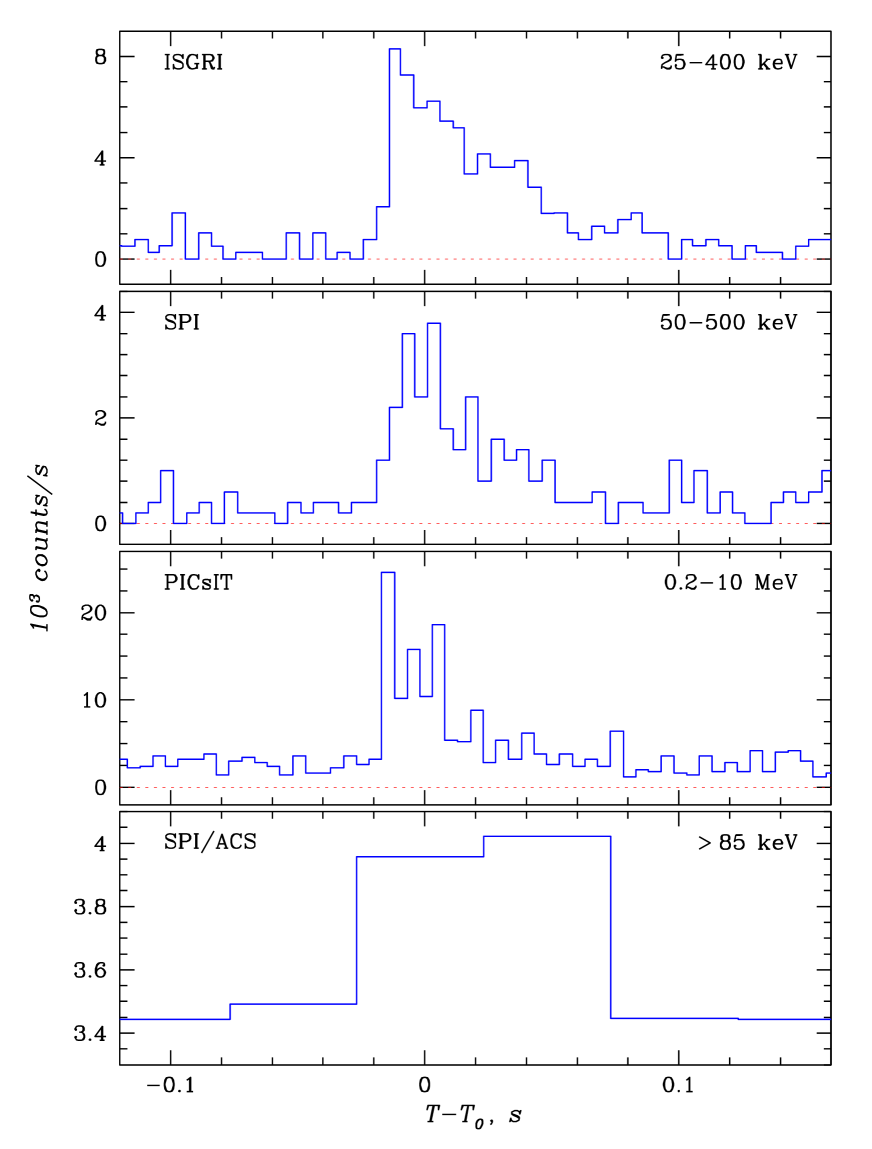
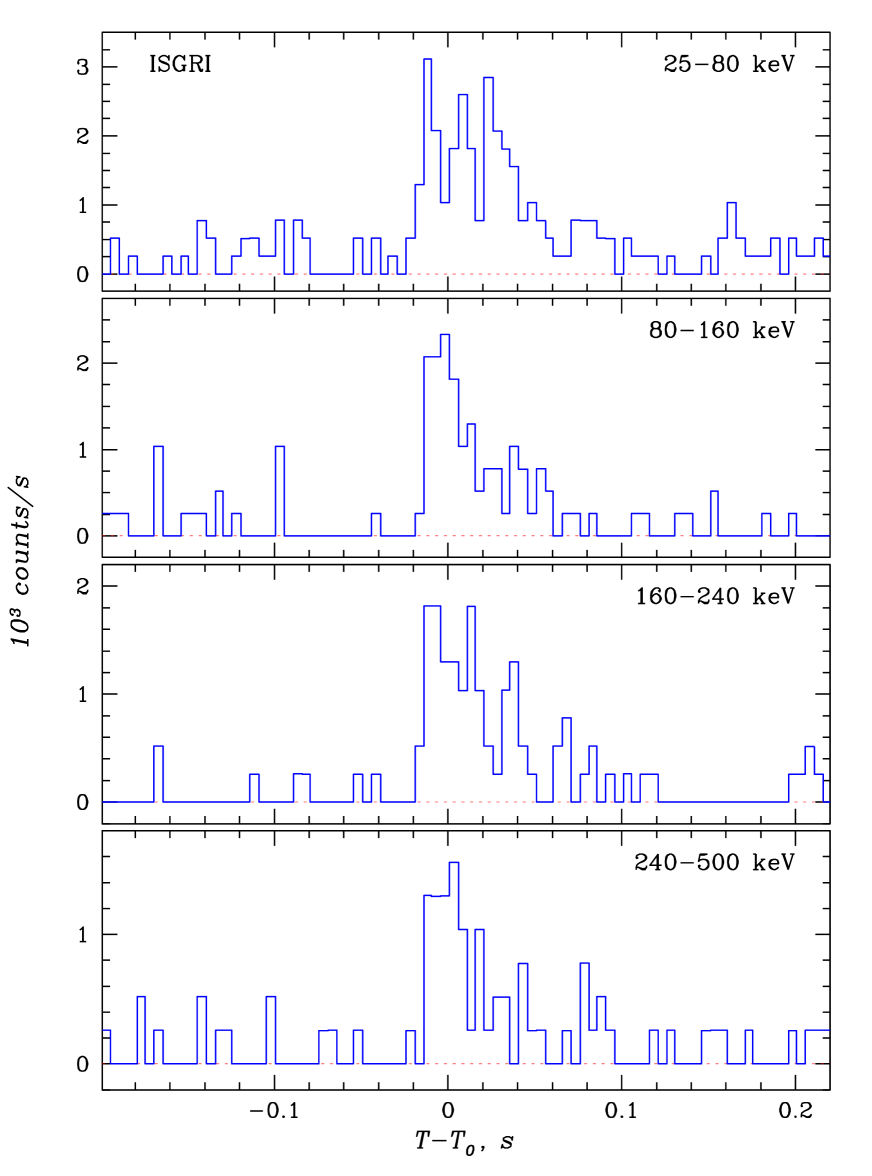
Figure 1 shows the time profiles of the burst obtained by the IBIS/ISGRI detector in four different energy bands (count rate records with a resolution of 5 ms). The time is counted from the trigger time of the event by the Fermi/GBM monitor (Dalessi et al. 2023), corrected for 0.47 s of a time delay due to the large distance of the INTEGRAL spacecraft from the Earth at the moment of the burst. It is seen that the burst is hard (clearly observed up to 500 keV) and has a FRED-like (fast rise — exponential decay) time profile with a total duration of less than 120 ms at energies keV. This allows us to classify it as a type I (short) burst or a giant flare of a previously unknown magnetar. At the same time, it is obvious that the maximum number of photons was recorded in the softest IBIS/ISGRI band ( keV). The profile of the burst changes in this band and becomes pedestal-shaped with a wide ( ms) top, possibly behind counting the superposition of several short flashes at once.
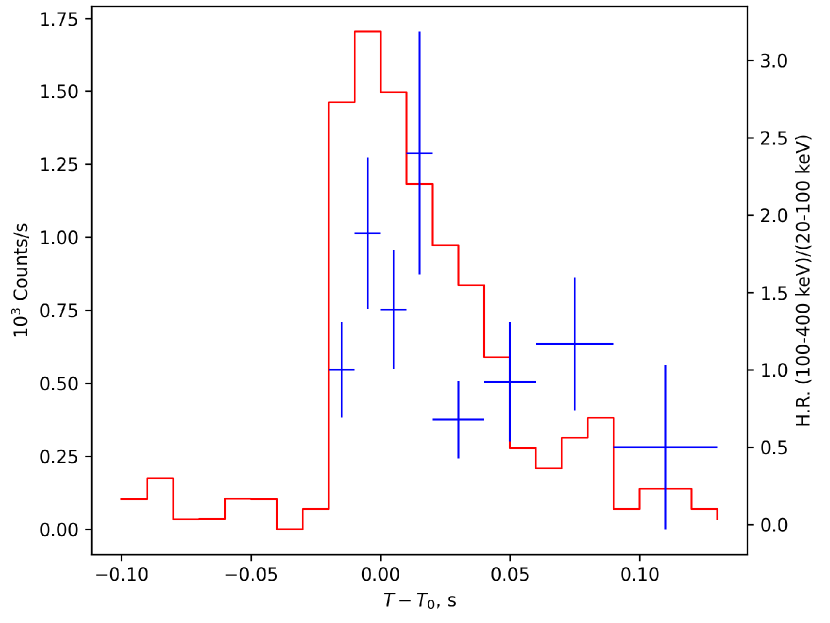
This is also confirmed by the evolution of hardness of the GRB 231115A emission shown in Fig. 2. The emission hardness (blue crosses, right scale) is defined as the ratio of the number of photons detected by the IBIS/ISGRI telescope in the 100–400 and 20–100 keV bands. For comparison, the red line shows the time profile of the burst in the wide 20–400 keV range (only photons were taken into account whose probability of association with the burst exceeded 20%). It is seen that the hardest emission was recorded during the first ms of the burst, and all this time the hardness gradually increased. Its average value . During the next ms, the hardness ratio significantly (at the level of ) decreased by 1.9 times to the value . A drop in hardness ratio towards the end of the event is observed in many gamma-ray bursts. In giant flares of magnetars, the evolution of the hardness ratio is poorly understood due to their exceptional brightness, which saturates the telemetry of most instruments.
The burst has been also detected by other instruments on board INTEGRAL. In Fig. 3 its time profiles obtained from data of the gamma-ray telescopes SPI, IBIS/PICsIT, and SPI-ACS are presented in comparison with the broad-band profile obtained by the IBIS/ISGRI telescope in the range of 25–400 keV. It is seen that the burst is confidently detected up to 500 keV and above. The profiles in many aspects (up to statistical errors) repeat each other. Note that the slightly skewed shape of the burst profile measured by the SPI/ACS detector can be explained by the fact that the first time bin in the photon count rate record during the burst began noticeably before the burst, which lowered the total number of photons measured in the bin. The source was not detected by the JEM-X telescopes, although it was only from the center of their field-of-view in the region of their fairly high sensitivity. The upper limit on the X-ray flux from the burst in the 3–20 keV range (at the level), obtained from data of both the JEM-X telescopes assuming that the event had a duration of 50 ms in this energy range, is 1.9 Crab, which corresponds to the flux .
Localization
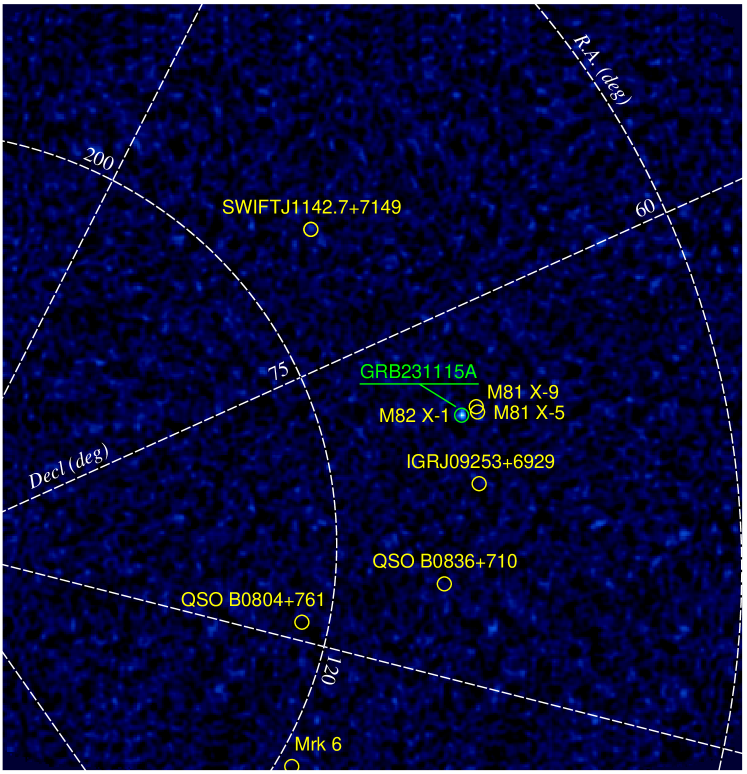
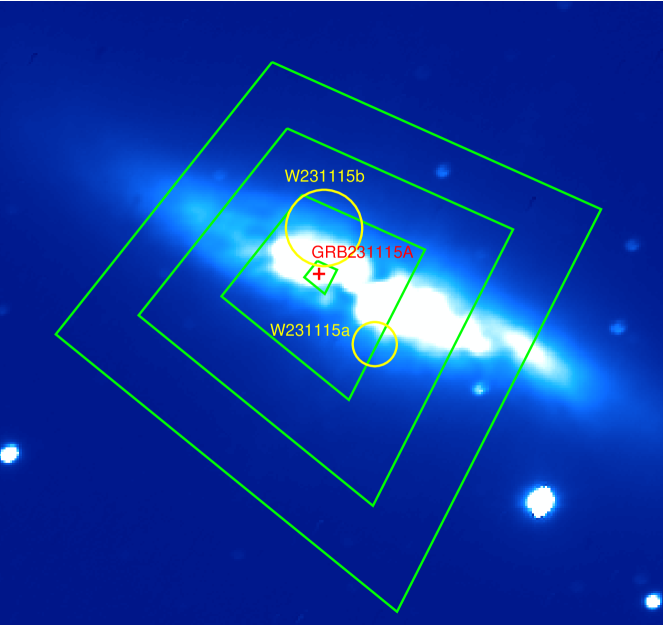
One of the most important results is the localization of GRB 231115A. The first information on coordinates of the new burst was promptly distributed by the automatic IBAS system (d’Avanzo et al. 2023a; Burns 2023; Mereghetti et al. 2023), which allowed its observations to be quickly begun with optical and radio telescopes over the world. Figure 4 shows an image of the sky within the field of view of the IBIS/ISGRI telescope of in size, accumulated over the duration of the burst (120 ms) in the energy range of 20–400 keV. In such a short time, only the burst itself was detected in the field at a significant level (the signal-to-noise ratio ).
But the main result is that the figure clearly shows that the burst occurred in the nearby well-known galaxy M 82 (Cigar), located at a distance of Mpc. The source coordinates are R.A. Decl. (, ; epoch 2000.0, uncertainty is ). Figure 5 shows the contours corresponding to different levels of the ratio for the source of the burst in this image, superimposed on the optical (in the R filter) image of the M 82 galaxy, obtained by us with the 70-cm AS–32 telescope of the Abastumani Astrophysical Observatory (10.7 hours after the burst). It is seen that the center of localization lies in the disk of the galaxy, leaving no doubt that it is the host of GRB 231115A. There were several other known extragalactic X-ray sources within the telescope’s field of view, including the ultraluminous sources in the galaxies M 81 and M 82; none of them appeared in the image during such a short exposure and, obviously, could not contribute to the time profile of the burst.
Emission spectrum
Figure 6 shows the emission spectrum of the gamma-ray burst GRB 231115A, obtained from the data of the IBIS/ISGRI telescope in the 20–400 keV range. The spectrum has been accumulated over the entire duration of the event. It is seen that it is very hard, the energy contained in the emission increases with increasing the photon energy. An attempt to approximate the spectrum using simple one-component models: powerlaw (PL), cutoffpl (CPL) or bbodyrad (BBR), has been not very successful, which confirms the visual impression on the presence of two components in the spectrum – the soft and hard ones. The XSPEC package developed at NASA/HEASARC (Arnaud et al. 1996) was used for approximation. The results of approximation (best-fit parameters and fluxes) are summarized in Table 1. The CPL model gives a slightly better approximation:
| (1) |
where is the photon spectrum, is the photon index, and is the characteristic energy of the high-energy cutoff. Note that the average photon index for the burst (according to the PL model) is , which means that the spectral index () is negative and the spectral density of emission increases with energy. Note also that the exponential cutoff in the spectrum at high energies according to the IBIS/ISGRI telescope data is, in fact, not very reliable. In particular, the cutoff energy keV, obtained by approximating the spectrum with the CPL model, was determined with large errors ( keV) and therefore was then fixed and was not used as a free parameter. Thanks to exact knowledge of the burst’s host galaxy (M 82) and the luminosity distance to it ( Mpc), it is possible to determine the average luminosity of the burst in the range of 20–400 keV as .
The burst spectrum may be more successfully approximated by the two-component models BBRBBR and BBRCPL. As can be seen from Table 1, in both cases the soft emission component can be described by the black-body spectrum with the temperature keV and radius of the emitting surface km. Note that the value of exceeds the typical radius km of a neutron star as well as the temperature exceeds by nearly an order of magnitude the Eddington temperature for a neutron star (if we actually observed a magnetar flare), thus the black-body photosphere with such a temperature should expand and outflow effectively. It is obvious that the use of the black-body spectrum to describe the soft component of the burst emission was not physically justified but was applied for simplicity and convenience. If this component was indeed connected with the expanded photosphere of a neutron star, its spectrum should have been formed in result of Comptonization and had a Wien shape. Note that the spectral index of the hard power-law component of the emission (in the CPL model) is negative, and therefore the emission spectrum rises very steeply towards high energies. The normalization used for the figure shows immediately that the main emission energy is in the hardest part of the spectrum (it is contained in photons with energies keV).
| Model | A | Flux, | ||||||
| keV | erg s-1 cm-2 | |||||||
| PL | 30.6/29 | – | ||||||
| BBR | 31.1/29 | – | ||||||
| CPL | 29.8/28 | 328 | ||||||
| BBR | 26.6/27 | – | ||||||
| BBR | – | |||||||
| CPL | 24.9/26 | |||||||
| BBR | – | |||||||
| The minimum value of and the number of degrees of freedom . | ||||||||
| Photon index of the power-law component . | ||||||||
| Normalization of this component at 100 keV [ cm-2 keV-1]. | ||||||||
| Radius of the radiating surface [km] at the distance Mpc. | ||||||||
| Temperature or exponential cutoff energy . | ||||||||
| Flux in the 20–400 keV range. | ||||||||
Fermi/GBM DATA ANALYSIS
The monitor of gamma-ray bursts (GBM) on board the Fermi observatory consists of 12 NaI scintillaton detectors, sensitive in the 8–1000 keV range, and 2 BGO scintillaton detectors, sensitive in the 0.2–40 MeV range. It is designated for the registration and comprehensive study of cosmic gamma-ray bursts (Meegan et al. 2009; Paciesas et al. 2012). The source of data from the Fermi/GBM monitor in this study was a public FTP archive legacy.gsfc.nasa.gov/fermi/data. Again the moment of the burst trigger by Fermi/GBM, November 15, 2023 at 15\uh36\um21\fs20 UT, is used as zero on a time scale.
Structure of light curve
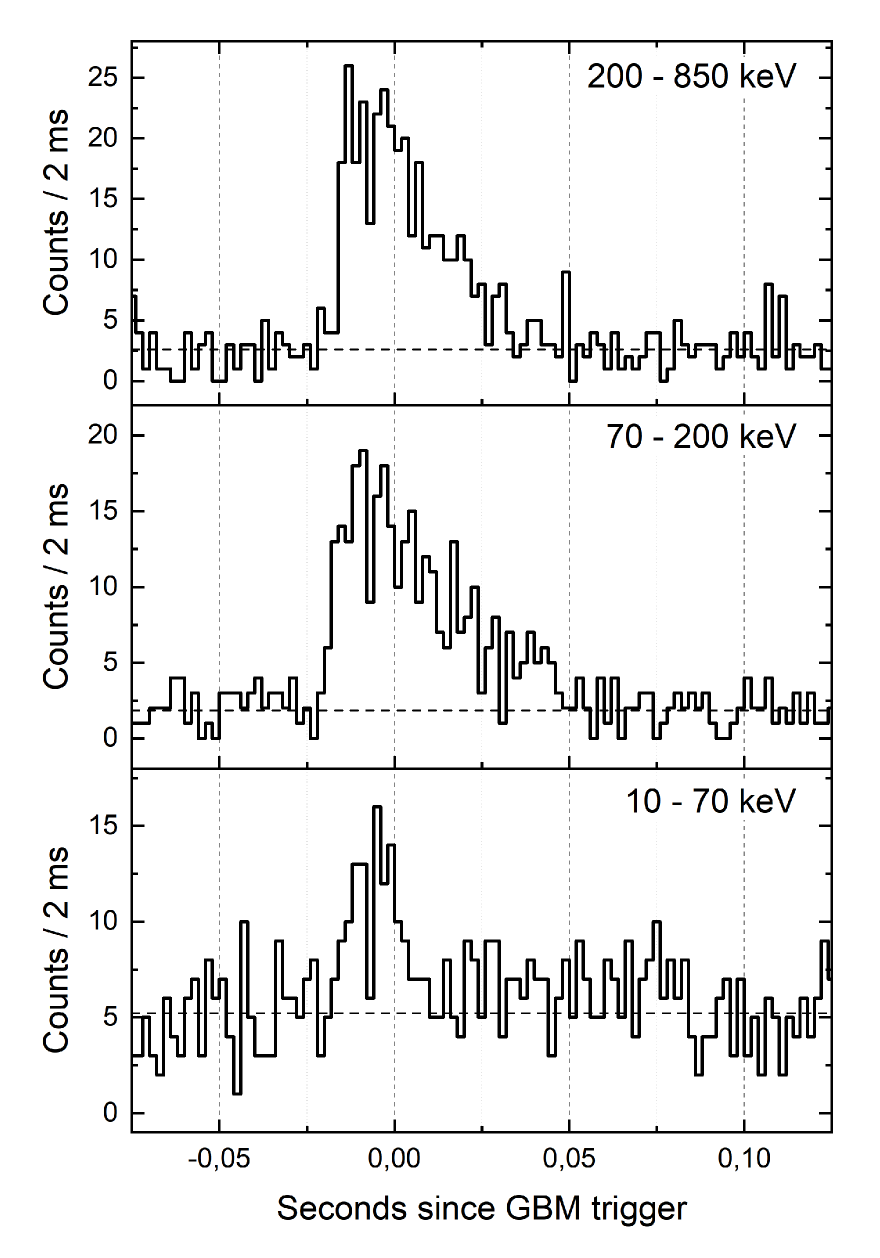
The light curves were analyzed using event-by-event (TTE) data from the most illuminated detectors NaI_06 – NaI_09, NaI_11, and BGO_01 of the Fermi/GBM experiment. The light curve in three channels covering the energy range 10–850 keV is presented in Fig. 7. The duration parameter , the time interval during which the detector records 90% of the total number of counts (see, for example, Koshut et al. 1996), was ms for GRB 231115A, which is typical for both giant flares of SGRs and short GRBs.
It is seen from Fig. 7 that the shape of the GRB 231115A light curve varies depending on the energy range — the shortest burst is in the soft 10–70 keV range, and the longest one is in the middle one of 70–200 keV. This is unusual for gamma-ray bursts, which duration usually decreases with increasing energy in a power-law manner (Fenimore et al. 1995)111This contradicts the conclusion drawn from the analysis of the light curves obtained by the IBIS/ISGRI telescope of the INTEGRAL observatory, that the burst time profile in the softest channel becomes wider than that in the hard channels. Note, however, that the sensitivity of Fermi/GBM at such low energies falls noticeably while its background count rate rises.. The light curve probably consists of two emission episodes: the main one (time interval from -0.02 s to 0.01 s) and the secondary one (interval from 0.01 s till 0.05 s), different in the shape of the energy spectrum (see the next section).
The minimum time scale of variability, defined as the minimum time interval during which the energy flux from the source changes by more than 3 standard deviations compared to the adjacent intervals, is observed in the middle of the main episode (at s) and is equal to ms. However this cannot be an indicator for a SGR flare since this kind of rapid variability is also seen in many gamma-ray bursts (Mitrofanov et al. 1990).
Galactic giant flares of SGRs are also characterized by long (up to several hundred seconds) extended emission with a detectable periodicity. Relative contribution of the extended emission to the total energy of the phenomena varies widely from 1 to 30% (Mazetz et al. 2008). We have not detected any significant extended emission for the event GRB 231115A in the Fermi/GBM data in both the wide 10–850 keV energy range and the narrower energy bands 10–70, 70–200, and 200–850 keV. The upper limit (at the level of three standard deviations) on the time-integrated flux of extended emission on a time scale of 50 s in the 10–850 keV range exceeds the flux of the main emission episode of GRB 231115A by almost three times. Thus, the lack of detection of any extended emission cannot serve as a reason to reject the association of GRB 231115A with a giant flare of SGR sources.
Spectral evolution
Gamma-ray bursts are characterized by spectral evolution, which can be measured by a relative shift (lag) of the light curve profiles in different energy bands. The lag is considered positive if the hard emission “leads” the soft one, and it is determined either using cross-correlation analysis of the light curves (Minaev et al. 2014) or as a shift in the position of the light curve maximum (Hakkila & Preece 2011). The elementary structures (pulses) in the light curve of gamma-ray bursts are usually characterized by the positive lag, while the negative lag observed in some cases may be a consequence of the superposition effect and arises when the bursts with a complex, multi-pulse structure of the light curve are analyzed, because individual pulses have unique properties (Minaev et al. 2014).
In this work, to study the spectral evolution, we used the cross-correlation method described by Minaev et al. (2014). For this purpose the light curves of GRB 231115A were constructed with a time resolution of 1 ms in seven different energy bands covering the energy range 10–1000 keV. The light curves based on data from the NaI_06 – NaI_09, and NaI_11 detectors were summed, but the light curve constructed from data of the BGO_01 detector was studied separately. The 120–220 keV light curve formed using data from the detectors NaI_06 – NaI_09, and NaI_11 was selected as the reference one, that is the curve relative to which the remaining curves have been cross-correlated.
The cross-correlation analysis have not revealed significant spectral evolution, in contrast to GRB 200415A, also apparently a magnetar giant flare (Minaev & Pozanenko 2020b). At the first glance, the results obtained contradict the behavior of the light curves in Fig. 7, from which it is obvious that the energy spectrum evolves with time — the profile of the light curve in the soft 10–70 keV band is noticeably narrower and ends earlier that the pulses in the middle (70–200 keV) and hard (200–850 keV) bands. This implies a negative spectral lag. However, the cross-correlation analysis reveals mainly a shift in the light curves in the region of their maximum, which is absent in our case. The absence of a significant spectral lag is probably due to the complex structure of the light curve and the superposition effect (Minaev et al. 2014).
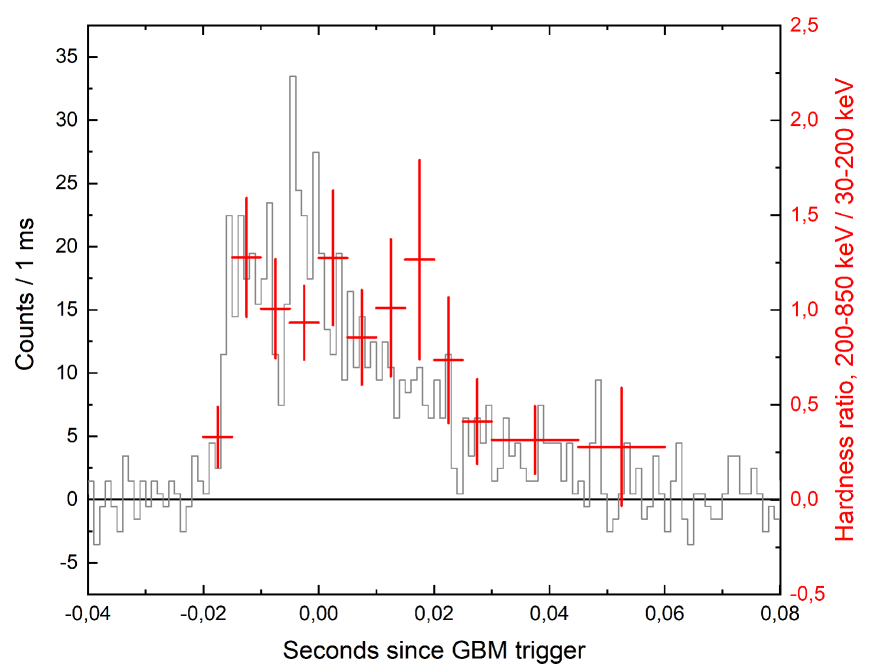
Also, we have examined the time evolution of the hardness ratio of the burst emission using the Fermi/GBM data. We have defined the hardness as the ratio of fluxes expressed in instrumental counts with subtracted background in the 200–850 and 30–200 keV energy bands. Figure 8 shows the corresponding dependence of the hardness ratio on time. The dependence generally follows the profile of the burst’s light curve, it rises quickly, remains high for some time during the main bright episode, and then falls. The figure confirms the evolution of the hardness ratio found in data of the IBIS/ISGRI telescope of the INTEGRAL observatory (Fig. 2, note that slightly different energy bands have been used in the hardness calculations here). This kind of behavior is observed sometimes in the gamma-ray bursts with a complex light curve structure (Gupta et al. 2021), therefore it is impossible to unambiguously classify this event as a magnetar giant flare based on the type of this dependence only.
Emission spectrum
To reconstruct and fit emission spectra of the burst we used the RMfit v4.3.2 software package, specially developed for analyzing data from the GBM monitor of the Fermi observatory (fermi.gsfc.nasa.gov/ssc/data/analysis/rmfit/). The spectral analysis technique is similar to that proposed by Gruber et al. (2014). The energy spectra were analyzed using data from the NaI_06, NaI_07, NaI_11, and BGO_01 detectors of the Fermi/GBM experiment.
We studied the energy spectrum of GRB 231115A in three time intervals: interval (–0.02 s, 0.05 s) corresponds to the spectrum of the whole burst, (–0.02 s, 0.00 s) — the main emission episode, (0.00 s, 0.05 s) — the secondary one. The energy spectrum in all studied time intervals is unsatisfactorily described by the thermal black-body model bbody (BB), the optimal model is a power law with an exponential cutoff cutoffpl (CPL, see equation (1)).
Although the combination of two thermal models (2 BB) gives slightly better approximation of the data, the observed difference in the value of the statistical functional CSTAT does not allow one to reject the CPL model that has one degree of freedom less. The results of our spectral analysis using the BB, CPL, and 2 BB models are presented in Table 2.
The emission spectrum in all cases has the photon index with the spectral peak energy keV (Table 2). The given value of the spectral index is atypical for short gamma-ray bursts, which on average are characterized by a more rapidly decaying spectrum with a value of (see, for example, Burgess et al. 2019). A similar value of the spectral index was previously observed in other SGR giant flares (Minaev & Pozanenko, 2020b). In Fig. 9 the spectrum of the whole burst is presented in the time interval (–0.02 s, 0.05 s) fitted by the CPL and 2 BB models.
| T, | Model | CSTAT | , | Fluence, | ||
| ms | /dof | cm-2 s-1 keV-1 | keV | erg cm-2 | ||
| (–20, 50) | BB | 485/412 | (3.33)10-6 | – | 135 8 | 7.50 0.50 |
| CPL | 471/411 | (6.27)10-2 | -0.34 0.20 | 637 | 7.25 0.46 | |
| 2BB | 466/410 | (4.6)10-5 | – | 36 | 7.55 0.50 | |
| (1.62)10-6 | – | 162 | ||||
| (–20, 0) | BB | 435/412 | (6.3)10-6 | – | 132 10 | 3.71 0.32 |
| CPL | 423/411 | (1.18)10-1 | -0.20 0.23 | 631 | 3.50 0.30 | |
| 2BB | 419/410 | (1.56)10-4 | – | 29 | 3.72 0.32 | |
| (3.2)10-4 | – | 156 | ||||
| (0, 50) | BB | 438/412 | (2.22)10-4 | – | 137 13 | 3.82 0.38 |
| CPL | 433/411 | (4.17)10-2 | -0.47 0.31 | 635 | 3.74 0.35 | |
| 2BB | 432/410 | (1.7)10-5 | – | 44 | 3.85 0.38 | |
| (9.9)10-7 | – | 168 | ||||
| Time interval relative to trigger of Fermi/GBM. | ||||||
| Photon index of the power-law component. | ||||||
| Spectral peak energy where is the energy of an exponential cutoff in Eq. (1) | ||||||
| or for the models BB and 2 BB. | ||||||
| Time-integrated energy flux in the range 10–1000 keV. | ||||||
Spectral analysis of two episodes of GRB 231115A, identified during the analysis of light curves, did not reveal significant differences in the parameters of the spectral models. Within the CPL model, the photon index of the secondary episode is slightly higher with nearly the same value of the exponential cutoff ( keV), which may explain the relative lack of the soft emission in the secondary episode.
We estimated the isotropic equivalent of the total energy under the assumption of association of the source with the galaxy M 82 ( Mpc) in the energy range 1–10 000 keV, having extrapolated the CPL model spectrum obtained in the 7–3000 keV range. It is equal to erg. Likewise, the peak luminosity calculated in the time interval (–0.02 s, 0.0 s) is .
For the thermal black-body model (BB) one can estimate the radius of the emitting region using the peak luminosity and the Stefan-Boltzmann law for the emission with the temperature keV. The resulting radius km corresponds by order of magnitude to the size of the magnetosphere of a neutron star.
POPULATION ANALYSIS OF THE BURST
It is interesting to compare the obtained values of the duration and energetics of GRB 231115A with the parameters of other gamma-ray transients.
– correlation
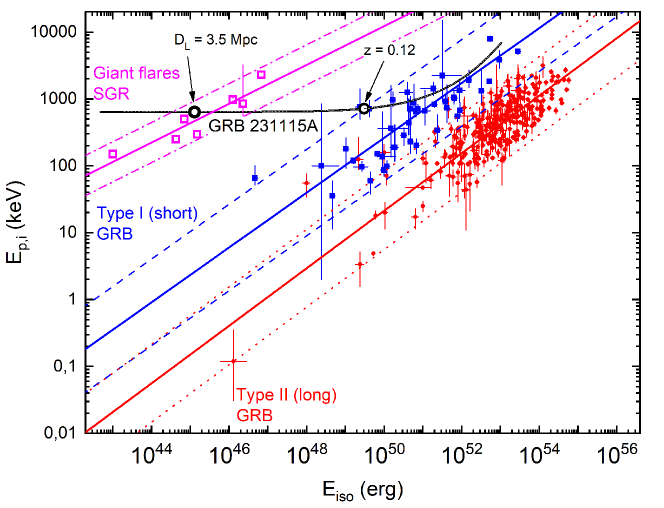
Minaev & Pozanenko (2020a) have shown that the correlation between the isotropic equivalent of the total energy, emitted in the gamma-ray range, and the position of the extremum in the energy spectrum in the source’s rest frame (equation (2), Golenetskii et al. 1983; Amati et al. 2002) can be effectively used to classify GRBs.
This is facilitated by the observational fact that the correlation for various types of gamma-ray bursts is described by a power law with a single index of , while the correlation region of type I GRBs is located upper than the correlation region of type II bursts. Subsequently, in Minaev & Pozanenko (2020b) the known giant flares of SGR sources were additionally considered, and it turned out that they also follow a similar correlation with the index and occupy an isolated location on the – diagram. This made it possible to include them in the classification scheme proposed by Minaev & Pozanenko (2020a).
| (2) |
To analyze the position of GRB 231115A on the – diagram, we used a sample of 316 gamma-ray bursts and 7 magnetar giant flares, as well as the results of analysis of the – correlation for this sample (Minaev & Pozanenko 2020a,b, 2021). The corresponding – diagram is presented in Fig. 10. It is obvious that the location of GRB 231115A on the diagram allows us to unambiguously classify the burst as a magnetar giant flare. The figure also shows the trajectory of changing the source location on the diagram vs its redshift . The event could be also classified as a short gamma-ray burst since redshift (the intersection point of the trajectory with the boundary of the short gamma-ray burst correlation region).
– diagram
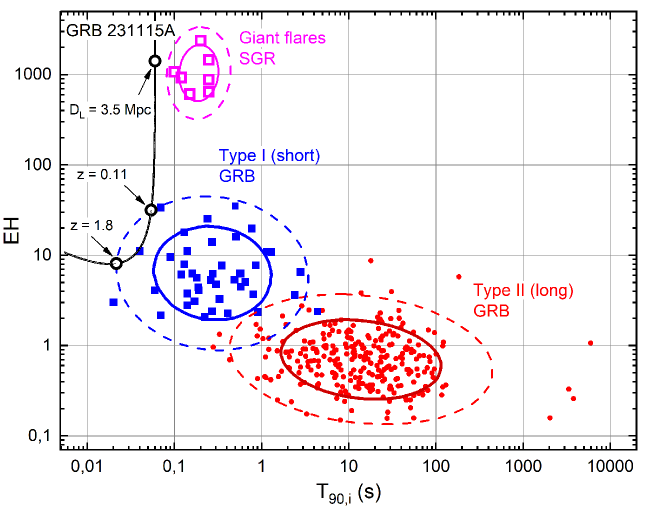
To solve the problem of gamma-ray burst classification, another method was proposed by Minaev & Pozanenko (2020a), which, in addition to features of the – correlation, uses the bimodality of the duration distribution of GRBs in the rest frame . For this purpose, the parameter was introduced (equation (3)), characterizing the location of the gamma-ray burst on the – diagram:
| (3) |
Figure 11 shows the – diagram for 316 gamma-ray bursts and 7 giant flares of magnetars from (Minaev & Pozanenko 2020a,b, 2021). Type I GRBs compared to type II ones have a higher spectral hardness value at a lower value of the total energy and, as a consequence, a larger value of the parameter , and shorter duration . SGR giant flares have the same duration as type I GRBs but much lower energetics with the similar spectral hardness which results in a large value of the parameter. Thus, the – diagram can also be used not only to classify GRBs, but also to separate giant flares of SGRs from type I GRBs. GRB 231115A is clearly classified as a giant flare of SGR, being in close proximity to the corresponding cluster of events (parameter ). The figure also shows the trajectory of the event on the diagram as a function of its source redshift. Note that the event can be classified as a short gamma-ray burst in the redshift range from to (points of the intersection of the trajectory with boundaries of the short GRB cluster region).
OPTICAL OBSERVATIONS
Among the optical observation networks, the first to respond to the notification on registration of GRB 231115A from Fermi/GBM (Dalessi et al. 2023) was the GROWTH-India survey, which began observing the localization area since 2023-11-15 16\uh47\um58\fs140 UT. Kumar et al. (2023a) reported the detection of the candidate AT 2023xvj in the optical afterglow of GRB 231115A in the wing of the M 82 galaxy 1.19 hours after the Fermi/GBM trigger. At the time of discovery, the source had coordinates R.A., Decl. (J2000 epoch) and brightness mag in the photometric band . Apart of GROWTH-India, optical observations to search for the optical component of GRB 231115A have been carried out by many other instruments (see section Observations). However, the source announced in the circular by Kumar et al. (2023a) has not been found. Kumar et al. (2023b) later reported on an error in their previous analysis published in Kumar et al. (2023a). The error occurred when subtracting the host galaxy template image from the PanSTARRS DR1 survey (Chambers et al. 2016) which contains artifacts.
| Observatory | Telescope | D, m | FoV | Location | |
| AbAO/GENAO | AS-32 | 0.7 | 44\farcm4 | 44\farcm4 | Abastumani, Georgia |
| ISON-Kitab | RC-36 | 0.36 | 43\farcm7 | 43\farcm7 | Kitab, Uzbekistan |
| Diameter of the telescope mirror. | |||||
| Field of view of the telescope. | |||||
| Upper limit, | , | Filter | Observatory | Telescope | GCN | ||
| days | s | mag | Jy | ||||
| -1.155810 | — | 20.47 | 23.6 | r | ZTF | Palomar 1.2m | 35048 |
| -0.452917 | 20.1 | 27.9 | L | ORM/SSO | GOTO | 35050 | |
| 0.054688 | 180 | 18.8 | 92.5 | Clear | MASTER-Tunka | 0.4m | 35046 |
| 0.075023 | 600 | 19.5 | 48.6 | Rc | MITSuME | Akeno 0.5m | 35057 |
| 0.087118 | 1200 | 19.8 | 36.8 | Rc | MITSuME | Akeno 0.5m | 35057 |
| 0.111250 | 2400 | 20.2 | 25.5 | Rc | MITSuME | Akeno 0.5m | 35057 |
| 0.144980 | 7380 | 19.9 | 33.6 | Rc | MITSuME | Okayama 0.5m | 35057 |
| 0.149271 | 18.6 | 111 | Clear | ISON-Kitab | RC-36 | This work | |
| 0.418507 | 7200 | 22.0 | 5.75 | r | WO | Fraunhofer 2m | 35092 |
| 0.500000 | — | 22.0 | 5.75 | r | ORM | TNG | 35077 |
| 0.447095 | 19.3 | 58.4 | R | AbAO | AS-32 | This work | |
| 0.500000 | 21.6 | 8.32 | r | ORM | Liverpool 2m | 35067 | |
| Exposure start time relative to the Fermi/GBM trigger. | |||||||
| Exposure duration. | |||||||
| The upper limit at the level of 3 standard deviations. | |||||||
| The upper limit on the flux density at the level of 3 standard deviations. | |||||||
| GOTO wide-band L filter (4000–7000 Å). | |||||||
| Clear light (unfiltered). | |||||||
| Not corrected for extinction in the Galaxy of (Schlafly & Finkbeiner 2011). | |||||||
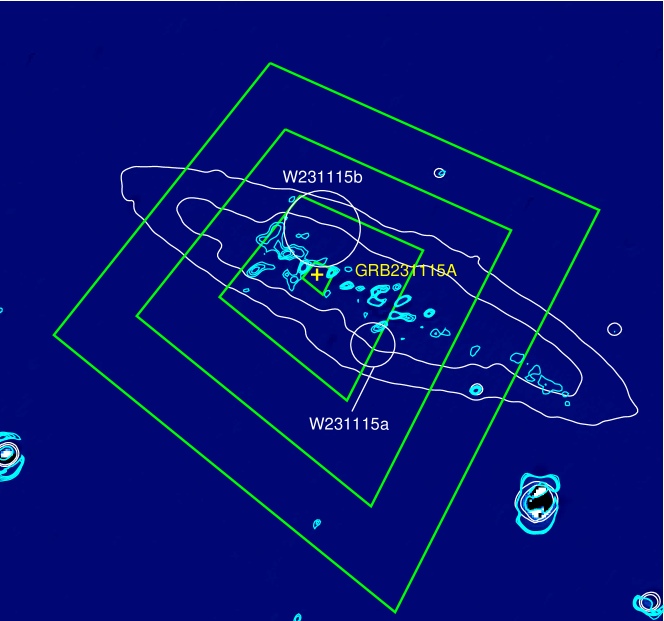
Two scientific groups have discovered several candidates in transient sources in the localization region of the burst by the IBAS system of the INTEGRAL observatory. Thus, Perley et al. (2023) discovered a red source with coordinates R.A. , Decl. , and Hu et al. (2023) revealed another red source W231115b with coordinates R.A. , Decl. , which had brightness . Hu et al. (2023) also discovered a source subsequently found by Perley et al. (2023), which was designated as W231115a. The apparent magnitude of this source was . Apparently these sources are in the disk of the M 82 galaxy, but not associated with GRB 231115A. Several reasons can be given why these sources were not discovered earlier: a significant gradient of background emission from the M 82 galaxy, a high density of sources in the galactic disk, significant absorption of optical emission by dust, and insufficient sensitivity of observing instruments.
In turn, we also carried out observations using the GRB-IKI-FuN (IKI Gamma-Ray Burst Follow-up Network, Volnova et al. 2021) telescope network in order to search for a possible optical component of GRB 231115A. The list of telescopes used and their main parameters are presented in Table 3.
Observations with the AS-32/AbAO telescope were taken in the photometric R band, while observations with the RC-36/ISON-Kitab were carried out in the white light (without filters)222Added in proofs: After passing the manuscript in press, observations of the M 82 galaxy were made in its quiet state (when a possible optical component should have already faded) on December 8 and 9, 2023 ( days after the burst) on the telescopes in AbAO and Kitab, respectively. This allowed us to more accurately subtract the contribution of the M8̇2 galaxy from the images we obtained immediately after the burst.. The log of optical observations is presented in Table 4.
Observational data (images) were processed in a homogeneous manner using units of the pipeline for optical transient search APEX v2023.11 (Pankov et al. 2022). According to the methodology described by Pankov et al. (2022), the images underwent quality control, calibration, stacking, astrometry and differential photometry. The search for variable sources was carried out by subtracting the template image of the host galaxy M 82, taken with the same instrument, but at a later epoch. For this purpose, a special pipeline unit APEX apex_subtract was developed. Due to the large angular size of M 82 in astronomical images (of about ), template subtraction was a necessary procedure to remove the significant background gradient from the M 82 galaxy.
After subtraction, we did not find reliable candidates to the optical afterglow of GRB 231115A in the localization region obtained in the IBIS/ISGRI INTEGRAL experiment (Fig. 12). Also, the sources from the GCN circulars by Perley et al. (2023) and Hu et al. (2023) were not detected due to the insufficient sensitivity reached in our observations.
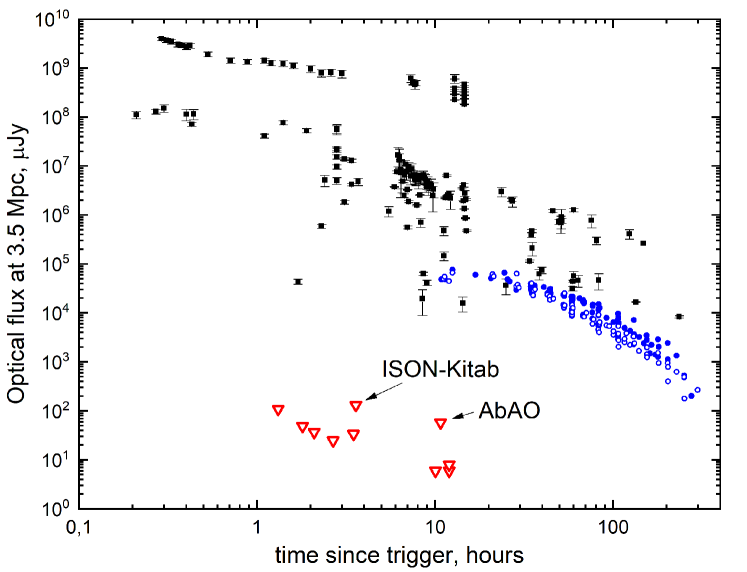
In Fig. 13 the red triangles show the upper limits on the possible optical component of GRB 231115A, obtained both in our observations (marked with arrows) and by other scientific groups (Table 4). In addition, Fig. 13 presents the results of optical observations of other short gamma-ray bursts with a known redshift according to Fong et al. (2015) and the light curve of the kilonova GRB 170817A according to Villar et al. (2017), reduced to the luminosity distance Mpc.
The deepest upper limits on the optical afterglow of GRB 231115A were obtained in 10 hours after the trigger ( mag in the filter). The optical afterglows of other short gamma-ray bursts (including the optical component of the kilonova GRB 170817A), observed from a distance of Mpc, would be brighter at this time moment by no less than 2500 times (their brightness would be 13.5 mag). Thus, the obtained upper limits on the optical component reliably exclude the interpretation of the GRB 231115A event as a short gamma-ray burst. Note however that the optical emission could be affected by very strong absorption along the line of sight if the source of the burst is located in the farthest (from the observer) part of the disk of the host galaxy. Unfortunately, the source localization accuracy is not sufficient to rule out this possibility.
CONLCUSIONS
A detailed analysis of the spectral and temporal properties of the short burst GRB 231115A was performed in the hard X-ray and gamma-ray range using data from the INTEGRAL and Fermi space observatories in order to establish the nature of this burst. Early optical observations were also carried out by telescopes of the GRB-IKI-FUN network in an attempt to find an afterglow of the burst or an optical source associated with the burst.
In particular, the following results have been obtained:
1). The early localization of the burst (performed within the framework of the Quick Look analysis by the automatic IBAS system) was confirmed and refined (R.A. Decl., epoch 2000.0, the uncertainty is smaller than ) as well as its association with the nearby Cigar galaxy (M 82) located at a distance of Mpc. This allows us to consider the hypothesis of the magnetar origin of the burst, i.e. that a giant flare of a previously unknown soft gamma repeater (SGR) occurred in this galaxy on November 15, 2023, as highly probable. If the hypothesis is confirmed, this would be the first giant flare of an extragalactic SGR that is well localized and reliably identified with a known galaxy.
2). The hard X-ray and gamma-ray light curves of GRB 231115A have the traditional FRED profile (fast rise — exponential decay) in all instruments and in all energy bands, with the exception of the softest (20–50 keV) band of the IBIS/ISGRI telescope of the INTEGRAL observatory, in which the burst profile was wider and had a flat top with ms. Long-lasting (tens of seconds) extended emission typical for magnetar giant flares has not been detected for GRB 231115A. At the same time, the obtained upper limit on the time-integrated flux of the extended emission does not exclude the association of the burst with a magnetar giant flare.
3). Cross-correlation analysis of the light curves in different energy bands according to the Fermi/GBM monitor data did not reveal any significant spectral lag. Such behavior occurs in both short gamma-ray bursts and magnetar giant flares. At the same time, a noticeable evolution of the hardness ratio was discovered (in both the Fermi/GBM data and IBIS/ISGRI data of the INTEGRAL observatory). The hardness ratio was 2–3 times higher (and even increased according to IBIS/ISGRI) during the first ms of the burst, and then steadily decreased (during the next – ms).
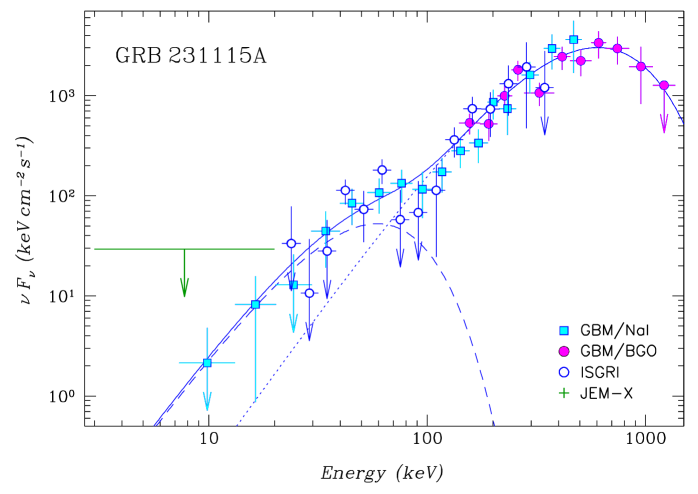
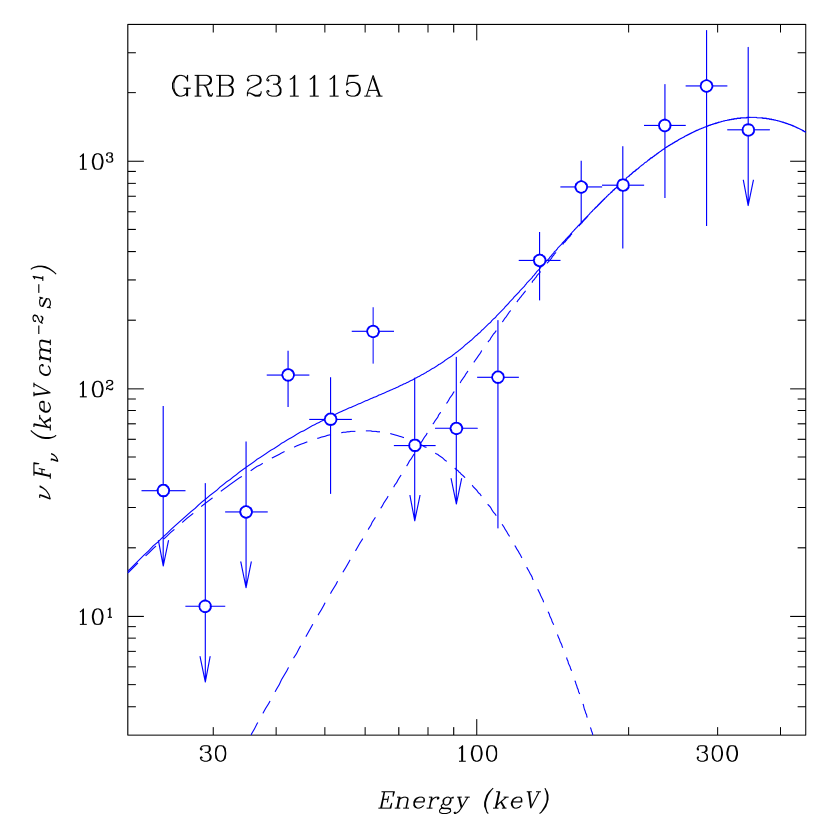
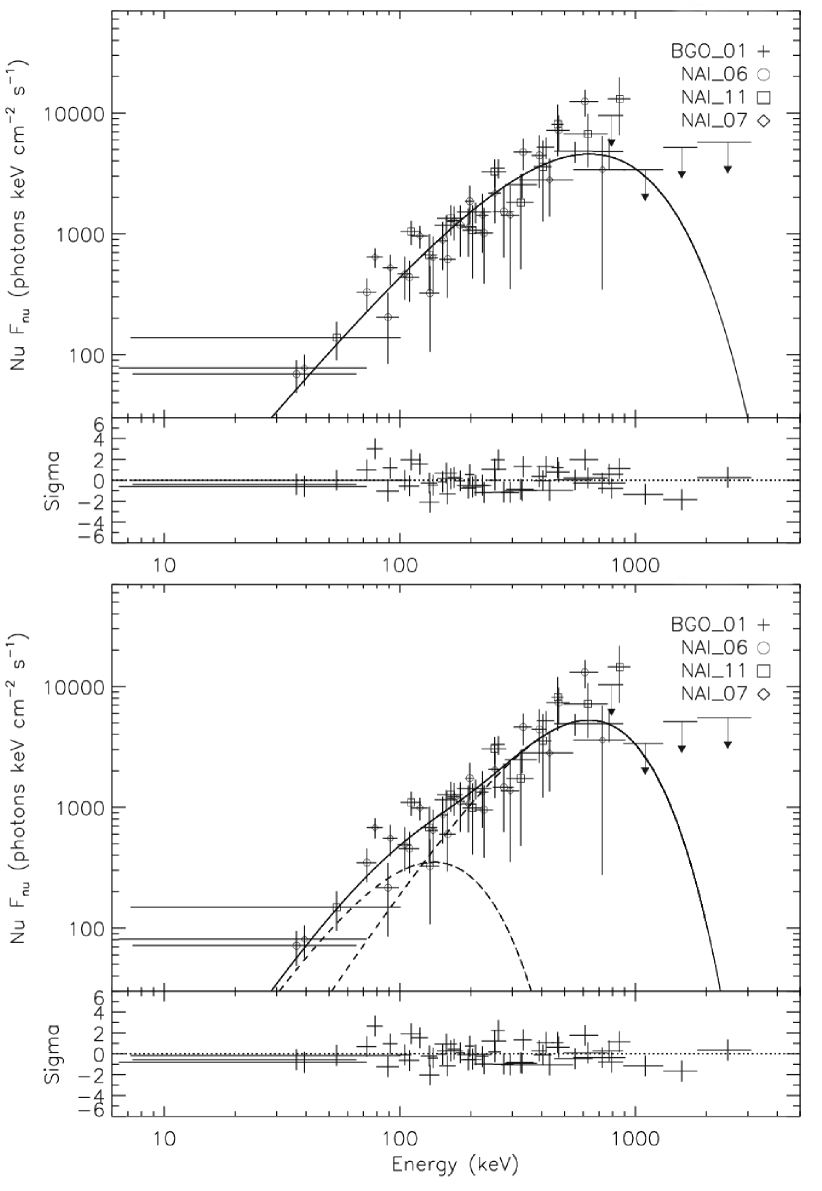
4). The emission spectrum of the burst contained two components: a hard one, which was satisfactory described by a power-law model with an exponential cutoff at high energies (CPL) typical for gamma-ray bursts and magnetars, and the soft one, which was approximated with the spectrum of a black-body photosphere with a temperature of keV. Figure 14 shows the broadband (3–1500 keV) emission spectrum of GRB 231115A, reconstructed from observational data of the IBIS/ISGRI and JEM-X telescopes of the INTEGRAL observatory and the gamma-ray burst monitor GBM (its BGO_01 and NaI_06 detectors) of the Fermi observatory. Table 5 presents results of the spectral approximation by two models: 2 BBL and BBLCPL (the latter model is shown in the figure by a solid curve, and its components are dashed and dotted lines). It follows from the figure that the model successfully describes the measured spectrum of the burst.
The representation of the burst spectrum in the form of clearly shows that the main energy of its emission is contained in the photons with keV. It is important that the photon index of the hard emission component had a peculiar value of , ensuring a rapid increase of the spectral density with photon energy. It is due to this almost Rayleigh-Jeans spectral index the hard emission of this burst was successfully described by a black-body spectrum. Such hard power-law “tails” in the emission spectra are more typical for giant flares of magnetars than for short gamma-ray bursts.
| Model | A | Flux, | ||||||
| keV | erg s-1 cm-2 | |||||||
| BBR | 112.4/140 | – | ||||||
| BBR | – | |||||||
| CPL | 113.2/139 | |||||||
| BBR | – | |||||||
| Minimum value of and the number of degrees of freedom . | ||||||||
| Photon index of the power-law component . | ||||||||
| Normalization of this component at 100 keV [ cm-2 keV-1]. | ||||||||
| Radius of the photosphere [km] for a distance of Mpc. | ||||||||
| Temperature or the energy of an exponential cutoff . | ||||||||
| Energy flux in the range of 10–1000 keV. | ||||||||
5). A combination of black-body spectra that allows one to approximate well the emission spectrum of GRB 231115A, may arise in hypothetical models of evaporation of primordial black holes (e.g., Fegan et al. 1978) or the fall of a primordial black hole of a limited mass onto a supermassive black hole (Barco et al. 2021). These models can generate very short hard gamma-ray bursts apparently without afterglow in the X-ray and optical ranges. However, the total energy emitted in the gamma-ray range in these models turns out to be significantly less than the energy measured from GRB 231115A, which would not allow observing such a flare in the M 82 galaxy.
6). The obtained upper limits on the flux of the burst’s optical afterglow 3.6 and 10.7 hours after this event are several orders of magnitude below the level that would be expected from the short gamma-ray bursts associated with neutron star mergers (Kann et al. 2011; Villar et al. 2017; Pandey et al. 2019). Our upper limits are consistent with optical observations with other telescopes, as well as the lack of any afterglow in the soft X-ray range. All this confirms the magnetar version of the origin of GRB 231115A.
7). The position of GRB 231115A on the and diagrams confirms the classification of the burst as a SGR giant flare. With acceptable for type I GRBs duration s and spectral peak energy keV, the isotropic total energy erg emitted during the burst in the gamma-ray range is however typical only for SGR giant flares.
8). The distance to the host galaxy of the burst suggests a confident detection of the gravitational wave signal from the merger of neutron stars (the cause of short gamma-ray bursts), which, however, has not been detected by the LIGO/Virgo/KAGRA detectors. This is the strongest argument in favor of the magnetar origin of the burst and against the possibility of its explanation by the merger of a pair of neutron stars that occurred in this galaxy. There is a very small probability of a random coincidence of the location of a short distant gamma-ray burst with the location of this galaxy. This probability can be estimated as the ratio of the apparent area of the M 82 galaxy to the total area of the sky or 3 400 000 to 1 in favor of the magnetar origin of the burst. A more conservative estimate of the probability in favor of the magnetar hypothesis was given by Burns (2023), he estimated it to be 180 000 to 1.
All of the above, and especially the last two arguments, allows us to confidently state that the GRB 231115A burst was indeed not a short gamma-ray burst associated with the merger of neutron stars, but a giant flare of a previously unknown magnetar in the M 82 galaxy.
ACKNOWLEDGMENTS
The work was based on data from the INTEGRAL observatory, obtained through its Russian and European Science Data Centers, and the Fermi observatory, obtained through NASA/HEASARC. PM is grateful to the Time Allocation Committee (TAC) of the INTEGRAL observatory for supporting his proposal # 2040014 in response to the INTEGRAL Announcement of Opportunity 20, which resulted in the data of GRB 231115A observations.
FUNDING
The authors (AP, ICh, NP, PM, and SG) are grateful to the
Russian Science Foundation for financial support (grant
23-12-00220).
ENERGY FLUX ACCORDING TO SPI-ACS
The INTEGRAL/SPI-ACS detector records the photon count rate in a wide single energy channel of 0.085–10 MeV with a time resolution of 50 ms. Since the studied GRB 231115A had a duration of about 100 ms, its light curve based on the SPI-ACS data consists in Fig. 1 of only two consecutive bins with a total significance of about 10 standard deviations. It is noticeably inferior in terms of information content to the light curves measured by other instruments.
At the same time, the SPI-ACS data allow us independently estimate the energy flux from GRB 231115A using the results of the SPI-ACS calibration, based on the analysis of joint detection of the large number of GRBs in the INTEGRAL/SPI-ACS and Fermi/GBM experiments (Minaev & Pozanenko 2023a). The calibration included a study of the dependence of the SPI-ACS effective area on the direction to the source vs the INTEGRAL spacecraft’s orientation and on the hardness of the emission spectrum of the burst.
GRB 231115A was detected in the field of view of the INTEGRAL aperture telescopes (the angle between the direction to the source and the center of the field of view ), in this case the effective area of SPI-ACS is close to the minimum value. According to Minaev & Pozanenko (2023a) the conversion factor of instrumental counts of SPI-ACS into energy units erg cm-2 in the range of 10–1000 keV for a gamma-ray burst with the spectral hardness keV, which source has coordinates in the detector coordinate system (, ) = (–109\fdg4, 3\fdg8), is erg cm-2 count-1. The time-integrated flux of GRB 231115A according to the SPI-ACS detector is counts or erg cm-2 in the range of 10–1000 keV. In the estimation of the flux error, in addition to the statistical error of measurements, the systematic error of the calibration method is also taken into account (see details in Minaev & Pozanenko 2023a). The obtained value within the agrees with the flux measurement within the framework of the spectral analysis of the Fermi/GBM data erg cm-2 (see the corresponding section of this work).
References
- [1]
- [2] , ApJ 848, L12 (2017a).
- [3]
- [4] , ApJ 848, L13 (2017b).
- [5]
- [6] , GCN Rep. 35048, 1 (2023).
- [7]
- [8] , A&A 390, 81 (2002).
- [9]
- [10] , GCN Rep. 35091, 1 (2023).
- [11]
- [12] , Astronomical Data Analysis Software and Systems V (Eds. G. Jacoby, J. Barnes), ASP Conf. Ser. 101, 17 (1996).
- [13]
- [14] , GCN Rep. 35036, 1 (2023a).
- [15]
- [16] , GCN Rep. 35077, 1 (2023b).
- [17]
- [18] , GCN Rep. 35046, 1 (2023).
- [19]
- [20] , MNRAS 506, 806, (2021).
- [21]
- [22] , MNRAS 417, 2161 (2011).
- [23]
- [24] , \astl 46, 783 (2020).
- [25]
- [26] , MNRAS 527, 11507 (2024).
- [27]
- [28] , Sov. Astron. Lett. 10, 177 (1984).
- [29]
- [30] , MNRAS 490, 927 (2019).
- [31]
- [32] , GCN Rep. 35038, 1 (2023).
- [33]
- [34] , Adv. Astron. ID 8929054 (2017).
- [35]
- [36] , arXiv, 1612.05560 (2016).
- [37]
- [38] , GCN Rep. 35052, 1 (2023).
- [39]
- [40] , GCN Rep. 35045, 1 (2023).
- [41]
- [42] , ApJ 567, 1028 (2002).
- [43]
- [44] , AIP Conf. Proc. 836, 64 (2006) [arXiv:astro-ph/0601019 (2006)].
- [45]
- [46] , GCN Rep. 35070, 1 (2023).
- [47]
- [48] , GCN Rep. 35044, 1 (2023).
- [49]
- [50] , Astrophys. J. 490, L17 (1997).
- [51]
- [52] , Astrophys. J. Lett. 392, L9 (1992).
- [53]
- [54] , Nature 271, 731 (1978).
- [55]
- [56] , ApJ 448, L101 (1995).
- [57]
- [58] , Astrophys. J. Lett. 515, L9 (1999).
- [59]
- [60] , ApJ 815, 2 (2015).
- [61]
- [62] , Astron. Lett. 33, 1 (2007a).
- [63]
- [64] , Astron. Lett. 33, 19 (2007b).
- [65]
- [66] , GCN Rep. 35062, 1 (2023).
- [67]
- [68] , Nature 395, 670 (1998).
- [69]
- [70] , Nature 444, 1044 (2006).
- [71]
- [72] , Sov. Astron. Lett. 5, 340 (1979).
- [73]
- [74] , Nature 306, 451 (1983).
- [75]
- [76] , GCN Rep. 35066, 1 (2023).
- [77]
- [78] , Astrophys. J. Suppl. Ser. 211, 12 (2014).
- [79]
- [80] , MNRAS 505, 4086 (2021).
- [81]
- [82] , ApJ 740, id. 104 (2011).
- [83]
- [84] , GCN Rep. 35057, 1 (2023).
- [85]
- [86] , GCN Rep. 35092, 1 (2023).
- [87]
- [88] , Nature 434, 1098 (2005).
- [89]
- [90] , GCN Rep. 35053, 1 (2023).
- [91]
- [92] , GCN Rep. 35051, 1 (2023).
- [93]
- [94] , Astrophys. J. Lett. 628, L53 (2005).
- [95]
- [96] , GCN Rep. 35056, 1 (2023).
- [97]
- [98] , Astrophys. J. 734, 96, (2011).
- [99]
- [100] , ApJ 463, 570 (1996).
- [101]
- [102] , ApJ 413, L101 (1993).
- [103]
- [104] , ApJ 510, L115 (1999).
- [105]
- [106] , GCN Rep. 35041, 1 (2023a).
- [107]
- [108] , GCN Rep. 35055, 1 (2023b).
- [109]
- [110] , New Astron. Rev. 93, 01629 (2021).
- [111]
- [112] , Astron. Astrophys. 411, L149 (2003).
- [113]
- [114] , A&A 411, L141 (2003).
- [115]
- [116] , arXiv:2307.02098 (2023).
- [117]
- [118] , GCN Rep. 35049, 1 (2023).
- [119]
- [120] , GCN Rep. 35039, 1 (2023a).
- [121]
- [122] , GCN Rep. 35042, 1 (2023b).
- [123]
- [124] , A&A 411, L231 (2003).
- [125]
- [126] , GCN Rep. 35068, 1 (2023).
- [127]
- [128] , Sov. Astron. Lett. 5, 343 (1979a).
- [129]
- [130] , Nature 282, 587 (1979b).
- [131]
- [132] , Astrophys. Space Sci. 80, 3 (1981).
- [133]
- [134] , Astron. Lett. 25, 635 (1999).
- [135]
- [136] , arXiv:astro-ph/0502541 (2005).
- [137]
- [138] , ApJ 680, 545 (2008).
- [139]
- [140] , Astrophys. J., 702, 791 (2009).
- [141]
- [142] , GCN Rep. 35037, 1 (2023).
- [143]
- [144] , ApJ 397, 570 (1992).
- [145]
- [146] , Rep. Progress Phys. 69, 2259 (2006).
- [147]
- [148] , MNRAS 385, 1455 (2008).
- [149]
- [150] , Astron. Lett. 36, 707 (2010a).
- [151]
- [152] , Astrophys. Bull. 65, 326 (2010b).
- [153]
- [154] , Astron. Lett. 38, 613 (2012).
- [155]
- [156] , Astron. Lett. 40, 235 (2014).
- [157]
- [158] , Astron. Lett. 43, 1 (2017).
- [159]
- [160] , MNRAS 492, 1919 (2020a).
- [161]
- [162] , \astl 46, 573 (2020b).
- [163]
- [164] , MNRAS 504, 926 (2021).
- [165]
- [166] , MNRAS 525, 2411 (2023a).
- [167]
- [168] , GCN Rep. 35059, 1 (2023b).
- [169]
- [170] , Sov. Astron. Lett. 16, 129 (1990).
- [171]
- [172] , Astrophys. J. 640, 849 (2006).
- [173]
- [174] , ApJ 627, 324 (2005).
- [175]
- [176] , ApJ 717, 411 (2010).
- [177]
- [178] , GCN Rep. 35064, 1 (2023).
- [179]
- [180] , Astrophys. J. Suppl. Ser. 199, 18 (2012).
- [181]
- [182] , ApJ 308, L43 (1986).
- [183]
- [184] , Astrophys. J. Lett. 494, L45 (1998).
- [185]
- [186] , Nature 434, 1107 (2005).
- [187]
- [188] , MNRAS 485, 5294, (2019).
- [189]
- [190] , Proc. of the XXIII Inter. Conf. DAMDID/RCDL-2021 (Eds. A. Pozanenko, S. Stupnikov, B. Thalheim, E. Mendez, N. Kiselyova, Moscow, Russia, October 26–29, 2021,), CCIS 1620, 104 (2022).
- [191]
- [192] , GCN Rep. 35067, 1 (2023).
- [193]
- [194] , Proceedings of the XLth Rencontres de Moriond (Eds. J. Dumarchez and J.T. Thanh), 253 (2005).
- [195]
- [196] , ApJ 852, L30 (2018).
- [197]
- [198] , Astron. Lett. 45, 710 (2019).
- [199]
- [200] , Astron. Astrophys. 438, 1175 (2005).
- [201] , GCN Rep. 35065, 1 (2023).
- [202]
- [203] , ApJ 932, 1 (2022).
- [204]
- [205] , MNRAS 376, L48 (2007).
- [206]
- [207] , Astrophys. J. 737, 103 (2011).
- [208]
- [209] , ApJ 870, 105 (2019).
- [210]
- [211] , MNRAS 275, 255 (1995).
- [212]
- [213] , Astrophys. J. 561, 980 (2001).
- [214]
- [215] , GCN Rep. 35078, 1 (2023).
- [216]
- [217] , Astron. Astrophys. 411, L63 (2003).
- [218]
- [219] , Astrophys. J. Lett. 851, L21 (2017).
- [220]
- [221] , Anais da Academia Brasileir a de Ciencias. Physical Sciences 93, id. 1 (2021).
- [222]
- [223] , MNRAS 467, 3500 (2017).
- [224]
- [225] , A&A 411, L1 (2003).
- [226]
- [227] , ApJ 405, 273 (1993).
- [228]
- [229] , GCN Rep. 35060, 1 (2023).
- [230]