Bundling Demand in K-12 Broadband Procurement††thanks: We are grateful to Educational Services Commission of New Jersey for providing the data and to Kevin Dellicker, CEO of Dellicker Strategies, LLC for helping us understand the market for K-12 broadband. We also thank David Gibbons of Black Bear Fiber for helping us understand the economics and business of internet service provision, and Manudeep Bhuller, Paulo Somaini, Michael Whinston, and Mo Xiao for helpful comments and suggestions.
Abstract
We evaluate the effects of bundling demand for broadband internet by K-12 schools. In 2014, New Jersey switched from decentralized procurements to a new procurement system that bundled schools into four regional groups. Using an event study approach, we find that, on average, prices for participants decreased by one-third, and broadband speed purchased increased sixfold. We bound the change in school expenditures due to the program and find that participants saved at least as much as their total “E-rate” subsidy from the federal government. Under weak assumptions on demand, we show that participating schools experienced large welfare gains.
JEL: D44, H42, L86, L96.
Keywords: broadband internet, exposure problem, bundling, welfare
Access to affordable high-speed broadband is necessary for schools to achieve educational goals. High-speed broadband enhances digital learning, research, and communication among K-12 students. In the US, the federal government promotes connectivity and access to telecommunication services among schools, including by providing subsidies to schools. Schools must use competitive bidding to choose providers as a condition of the subsidy program.
In recent years, policymakers across different sectors have used market design tools to improve the outcomes of similar public-private partnerships further (Congressional Budget Office, 2017, 2020). For instance, it is known that competitive bidding can achieve more efficient outcomes than informal bargaining (Bulow and Klemperer, 1996), which underlies a move towards procurement through auctions. More recently, the success of FCC radio spectrum auctions (Congressional Budget Office, 1997) has shown that in the presence of complementarities and bidder market power, auctions with package bidding overcome an exposure problem (Milgrom, 2004) and outperform auctions where bidders can bid on only one unit at a time.
We study a change to procurement design in a setting where exposure and market power are concerns. In 2014, the New Jersey Department of Education implemented a new program called the Internet Cooperative Purchasing Initiative (ICPI, or the “Consortium”), under which schools were divided into four regional groups to form four packages, and the winning Internet Service Provider (ISP henceforth) won the right to supply internet to all the schools within a region. Before 2014 (and currently in most other states), internet procurement was done on a school-by-school basis, NJ switched from decentralized auctions to a system where a central authority bundled the broadband requirements of multiple schools.
We apply an event study approach to identify the impact of bundling schools together for broadband procurement. We find that participating schools paid lower prices for the internet and purchased higher bandwidth. In particular, under the standard difference-in-differences assumptions, we credit a $9.33 price decrease to the program from a base of $19 per Mbps per month. Schools responded to this price decrease by increasing their broadband demand (sixfold) by 628 Mbps compared to non-participants.
Since the Consortium is voluntary for schools to join, we explore how our estimates are sensitive to the parallel trends assumption. We use the insights of Manski and Pepper (2018) to present our treatment effects as bounds to violations in the parallel trends assumption. Our results are robust to various violations of parallel trends. Treatment group trends must be about 1.75 times steeper than control group trends to erase our treatment effect on price. The treatment effect on bandwidth is insensitive to violations in parallel trends because our estimated effect is quite large, and the trends are flat.
We evaluate the effect of participating in the Consortium on schools’ expenditure and welfare. Our estimates suggest substantial cost savings that range from $1.82 million to $6.53 million (in total) for participants in the Consortium, depending on assumptions about demand. In comparison, these schools received a total of $2.75 million in E-rate subsidies the year before joining the Consortium. This evidence suggests that bundling demand can obtain similar cost savings to the schools (and greater bandwidth-adjusted savings) compared to the subsidy program and at no cost to taxpayers. Thus, a policymaker deciding between the E-rate subsidy with independent procurement or the Consortium design may prefer the latter.
Next, we determine how these cost savings translate into school welfare. Typically, quantifying welfare would require estimating demand directly. Instead, we follow a “robust bound approach” suggested by Kang and Vasserman (2022) and determine the lower and upper bound for the change in welfare for participating and non-participating schools. Under the assumption that the demand functions are log-concave, the impact of Consortium participation is positive and potentially large, suggesting widespread benefits for schools.
Our results are likely helpful to inform policymakers in a wide range of settings that share similarities to broadband procurement. Two mechanisms rationalize the sharp decline in prices: (1) an exposure problem (Milgrom, 2004) and (2) competition for larger bundles. First, ISPs face large fixed costs to build broadband, and build-out happens in a network structure with hubs and spokes. This feature of the market implies that large contiguous service areas are cheaper to serve than dispersed ones (see Ausubel et al., 1997; Beresteanu, 2005). Under independent procurement, ISPs risked winning only one school in a geographical area. ISPs should place higher procurement bids than if they could bid on a bundle of schools in the same area. Our findings suggest that bundling demand increases efficiency, and some of these benefits were passed through to the schools. Second, in the presence of fixed costs in the broadband market, bundling offers higher revenue gains from a single auction, thus encouraging entry. This increase in competition can be another explanation for lower prices, which is likely to be present in many settings.
We make contributions to two works of literature. First, we contribute to the empirical auction design literature that studies benefits of auctions (e.g., Bajari et al., 2009; Covert and Sweeney, 2023) in the presence of complementarities, such as the procurement of city bus services (Cantillon and Pesendorfer, 2010), freight trucking (Caplice and Sheffi, 2010), spectrums (Fox and Bajari, 2013; Xiao and Yuan, 2022), school lunches (Kim et al., 2014; Agarwal et al., 2023) and roof maintenance services (Arsenault-Morin et al., 2022). We are unique among these papers by providing direct evidence of the effects of a change in the design of procurement on the outcomes, whereas these papers measure the effectiveness of market design by estimating the underlying parameters of a model. Our findings are also consistent with Goeree and Lindsay (2020), who, in an experimental setting, find that bundling demand reduces the exposure problem.
Second, we also note that our paper contributes to the literature that studies publicly subsidized, privately provisioned essential goods and services, such as health care, social security, and, in our context, K-12 broadband internet. As Decarolis et al. (2020) point out, the prima facie “objectives of such programs are to leverage the benefits of competition to provide high-quality services at low cost to both consumers and the government.” Although we do not estimate the degree of cost complementarities, our findings highlight an important example where a properly designed private-public partnership can achieve these dual goals.
1 Institutional Details
Our setting involves the procurement of high-speed broadband internet by public and private school districts and libraries (henceforth, schools) in the U.S. state of New Jersey.111“Broadband” is a generic term for capacity transmission, like fiber optic or coaxial wires. New Jersey’s Digital Readiness for Learning and Assessment Project (DRLAP) was launched in 2013 by the state’s Department of Education to help K-12 schools better incorporate technology into their classrooms. The broadband component of the program, known as DRLAP-Broadband, was designed to help schools work together to improve their internet access and network infrastructure to bridge the technology gap across schools and ensure internet access necessary to utilize new digital resources.
Typically, and exclusively before 2014 in New Jersey, schools organized the procurement of internet and other telecommunications services individually. In 2014, New Jersey began centralizing the procurement process with the goals of reducing costs and increasing access to high-speed internet. The design of the process was meant to meet the need for federal internet subsidies. Below, we describe how subsidies work and the particular intervention in New Jersey.
1.1 The E-rate Program
In the United State, K-12 schools can apply for subsidies for their internet expenses through a federally funded program called E-rate, which is administered by the Federal Communications Commission (FCC) and funded by the Universal Service Fund under the Telecommunications Act of 1996. The subsidy ranges from 20% to 90% of a school’s telecommunications expenditures, depending on the poverty level and rural status. The E-rate program was designed to help eligible schools obtain internet by subsidizing internet access. In particular, the FCC set a goal of 1 megabit per second (Mbps) per student to support digital learning in every classroom. In 2023, 74% of school districts met this goal, compared to 8% in 2015.
The typical procurement and subsidy process is highly decentralizde. A school determines the amount of internet it needs (e.g., unlimited internet with 1,000 Mbps download speed) and submits a request for competitive bids to the Universal Service Administrative Company (USAC) by filing FCC Form 470. USAC posts these requests on its website, and interested ISPs submit bids. After reviewing the bids, the school selects the most cost-effective ISP and files FCC Form 471 with details of the chosen ISP, following which either the school or the chosen ISP can apply to USAC for reimbursement. All eligible schools that conduct a fair and open competitive bidding process get the subsidies.222See https://e-ratecentral.com/Resources/Educational-Information/The-E-Rate-Process. The total subsidy cap in 2023 was $4.5 billion.
1.2 Demand Aggregation Intervention in New Jersey
In 2014, the State of New Jersey Department of Education planned a coordinated procurement process for broadband internet services called the Internet Cooperative Purchasing Initiative (ICPI, or “consortium”). Schools who choose to participate in the consortium were asked to submit letters of intent and service order forms for networking and internet access services as part of a consolidated Request For Proposals (RFP) by spring 2014. By June, 392 schools volunteered to be listed in the RFP, which included 20 public charter schools and 25 private or non-public schools, the rest of which were multi-building school districts. Although the RFP included many services, we focus on dedicated broadband internet services. This service includes the transport (wire and circuits) of internet through Regional Hubs (two per region) and the provision of transport and internet to each school or district.
After collecting demand information through the the RFP, New Jersey conducted a reverse scoring auction for the bundled school broadband services. The price bids were weighted by qualitative factors such as the ability of the ISP to provide service coverage that complied with the technical specifications, the deployment plan, company experience, and service support. Among the ISPs that competed in each region, some were household residential providers and others were large commercial backbone providers. Schools also completed a voluntary survey about their level and price of service as of May 2014, i.e., prior to the introduction of bundling policy.333Note that the survey was voluntary, although most schools choose to participate.
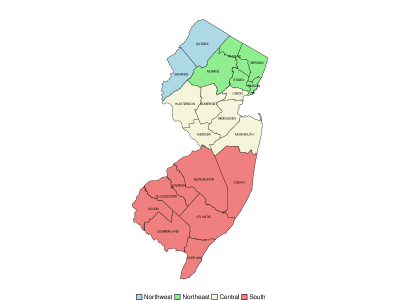
Note: Schematic map of the U.S. state of New Jersey with four regions (in different colors) with county boundaries.
The ISP that won the procurement rights for a region guaranteed to deliver the internet to all participating schools. The regions are illustrated in Figure 1. The state took care of the E-rate paperwork for the participants so that the winning ISP would be the official E-rate provider for these schools. Importantly, schools did not have to accept the terms after the procurement process ended, and ISPs knew this before they bid. Three hundred ninety-two schools responded affirmatively to New Jersey and were listed on the RFP out of roughly 800 total schools. However, the RFP stated that other schools might be interested after the procurement round. We observed both schools that were interested and backed out and schools that signed with a winning ISP in 2015, even though they were not officially part of the RFP.
2 Data Used in the Analysis
Our main data source is from the Educational Services Commission of New Jersey (ESCNJ, formerly Middlesex Regional Educational Services Commission) who ran surveys to collect information on internet contracts before and after the program. We supplement these data with E-rate data from the FCC and FCC Fixed Broadband Deployment data.444These data are publicly available from https://t.ly/jDlgy and https://t.ly/msc9k.
ESCNJ Data
The ESCNJ provided us the data they collected throughout the implementation of the new consortium procurement program. The information that is relevant for our analysis includes details of broadband contracts for all public school districts, charter schools, and private schools (including religious schools) that file for the FCC E-rate subsidies in New Jersey. We observe all major contract terms before and after the implementation of the consortium, such as the cost of the contract, the delivery medium (e.g., fiber, DSL), the bandwidth, the servicing ISP, and the location and other information about the district. We also observe if the school participated in the consortium. We define a participant as a school that responded affirmatively for the initial ESCNJ request for information and signed a broadband contract with the winning ISP chosen by the consortium.
Description of Broadband Contracts
Before 2014, schools had existing contracts with ISPs. Schools received internet by many transport types, including fiber, coaxial (cable), and digital subscriber line (DSL). Fiber is the highest quality/bandwidth transport medium and is the only way to connect many devices at high speeds with high quality connections. However, in New Jersey, Comcast is a major ISP and distributes internet through their exisitng TV/Cable transport network composed of coaxial cables. In 2014, coaxial connections maxed out at 100 Mbps, whereas fiber connections could provide up to 10,000 Mbps bandwidth. ISPs typically build quantity (bandwidth) discounts into their pricing, likely reflecting the high fixed cost and low marginal costs associated with supply internet. For example, the correlation between price per Mbps and bandwidth for fiber contracts is .
Along with the strong negative correlation between unit prices and bandwidth, there is substantial dispersion in prices and bandwidth. One factor that is important for this is the quality of underlying transport networks. We document average, median, and the interquartile range for price per Mbps and bandwidth in Mbps for New Jersey schools before and after the consortium program in Table 1. There is substantial variation in prices and bandwidth across schools. There is also a large decrease in price and increase in bandwidth from 2014 to 2015.
We display other relevant measures of connectivity in Table 1. The proportion of schools receiving fiber transport increased from 0.75 to 0.84 from 2014 to 2015, the average Erate subsidy was a little over 0.5 (50% of expenditures) in both years, and the concentration of providers increased from 2014 to 2015. An increase in concentration may represent efficiencies given the large network effects in costs of provding broadband, is likely due to the bundled contracts offered by the consortium.
Outcome Pre Consortium (2014) Post Consortium (2015) t-test (p-value) Mean Median IQR Mean Median IQR Price ($/Mbps) 36.69 18.85 31.00 14.17 8.00 12.70 8.65 () Bandwidth 277.87 100 250 687.80 200 900 -4.95 () E-rate subsidy 0.53 0.50 0.30 0.56 0.50 0.40 -1.77 () Fiber 0.75 0.84 -3.50 () HHI 1,710 2,064 • Note: Total number of observations are 953. The t-test are Welch Two Sample one-sided t statistics for differences in mean prices, bandwidth and share of fiber and two-sided t statistic for the E-rate subsidy. The alternative hypotheses for the one-sided tests are that prices, bandwidth, and fiber in 2014 are, respectively, greater, smaller and smaller than those in 2015. HHI refers to the Herfindahl-Hirschman Index which is based on how many schools are supplied to capture market concentration.
3 Effects of Demand Bundling
In this section, we analyze the effect of consortium participation on school broadband prices, speed, and school welfare. We define a participant as a school that responded affirmatively for the initial ESCNJ request for information and signed a broadband contract with the winning ISP chosen by the consortium. All other schools are control schools, or non-participants, even though we see some of these schools sign contracts with the winning ISP. Our data lends itself to an event study strategy to estimate if the consortium induced better outcomes among participants than non-participants. In particular, we use the difference-in-differences strategy, where we compare the difference in the mean outcomes for participating schools relative to non-participating schools before and after the the consortium. However, there are many reasons to think that the parallel trends assumption does not hold in our setting. To assess the robustness of our findings, we follow insights from Manski and Pepper (2018) and Rambachan and Roth (2023) and report event study estiamtes using different assumptions on the differences in trends between participants and non-participants, or difference invariance assumptions in the parlance of Manski and Pepper (2018).
3.1 Event Study
We treat ESCNJ consortium participants as a treated group and all other schools as a control group to estimate the average treatment effect on the treated for price and broadband using a differences-in-differences strategy. In particular, we estimate the following regression specification:
| (1) | |||||
where is the outcome variable for school in year , is a binary variable equal to one if participated in the consortium and zero otherwise, is also a binary variable that is equal to one to denote the year when the consortium was available, and is a vector of controls. Therefore, in this “two-by-two” setting, is zero for all schools in .
The estimation results from (1) are shown in Table 2, with our preferred specifications in columns (3) and (4) which include additional control variables. Our parameter of interest is , which, under the DiD assumptions, is the effect of consortium for participating schools on the outcome variable. The estimates suggest that participation in the consortium reduced the price of internet by $9.3 per Mbps and increased chosen broadband speed by 628 Mbps. Both these estimates are statistically significant at 1 level. Thus, under the parallel trend assumption, is also the average treatment effect on treated, , and we can conclude that demand bundling caused the price to decrease and demand for bandwidth to increase.
Dependent variable: Price Bandwidth Price Bandwidth (1) (2) (3) (4) Non-Participant 28.663∗∗∗ 294.612∗∗∗ 53.851** 109.677 (1.244) (68.770) (25.546) (1,197.704) Participant 27.671∗∗∗ 270.827∗∗ 53.871** 47.112 (2.039) (112.687) (25.648) (1193.531) Post-consortium -12.585∗∗∗ 139.043 12.224∗∗∗ 9.677 (1.741) (96.225) (1.651) (96.369) Participant Post-consortium -9.900∗∗∗ 989.898∗∗∗ 9.339∗∗∗ 628.185∗∗∗ (3.359) (185.631) (3.167) (194.680) Number of ISPs 0.763∗∗∗ (0.293) School Type ISP Region Service Type Observations 953 953 953 953 Adjusted R2 0.658 0.126 0.277 0.181 • Note: The table presents the results from the difference-in-differences estimate of (1). Columns (1) and (2) do not include control variables, while (3) and (4) include additional control variables as shown indicated above. ∗∗p0.05; ∗∗∗p0.01.
3.1.1 Sensitivity Analysis: Parallel Trends
In our setting, there is no reason to think that participants would have had the same trend (decrease) in broadband prices as the non-participants if they had not joined the consortium. The consortium was marketed to all schools and school districts in New Jersey that participate in E-rate, and participation was completely voluntary. The program administrator claims that there are many reasons a school may not have participated. For example, some schools were on existing long-term contracts and, presumably, they could not switch. Other districts use third-party E-rate consultants and may delegate all broadband to the consultant, who would lose business if the school joined the consortium. Other schools (perhaps large districts) may have thought they would not gain by pooling demand with smaller schools.
Considering these factors, we explore how our estimates would change if the parallel trend (invariance) assumption were violated. To that end, we take an approach suggested by Manski and Pepper (2018) and determine the difference-in-differences estimate if the trend for the treatment groups were times the trend for the control groups. With a slight abuse of notations, we consider violations of the parallel trends assumption of the form
| (2) | |||||
where is the trend for the control group, is the (unidentifiable) trend for the participants. For the second equality we imposed that with is the degree of violation of the parallel trend. We ask, “What if the participants had a times the trend of the control schools?” Note that this setup contains parallel trend assumption () as a special case, i.e., , in which case identifying the causal effects of the consortium, as shown in Table 2.
In Figure 2, we present the estimates of from (2) using the estimates from Table 2 for . For instance, to estimate for price, we use and . As is a constant, we can use the standard errors and covariance from Table 2 to determine the 95% confidence intervals.555Manski and Pepper (2018) have a long panel and use past data to inform the level of violation, in our case . Rambachan and Roth (2023) generalize Manski and Pepper (2018) and provide a method for inference. In our “two-by-two” setup, we do not have past data that can inform , underpinning our choice of a fixed . Furthermore, our confidence intervals do not consider sampling variability that may affect non-participant trends, nor do we adjust for multiple testing.
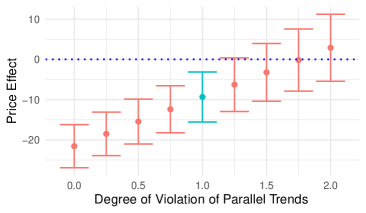

Note: Plots the estimates from (2), for the price (left) and broadband demand (right) and their 95% confidence interval for of violation in parallel trends as shown in the x-axis. The confidence intervals are calculated for each separately using the standard errors of the and from Table 2 and their covariance (price) and (broadband).
The blue confidence interval is our baseline estimate with . Next, consider the price effect under the extreme case of . Then, we assume that the participant trend would have been twice as steep as the non-participant trend, or -$24.44 for the price outcome, and the treatment effect would be +$2.83. In other words, the treatment effect would disappear if the price trend for participating schools was twice as steep as non-participants in the world where they did not participate. The estimates suggest that if participant price trends were about times steeper (decreasing) than that of non-participants, the treatment effect would be completely erased.
However, it is not obvious why participants’ trend should be steeper than non-participants, and there may be good reasons to think it is actually flatter (). For example, if schools with worse contracts in the pre-period (or expectations that future contracts would be worse) are more likely to participate, then participant trends would be flatter than non-participants. In other words, all else equal, schools that do not expect the price in 2015 to fall significantly are more likely to participate in an attempt to lower costs and this would imply a violation in the parallel assumption that implies our baseline estimate is too conservative. If participant’s counterfactual trends were 0.5 times that of non-participants (“twice as flat”), then the effect of the consortium on prices would be about -$15.
The treatment effect on bandwidth is less sensitive to the parallel trends assumption. In other words, the treatment effect is so large and the non-participant trend so flat that it would take an extreme difference in trends to reverse our treatment effect estimate.
4 Expenditures and Welfare
In this section, we measure the effect of the consortium on the schools’ expenditures and welfare. First, we use the difference-in-differences estimates to determine the savings from participating in the consortium. Second, we use observed prices and broadband choices before and after the consortium to determine bounds for the change in school welfare due to the consortium participation. Our main finding is that savings are large relative to the total E-rate subsidy, and the program leads to a meaningful increase in the welfare of the participating schools.
4.1 Expenditures
In our 2014 sample, schools that participated in the consortium in 2015 spent a total of approximately $5.42 million on internet services, of which $2.75 million was reimbursed by the E-rate program. Next, we determine the savings that accrue to the schools from the consortium and compare them to this E-rate subsidy.
As we have shown, the consortium lowered the prices and increased the chosen bandwidth. In particular, under the parallel trend assumption, participation in the consortium lowered prices for the schools by an average of $9.33 and increased bandwidth by 628 Mbps. Using these estimates, we determine two measures of savings which are effectively the Paasche and Laspeyres consumer price indices for participants.
First, we determine the savings by imposing the treatment effect, and holding schools ’ demand at the 2014 level, . This exercise gives the lower bound of savings because it keeps the demand fixed at the 2014 level. Second, we determine the savings by allowing the broadband demand to increase by the treantment effect of bandwidth, 628 Mbps. Lastly, to benchmark these savings, we compute the effective E-rate subsidy for the schools. The bound for savings and the total E-rate subsidy for school are given, respectively, by
| Lower: | (3) | |||
| Upper: | (4) | |||
| E-rate subsidy: | (5) |
where and are the ATT estimates in Table 2, is the price paid in 2014 and is the E-rate subsidy, which is the percentage of expense the FCC subsidizes.
Aggregating these savings for the whole year, we find that the savings can be as low as $1.82 million and as high as $6.52 million. These savings are, respectively, 66% and 237% of the $2.75 total E-rate subsidy that FCC paid to participating schools in New Jersey. Thus, we find that the demand bundling program can obtain similar cost savings to the schools or greater bandwidth-adjusted savings at no cost to the taxpayers. This evidence suggests that a policy-maker deciding between either implementing the current E-rate subsidy design or the ESCNJ Consortium design may prefer the latter.
4.2 Welfare of Schools
Measuring the total savings conflates lower prices and higher purchased bandwidth. In other words, a school’s total cost could be unchanged, but they could be better off because they pay the same amount for greater bandwidth. A better measure of the effect of the consortium would be the change in welfare from lower prices and greater bandwidth.
In this section, we quantify the change in welfare due to the consortium. Let be the demand function for school . For school , we observe the prices and broadband choices pairs (net of the E-rate subsidies) before the consortium, , and after the consortium . We want to determine the change in welfare, , which is the area under the demand curve between two prices:
Instead of directly estimating the demand function for broadband for schools, which is difficult given our data, we rely on insights from Kang and Vasserman (2022) and instead determine the bounds for under the assumption that the demand functions satisfy log-concavity, i.e., is decreasing in for all schools. Kang and Vasserman (2022) show that the change in welfare can be bounded as
| (6) |
and that this bound is sharp. Note that both the lower and upper bounds depend on the data. However, before determining these bounds, we select our sample appropriately.
Of the schools we observe in both years, of them participate in the consortium. We discard schools that upgrade service, for example, from DSL to fiber, as we expect the demand function for different services to be different, and fiber availability may change across the two years. We are left with participating schools and non-participating schools. In Figure 3, we separately present these bounds for participating and non-participating schools. As can be seen, in both cases, most schools have a positive lower bound, meaning that they benefited from the consortium and the program should be considered successful.
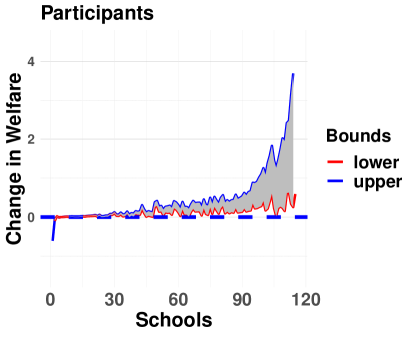
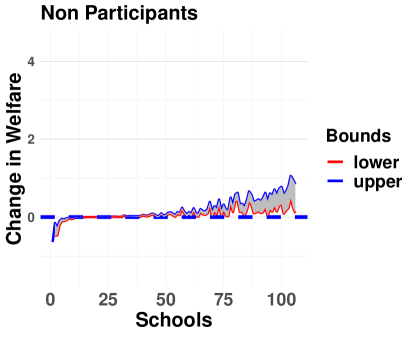
Note: Plots the upper and lower bounds for the change in the welfare of schools defined in (6), expressed in $10,000 per month. The left figure corresponds to 117 participating schools, and the right corresponds to 109 non-participating schools.
5 Conclusion
In 2014, New Jersey implemented a program for schools to pool demand for broadband internet. In this paper, we present three main findings: the consortium led to lower prices and higher chosen internet speeds; total expenditure savings due to the consortium was between 67% and 237% of the current E-rate subsidy for participating schools; and there was a substantial increase in school welfare due to the consortium.
Our findings are important for understanding the effective design of subsidy policies and the importance procurement design can have in achieving public policy goals. In our setting, the consortium could completely replace the E-rate program in terms of cost-effectiveness. However, it has the additional advantage that it is not taxpayer-funded.
Future work should seek to understand the mechanisms behind the results, which could help inform future design in these types of markets. We hypothesize that the effects of the consortium come from two sources. First, ISPs likely face an exposure problem (Milgrom, 2004) when bidding on independent school broadband contracts. Their costs depend on winning multiple contacts and the density of their current network. Guaranteeing winning multiple geographically close schools could alleviate exposed bids. Second, the packaging of demand through the consortium may have induced competition between ISPs that did not compete for individual school contracts, leading to lower prices.
References
- (1)
- Agarwal et al. (2023) Agarwal, Nikhil, Pearl Z. Li, and Paulo Somaini, “Identification using Revealed Preferences in Linearly Separable Models,” NBER Working Paper 31868, 2023.
- Arsenault-Morin et al. (2022) Arsenault-Morin, Alex P., Hayri A. Arslan, and Matthew L. Gentry, “On the Timing of Auctions: The Effects of Complementarities on Bidding, Participaton, and Welfare,” Working Paper, 2022.
- Ausubel et al. (1997) Ausubel, Lawrence, Peter Cramton, R. Preston McAfee, and John McMillan, “Synergies in Wireless Telephony: Evidence from the Broadband PCS Auctions,” Journal of Economics and Management Strategy, 1997, 6, 497–527.
- Bajari et al. (2009) Bajari, Patrick, Robert McMillan, and Steven Tadelis, “Auctions versus Negotiations in Procurement: An Empirical Analysis,” Journal of Law, Economics, and Organization, 2009, 25 (2), 372–399.
- Beresteanu (2005) Beresteanu, Aire, “Nonparametric Analysis of Cost Complementarities in the Telecommunication Industry,” RAND Journal of Economics, 2005, 36 (4), 870–889.
- Bulow and Klemperer (1996) Bulow, Jeremy and Paul Klemperer, “Auctions Versus Negotiations,” The American Economic Review, 1996, pp. 180–194.
- Cantillon and Pesendorfer (2010) Cantillon, Estelle and Martin Pesendorfer, “Auctioning Bus Routes: The London Experience,” in Peter Cramton, Yoav Shoham, and Richard Steinberg, eds., Combinatorial Auctions, MIT Press, 2010, chapter 22.
- Caplice and Sheffi (2010) Caplice, Chris and Yossi Sheffi, “Combinatorial Auctions for Truckload Transportation,” in Peter Cramton, Yoav Shoham, and Richard Steinberg, eds., Combinatorial Auctions, MIT Press, 2010, chapter 21.
- Congressional Budget Office (1997) Congressional Budget Office, “Where Do We Go From Here? The FCC Auctions and the Future of Radio Spectrum Management,” Report, 1997.
- Congressional Budget Office (2017) , “A Premium Support System for Medicare: Updated Analysis of Illustrative Options,” Report, 2017.
- Congressional Budget Office (2020) , “Public-Private Partnerships for Transportation and Water Infrastructure,” Report, 2020.
- Covert and Sweeney (2023) Covert, Thomas R. and Richard L. Sweeney, “Relinquishing Riches: Auctions Versis Informal Negotiations in Texas Oil and Gas Leasing,” American Economic Review, 2023, 113 (628-663).
- Decarolis et al. (2020) Decarolis, Francesco, Maria Polyakova, and Stephen P. Ryan, “Subsidy Design in Privately Provided Social Insurance: Lessons from Medicare Part D,” Journal of Political Economy, 2020, 128 (5), 1712–1752.
- Fox and Bajari (2013) Fox, Jeremy T. and Patrick Bajari, “Measuring the Efficiency of an FCC Spectrum Auction,” American Economic Journal: Microeconomics, 2013, 5 (1), 100–146.
- Goeree and Lindsay (2020) Goeree, Jacob K. and Luke Lindsay, “The Exposure Problen and Market Design,” Review of Economic Studies, 2020, 87, 2230–2255.
- Kang and Vasserman (2022) Kang, Zi Yang and Shoshana Vasserman, “Robust Bounds for Welfare Analysis,” Technical Report, National Bureau of Economic Research 2022.
- Kim et al. (2014) Kim, Sang Won, Marcelo Olivared, and Gabriel Y. Weintraub, “Measuring the Perfermance of Large-Scale Combinatorial Auctions: A Structural Estimation Approach,” Management Science, 2014, 60 (5), 1180–1201.
- Manski and Pepper (2018) Manski, Charles F and John V Pepper, “How Do Right-to-Carry Laws Affect Crime Rates? Coping with Ambiguity Using Bounded-Variation Assumptions,” Review of Economics and Statistics, 2018, 100 (2), 232–244.
- Milgrom (2004) Milgrom, Paul Robert, Putting Auction Theory to Work, Cambridge University Press, 2004.
- Rambachan and Roth (2023) Rambachan, Ashesh and Jonathan Roth, “A More Credible Approach to Parallel Trends,” Review of Economic Studies, 2023, p. rdad018.
- Xiao and Yuan (2022) Xiao, Mo and Zhe Yuan, “License Complementarity and Package Bidding: Us Spectrum Auctions,” American Economic Journal: Microeconomics, 2022, 14 (4), 420–464.