GeoFormer: A Vision and Sequence Transformer-based Approach for Greenhouse Gas Monitoring
Abstract
Air pollution represents a pivotal environmental challenge globally, playing a major role in climate change via greenhouse gas emissions and negatively affecting the health of billions. However predicting the spatial and temporal patterns of pollutants remains challenging. The scarcity of ground-based monitoring facilities and the dependency of air pollution modeling on comprehensive datasets, often inaccessible for numerous areas, complicate this issue. In this work, we introduce GeoFormer, a compact model that combines a vision transformer module with a highly efficient time-series transformer module to predict surface-level nitrogen dioxide (NO2) concentrations from Sentinel-5P satellite imagery. We train the proposed model to predict surface-level NO2 measurements using a dataset we constructed with Sentinel-5P images of ground-level monitoring stations, and their corresponding NO2 concentration readings. The proposed model attains high accuracy (MAE 5.65), demonstrating the efficacy of combining vision and time-series transformer architectures to harness satellite-derived data for enhanced GHG emission insights, proving instrumental in advancing climate change monitoring and emission regulation efforts globally.
1 Introduction
The emission of greenhouse gases (GHGs), primarily from industrial and transportation activities, is a major contributor to the increasingly urgent climate change crisis. This article introduces innovative methodologies for forecasting the levels of nitrogen dioxide (NO2), a prevalent byproduct of fossil fuel combustion that poses significant risks to both human health and the environment. Notably, NO2 is closely associated with other air contaminants, such as fine particulate matter (PM2.5), and is often released alongside CO2, a leading greenhouse gas, rendering it an effective indicator for gauging CO2 emissions. The adverse effects of NO2 on human health, particularly on the cardiovascular and respiratory systems, underscore the necessity of managing NO2 levels. The ability to accurately identify instances where safe exposure thresholds are exceeded, as well as to assess individual exposure levels, demands detailed insight into the spatial and temporal distribution of NO2. This requirement serves as a key motivation for our research.
The advent of high-resolution satellite imagery, such as that provided by the Sentinel-5P satellite, offers unprecedented opportunities for the monitoring of atmospheric pollutants. The TROPOMI device on the Sentinel-5P satellite enables detailed observation of NO2 emissions on a global scale Bodah et al. (2022). However, the challenge lies in effectively analyzing this vast amount of data to produce accurate and timely predictions of surface-level GHG concentrations. Although deep learning models have demonstrated potential for estimating GHG emissions with the use of satellite imagery, there is an increasing need for models that are both accurate and computationally efficient. In response to these challenges, this paper presents an innovative architecture based on both a vision transformer (ViT) and a time-series transformer, aimed at monitoring greenhouse gas (GHG) emissions using Sentinel-5P imagery. Being a fraction of the size of models proposed for similar tasks, this represents an advancement in the application of deep learning to environmental monitoring, establishing a new standard for tracking GHG emissions in real-time and with high efficiency and low compute. In addition, it lays the groundwork for future efforts aimed at mitigating climate change.
The following are the main contributions of this work:
-
1.
A Dataset of Paired Sentinel-5P and NO2 Data: We introduce a comprehensive dataset that pairs high-resolution Sentinel-5P satellite imagery with corresponding surface-level NO2 concentration measurements. This dataset is characterized by its daily granularity over the course of 15 months.
-
2.
A Compact and Efficient Spatio-temporal Transformer Model: We propose a novel transformer-based model that leverages the spatial and temporal dynamics of NO2 emissions; the result is a model that outperforms existing methods in terms of accuracy while being significantly more efficient in terms of computational resources required.
2 Related Work
2.1 Transformer Models
The transformer architecture, introduced by Vaswani et al. (2017), revolutionized sequence modeling. The core mechanism here is self-attention, which allows the model to weigh the importance of different parts of the input data relative to each other. Mathematically, the self-attention mechanism can be described as:
| (1) |
where , , and represent the query, key, and value matrices, respectively, derived from the input, and is the dimensionality of the keys and queries, which serves as a scaling factor. This ability to handle sequences in their entirety parallelizes computation and has led to state-of-the-art results in various sequence modelling tasks (Devlin et al., 2019). However, as is noted by Zhou et al. (2021), the vanilla transformer architecture has time complexity, where is the number of input tokens.
2.2 Deep Learning for Greenhouse Gas Emissions
Historically, the estimation of the spatial distribution of atmospheric pollutants, including greenhouse gases, has predominantly been based on discrete point measurements from specific locales. These measurements are then extrapolated over larger areas through geostatistical techniques such as kriging Janssen et al. (2008) or Land-Use Regression (LUR) models Hoek et al. (2008). Although these traditional methods have proven useful, they are hampered by their need for detailed variable selection and lack the capability for efficient large-scale application.
In contrast, recent progress in the field of deep learning has shown promise for improving the accuracy of greenhouse gas quantification. For instance, Scheibenreif et al. (2021); Hanna et al. (2021) leverage Sentinel-2 and Sentinel-5P data to estimate CO2and NO2 surface-level emissions using convolutional neural network (CNN) backbones. Khirwar and Narang (2024) propose a vision transformer-based approach, achieving better results with a more compact model on the dataset proposed by Scheibenreif et al. (2021). However, this dataset has at most a monthly granularity. Although this may have applications for identifying longer-term trends, such a dataset does not offer the opportunity to detect anomalous spikes in greenhouse gases/pollutants quickly.
3 Methodology
3.1 Vision Transformer Module
Transformers have been adapted to image data by treating images as sequences of patches Dosovitskiy et al. (2020). The fundamental principle here is to decompose an image into a sequence of smaller, fixed-size patches, apply linear transformations to project these patches into an embedding space, and then process the embeddings using the Transformer’s self-attention mechanism. This allows each element to attend over all positions, as opposed to convolutional neural networks (CNNs) that are limited by their kernel sizes Wang et al. (2021). Mathematically,
| (2) |
where MHSA denotes the multi-head self-attention mechanism, , , and are the query, key, and value projections of the embeddings , and represents the dimensionality of the keys and queries. The output from the encoder is a high-dimensional representation that captures the attention-driven spatial relationships between different patches of the input image.
3.2 Efficient Time-series Transformer
The Efficient Sequence Transformer module is designed to process sequences of NO2 concentration data by employing a sparsity-enhanced self-attention mechanism to generate attention feature maps as proposed by Zhou et al. (2021). This mechanism, adapted from the canonical self-attention framework Vaswani et al. (2017), has time-complexity and is thus allows for more tractable compute, compared to traditional self-attention, when applied to long sequences. The authors introduce a sparsity-driven approach, ProbSparse self-attention, which selectively computes attention weights for a subset of dominant queries, thereby reducing the computational complexity. This is based on the observation that self-attention weight distributions often exhibit sparsity, with a few key-query interactions dominating the attention mechanism. The ProbSparse self-attention mechanism is formalized by replacing with from equation 1. Here, contains only the top- queries based on a sparsity measurement , which quantifies the diversity of the attention distribution for each query as follows:
| (3) |
This measurement helps identify queries that contribute significantly to the attention distribution, allowing for a sparse computation of attention weights.
The output from this module is a latent representation that captures the attention-driven temporal relationships between historical predictions of NO2 concentration.
3.3 Integration of Spatio-temporal Features via Cross Attention
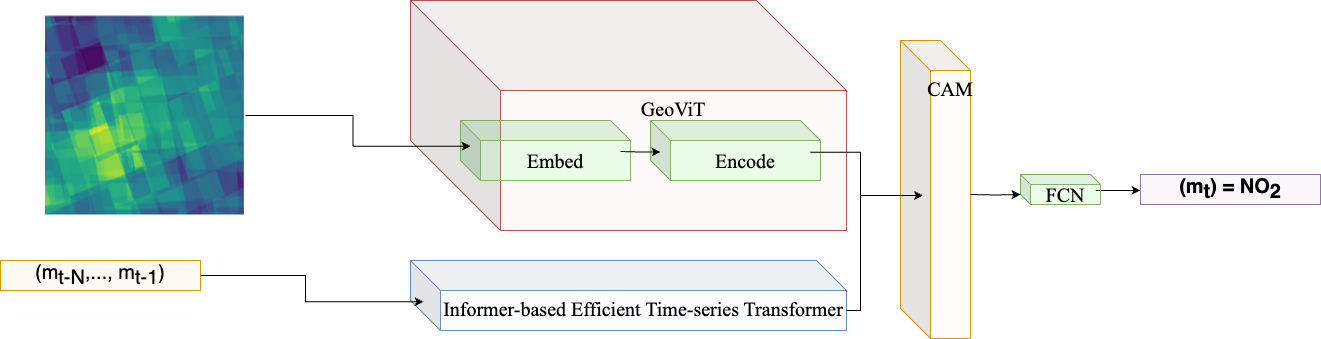
The model takes latent representations from the ViT encoder and time-series transformer to dynamically weigh the importance of spatial information from satellite imagery against the temporal patterns of predicted NO2 concentrations, producing a contextually enriched feature vector Gheini et al. (2021) that embodies both spatial and temporal insights. Finally, the enriched feature vector is passed through a series of fully connected layers to regress the final scalar output representing the predicted NO2 concentration. The architecture is represented in figure 1, where is the surface level NO2 concentration prediction at timestamp .
4 Experimentation and Results
4.1 Data Collection and Training
Ground-level NO2 concentration data were collected from 35 monitoring stations distributed across Europe. Daily average NO concentrations2 were compiled for the period October 2022 to January 2024. Corresponding Sentinel-5P satellite images were acquired for the same time period. We train the proposed model for 600 epochs on an Nvidia Tesla T4 GPU. We test the performance of the model on an unseen subset of the 35 locations that comprise our dataset, such that they are effectively out-of-distribution with respect to the training data.
4.2 Results
We present a comparative analysis of the metrics achieved by our proposed model on the proposed dataset, along with results achieved by Scheibenreif et al. (2021); Khirwar and Narang (2024) on the dataset proposed by Scheibenreif et al. (2021). For a more direct comparison, we also present an analysis of all three models on our proposed dataset. Since the dataset proposed by Scheibenreif et al. (2021) has low temporal granularity, sequences of datapoints from the same location aren’t long enough for a sequence modelling module to capture useful dependencies between sequential NO2 readings. Thus, the dataset proposed herein enables us to leverage sequence modeling to a more profound effect than would be possible with previously established datasets for NO2 monitoring.
This allows us to do away with the need for a Sentinel-2 image, which greatly reduces the size of the model (since Sentinel-2 images have 12 spectral channels, whereas Sentinel-5P images have only one). As is seen in table 1, our proposed model is more than an order of magnitude less in size when compared to models that use a Sentinel-2 image in conjunction with a Sentinel-5P image, while achieving or surpassing results that previous models achieve (albeit on a different dataset). We also offer a comparison of modifications of these models trained on the proposed dataset (such that they only take Sentinel-5P input), and we see that performance drops considerably, as these models do not have a time-series modeling component. In table 1, models trained on the dataset introduced by Scheibenreif et al. (2021) are marked with an asterisk (*).
| Model | MAE | MSE | Size (MB) |
|---|---|---|---|
| GeoViT* | 5.84 | 58.9 | 850 |
| CNN Backbone* | 6.68 | 78.4 | 1964 |
| GeoViT | 6.69 | 72.70 | 65 |
| CNN Backbone | 6.49 | 67.25 | 32 |
| GeoFormer (proposed) | 5.65 | 56.95 | 70 |
5 Conclusion and Future Work
This paper presented a comprehensive approach for predicting NO2 concentrations by leveraging attention between spatio-temporal features as well as a long-sequence dataset combining Sentinel-5P imagery with ground-level monitoring station readings. Future research will explore the integration of Vision Transformers with optical flow-based models Guizilini et al. (2022) for sequence modelling, such that instead of a single image and a series of historical predictions, the model can take a series of satellite images as well as a series of historical predictions as input. Additionally, exploring the scalability of our model to other pollutants and environmental indicators could broaden the applicability of the proposed work.
References
- Bodah et al. [2022] Brian William Bodah, Alcindo Neckel, Laércio Stolfo Maculan, Celene B Milanes, Cleiton Korcelski, Omar Ramírez, Juan F Mendez-Espinosa, Eliane Thaines Bodah, and Marcos LS Oliveira. Sentinel-5p tropomi satellite application for no2 and co studies aiming at environmental valuation. Journal of Cleaner Production, 357:131960, 2022.
- Vaswani et al. [2017] Ashish Vaswani, Noam Shazeer, Niki Parmar, Jakob Uszkoreit, Llion Jones, Aidan N Gomez, Łukasz Kaiser, and Illia Polosukhin. Attention is all you need. Advances in neural information processing systems, 30, 2017.
- Devlin et al. [2019] Jacob Devlin, Ming-Wei Chang, Kenton Lee, and Kristina Toutanova. Bert: Pre-training of deep bidirectional transformers for language understanding, 2019.
- Zhou et al. [2021] Haoyi Zhou, Shanghang Zhang, Jieqi Peng, Shuai Zhang, Jianxin Li, Hui Xiong, and Wancai Zhang. Informer: Beyond efficient transformer for long sequence time-series forecasting, 2021.
- Janssen et al. [2008] Stijn Janssen, Gerwin Dumont, Frans Fierens, and Clemens Mensink. Spatial interpolation of air pollution measurements using corine land cover data. Atmospheric Environment, 42(20):4884–4903, 2008.
- Hoek et al. [2008] Gerard Hoek, Rob Beelen, Kees De Hoogh, Danielle Vienneau, John Gulliver, Paul Fischer, and David Briggs. A review of land-use regression models to assess spatial variation of outdoor air pollution. Atmospheric environment, 42(33):7561–7578, 2008.
- Scheibenreif et al. [2021] Linus Scheibenreif, Michael Mommert, and Damian Borth. Estimation of air pollution with remote sensing data: Revealing greenhouse gas emissions from space. arXiv preprint arXiv:2108.13902, 2021.
- Hanna et al. [2021] Joëlle Hanna, Michael Mommert, Linus Mathias Scheibenreif, and Damian Borth. Multitask learning for estimating power plant greenhouse gas emissions from satellite imagery. In NeurIPS 2021 Workshop on Tackling Climate Change with Machine Learning, 2021.
- Khirwar and Narang [2024] Madhav Khirwar and Ankur Narang. Geovit: A versatile vision transformer architecture for geospatial image analysis. IEEE International Conference on Machine Intelligence for GeoAnalytics and Remote Sensing (to appear), April 2024.
- Dosovitskiy et al. [2020] Alexey Dosovitskiy, Lucas Beyer, Alexander Kolesnikov, Dirk Weissenborn, Xiaohua Zhai, Thomas Unterthiner, Mostafa Dehghani, Matthias Minderer, Georg Heigold, Sylvain Gelly, Jakob Uszkoreit, and Neil Houlsby. An image is worth 16x16 words: Transformers for image recognition at scale. arXiv preprint arXiv:2010.11929, 2020.
- Wang et al. [2021] Wenhai Wang et al. Pyramid vision transformer: A versatile backbone for dense prediction without convolutions. arXiv preprint arXiv:2102.12122, 2021.
- Gheini et al. [2021] Mozhdeh Gheini, Xiang Ren, and Jonathan May. Cross-attention is all you need: Adapting pretrained transformers for machine translation, 2021.
- Guizilini et al. [2022] Vitor Guizilini, Kuan-Hui Lee, Rares Ambrus, and Adrien Gaidon. Learning optical flow, depth, and scene flow without real-world labels, 2022.
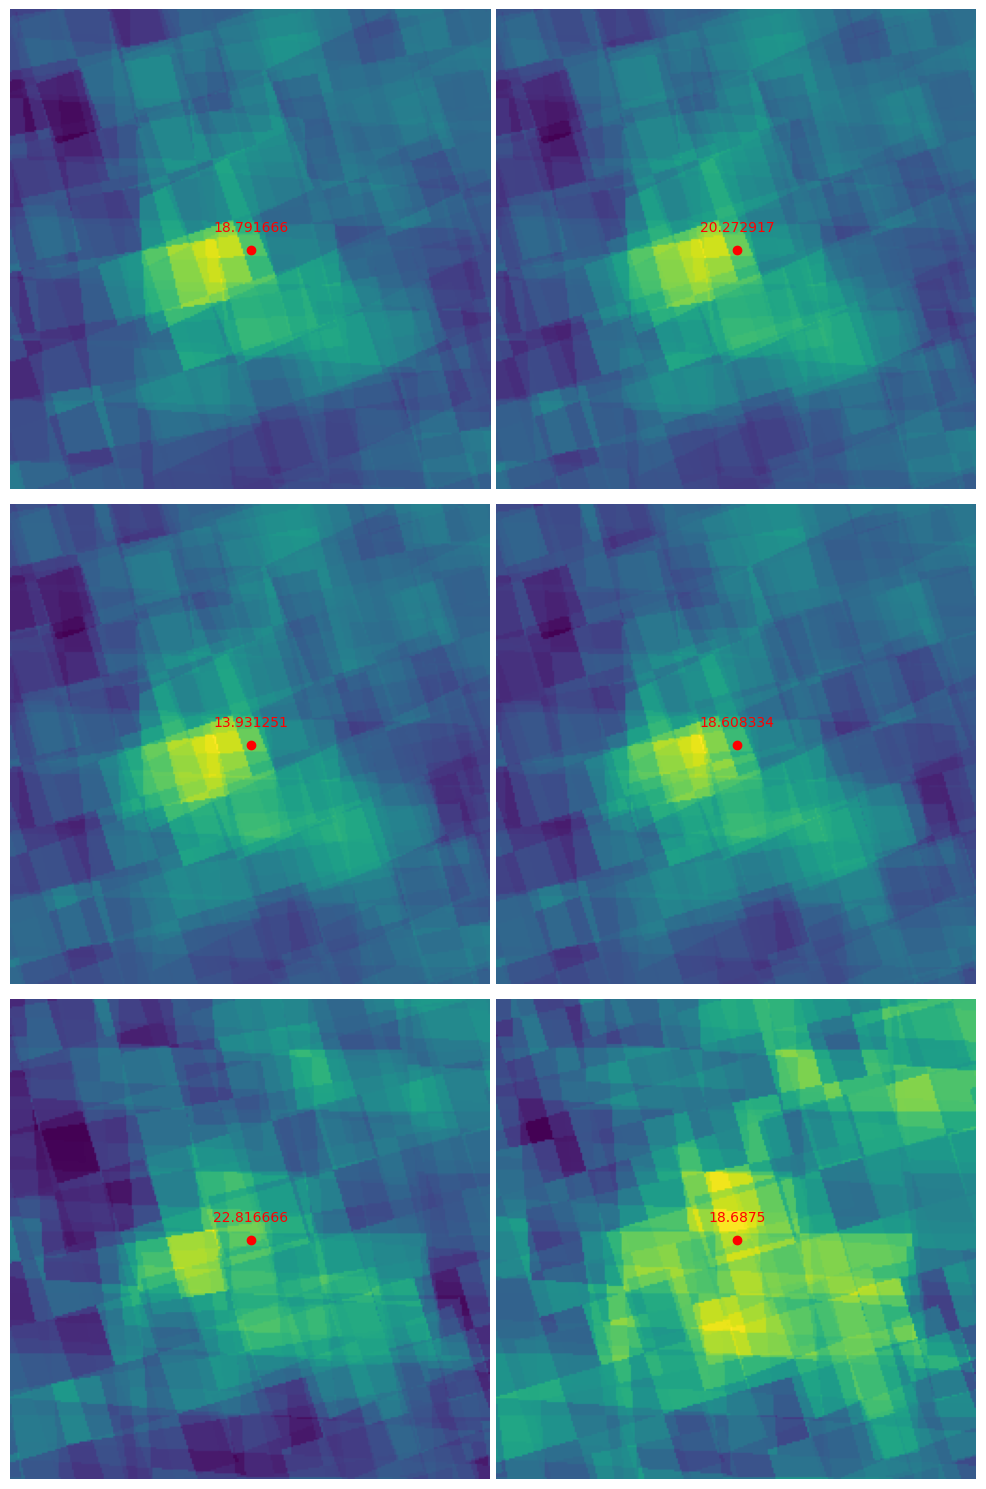
Appendix A Dataset
A.1 Data Collection Process
The following steps were taken to create the paired Sentinel-5P and NO2concentration dataset:
-
1.
Temporal Alignment: Sentinel-5P images were collected to align with the timestamps of the daily ground-level NO2 data. To enhance temporal resolution and mitigate the effects of cloud cover and other atmospheric disturbances, images were mosaicked over rolling 10-day windows. This approach ensured that each satellite image represented an aggregate view of NO2 concentrations over the 10 days preceding each ground measurement date.
-
2.
Spatial Coverage: For each monitoring station, a bounding box was calculated around its coordinates to define the region of interest for satellite imagery collection. This bounding box was determined based on a fixed radius from the station’s location, ensuring that the satellite images encompassed the local atmospheric conditions relevant to the ground-level NO2 readings.
-
3.
Image Processing: Satellite images were processed to match the spatial resolution and scale required for analysis. This included center cropping and resizing operations to standardize image dimensions, facilitating consistent comparison and integration with ground-level NO2 data.
A.2 Data Samples