Unified Framework for Laser-induced Transient Bubble Dynamics within Microchannels
Abstract
Oscillatory flow in confined spaces is central to understanding physiological flows and rational design of synthetic periodic-actuation based micromachines. Using theory and experiments on oscillating flows generated through a laser-induced cavitation bubble, we associate the dynamic bubble size (fluid velocity) and bubble lifetime to the laser energy supplied - a control parameter in experiments. Employing different channel cross-section shapes, sizes and lengths, we demonstrate the characteristic scales for velocity, time and energy to depend solely on the channel geometry. Contrary to the generally assumed absence of instability in low Reynolds number flows (), we report a momentary flow distortion that originates due to the boundary layer separation near channel walls during flow deceleration. The emergence of distorted laminar states is characterized using two stages. First the conditions for the onset of instabilities is analyzed using the Reynolds number and Womersley number for oscillating flows. Second the growth and the ability of an instability to prevail is analyzed using the convective time scale of the flow. Our findings inform rational design of microsystems leveraging pulsated flows via cavitation-powered microactuation.
Significance: Fluid flows in confined spaces are omnipresent in nature and engineering, e.g, in tissue capillaries and lab-on-a-chip devices. Unlike steady flows, confined flow in physiological systems are often oscillatory and pulsatile, driven by sudden changes. The pulsatile flow in synthetic systems is commonly employed to generate droplets, enhance mixing, separate solid particles and mitigate clogging yet its dynamics is underexplored. Here we focus on oscillatory flows generated through a laser-induced cavitation bubble. Combining experiments and theory, we demonstrate a universality in the flow parameters, such as velocity, oscillation time period, laser energy dependence and emergence of flow instabilities. Our findings inform rational design of oscillatory pulsatile flows in engineering systems ranging from cavitation driven microactuators to biomimetic micromachines.
Micromachines with few mechanical components have revolutionized the areas of microelectromechanical systems (MEMS) [1, 2, 3]. The potential of bubble-powered micromachines was first realized in ink-jet printing [4], later also finding other applications that require precise flow control and rapid actuation [5, 6, 7]. Oscillatory flows are not limited to synthetic devices, but also invariably exist in nature, e.g., in cardiovascular and respiratory flows [8]. Yet characterization and optimization of pulsated oscillatory flow is underexplored compared to steady flows [2]. Therefore, a unified understanding will inform both synthetic and physiological systems, encompassing particle manipulation [9, 10], rheology [11, 12], emulsification [13], cell lysis [14], prilling [15], needleless injection [16, 17] and gas embolotherapy [18].
Laser-induced cavitation allows localization of high temperature and large flow velocities due to the growth and collapse of short-lived vapor bubbles. Thus, laser light can be implemented to induce flow in processes with only need for optical access [19]. For confined geometries, the arrested directions of flow and increase in bubble lifetime due to strong confinement-induced momentum dissipation allows for a simplified theoretical and experimental approach [20, 21]. Yuan et al. [22] laid the theoretical foundation for the dynamics of a vapor bubble in a narrow channel with a circular cross-section. They reported the internal vapor pressure of the bubble to be insignificant after the initial 10% of the bubble’s lifetime. Thus, the dynamics of the bubble is largely governed by the wall resistance of the microchannel, ambient pressure, and inertia of the liquid shortly after bubble formation. Using experiments and a numerical model, Sun et al. [21] showed the role of absorbed laser energy in bubble evolution within circular microchannels with internal diameters of 25 and 50 m.
The key to rational control of thermocavitation driven flows hinges on understanding the dynamics of the transient bubble, the bubble lifetime, and its dependence on the laser energy supplied. The findings could potentially be applied to any microsystem that employs a periodic actuation source to transfer momentum to the fluid much faster than the timescale of flow oscillation. Given application-specific requirements, e.g., flow rates, droplet production rate and mixing [23], valve actuation time [24], etc., there is a need for a unified framework with which one could a priori design the channel geometry (cross-section shape, size and length), provided that the fluid properties such as viscosity, density and light absorbance are known. Beyond the design of lab-on-a-chip devices, characterizing the flows and instabilities will help in the study and engineering of physiological systems, such as flows in arteries and bronchioles, by additionally incorporating the effects of channel wall compliance [25]. Furthermore, the fundamental understanding developed can be utilized in laser-induced crystallization via thermocavitation [26, 27, 28], as the bubble dynamics will dictate hydrodynamic flows around nucleated crystals.
In this paper, combining high-speed microscopy and an analytical approach, we demonstrate a universal dependence of the magnitude and duration of the induced flow on the laser energy supplied in microchannels with circular, square, and rectangular cross-sections. Prior works discussed undistorted laminar flows [21, 29, 30, 31], which is a convenient assumption for low Reynolds numbers () [32]. Nevertheless, we observe the occurrence of a transient flow instability even at , and delineate it by characterizing two dimensionless numbers: (i) the Reynolds number (), contingent on the peak mean flow velocity and channel hydraulic diameter, and (ii) the Womersley number (Wo), contingent on the bubble lifetime and channel hydraulic diameter. This momentary instability emerges due to the oscillatory nature of the flow [33, 34], and results in momentary unsteady velocity profiles due to the disruption of the momentum boundary layer near the channel walls [35].
This paper first details the experiments for quantifying the dynamic bubble size as well as lifetime as the function of its maximum bubble size. Then the associated theoretical framework is presented to explain underlying physics. Following which, a general empirical correlation between maximum bubble size and laser energy supplied, and the minimum threshold laser energy for bubble formation is discussed. Finally, using the established theoretical framework and experiments, we characterize the flow transition limits and nature of the distorted laminar flow.
Methods
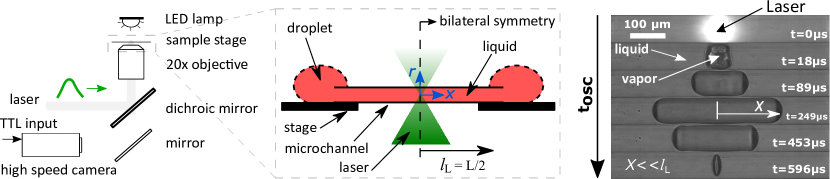
Laser setup: Frequency-doubled Nd:YAG pulsed laser with 532 nm wavelength, 4 mm beam diameter and 4 ns pulse duration. A objective (numerical aperture = 0.5) is used to focus the laser within the microchannel and simultaneously used for imaging [36]. The images are recorded at 112,500 frames per second using a high-speed camera. Working fluid: An aqueous solution of red dye (RD81, Sigma-Aldrich) with 0.5 wt% is used to have higher absorbance to light at 532 nm. The absorption coefficient () was measured to be 173 cm-1 using a spectrometer (DR6000, Hach). The liquid was not pre-treated for dissolved gases. Channel geometry: The hydraulic diameter () of the channels range from 66.7 m to 300 m, with the maximum bubble half-size, (see Fig. 1). Two different capillary lengths, , were used for all cases with the laser always focused at the geometric center.
Results and Discussion
Dynamic bubble size
Since the midpoint of the capillary and the bubble coincides, in our theoretical model we analyze only half the geometric domain owing to the bilateral symmetry, see Fig. 1. Thus, the length of the liquid column under analysis () is half the total length of the channel used, and the half-size of the bubble () is determined by the position of the vapor-liquid interface from the center as illustrated in Fig. 1. In the post-processing of the images the parameter was estimated by dividing the bubble volume with the area of the channel cross-section (see SI Appendix, section 1). This approach of determining ruled out the effects of bubble end curvatures, furthermore allowing us to estimate the liquid velocities as a function of rate of volume displaced. The liquid droplets at either end of the channel act as reservoirs and prevent evaporation of the liquid within the channel.
After attaining the capillary diameter (), the vapor bubble is cylindrical with the cross-section as that of the channel. Thus, for a cylindrical bubble, when , the equation of motion of the liquid column within the channel is [21]
| (1) |
where is the liquid density, is the pressure inside bubble, is the ambient pressure and the hydraulic resistance of the channel. Due to strong confinement in two directions, the resulting flow is quasi-1D along the longitudinal axis , which justifies the use of a one-dimensional model. The expressions of the steady state hydraulic resistance derived using laminar flow theory for different cross-sections are [37]: (circle); (square) and (rectangle), where is the dynamic viscosity of the liquid and are the cross-section’s edge lengths with . For circular and square cross-sections , and for a rectangular cross-section . By non-dimensionalizing Eq. 1, we obtain the characteristic velocity () and timescale () for the channel geometry as and , respectively.

Since is reported to be significant only during the first of the bubble’s lifetime [22], we simplify the problem by dropping this term (). Thus, the liquid initially gains momentum from the impulse offered by the vapor pressure. Subsequently, the bubble continues to grow due to the liquid’s inertia, even though the pressure inside the bubble is much less than the ambient pressure [21]. At the end of the growth phase, the liquid momentum is fully dissipated by the resistance of the channel walls, following which the ambient pressure collapses the bubble. We describe the bubble growth and collapse by solving the ordinary differential equation (ODE) from Eq. 1 and derive the following dimensionless equation for the dynamic bubble size:
| (2) |
where and are the dimensionless bubble size and time, respectively. The ODE is solved using the boundary condition at , where is the maximum bubble size.
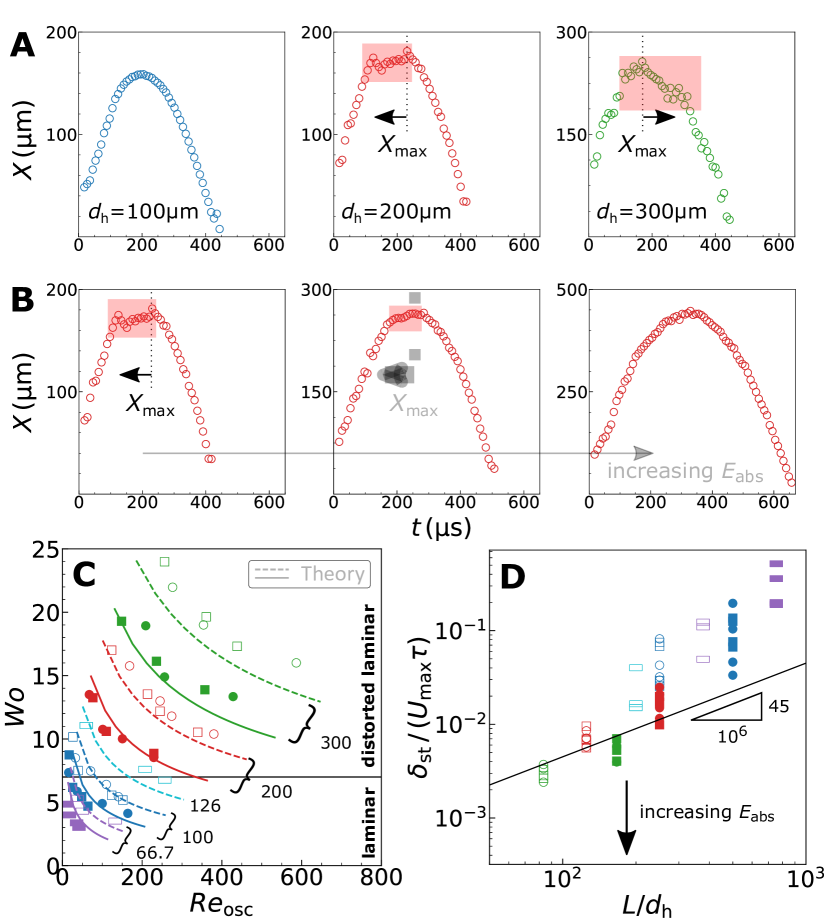
Fig. 2A shows the representative bubble dynamics from experiments for different channel cross-sections and lengths. The bubble’s maximum size, lifetime and the growth/collapse velocities vary significantly for different microchannel geometries. Fig. 2B shows the experiments to follow the derived general expression for dynamic bubble size when non-dimensionalized using the characteristic scales (see SI Appendix, section 1 for unscaled results). In most cases, we see a deviation in the bubble size from theory in the first 10% of the bubble’s lifetime, as expected. This can be attributed to the significant vapor pressure inside the bubble due to instantaneous phase change during formation ( 100 bar) and the force exerted by the channel wall during the radial (, see Fig. 1) growth of the bubble [18]. However as the bubble grows this vapor pressure decreases abruptly due to rapid change in the bubble volume [21].
In Fig. 2A, for m, we see a rapid acceleration during the start of the bubble collapse (pointed using a black arrow). Similarly, in Fig. 2B, we also see a deviation from theory during the start of bubble collapse becoming more significant with increasing hydraulic diameter (m). We attribute these to instabilities, discussed in detail under the section “Emergence of instabilities” later in this article.
Bubble lifetime
While the dynamic size of the vapor bubble quantifies the liquid velocity or flow rate, the lifetime of the bubble governs the time period of flow. In this work, we focus on the primary expansion and collapse of the bubble and ignore the bubble rebound caused by high pressures and temperatures [38]. Thus, the lifetime of the bubble is the time taken for one oscillation, . In Eq. 2, by substituting , we obtain the bubble’s time of formation and collapse. The analytical prediction of the bubble’s lifetime is
| (3) |
where W0 is the principal branch of the Lambert function and W-1 its only other real branch, and . The dimensionless times and correspond to the time span of bubble expansion and collapse, respectively. We note that the dimensionless time in Figure 2B is negative due to the choice of time zero at the maximum bubble size.
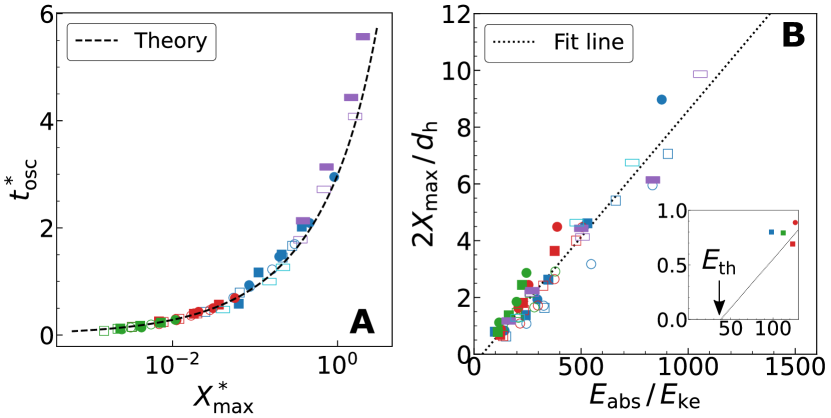
Figure 3A illustrates the relation between the dimensionless bubble lifetime and maximum bubble size. We report a good agreement between the experiments and the theoretical prediction from Eq. 3. See SI Appendix, section 1 for unscaled data presented in Fig. 3A. There is a decrease in the bubble lifetime with an increase in the hydraulic diameter for a fixed channel length and . This is caused by the decrease in hydraulic resistance with increasing hydraulic diameter, resulting in faster bubble dynamics.
The above sections discuss the theory for dynamic bubble size (, Eq. 2) and lifetime (, Eq. 3). The proposed theory demands as the only necessary parameter to compare with experiments. Thus it is necessary to have an estimate of as a function of the laser energy supplied - a control parameter in experiments.
Energy Balance
Figure 3B represents a general scaling law using empirical correlation for the maximum bubble size () against the absorbed laser energy, . The parameters and are non-dimensionalized with respect to the hydraulic diameter and kinetic energy of the liquid with unitary velocity, respectively. The liquid kinetic energy with unitary velocity () is calculated as
| (4) |
where is the cross-sectional area of the channel. This approach to determine via empirical correlation avoids the need for a more sophisticated numerical model with energy balances and phase transition [38].
For a certain cross-sectional shape, the energy required to achieve a certain increases with the hydraulic diameter and length of the channel (see SI Appendix, section 1 for unscaled results of Fig. 3B). In Fig. 3B we see the to be at least two orders of magnitude higher than the . This observation is in agreement with the numerical simulations by Sun et al. [21], where most of the absorbed laser energy heats up the liquid directly surrounding the bubble, rather than transforming into the kinetic energy of the liquid.
In the experiments, the amount of laser energy absorbed by the liquid depends on the liquid properties and channel geometry. Based on the Beer-Lambert law [39], the absorption coefficient of the liquid and the distance the light travels through the liquid is used to estimate the amount of light absorbed, . Furthermore, the channel’s wall thickness, material, cross-section shape and dimension can influence the laser energy available for the liquid to absorb. Thus the energy absorbed by the liquid in experiments was calibrated by measuring the difference of energy transmitted with the microchannel containing water and water-dye mixture (working fluid). Since water has very low absorption coefficient () for the laser wavelength used (532 nm) [40], we attribute the measured energy difference to the laser energy absorbed by the dye.
For rectangular channels, the longer edge length was used for supporting the channel over the stage (see Fig. 1), while the laser light was passed along the shorter edge. The details on the energy absorption measurement technique can be found in SI Appendix, section 2.
The fit in Fig. 3B has an intercept for , implying there exists a threshold absorbed energy () only above which a vapor bubble forms. For a bubble to form, theoretically we use the spinodal temperature of water as the necessary condition [41] - the temperature at which water explosively turns into vapor. Thus, a sensible heat corresponding to (at 1 atm and with respect to room temperature of 298 K) and a latent heat proportional to enthalpy of vaporization is minimum required at the laser spot for bubble formation. SI Appendix, section 2 provides a simplified analytical expression for based on liquid energy balance using the absorption coefficient of liquid and empirically estimated laser spot diameter in light of aberrations [42].
Emergence of instabilities
In Fig. 4A, for we see the bubble dynamics deviating from an expected bell curve like profile. Interestingly, the deviation occurs before for and after for . Furthermore, Fig. 4B shows for that for the deviation disappears for larger . We hypothesise the observed deviations to the boundary layer instabilities near channel walls. These instabilities emerge due to the oscillating nature of the flow and unlike unidirectional flows it cannot be characterized only using the Reynolds number. Thus, the flow instability in oscillating channel flow is characterized using a peak oscillatory Reynolds number and a Womersley number [43, 44]. is the maximum mean flow velocity during the bubble growth, which on average occurs in the middle of the duration of growth, and is the angular frequency of oscillation. Fig. 4C shows these dimensionless numbers for the experiments performed in this work.
A simple approach to estimate the flow using theory can be formulated by using the analytical expression for (Eq. 3) and differentiating Eq. 2 with respect to time. The resulting dimensionless flow velocity is
| (5) |
By substituting half the bubble growth time for , we calculate a corresponding maximum mean flow velocity and .
The lines in Fig. 4C represent the analytical prediction of the dimensionless flow parameters for varying in all channel geometries. We report a good agreement between the experiments and the analytical estimate. The horizontal line in the figure, , represents the empirically observed laminar to distorted laminar transition value from literature for a perfectly oscillating flow with sinusoidal pressure gradient [33]. To predict the transition, the onset and growth of instability is determined using the parameters: (i) the position of the point of inflection, and (ii) the convective timescale, respectively. Das et al. [45], using pulsatile flow theory with a sinusoidal mean velocity profile [8], showed the dimensionless position of the point of inflection to be independent of the Wo above a critical Stokes parameter, , where is the Stokes layer thickness. This theoretical critical value of is below the empirically observed critical transition value of . Thus, the aforementioned analysis of instability using demonstrates the critical Wo in flow transition to be independent of the position of the point of inflection. However, the source of instability can still be attributed to the inflection of the velocity profiles near channel walls occurring due to the flow reversal (boundary layer separation) during the deceleration phase of the liquid. To further emphasize the observed deviation in Fig. 4A as a cause of instability and not due to assumptions underlying the theory under consideration, we compare it to laminar flow due to an oscillating pressure gradient. Just before the bubble attains its maximum size, detachment of the boundary layer at the confining walls has been reported for flows between parallel plates based on numerical analysis [46]. The flow detachment exists due to the mismatch between the direction of the pressure gradient () and fluid flow (). In accordance, our estimated flow profiles using theory with oscillating pressure gradient for microchannels [47] also predict a flow reversal occurring close to the channel walls (see SI Appendix, section 3), similar to others [48]. However, the flow reversal near walls should decelerate the flow as the bubble begins to collapse - opposite to what is observed in experiments (in Fig. 4A, m). This is a consequence of the instabilities causing flow distortion.
While the inflection in velocity profile near channel walls can lead to the onset of instabilities, the growth and therefore the time of emergence of instabilities is governed by the convective timescale. Fig 4D shows the dimensionless convective timescale from experiments, , for different ratios. Small characteristic timescales of the channels () compared to convective timescale () would correspond to large resistance to flow offered by the channel walls as . Large resistance () in other words would mean a viscosity-dominated flow that effectively would dampen any perturbations/instabilities. However, as increases the instability would develop during the deceleration phase and prevail in the acceleration phase [45]. This argument on instability evolution explains the observed orientation of flow distortion relative to in Fig 4A, when analyzed using the partition line depicted in Fig 4D. The partition line is adapted based on the experiments from this work which emphasizes the time of emergence of instabilities. As a data point approaches the partition line, the instabilities die out due to the motion-less state (zero velocities) at , while below the partition line the instabilities sustain and prevail due to larger kinetic energies ().
In summary, the observed deviations in the dynamic bubble size from a bell curve like profile can be attributed to the disruption of the momentum boundary layer near channel walls [35] that would alter the channel hydraulic resistance and hence the mean velocities. However, these distorted laminar states are transient and therefore revert (decay) to laminar flow over time [35, 43]. Consequently, there exists a momentary deviation in dynamic bubble size as seen from the representative images in Fig. 4A.
Discussion and Conclusions
By combining experiments and theory, we demonstrated universal behavior of fluid flows and transitions caused by transient laser-induced bubbles within microchannels of different geometries. This generalized approach to flow characteristics will aid the optimization of channel design and laser energy based on the application specific functionality. Contrary to the general assumption of undistorted laminar flow due to low Reynolds numbers () in bubble-powered micro-systems, we report flow instability. The instability originates due to the oscillating nature of the flow when the boundary layer separation occurs near channel walls during flow deceleration. During deceleration, the inflection point in the velocity profile near channel walls becomes unstable for larger flow oscillation frequencies (). Following the onset of instability, the time of emergence as distorted laminar states is discussed using the convective timescale associated with the flow. However, the distorted laminar states due to the growth of instability are transient and therefore decay rapidly compared to the overall flow oscillation time.
We note that this study may also be relevant to explain a new phenomenon in the field of vesicle/cell deformation due to flow instability, challenging prior understanding based on resonance [49] and undistorted laminar shear [46, 50]. While there are advancements in the field of laser-induced bubble pair interaction within two parallel confining surfaces (quasi-2D) [19, 51, 52], our understanding on bubble pair dynamics within a microchannel (quasi-1D) is limited [53]. Thus, this work will serve as a basis for future work on analyzing bubble-bubble interaction in a microchannel. Moreover, the one-dimensional nature of the flow within microchannels ensures invariant velocity profiles over the channel length, in theory ensuring a uniform effect for all particles present within it. On the contrary, for quasi-2D (Hele-Shaw type) flows [54], the velocity field decays as , where is the distance from the laser focal point (bubble center).
Our work employs a simplified Darcy-Brinkman equation [47] for pure fluids with transient flow equations assuming steady-state hydraulic resistance. Therefore, by additionally incorporating the Darcy number, effective viscosity and porosity [55], this work can conveniently be extended to study flows within porous ducts with application to heat transfer in refrigeration [56] and biology [57].
We thank Dr. Carlas S. Smith, Aswin Raghunathan and Shih-Te Hung for their support with the design of the experimental setup. Thanks to Ir. Suriya Prakash Senthil Kumar for support with the image processing. Thanks to Dr. Mathieu Pourquie for the productive discussions. This work was funded by LightX project under NWO Open Technology Programme (project number 16714).
Author contributions:
N.N. and H.B.E. designed and performed the experiments;
N.N., J.T.P. and R.H. analyzed the theoretical model;
N.N., J.T.P., R.H. and H.B.E. wrote the manuscript;
N.N., V.K. and D.I. developed the experimental setup;
N.N. and V.K. formulated the experimental methodology;
J.W. provided theoretical expertise.
The authors declare no conflict of interest.
References
- Lin [1998] L. Lin, Microscale Thermophysical Engineering 2, 71 (1998).
- Dincau et al. [2020] B. Dincau, E. Dressaire, and A. Sauret, Small 16, 1904032 (2020).
- Rehor et al. [2021] I. Rehor, C. Maslen, P. G. Moerman, B. G. van Ravensteijn, R. van Alst, J. Groenewold, H. B. Eral, and W. K. Kegel, Soft Robotics 8, 10 (2021), pMID: 32320334, https://doi.org/10.1089/soro.2019.0169 .
- Allen et al. [1985] R. Allen, J. Meyer, and W. Knight, Hewlett-packard journal (1985).
- Dijkink and Ohl [2008] R. Dijkink and C.-D. Ohl, Lab Chip 8, 1676 (2008).
- Wu et al. [2012] T.-H. Wu, Y. Chen, S.-Y. Park, J. Hong, T. Teslaa, J. F. Zhong, D. Di Carlo, M. A. Teitell, and P.-Y. Chiou, Lab Chip 12, 1378 (2012).
- Wang et al. [2018] Z. Wang, R. Chen, X. Zhu, Q. Liao, D. Ye, B. Zhang, X. He, and W. Li, AIP Advances 8, 015302 (2018).
- Womersley [1955] J. R. Womersley, Journal of Physiology 127, 553 (1955), https://physoc.onlinelibrary.wiley.com/doi/pdf/10.1113/jphysiol.1955.sp005276 .
- McWhirter et al. [2009] J. L. McWhirter, H. Noguchi, and G. Gompper, Proceedings of the National Academy of Sciences 106, 6039 (2009), https://www.pnas.org/doi/pdf/10.1073/pnas.0811484106 .
- Georgiev et al. [2020] R. N. Georgiev, S. O. Toscano, W. E. Uspal, B. Bet, S. Samin, R. van Roij, and H. B. Eral, Proceedings of the National Academy of Sciences 117, 21865 (2020), https://www.pnas.org/doi/pdf/10.1073/pnas.2005068117 .
- Noguchi and Gompper [2005] H. Noguchi and G. Gompper, Proceedings of the National Academy of Sciences 102, 14159 (2005), https://www.pnas.org/doi/pdf/10.1073/pnas.0504243102 .
- Barney et al. [2020] C. W. Barney, C. E. Dougan, K. R. McLeod, A. Kazemi-Moridani, Y. Zheng, Z. Ye, S. Tiwari, I. Sacligil, R. A. Riggleman, S. Cai, J.-H. Lee, S. R. Peyton, G. N. Tew, and A. J. Crosby, Proceedings of the National Academy of Sciences 117, 9157 (2020), https://www.pnas.org/doi/pdf/10.1073/pnas.1920168117 .
- Seemann et al. [2011] R. Seemann, M. Brinkmann, T. Pfohl, and S. Herminghaus, Reports on Progress in Physics 75, 016601 (2011).
- Quinto-Su et al. [2008] P. A. Quinto-Su, H.-H. Lai, H. H. Yoon, C. E. Sims, N. L. Allbritton, and V. Venugopalan, Lab Chip 8, 408 (2008).
- Kamis et al. [2021] Y. E. Kamis, H. B. Eral, and W.-P. Breugem, Phys. Rev. Fluids 6, 103903 (2021).
- Cu et al. [2020] K. Cu, R. Bansal, S. Mitragotri, and D. Fernandez Rivas, Annals of Biomedical Engineering 48, 2028 (2020).
- Berrospe-Rodriguez et al. [2016] C. Berrospe-Rodriguez, C. W. Visser, S. Schlautmann, R. Ramos-Garcia, and D. Fernandez Rivas, Biomicrofluidics 10, 014104 (2016), https://pubs.aip.org/aip/bmf/article-pdf/doi/10.1063/1.4940038/14593018/014104_1_online.pdf .
- Ye and Bull [2005] T. Ye and J. L. Bull, Journal of Biomechanical Engineering 126, 745 (2005).
- Ohl and Ohl [2016] S.-W. Ohl and C.-D. Ohl, Acoustic cavitation in a microchannel, in Handbook of Ultrasonics and Sonochemistry, edited by M. Ashokkumar (Springer Singapore, Singapore, 2016) pp. 1–37.
- Ory et al. [2000] E. Ory, H. Yuan, A. Prosperetti, S. Popinet, and S. Zaleski, Physics of Fluids 12, 1268 (2000).
- Sun et al. [2009] C. Sun, E. Can, R. Dijkink, D. Lohse, and A. Prosperetti, Journal of Fluid Mechanics 632, 5–16 (2009).
- Yuan et al. [1999] H. Yuan, H. Oguz, and A. Prosperetti, International Journal of Heat and Mass Transfer 42, 3643 (1999).
- Khoshmanesh et al. [2015] K. Khoshmanesh, A. Almansouri, H. Albloushi, P. Yi, R. Soffe, and K. Kalantar-zadeh, Scientific Reports 5, 9942 (2015).
- Zhang et al. [2011] K. Zhang, A. Jian, X. Zhang, Y. Wang, Z. Li, and H.-y. Tam, Lab Chip 11, 1389 (2011).
- Morris and Forster [2004] C. J. Morris and F. K. Forster, Experiments in Fluids 36, 928 (2004).
- Nagalingam et al. [2023a] N. Nagalingam, A. Raghunathan, V. Korede, C. Poelma, C. S. Smith, R. Hartkamp, J. T. Padding, and H. B. Eral, Phys. Rev. Lett. 131, 124001 (2023a).
- V. Korede and N. Nagalingam et al. [2023] V. Korede and N. Nagalingam, F. M. Penha, N. van der Linden, J. T. Padding, R. Hartkamp, and H. B. Eral, Crystal Growth & Design 23, 3873 (2023).
- Hua et al. [2019] T. Hua, O. Gowayed, D. Grey-Stewart, B. A. Garetz, and R. L. Hartman, Crystal Growth & Design 19, 3491 (2019).
- Yin and Prosperetti [2005] Z. Yin and A. Prosperetti, Journal of Micromechanics and Microengineering 15, 643 (2005).
- Torniainen et al. [2012] E. D. Torniainen, A. N. Govyadinov, D. P. Markel, and P. E. Kornilovitch, Physics of Fluids 24, 122003 (2012), https://doi.org/10.1063/1.4769755 .
- Li et al. [2020] H. Li, J. Huang, X. Wu, J. Zhang, J. Wang, Y. Wang, and C. Huang, AIP Advances 10, 035210 (2020), https://doi.org/10.1063/1.5142739 .
- Avila et al. [2023] M. Avila, D. Barkley, and B. Hof, Annual Review of Fluid Mechanics 55, 575 (2023), https://doi.org/10.1146/annurev-fluid-120720-025957 .
- Ohmi et al. [1982] M. Ohmi, M. Iguchi, K. Kakehashi, and T. Masuda, Bulletin of JSME 25, 365 (1982).
- Xu et al. [2020] D. Xu, A. Varshney, X. Ma, B. Song, M. Riedl, M. Avila, and B. Hof, Proceedings of the National Academy of Sciences 117, 11233 (2020), https://www.pnas.org/doi/pdf/10.1073/pnas.1913716117 .
- Majdalani et al. [2002] J. Majdalani, J. Barron, and W. K. Van Moorhem, Journal of Fluids Engineering 124, 678 (2002).
- Nagalingam et al. [2023b] N. Nagalingam, A. Raghunathan, V. Korede, E. F. Overmars, S.-T. Hung, R. Hartkamp, J. T. Padding, C. S. Smith, and H. B. Eral, HardwareX 14, e00415 (2023b).
- Bruus [2015] H. Bruus, in Microscale Acoustofluidics (The Royal Society of Chemistry, 2015) pp. 1–28.
- Akhatov et al. [2002] I. Akhatov, N. Vakhitova, A. Topolnikov, K. Zakirov, B. Wolfrum, T. Kurz, O. Lindau, R. Mettin, and W. Lauterborn, Experimental Thermal and Fluid Science 26, 731 (2002).
- Swinehart [1962] D. F. Swinehart, Journal of chemical education 39, 333 (1962).
- Sogandares and Fry [1997] F. M. Sogandares and E. S. Fry, Appl. Opt. 36, 8699 (1997).
- Thiéry and Mercury [2009] R. Thiéry and L. Mercury, Journal of Solution Chemistry 38, 893 (2009).
- Vogel et al. [1999] A. Vogel, K. Nahen, D. Theisen, R. Birngruber, R. J. Thomas, and B. A. Rockwell, Appl. Opt. 38, 3636 (1999).
- Hino et al. [1976] M. Hino, M. Sawamoto, and S. Takasu, Journal of Fluid Mechanics 75, 193–207 (1976).
- Shapiro et al. [2021] A. Shapiro, G. Grossman, and D. Greenblatt, Energies 14, 1410 (2021).
- Das and Arakeri [1998] D. Das and J. H. Arakeri, Journal of Fluid Mechanics 374, 251–283 (1998).
- Mohammadzadeh et al. [2017] M. Mohammadzadeh, F. Li, and C.-D. Ohl, Phys. Rev. Fluids 2, 014301 (2017).
- Wang [2016] C. Y. Wang, Transport in Porous Media 112, 409 (2016).
- Poelma et al. [2011] C. Poelma, J. M. Mari, N. Foin, M.-X. Tang, R. Krams, C. G. Caro, P. D. Weinberg, and J. Westerweel, Experiments in Fluids 50, 777 (2011).
- Tandiono et al. [2013] T. Tandiono, E. Klaseboer, S.-W. Ohl, D. Siak-Wei Ow, A. B.-H. Choo, F. Li, and C.-D. Ohl, Soft Matter 9, 8687 (2013).
- Marmottant and Hilgenfeldt [2003] P. Marmottant and S. Hilgenfeldt, Nature 423, 153 (2003).
- Yuan et al. [2015] F. Yuan, C. Yang, and P. Zhong, Proceedings of the National Academy of Sciences 112, E7039 (2015).
- Quinto-Su et al. [2010] P. A. Quinto-Su, X. H. Huang, S. R. Gonzalez-Avila, T. Wu, and C. D. Ohl, Phys. Rev. Lett. 104, 014501 (2010).
- Xiong et al. [2014] S. Xiong, L. K. Chin, T. Tandiono, A.-Q. Liu, and C.-D. Ohl, Israel Journal of Chemistry 54, 1602 (2014), https://onlinelibrary.wiley.com/doi/pdf/10.1002/ijch.201400101 .
- Quinto-Su et al. [2011] P. A. Quinto-Su, C. Kuss, P. R. Preiser, and C.-D. Ohl, Lab Chip 11, 672 (2011).
- Breugem [2007] W.-P. Breugem, Physics of Fluids 19, 103104 (2007), https://doi.org/10.1063/1.2792323 .
- Dai and Yang [2013] Q. Dai and L. Yang, Applied Thermal Engineering 54, 16 (2013).
- Khaled and Vafai [2003] A.-R. Khaled and K. Vafai, International Journal of Heat and Mass Transfer 46, 4989 (2003).