Personalizing Driver Safety Interfaces via Driver Cognitive Factors Inference
Abstract
Recent advances in AI and intelligent vehicle technology hold promise to revolutionize mobility and transportation, in the form of advanced driving assistance (ADAS) interfaces. Although it is widely recognized that certain cognitive factors, such as impulsivity and inhibitory control, are related to risky driving behavior, play a significant role in on-road risk-taking, existing systems fail to leverage such factors. Varying levels of these cognitive factors could influence the effectiveness and acceptance of driver safety interfaces.
We demonstrate an approach for personalizing driver interaction via driver safety interfaces that are triggered based on a learned recurrent neural network. The network is trained from a population of human drivers to infer impulsivity and inhibitory control from recent driving behavior. Using a high-fidelity vehicle motion simulator, we demonstrate the ability to deduce these factors from driver behavior. We then use these inferred factors to make instantaneous determinations on whether or not to engage a driver safety interface. This interface aims to decrease a driver’s speed during yellow lights and reduce their inclination to run through them.
Advancements in driver safety systems have the potential to save lives [1, 2]. However, the effectiveness of these systems varies considerably among different drivers. These safety systems could benefit from targeting of cause of individual driver’s dangerous driving behaviour, which is known to be affected by many different factors, including cognitive, social, and situational [3]. Among the cognitive factors that influence risky driving behavior are impulsivity, which is the tendency to act without thinking, and inhibitory control, which is the ability to suppress goal-irrelevant stimuli and behavioral responses [4]. Risky driving has been associated with higher self-reported impulsivity [5, 6, 7, 8, 9], and with poorer inhibitory control in relevant laboratory tasks [10, 11, 7, 8, 9]. These cognitive factors also influence individuals’ reactions to different types of interfaces [12, 13].
The significance of impulsivity and inhibitory control as a risk factors for vehicle accidents has led to the idea of new intervention strategies. Paaver et al. [14] showed that even a brief impulsivity intervention could help to prevent speeding. However, while there are numerous driver safety interfaces available, there is a gap in the research regarding the influence of impulsivity and inhibitory control on drivers’ responses to these interfaces. More specifically, studies have not adequately explored how to tailor the deployment of these safety interfaces to individual drivers, taking into account their unique levels of impulsivity and inhibitory control. This personalization is crucial, as it can determine the effectiveness of the interface in enhancing driver safety.
Thus, the efficacy of driver safety systems may vary in regards to individual differences in cognition. The design of human-machine interfaces, with a focus on incorporating specific cognitive characteristics, has the potential to enhance both their safety effectiveness and user acceptance [15]. Furthermore, the ability to estimate cognitive characteristics from observed driver behavior lays the groundwork for more personalized and effective safety interventions.
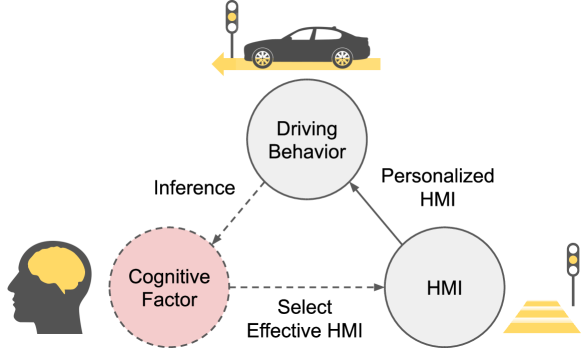
We hypothesize that it is possible to construct effective driver assistance systems by learning neural representations that capture the cognitive factors of individual drivers. Building such a system that is geared towards inferring cognitive factors would allow us to fully separate how we personalize the driver interface from what we can personalize about the interface. In this way, we can build assistance systems that are highly versatile - for instance, if a new interface is developed, these can be integrated without additional re-training of the representation. Such neural representations for cognitive factors will enable refinement of the estimated factors, as well as deployment of personalized safety intervention, at a large scale.
In this paper, we present experimental evidence of how factors such as impulsivity and inhibitory control can influence people’s responses to driver safety interfaces and how the inference of such cognitive measures enable an approach for personalizing safety interfaces. We do so by constructing a neural network model that embeds driver behavior into a latent space that captures these factors, and demonstrate that embedded representation’s utility for deciding on assistive driving interfaces deployment. The interfaces that we built are targeted towards inhibitory control and impulsivity. To our knowledge, we are the first to demonstrate driver assistance personalization in a high-fidelity simulator. In this paper we contribute 1) A neural network model that capable of embedding individual cognitive factor differences based on recent driving behavior. 2) A decision-making system capable of personalizing assistive driver interface choices based on the inferred cognitive factors. 3) Experimental evidence of how impulsivity and inhibitory control relate to performance under different driver assistance choices on a new dataset collected in a large-scale, high-fidelity, driving simulator. 4) Demonstration in that dataset of how the neural network model affords conditioning of driver behavior via a personalized interface choice.
Related Works
Our work is at the intersection of two active research areas: the role of cognitive factors in understanding driving behavior, and learning approaches for human-machine interaction.
Cognitive Factors and Driving Behaviors Common approaches for assessing driving behavior commonly involve self-report surveys [16], ticketed speeding violations[17], or crash records[18]. While these measurements can be good indicators of risky driving behavior, self-report metrics such as these are not always reliable [19], contain private information, and do not lend themselves to seamless integration into preventative use with drivers. Other studies have shown driving characteristics can be estimated by measuring reactions to predetermined unsafe events in a simulated driving task [10]. Our work uniquely examines a general approach to infer latent cognitive factors from behavior logs via a neural network encoder, and uses a high-fidelity driving motion simulator where behavior is closer to real vehicles than in lower-fidelity simulators (e.g., bench set up with a steering wheel) [20].
In addition to measuring driving behavior, researchers often measure impulsivity and other behavioral and cognitive factors via tests and questionnaires [21]. However, for these cognitive factors to effectively enhance vehicle safety systems, they should be estimated in a scalable way and applied to the development of personalized assistive interfaces within vehicles. Estimating these factors from driving behavior could lead more accurate information about drivers and further lead to effective intervention design and deployment criteria.
Learning Latent Factors for Human-Machine Interaction An intelligent vehicle being a robotic system, our approach relates to efforts in personalizing interactions between humans and robots or other machines. Prior work in machine learning for human-machine interfaces and human-robot teaming has focused on various human-robot interaction modalities such as driver monitoring, optimal shared control laws, and design of assistive robot behaviors (see e.g. [22, 23, 24, 25]). However, these approaches for human-robot interactions typically do not explicitly consider individual differences in cognitive factors and therefore fall under the category of a “one-size-fits-all” design.
The same is true for modern-day driver assistance systems such as lane-departure warnings or forward-collision warnings. Typical interventions issued by such systems depend on an individual’s state and action history and manifest as corrections of unsafe or suboptimal human actions generated from a policy learned from a desired set of behaviors required of the system [26]. Such approaches have been found to over-fit to the average-case behavior of individuals in a population, leading to incorrect inference of the human’s state and poor generalizability [27, 28]. Recent work has shown that learning latent representations summarizing human behavior can improve teaming and interaction with the human. For instance, work on dialog systems [29], recommender systems [30, 31], and intent recognition for products and motion [32, 33] have demonstrated that latent representations are capable of better predicting the user’s need for a given intervention and their reaction to that intervention. We posit that using this representation as a basis for deciding whether to interact and which modes of interaction to use should improve safety over “one-size-fits-all” decision schemes.
In this paper, we explore how to personalize human-machine interfaces based on people’s impulsivity and inhibitory control. We posit that latent factors such as impulsivity and inhibitory control can be inferred in an automated manner from driving behavior and can inform choices of interactions with the drivers to benefit them at a large scale.
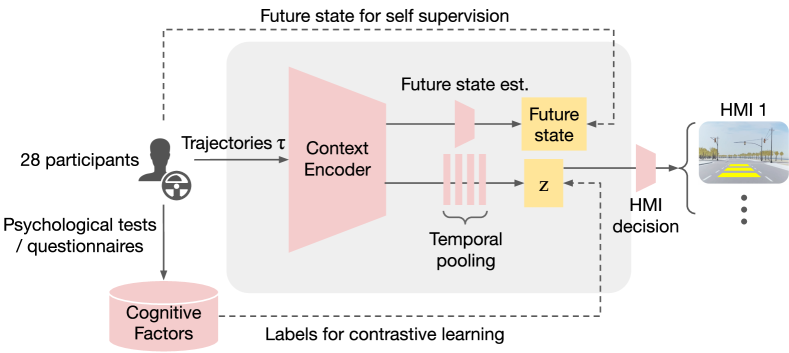
Contrastive Learning of Personal Traits
We now proceed to describe our approach for encoding latent cognitive factors. The resulting neural network distills a human driver’s recent driving history down to a low-dimensional parameter space whose structure can be easily shaped via multiple cognitive measures in a semi-supervised manner. The model we use includes a context encoder whose input is a time-receding, fixed-window trajectory of driving behavior in a scenario and whose output is a low-dimensional latent vector. This latent representation is then coupled with a separate decision-making module that takes in this latent vector and outputs a decision at each decision time-step; for instance, whether or not to present a particular HMI to the driver at the current time-step. The architecture is shown in Fig. 2, with further details in the supplemental information. As a result of experimentation, we found that a two-dimensional latent vector provided sufficient capacity to capture relevant cognitive factors, yet allow direct interpretation of the learned trends in the representation without possible distortions introduced by dimensionality reduction schemes (e.g. t-distributed Stochastic Neighbor Embedding [34]).
The context encoder is a neural network, , defining the probability of latent vector given a past trajectory of the driver. We represent as a long short-term memory (LSTM) network [35], taking in a trajectory history. The hidden layer is fed into two linear layers that output the mean and log-variance of the latent encoding [36].
As driving actions do not directly relate to psychological traits, we leverage contrastive learning [37, 38] to encourage the latent representation to conform to measured cognitive factors (we introduce the specific factors we use in the Results section). Because decisions should be based on more than one cognitive factor, we consider our cognitive factor target to be a vector.
The context encoding model transforms a driver’s past driving history to a latent vector , and uses a decoder network to predict the driver’s action at the current time-step. We set up the loss terms to encourage to capture both the individual’s cognitive factors and reconstruction of driver actions, with the factors allowing for the downstream decision-making module to have awareness of any time-independent factors inherent to the individual driver, and driver actions allowing for awareness of the behaviors in a given situation. Any scene context information present in will indirectly manifests in through . Thus, we expect a weak dependence of predicted driver action on scene context. The overall loss used to train the encoder consists of three components:
-
•
is the likelihood of action under the model (reconstruction loss) induced by the conditional distribution over , where characterizes driving behavior up to time and represents the parameters of the action decoder network.
-
•
, a contrastive loss supervised using a vector of cognitive factor targets [39]. For continuous-valued cognitive measures, this loss is
where represents a training samples batch, where each independently-sampled is a -dimensional latent vector induced by the LSTM context encoder with parameters , is a vector of batch-normalized cognitive measures associated with , is a measure associated with two vectors and (which we choose as their Euclidean distance, i.e. ), and controls the magnitude of dissimilarity of -values in -space, where a larger enforces higher separation of for fixed .
- •
These terms are combined into an overall training loss:
| (1) |
where , , and are the respective loss coefficients.
We evaluate the utility of the inferred latent factors model by marrying it with an decision rule for selecting the activation of the human-machine interface (HMI). The decisions are defined via a simple classifier whose inputs are the inferred latent factors. The classifier is set to optimize a criteria for HMI selection within the training data. We take the criteria for classification to be the difference in average speed when the yellow light is active, both with and without HMI (averaged across trajectories for a single subject). This criterion reflects the speed reduction induced in the subject when an HMI is provided to the driver. We use Support Vector Regression [42] with a polynomial kernel as our decision model.
Experiment
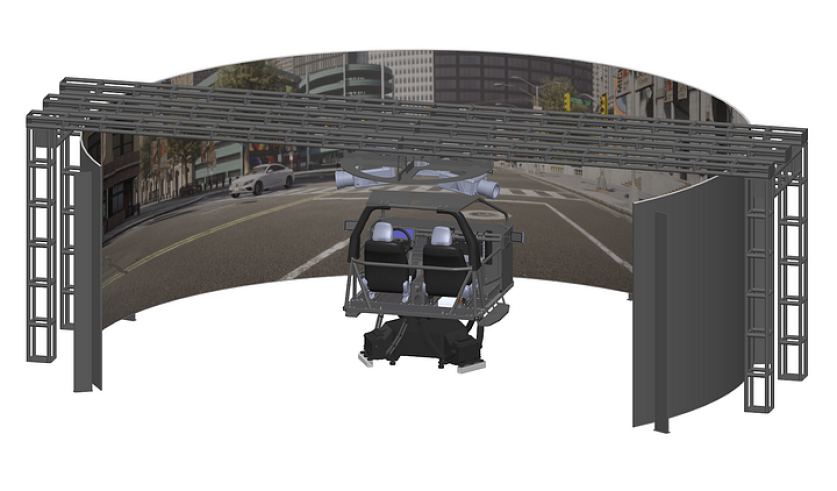
To test our approach, drivers were recruited and asked to execute multiple driving trials (laps) on a closed-loop road section in a high-fidelity full-scale vehicle motion simulator, described in details in [20]. An illustration of the driving motion simulator is shown in Fig. 4. Participants drove on a road with traffic lights that randomly changed from green to yellow at varying times of arrival of the vehicle at the traffic light, inducing a zone of dilemma [43]. We collected four driving trials (laps) where participants interacted with different prototype driver safety interfaces and one baseline driving trial, without the interfaces. Data from the baseline trials that was used for latent factor inference via a learned neural network model.
Driver Safety Interfaces
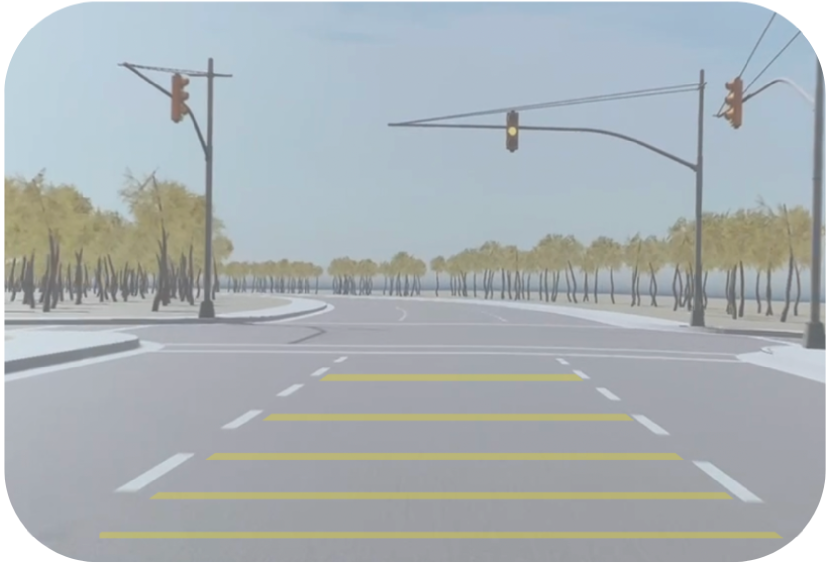
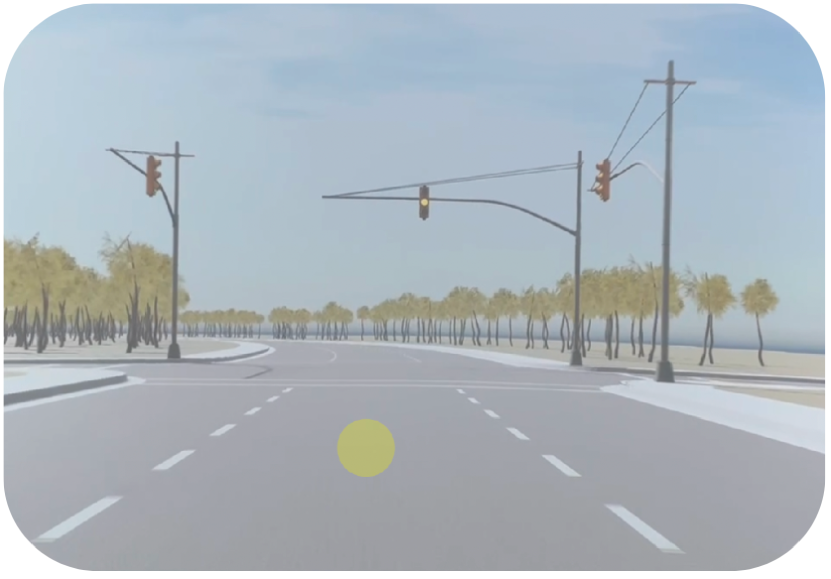
Two types of warning interfaces were used: a) transverse markings, projected on the road the car was driving; and b) a 2D yellow circle, projected as if it appeared in a heads-up display. Fig. 3 shows the virtual scenario and both interface types. For each interface, we also manipulated the trigger condition to display it. Each interface was either displayed when the vehicle approached the traffic light (185 meters away) or when the upcoming traffic light changed from green to yellow.
a
b
c
Participants
Thirty nine Northern California-based drivers 18 and older (Mean age = 49, Female = 16, Non_binary = 1) were recruited to participate in our study via Fieldwork, a global market research firm. Participants were excluded from participation if they had an inactive driver’s license, were pregnant or didn’t have proof of COVID-19 vaccination. (See details in the recruitment section in the supplemental information.) This research was reviewed, approved, and done according to the human-subject guidelines set by the Western Institutional Review Board-Copernicus Group (WCG) IRB. Participants filled out a consent form prior to participation and were compensated $150 for their two hour participation.
Half of the participants were between the ages of 18-22, the other half were over the age of 65. We recruited from these two populations since we believed they would lead to the most diverse sample of driving data [9, 44]. While age-related differences are not discussed in this paper, additional analyses can be found in the supplemental.
Of these 39 participants, 7 participants did not complete the driving trials due to motion sickness. Of the 32 remaining participants, the data of 5 participants was excluded from the analysis due to technical or operational issues.
Measures
-
•
Impulsivity:
To assess participants’ impulsivity [45], we used the BIS/BAS scale and the UPPS-P scale. The BIS/BAS was used to measure both the behavioral inhibition system (BIS) and the behavioral activation system (BAS), while the UPPS-P was used to account for the different facets of impulsivity.
- •
-
•
Self-reported Driving Behavior: To assess participants’ road errors and violations, we used the Manchester Driver Behavior Questionnaire (DBQ) [16].
-
•
Driving Behavior in the Motion Simulator: We also captured driving behavior as participants drove in the motion simulator. We recorded their driving speed, acceleration and response to yellow traffic lights.
We only consider this partial set of cognitive measures as the supervision signal to shape our model’s latent space, as a full set of measures will be impractical in the fleet-level case we envision.
Results
We analyzed the relationship between various aspects of impulsivity, inhibitory control, driving behavior, and responses to human-machine interfaces designed to encourage drivers to slow down. We then analyzed the performance of our model in inferring participants’ cognitive factors and in predicting if they should interact with our human-machine interfaces.
Relationship Between Cognitive Factors and Driving Behavior
To understand the relationship between the different cognitive factors and driving behavior when reacting to the yellow lights, we conducted a Bayesian correlation analysis using the JASP software [49]. For the analysis, we used the data of all driving laps – including the ones with HMIs presented. A table with all of the Bayesian correlations can be found in the Supplementary Information document. As shown in these tables, a number of significant correlations emerged.
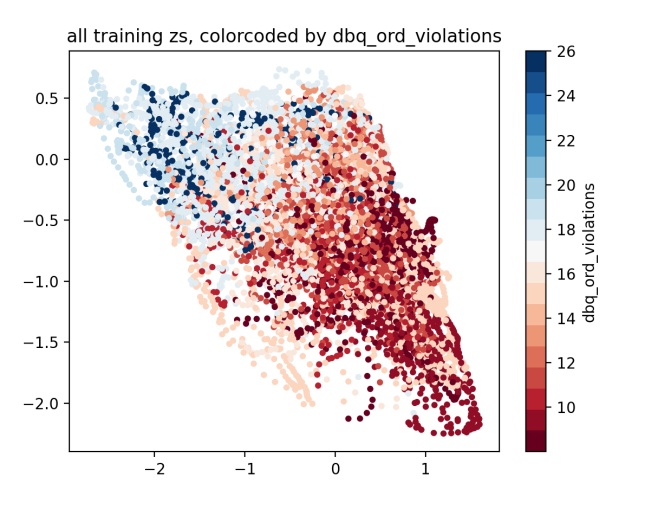
The self-reported ordinary violations measure on the DBQ was positively correlated with the mean speed at the yellow light (r=0.4, BF10=9693) and the maximum speed when the yellow was active light (r=0.54 BF10=), indicating that drivers who reported higher levels of ordinary violations were more likely to speed through yellow lights in this task.
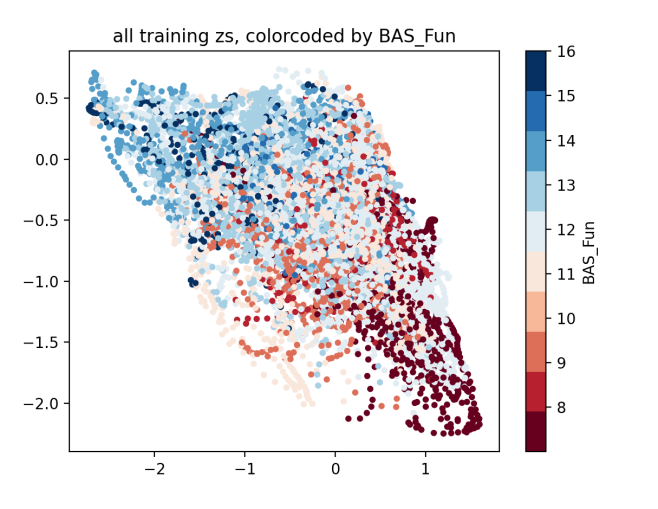
We found several correlations between the BIS/BAS measures and driving behavior. In particular, BAS Fun Seeking was positively correlated with the mean speed at the active yellow light (r=0.473, BF10=) and the maximum speed at the yellow light (r=0.31, BF10=99.19). This suggests that individuals who have a higher desire for new and exciting experiences may be more likely to take risks while driving, such as speeding through yellow lights. BAS Reward Responsiveness was also positively correlated with the maximum speed at an active yellow light (r=0.29, BF10=39.63).
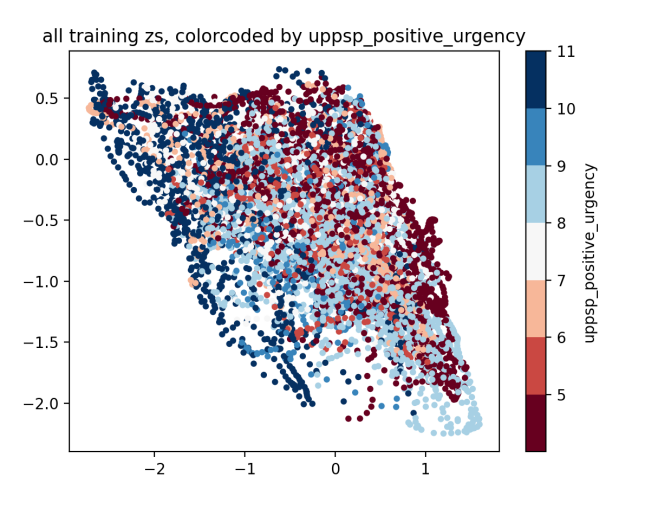
Similar to the BIS/BAS measures, various correlations emerged using the UPPS-P subscales. For instance, UPPS-P Positive Urgency was positively correlated with the maximum speed at an active yellow light (r=0.28, BF10=26.93), and UPPS-P Sensation Seeking was positively correlated with the mean speed at the active yellow light (r=0.29, BF10=42.89) and the maximum speed at the active yellow light (r=0.47, BF10=). These results are consistent with the results found for BAS Fun Seeking and BAS Reward Responsiveness, which provides further evidence that people who desire fun, new and thrilling experiences are more likely to speed and take risks when reacting to traffic lights.
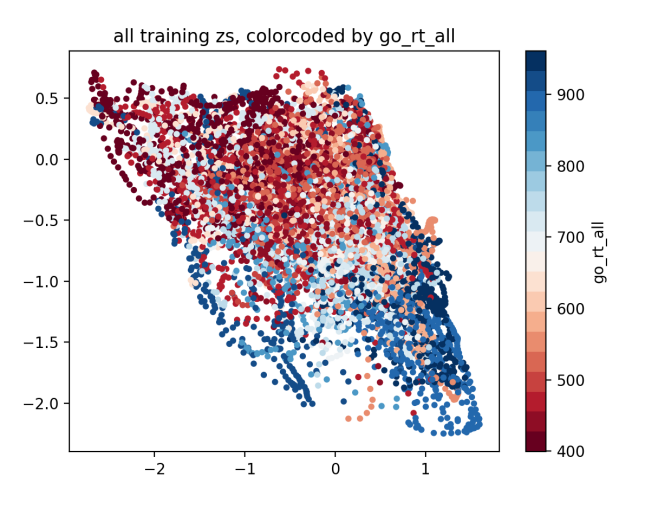
Multiple correlations also emerged using the measures from the Stop Signal task. For instance, the reaction time on go trials with a response (goRT_all) was negatively correlated with the mean speed at the yellow light (r=-0.38, BF10=2933). This suggests that drivers with longer reaction times may be more likely to slow down at yellow lights rather than speeding through them.
Finally, we also found numerous correlations using the Go/No-Go measures. Among the correlations, the average response time (gonogo_average_rt) was negatively correlated with the mean speed at the yellow light (r=-0.46, BF10=352747) and the maximum speed at the yellow light (r=-0.40, BF10=9205), which is consistent with the reaction time results from the Stop Signal task (e.g. goRT_all).

Impact of Cognitive Factors on People’s Responses to the Interfaces
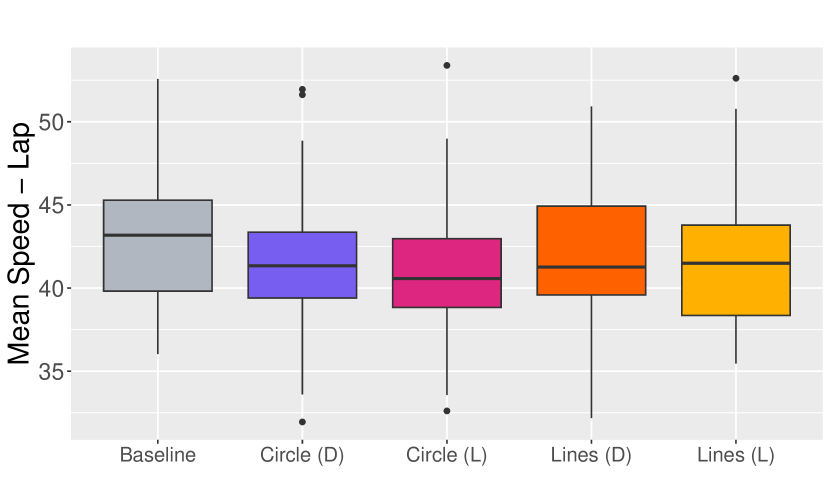
We fitted separate linear mixed models to predict each driving behavior measure based on interface condition (Table 1. All conditions demonstrated a statistically significant and negative effect on the mean speed during the lap, as depicted in Fig. 3(c).
To further understand how different factors affect drivers’ responses to HMI, we conducted a linear mixed models (LMM) analysis, using multiple LMMs to examine the effects of various factors, including the presence or absence of HMI (HMI_presence) and their potential interactions. Participant ID was used as a random effect to account for individual differences. The lmer function in the lme4 R package [50] was employed for predicting mean speed when yellow lights were active based on these variables as
where denotes the random intercept. The models were fitted using the Restricted Maximum Likelihood (REML) estimation method, and the t-tests utilized Satterthwaite’s approximation method.
For detailed statistical outcomes of all measures, please refer to Table 1. For a visual representation of some interaction effects, please see Fig. 5, which complements the textual analysis. Here, we highlight some key findings that were noted to have a strong effect:
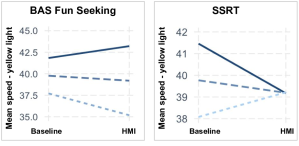
BIS/BAS: The BAS Fun Seeking scale showed a significant main effect of HMI presence (), indicating that individuals with higher scores were likely to drive faster at yellow lights when HMI was present. Additionally, a significant interaction between HMI presence and BAS Fun Seeking was observed ().
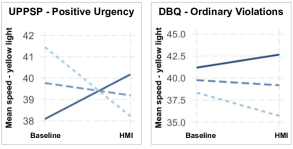
UPPS-P: The Positive Urgency subscale revealed a significant main effect of HMI presence (), along with an important interaction with HMI presence (), suggesting that those with higher levels of positive urgency increased their speed at yellow lights in the HMI presence condition.
Go/No-Go Measures: The analysis revealed a significant main effect of average response time (gonogo_average_rt) on mean speed, with a negative influence (). No significant interaction effects were observed in these measures.
Stop Signal Measures: Significant main effects were observed for goRT_all () and usRT (), along with a notable interaction between HMI presence and Stop Signal Reaction Time (SSRT) (). This suggests that individuals with higher SSRTs tended to drive slower after the yellow-light transition after they are exposed to the HMI.
Manchester DBQ: For the Ordinary Violations subscale, a significant main effect of HMI presence () and a significant interaction with HMI presence were found (). This indicates that those reporting higher ordinary driving violations were likely to drive faster after the yellow-light transition when exposed to the HMI.
| Measure | SE | t | p | |
| Main Effects | ||||
| BIS/BAS BAS_reward | -0.03 | 14.39 | -3.15 | 0.002 |
| BIS/BAS BAS_Fun | -11.14 | 4.64 | -2.4 | 0.01 |
| UPPS-P Positive Urgency | -8.71 | 2.65 | -3.28 | 0.001 |
| UPPS-P Sensation Seeking | -7.6 | 3.06 | -2.48 | 0.01 |
| Go/No-Go Measures gonogo_average_rt | -0.07 | 0.027 | -2.56 | 0.01 |
| Stop Signal Measures goRT_all | -0.02 | 0.008 | -2.68 | 0.01 |
| Stop Signal Measures usRT | -0.02 | 0.01 | -2.36 | 0.02 |
| Manchester DBQ Ordinary Violations | -6.99 | 2.75 | -2.53 | 0.01 |
| Manchester DBQ Errors | -12.71 | 6.03 | -2.1 | 0.03 |
| Interaction Effects | ||||
| BIS/BAS BAS_reward * HMI_presence | 1.48 | 0.47 | 3.095 | 0.002 |
| BIS/BAS BAS_Fun * HMI_presence | 0.9 | 0.39 | 2.31 | 0.02 |
| UPPS-P Positive Urgency * HMI_presence | 1.23 | 0.38 | 3.22 | 0.002 |
| UPPS-P Sensation Seeking * HMI_presence | 0.64 | 0.26 | 2.38 | 0.01 |
| Stop Signal Measures SSRT * HMI_presence | -0.01 | 0.007 | -2.00 | 0.04 |
| Manchester DBQ Ordinary Violations * HMI_presence | 0.47 | 0.19 | 2.44 | 0.01 |
| Manchester DBQ Errors * HMI_presence | 0.95 | 0.46 | 2.03 | 0.04 |
Inferring Inhibitory Control and HMI Choice from Driving Behavior
Given the various measures collected in the study, we used stepwise regression to select the most important features for training our model. We combined forward selection, starting with an empty model and adding the predictor that produced the largest increase in model fit, with backward elimination, removing the predictor that produced the smallest decrease in model fit until no further improvement was observed. By following this process, the stepwise regression yielded a set of four cognitive factors to be used in the model: UPPS-P - Positive Urgency, BAS Fun Seeking, goRT_all, and DBQ - Ordinary violations.
We adopt the learning approach described to infer cognitive factors based on the subjects’ driving during the experiment. To evaluate the model on the available data, we use leave-one-out cross-validation over the 27 subjects, averaging model performance over 10 random seeds, and capture properties of the embedding and the resulting training decision criteria performance. We include a complete description of the training and evaluation steps and further findings in the supplemental information. The distribution of the inferred latent factors is shown in Fig. 6a. Qualitatively, we observe that fairly strong clustering has emerged for each of the cognitive factors which indicates the effectiveness of the the contrastive learning approach is effective. To quantify this further, we show in Table 2 the fit between the distribution of the selected cognitive and the inferred latent factors. Since there is no direct or linear mapping assumed in contrastive learning, we probed the uniformity of the inferred embedding. We used the KL distance between the cognitive measures and the inferred factors’ distribution. The results demonstrate the model’s ability to infer several variables interest centered around impulsivity and inhibitory control.
| goRT all |
|
|
BAS Fun | ||||
|---|---|---|---|---|---|---|---|
| 0.322 | 0.299 | 0.288 | 0.526 |
| Decision Rule |
|
Cohen’s Kappa Score | Balanced Accuracy | |||
|---|---|---|---|---|---|---|
| Standard | ||||||
| Error | ||||||
| No-HMI | 17.36 | 1.12 | 0.0 | 0.50 | ||
| Always-HMI | 15.48 | 1.10 | 0.0 | 0.50 | ||
| Random | 15.69 | 1.14 | 0.001 | 0.50 | ||
| Window-Averaged (Ours) | 15.10 | 1.09 | 0.145 | 0.56 | ||
| Instantaneous (Ours) | 15.50 | 1.10 | 0.024 | 0.51 | ||
We next proceed to probe the efficacy of the resulting latent space to inform HMI adaptation to the subjects. We again used leave-one-out in the same manner to estimate the model’s inference on the population, for both latent factor estimation and the resulting decision classifier based on the latent factors. In order to evaluate the interface selection decisions by the decision classifier we compared them to fixed interface choice chosen optimally for all participants (one-size-fits-all approach). We then measured the participants’ behavior in terms of our chosen behavior statistic (mean average speed when yellow light was active) for the selected HMI choice (the classifier’s decision) for the withheld subject averaged over the trials in which the experimental condition matched the decision classifiers output (thereby treating the experiment as a within-subject randomized trial study).
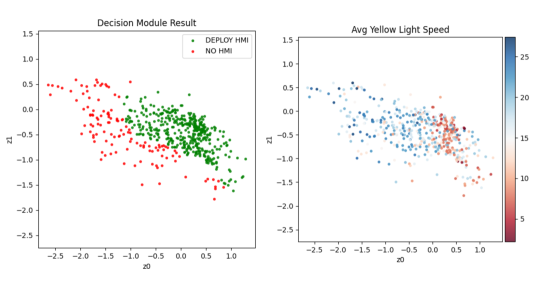
When leveraging the latent factors to decide on an HMI choice, we achieve a balanced accuracy of of 56% and a Cohen Kappa of 0.145 in selecting the optimal HMI for the specific driver, as shown in Table 3, resulting in a reduction of 0.59 m/s in the mean speed over the duration of the yellow-phase of the traffic light. Additionally, in Fig. 7 (left), we code each of the latents generated from the trajectory snippets according to the decision module’s predictions. In conjunction with Fig. 7 (right), the trajectory snippets for which deployment of the HMI was the decision, we see that the average speed after the yellow light transitions is lower, showing the effectiveness of the HMI decision scheme.
Discussion
As traffic accidents and violations frequently occur due to poor impulsivity and inhibitory control, it is important to create driver safety systems that can overcome these cognitive limitations on a personalized level. In this work, we present an approach to infer the individual’s latent factor, the use it to decide when it is or is not appropriate to show a driver safety interface depending on someone’s inferred impulsivity and inhibitory control.
To create this approach, we conducted a driving study using a high-fidelity motion simulator to understand how cognitive factors affect people’s responses to driver safety interfaces. Our study revealed that the prototype interfaces had differing effects on drivers based on their impulsivity levels. In particular, we observed that drivers with lower levels of impulsivity tended to slow down when exposed to the interfaces, while drivers with higher levels of impulsivity exhibited the opposite response. Indeed, previous research has shown that impulsive drivers are more likely to run yellow lights [51], although yellow lights were designed to warn drivers that they may need to slow down. Our study is the first to show that vehicle safety interfaces may also lead to unintended driving behavior responses for some drivers based on their impulsivity.
Leveraging the data collected in the study, we trained a recurrent neural network that can infer cognitive traits and, based on these, decide whether or not to employ a driver safety interface. The results show that our decision-making scheme can infer latent factors that are compact, correlate with cognitive measures associated with impulsivity, and can be used effectively to select driver interfaces to improve driver behavior, resulting in lower speed at the zone of dilemma of yellow lights. Although previous work has shown the relationship between cognitive factors such as impulsivity and driving behavior, this is the first time a model is proposed and examined so as to make driver safety recommendations based on cognitive factor inferences conditioned on the driver’s behavior.
The suggested approach lends itself to fleet-scale, online, in-vehicle optimization of the interaction with the driver across the population. If deployed in such a manner, overall improvements in driver safety interfaces and safer roads could result.
Author contributions
ES, JD, JC, DG, EK, SH, AM, AB, DB, HY, KS, TC, AB, and GR designed the research. ES, JD, JC, EG, EK, AM, AB, HN, DB, and HY performed the research. JD, DG, HN, BH , AP, and DB designed analytic tools. JD, DG, JC, and EK analyzed the data. ES, JD, JC, DG, EK, AM, HY, TC and GR wrote the paper. All authors reviewed the manuscript
Additional information
All authors work for and receive compensation from Toyota Research Institute.
Data availability
Data and material will be made available upon request.
References
- [1] Singh, S. Critical reasons for crashes investigated in the national motor vehicle crash causation survey. Tech. Rep. DOT HS 812 115 (2015).
- [2] Bareiss, M., Scanlon, J., Sherony, R. & Gabler, H. C. Crash and injury prevention estimates for intersection driver assistance systems in left turn across path/opposite direction crashes in the united states. \JournalTitleTraffic Inj. Prev. 20, S133–S138 (2019).
- [3] Department of Transportation, U. S. NHTSA releases 2019 crash fatality data (2019).
- [4] Munakata, Y. et al. A unified framework for inhibitory control. \JournalTitleTrends Cogn. Sci. 15, 453–459 (2011).
- [5] Constantinou, E., Panayiotou, G., Konstantinou, N., Loutsiou-Ladd, A. & Kapardis, A. Risky and aggressive driving in young adults: Personality matters. \JournalTitleAccid. Anal. Prev. 43, 1323–1331 (2011).
- [6] Dahlen, E. R., Martin, R. C., Ragan, K. & Kuhlman, M. M. Driving anger, sensation seeking, impulsiveness, and boredom proneness in the prediction of unsafe driving. \JournalTitleAccid. Anal. Prev. 37, 341–348 (2005).
- [7] Walshe, E. A., Ward McIntosh, C., Romer, D. & Winston, F. K. Executive function capacities, negative driving behavior and crashes in young drivers. \JournalTitleInt. J. Environ. Res. Public Health 14 (2017).
- [8] Hayashi, Y., Foreman, A. M., Friedel, J. E. & Wirth, O. Executive function and dangerous driving behaviors in young drivers. \JournalTitleTransp. Res. Part F Traffic Psychol. Behav. 52, 51–61 (2018).
- [9] National Research Council et al. Preventing Teen Motor Crashes: Contributions from the Behavioral and Social Sciences: Workshop Report (National Academies Press, 2007).
- [10] Hatfield, J., Williamson, A., Kehoe, E. J. & Prabhakharan, P. An examination of the relationship between measures of impulsivity and risky simulated driving amongst young drivers. \JournalTitleAccid. Anal. Prev. 103, 37–43 (2017).
- [11] Jongen, E. M. M., Brijs, K., Komlos, M., Brijs, T. & Wets, G. Inhibitory control and reward predict risky driving in young novice drivers – a simulator study. \JournalTitleProcedia Soc. Behav. Sci. 20, 604–612 (2011).
- [12] McDonald, A., Carney, C. & McGehee, D. V. Vehicle owners’ experiences with and reactions to advanced driver assistance systems (2018).
- [13] Montgomery, J., Kusano, K. D. & Gabler, H. C. Age and gender differences in time to collision at braking from the 100-car naturalistic driving study. \JournalTitleTraffic Inj. Prev. 15 Suppl 1, S15–20 (2014).
- [14] Paaver, M. et al. Preventing risky driving: A novel and efficient brief intervention focusing on acknowledgement of personal risk factors. \JournalTitleAccident Analysis & Prevention 50, 430–437 (2013).
- [15] Horberry, T., Regan, M. A. & Stevens, A. Driver acceptance of new technology: Theory, Measurement and Optimisation (Crc Press, 2018).
- [16] af Wåhlberg, A., Dorn, L. & Kline, T. The manchester driver behaviour questionnaire as a predictor of road traffic accidents. \JournalTitleTheoretical Issues in Ergonomics Science 12, 66–86 (2011).
- [17] O’Brien, F. & Gormley, M. The contribution of inhibitory deficits to dangerous driving among young people. \JournalTitleAccid. Anal. Prev. 51, 238–242 (2013).
- [18] Chang, Z., Lichtenstein, P., D’Onofrio, B. M., Sjölander, A. & Larsson, H. Serious transport accidents in adults with attention-deficit/hyperactivity disorder and the effect of medication: a population-based study. \JournalTitleJAMA Psychiatry 71, 319–325 (2014).
- [19] Gemming, L., Jiang, Y., Swinburn, B., Utter, J. & Mhurchu, C. N. Under-reporting remains a key limitation of self-reported dietary intake: an analysis of the 2008/09 New Zealand adult nutrition survey. \JournalTitleEur. J. Clin. Nutr. 68, 259–264 (2014).
- [20] Schrum, M. L., Sumner, E., Gombolay, M. C. & Best, A. MAVERIC: A data-driven approach to personalized autonomous driving. \JournalTitlearXiv preprint arXiv:2301.08595 (2023).
- [21] Diamond, A. Executive functions. \JournalTitleAnnu. Rev. Psychol. 64, 135–168 (2013).
- [22] Kaplan, S., Guvensan, M. A., Yavuz, A. G. & Karalurt, Y. Driver behavior analysis for safe driving: A survey. \JournalTitleIEEE Trans. Intell. Transp. Syst. 16, 3017–3032 (2015).
- [23] Schaff, C. & Walter, M. R. Residual policy learning for shared autonomy. In Robotics Science and Systems (2020). 2004.05097.
- [24] Losey, D. P. et al. Learning latent actions to control assistive robots. \JournalTitleAuton. Robots 46, 115–147 (2022).
- [25] Backman, K., Kulić, D. & Chung, H. Reinforcement learning for shared autonomy drone landings (2022). ArXiv:2202.02927, 2202.02927.
- [26] Nidamanuri, J., Nibhanupudi, C., Assfalg, R. & Venkataraman, H. A progressive review: Emerging technologies for ADAS driven solutions. \JournalTitleIEEE Transactions on Intelligent Vehicles 7, 326–341 (2022).
- [27] Xie, A., Losey, D. P., Tolsma, R., Finn, C. & Sadigh, D. Learning latent representations to influence multi-agent interaction. In Conf. on Robot Learning (2020). 2011.06619.
- [28] Tsividis, P. A. et al. Human-Level reinforcement learning through Theory-Based modeling, exploration, and planning. arXiv (2021). 2107.12544.
- [29] Yang, R., Chen, J. & Narasimhan, K. Improving dialog systems for negotiation with personality modeling. In Proceedings of the 59th Annual Meeting of the Association for Computational Linguistics and the 11th International Joint Conference on Natural Language Processing (Volume 1: Long Papers), 681–693 (Association for Computational Linguistics, Online, 2021).
- [30] Song, K. et al. Recommendation vs sentiment analysis: A text-driven latent factor model for rating prediction with cold-start awareness. In Int. Joint Conf. on Artificial Intelligence, Research Collection School Of Computing and Information Systems, 2744 (AAAI Press, 2017).
- [31] Yu, Z., Lian, J., Mahmoody, A., Liu, G. & Xie, X. Adaptive user modeling with long and short-term preferences for personalized recommendation. In Int. Joint Conf. on Artificial Intelligence (California, 2019).
- [32] Tanjim, M. M. et al. Attentive sequential models of latent intent for next item recommendation. In Proceedings of The Web Conference 2020, WWW ’20, 2528–2534 (Association for Computing Machinery, New York, NY, USA, 2020).
- [33] Rudenko, A. et al. Human motion trajectory prediction: A survey. \JournalTitleIJRR (2019).
- [34] Van der Maaten, L. & Hinton, G. Visualizing data using t-sne. \JournalTitleJournal of machine learning research 9 (2008).
- [35] Hochreiter, S. & Schmidhuber, J. Long short-term memory. \JournalTitleNeural Comput. 9, 1735–1780 (1997).
- [36] Kingma, D. P. & Welling, M. Auto-encoding variational bayes. \JournalTitlearXiv preprint arXiv:1312.6114 (2013).
- [37] Gutmann, M. & Hyvarinen, A. Noise-contrastive estimation: A new estimation principle for unnormalized statistical models. In AISTATS, 297–304.
- [38] Khosla, P. et al. Supervised contrastive learning. \JournalTitleAdv. Neural Inf. Process. Syst. 33, 18661–18673 (2020).
- [39] Rai, N., Adeli, E., Lee, K.-H., Gaidon, A. & Niebles, J. C. Cocon: Cooperative-contrastive learning. In Proceedings of the IEEE/CVF Conference on Computer Vision and Pattern Recognition, 3384–3393 (2021).
- [40] Kingma, D. P. & Welling, M. Auto-Encoding variational bayes. In Int. Conf. on Learning Representations (2014).
- [41] Rezende, D. J., Mohamed, S. & Wierstra, D. Stochastic backpropagation and approximate inference in deep generative models. In Int. Conf. on Machine Learning (2014).
- [42] Chang, C.-C. & Lin, C.-J. LIBSVM: A library for support vector machines. \JournalTitleACM Trans. Intell. Syst. Technol. 2, 1–27 (2011).
- [43] Zhang, Y., Fu, C. & Hu, L. Yellow light dilemma zone researches: a review. \JournalTitleJournal of Traffic and Transportation Engineering (English Edition) 1, 338–352 (2014).
- [44] Jonah, B. A. Age differences in risky driving. \JournalTitleHealth Education Research 5, 139–149 (1990).
- [45] Carver, C. S. & White, T. L. Behavioral inhibition, behavioral activation, and affective responses to impending reward and punishment: the bis/bas scales. \JournalTitleJournal of Personality and Social Psychology 67, 319 (1994).
- [46] Gomez, P., Ratcliff, R. & Perea, M. A model of the go/no-go task. \JournalTitleJournal of Experimental Psychology: General 136, 389 (2007).
- [47] Lappin, J. S. & Eriksen, C. W. Use of a delayed signal to stop a visual reaction-time response. \JournalTitleJournal of Experimental Psychology 72, 805 (1966).
- [48] Verbruggen, F. et al. A consensus guide to capturing the ability to inhibit actions and impulsive behaviors in the stop-signal task. \JournalTitleeLife 8, e46323 (2019).
- [49] JASP Team. JASP (Version 0.18.2)[Computer software] (2024).
- [50] Bates, D., Mächler, M., Bolker, B. & Walker, S. Fitting linear mixed-effects models using lme4. \JournalTitleJournal of Statistical Software 67, 1–48, DOI: 10.18637/jss.v067.i01 (2015).
- [51] Chein, J., Albert, D., O’Brien, L., Uckert, K. & Steinberg, L. Peers increase adolescent risk taking by enhancing activity in the brain’s reward circuitry. \JournalTitleDev. Sci. 14, F1–10 (2011).