Optical Shubnikov – de Haas oscillations in 2D electron systems
Abstract
We report on dynamic Shubnikov – de Haas (SdH) oscillations that are measured in the optical response, sub – terahertz transmittance of two-dimensional systems, and reveal two distinct types of oscillation nodes: “universal” nodes at integer ratios of radiation and cyclotron frequencies and “tunable” nodes at positions sensitive to all parameters of the structure. The nodes in both real and imaginary parts of the measured complex transmittance are analyzed using a dynamic version of the static Lifshitz-Kosevich formula. These results demonstrate that the node structure of the dynamic SdH oscillations provides an all-optical access to quantization- and interaction-induced renormalization effects, in addition to parameters one can obtain from the static SdH oscillations.
Shubnikov – de Haas (SdH) oscillations are among the most well-known basic phenomena reflecting the quantum-mechanical nature of electrons, in particular in two-dimensional electron systems (2DES), where they are a precursor of the quantum Hall effect [1]. Although the SdH oscillations are thoroughly studied in the static transport response, their observation in optics is limited to several fragmentary measurements [2, 3, 4, 5]. Because of experimental difficulties, there is no systematic and consistent analysis of such optical Shubnikov – de Haas oscillations in 2DES so far. Whereas, the optical response represents a powerful and non-invasive spectroscopic tool to test the disorder and electron-electron correlations in all sorts of two-dimensional materials.
Static and dynamic transport properties are both governed by the frequency-dependent complex conductivity . Even in the case of complex optical transmission of the film on a substrate the relation between the measured signal and the conductivity can be written in a simple form, see Eq. (1) below. One may thus expect that the quantum corrections to the conductivity would lead to experimental dependences, which are similar in statics and dynamics. However, already after first treatments of the optical SdH oscillations [6, 2] it has been noticed that they have a node near the cyclotron resonance (CR) and reverse their phase around it. Later studies [7, 3, 8] have confirmed that the quantum correction to the dynamic conductivity indeed should have an additional modulation governed by the ratio of radiation and cyclotron frequencies. However, direct evidence for such modulation remained elusive.
Here we report on the observation of the optical SdH oscillations in the transmittance of 2DES. Two types of nodes can be unraveled there, “universal” and “tunable” nodes. We analyse the node structure of oscillations and find that it can be well reproduced using the dynamic version of the Lifshitz-Kosevich formula obtained within the self-consistent Born approximation following Refs. [6, 7, 8].
The standard expression for the transmittance of the circularly polarized light through a dielectric slab containing an isotropic 2DES can be written as [2, 9]
| (1) |
Here is the dynamic conductivity of 2DES. It is given by the standard Drude expression, , in the classical region of perpendicular magnetic field where the Landau quantization is negligible. Plus and minus signs correspond to the right- and left-handed circular polarization, respectively, is the dc conductivity at , is the CR magnetic field defining the CR effective mass of the charge carriers, is the mobility, is the 2DES density, and is the impedance of vacuum. Two complex parameters , describe the Fabry-Pérot interference in the substrate and are controlled by the product of the sample thickness and the wave number , where is the dielectric constant of the substrate.
Beyond the Drude model, Landau quantization results in the SdH oscillations of the dc resistance, described by the static Lifshitz-Kosevich formula [10, 1, 11],
| (2) |
where . These -oscillations are the result of modulation of the density of states, and their period is controlled by the carrier density . At zero temperature, , the decay of SdH oscillations at low is described by the Dingle factor , where the quantum relaxation time characterises the disorder broadening of Landau levels separated by . The factor containing accounts for the additional -smearing. In the regime of weak oscillations, where Eq. (2) is valid, transport SdH oscillations provide a powerful and reliable tool to determine such properties of 2DES as the density , single-particle lifetime , and effective mass of charge carriers (entering ). In what follows, we present transmission experiments and test the less established, dynamic version of the Lifshitz-Kosevich formula, Eq. (3), in particular, its nodal structure governed by the ratio .
Samples and methods. 2DES with parabolic dispersion was studied in selectively doped 12-nm GaAs quantum well with AlAs/GaAs superlattice barriers grown by molecular beam epitaxy [12, 13, 14, 15]. The van-der-Pauw sample size was 1010 mm, ohmic contacts were placed at the corners. After exposure to the room light the electron density and mobility were cm-2 (only one size-quantized level is occupied) and cm2/Vs, respectively.
2DES with linear dispersion was studied in 6.5-nm HgTe quantum well grown by molecular beam epitaxy [16]. The van-der-Pauw sample size was 55 mm. A semitransparent Ti/Au gate has been deposited on the 400-nm SiO2/Si3N4 insulator. The electron density and mobility at V were equal to cm-2 and cm2/Vs. The Drude optical response of this device was previously studied in Ref. [17].
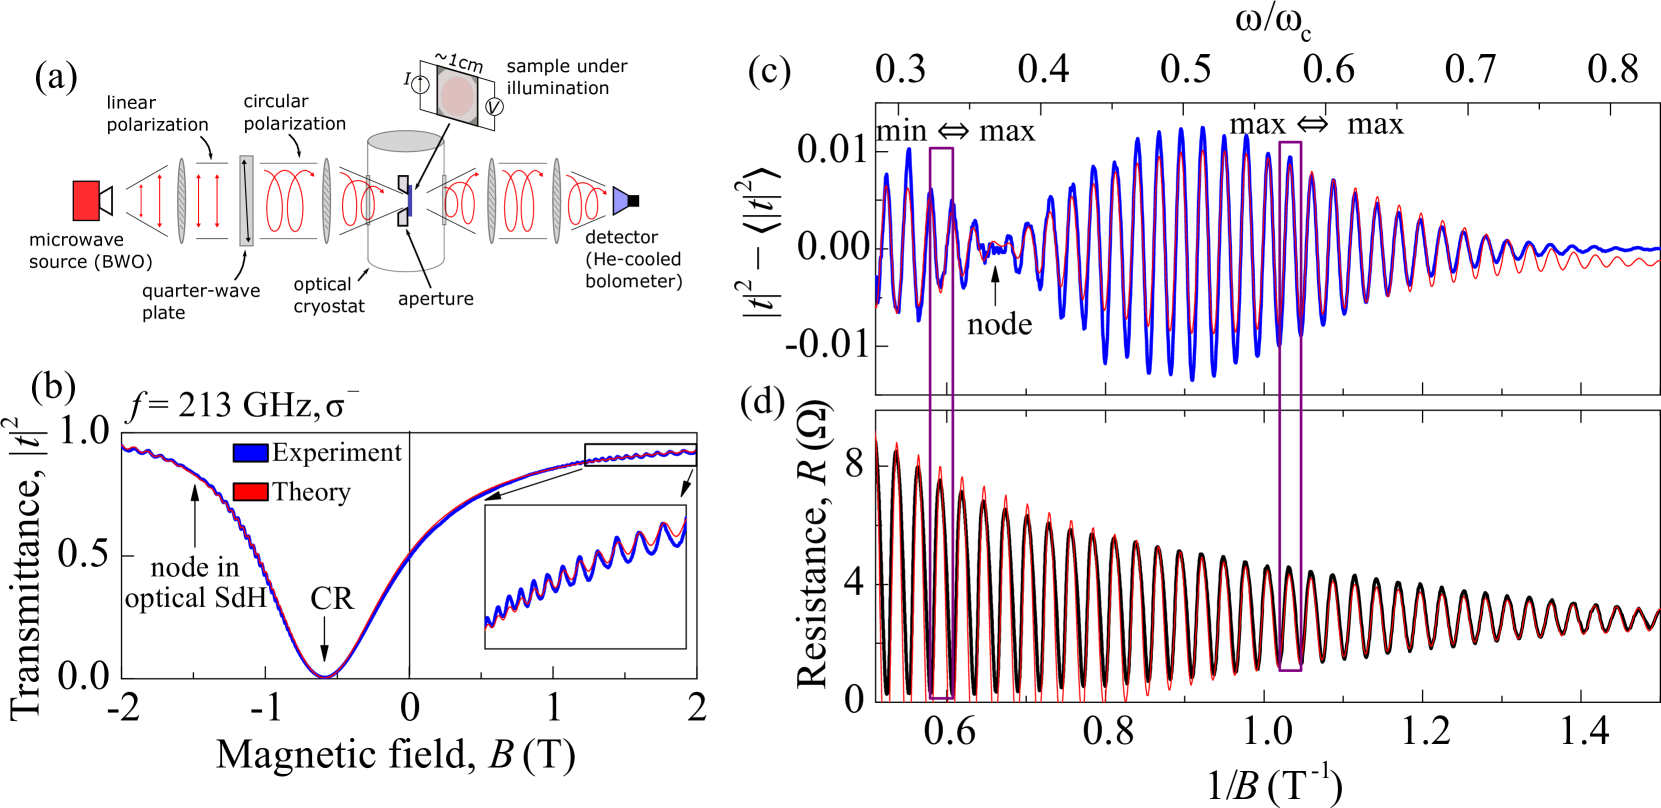
The schemes of our measurements is illustrated in Fig. 1 (a) (power transmission, circular polarization) and in Fig. 4 (a) (phase-sensitive Mach-Zehnder interferometry, complex transmission amplitude, linear polarization). The samples were irradiated from the substrate side through an 8 mm (GaAs device) or 4 mm (HgTe device) apertures. Backward-wave oscillators were used as sources of the normally incident continuous monochromatic radiation. The transmittance through the sample was measured using a He-cooled bolometer. The device resistance (GaAs device) and capacitance (HgTe device) was measured in situ using a standard lock-in technique. All presented results were obtained at temperature K.
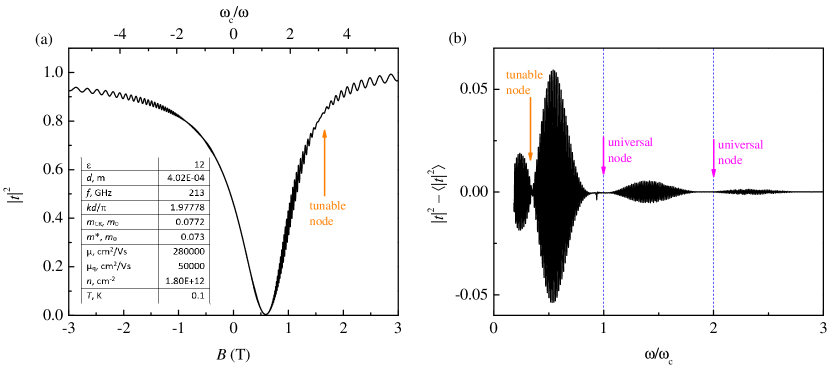
Results and analysis. Figure 1 (b) shows the magnetic field dependence of the transmittance measured at GHz. Here we studied a GaAs quantum well of high density, cm-2 (only one size-quantized subband is occupied), and used the left-handed circular polarization, so that only one CR at T corresponding to the CR mass is seen, with being the free electron mass. The value of is higher than the conduction band effective mass in bulk GaAs, 0.067 . This deviation can be attributed to the nonparabolicity of the band dispersion [18, 19] and to the wave-function penetration into the AlGaAs alloy outside the quantum well; and it is typical for the high-density 2DES in narrow quantum wells. Apart from the deep CR minimum, the transmittance oscillations are formed at high positive and negative magnetic fields. The oscillations are better seen in Fig. 1 (c), where the smooth part of is subtracted, and the data are replotted against . Figure 1 (d) shows transport SdH oscillations, measured in situ. It is seen that the transmittance and transport oscillations have the same period, which confirms their direct correspondence.
As demonstrated in Figs. 1 (c,d), optical and transport SdH oscillations reveal substantial differences as well. The dynamic oscillations have nodes. Here, in Fig. 1 (c), there is one node at T. Across the node, that does not appear in the transport response, the phase of the optical SdH oscillations is flipped, and becomes opposite to that of SdH in at above the node. Note that the shape of the SdH oscillations in the static resistance excludes spin splitting [20, 21] as the origin of the observed nodes in optical SdH oscillations.
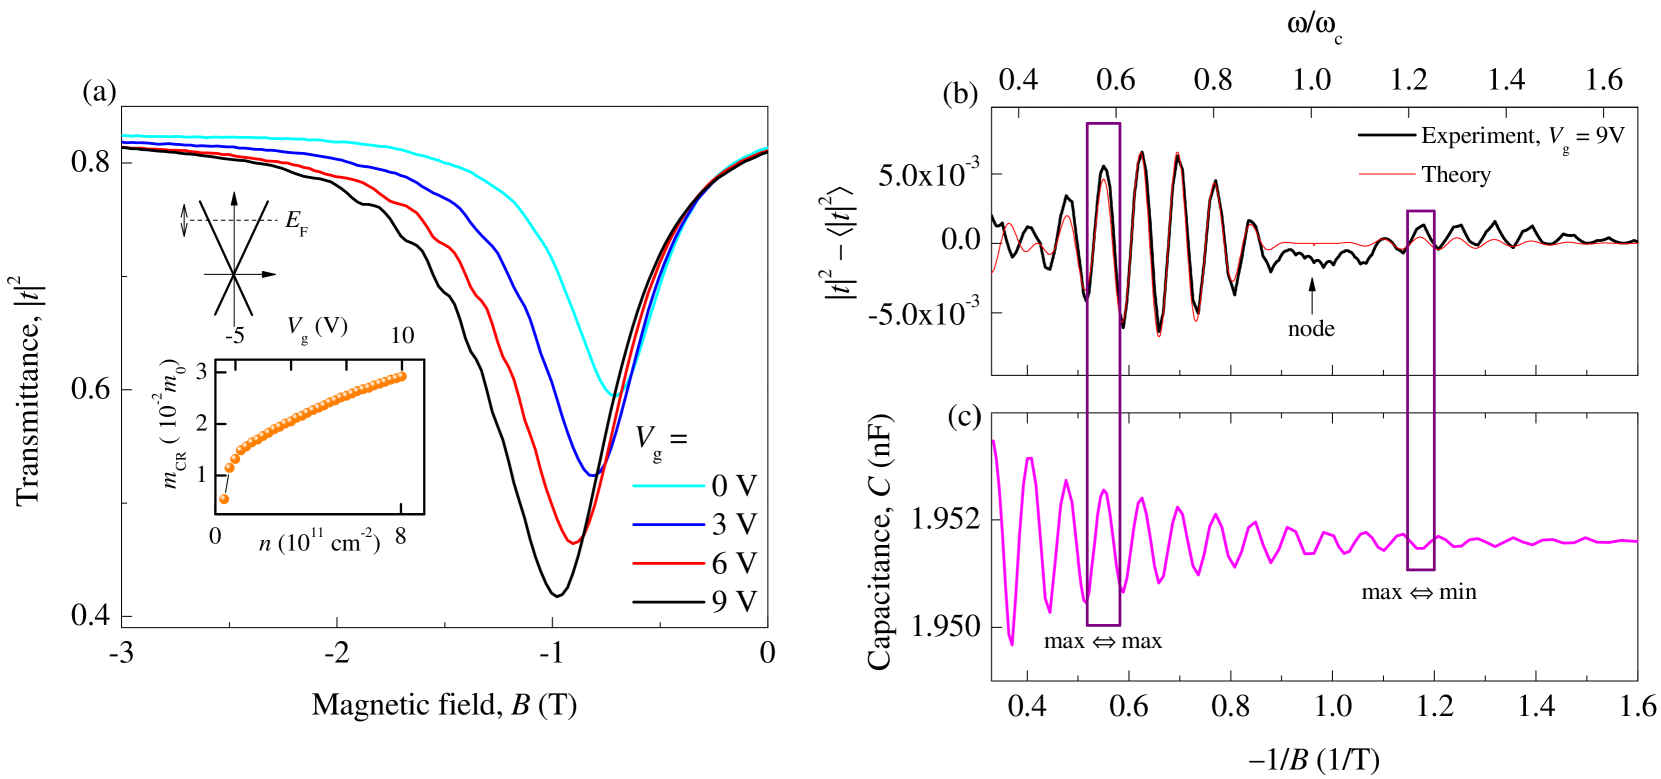
In applying the Lifshitz-Kosevich formula, a parabolic dispersion is normally assumed. In order to prove, whether the form of dispersion relations is relevant for the optical SdH oscillations, experiments in a HgTe quantum well of critical thickness nm have been carried out. This structure hosts Dirac fermions with a linear dispersion and the square root mass-density relation [22, 16, 23, 17]. In Fig. 2 (a) the -dependences of the transmittance measured at 950 GHz and different gate voltages are shown. An increase of the gate voltage results in the increase of the Fermi level position, density, mobility, and the cyclotron mass of the system. This makes the CR minima deeper and wider, and shifts them to higher values of . The smooth part of these dependences can be well fitted using Eq. (1) and the Drude conductivity. The square root connection between the cyclotron mass and the electron density, see the inset to Fig. 2 (a), confirms the linearity of the spectrum [24, 25, 17]. At high densities the optical SdH oscillations are also seen.
We compare such oscillations with simultaneously measured static capacitance oscillations in Figs. 2 (b) and (c). Here, as in GaAs, the period of the optical and static SdH oscillations is the same, and there is a phase flip around the node in the transmittance oscillations. From positions of the nodes, the CR and effective masses differ by about 4. This proves the need to include the interaction effects for the Dirac fermions in HgTe quantum wells [26].
Our analysis below demonstrates that the observed nodal structure of the optical SdH oscillations can be accurately reproduced using the dynamic version of the Lifshitz-Kosevich formula, Eq. (3). This formula for the complex dynamic conductivity , entering Eq. (1), describes a combined effect of impurity scattering and Landau quantization within the self-consistent Born approximation [6]. Previous theoretical treatments of this problem aimed primarily on calculation of the magnetoabsorption, and considered the real dissipative part only [6, 7, 3]. It has been shown that the dynamic SdH in are modulated as , with well-defined nodes at integer and half-integer [7, 3]. As we will see, the nodal structure of the full conductivity is more complex.
We analyze the observed optical SdH oscillations using the following dynamic version of the Lifshitz-Kosevich formula (2):
| (3) |
Here and . Equation (3) is a generalization of the expression for presented in Ref. [7], and can also be extracted from the results of Ref. [8] that considered 2DES with two populated subbands. Similar to Eq. (2), here it is assumed that the disorder-broadened Landau levels strongly overlap, and only the leading quantum correction, linear in , is retained. Correspondingly, Eq. (3) is valid away from the CR, , where such a series expansion is formally justified. However, this does not restrict our analysis below, since we can still rely on the flip of phase of optical SdH oscillations across the node at in the transmittance data.
In high-mobility 2DES, the parameter is usually large. Thus, the complex factor in Eq. (3) reduces to a real factor at all nodes apart from that at . In this limit, the absorptance given by is expected to have nodes at both integer and half-integer [7, 3]. As detailed in Ref. [3], the -modulation in this simplest case can be derived using the Fermi golden rule for the optical transitions, and stems from an oscillating product of initial and final density of states for transitions between disorder-broadened Landau levels.
In contrast to the absorptance, the optical SdH oscillations in transmittance are determined by quantum correction to full complex conductivity which does not vanish at half-integer . The reason is that, unlike the real part, quantum corrections to the full cannot be expressed solely through the oscillating density of states: They also explicitly include oscillatory energy renormalization terms originating from the interplay of Landau quantization and disorder [7, 8].
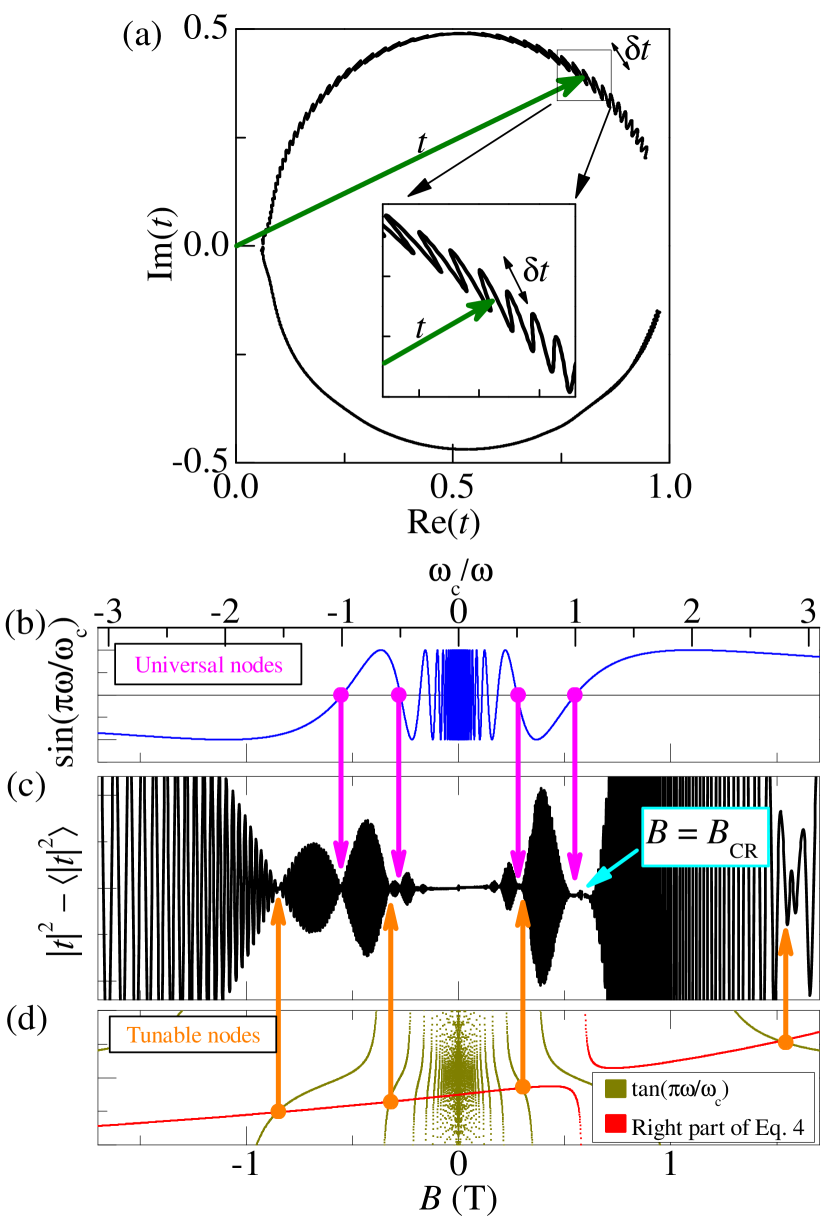
As a result, the SdH oscillations in transmittance possess two kinds of nodes, illustrated in Fig. 3. First, these are nodes at integer , where the oscillatory part of the conductivity Eq. (3) vanishes. These nodes, which we call universal, appear in all optical measurements: transmission, reflection, and absorption. By contrast, the half-integer absorption nodes do not arise in the transmittance signal. At the same time, additional nodes emerge due to the fact that both the Drude transmittance amplitude and its quantum correction are complex numbers. Thus they can be perpendicular to each other on the complex plane, see Fig. 3 (a). Taking into account that while is approximately real away from , from Eqs. (1) and (3) one obtains that additional nodes appear when (see Supplementary Sec. S4 bellow)
| (4) |
It is immediately seen that the positions of these nodes can be optically tuned by changing the Fabry-Pérot phase , therefore we call them tunable nodes. Graphical solution of Eq. (4) is illustrated in Fig. 3 (d).
Fig. 1 demonstrates that the theory curves (red lines), calculated using Eq. (1) and (3), closely reproduce our experimental observations, including the formation of the nodes in the transmittance SdH oscillations. The position of the nodes determines the value of the quasiparticle effective mass that enters Eq. (3) through . All other parameters entering Eqs. (1) and (3), including , can be obtained from the static resistance, see Fig. 1 (d), and from the shape of smooth classical transmittance on top of which small quantum oscillations are formed. Small deviations between theory and experiment can be partially attributed to transition to the separated Landau levels regime, where higher expansion terms in should also be included into the theory. Such deviations are also seen in Fig. 1 (d) at T where the amplitude of the static SdH oscillations starts to deviate from the cosine-like Eq. (2).
From the positions of the nodes, for GaAs sample in Fig. 1 we obtain , about 5 lower than the CR mass , obtained from the position of the CR minimum. In line with the previous studies [18, 19, 28, 29, 30], we attribute this difference to the effective mass renormalization due to electron-electron interactions. Such optical experiments provide an access to quantization- and interaction-induced renormalization effects in 2DES [29, 30].
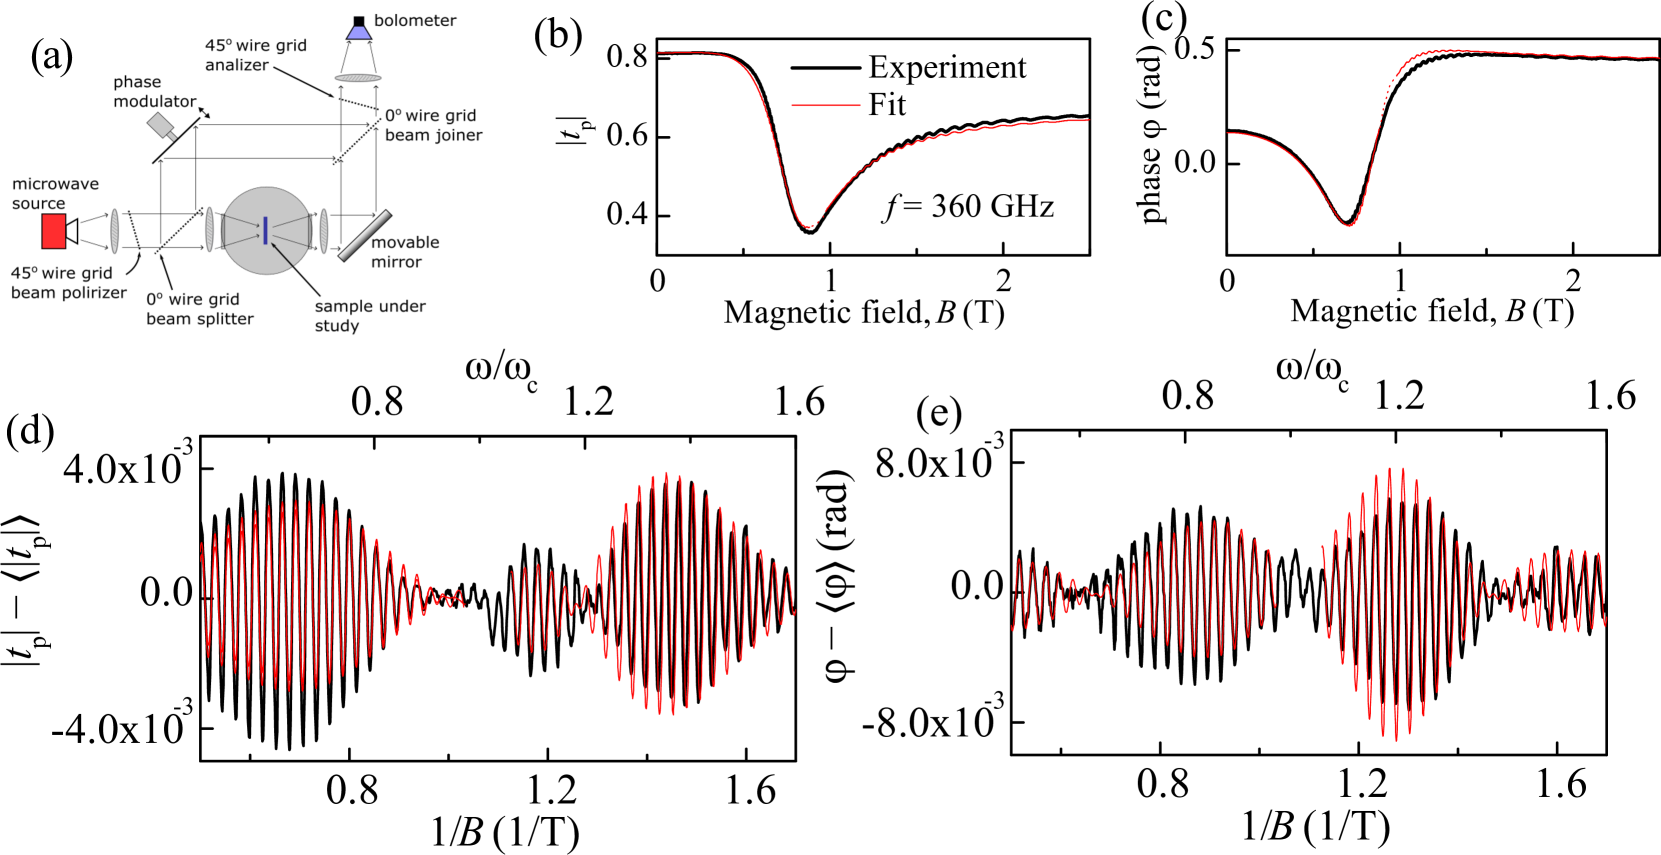
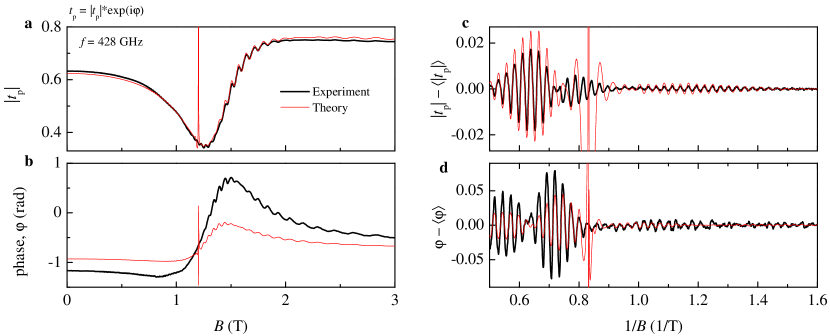
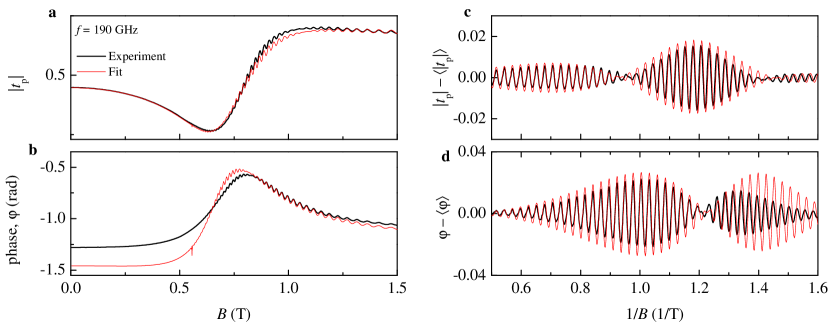
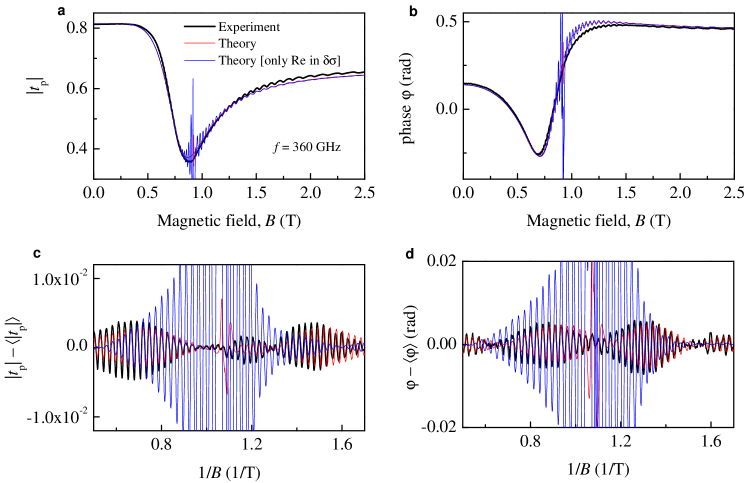
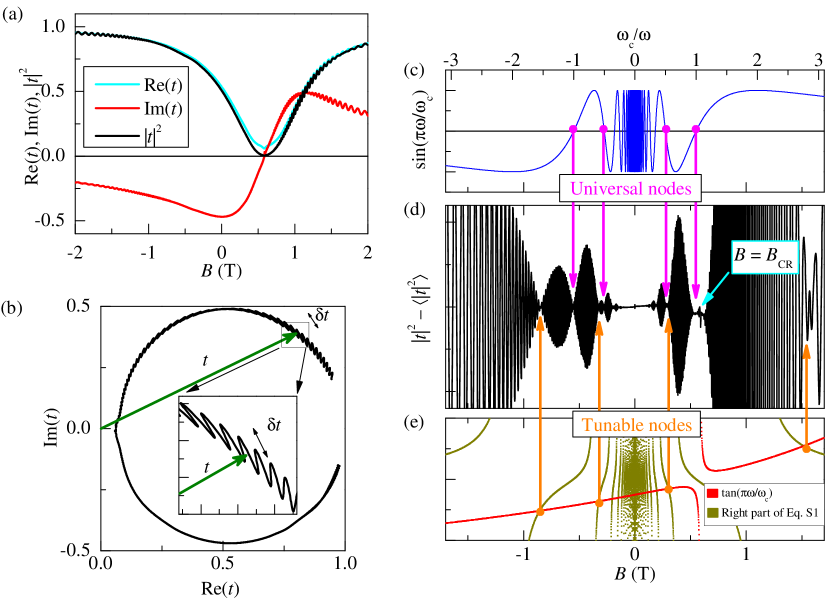
We further test the validity of the dynamic Lifshitz-Kosevich formula, Eq. (3), for the phase measurements. Our Mach-Zehnder interferometer setup provides an opportunity to simultaneously measure real and imaginary parts of the complex transmittance amplitude [31, 32, 33, 34]. The measurements were performed in configuration with two parallel wire grid polarizers before and after the sample, ”beam splitter” and ”beam joiner” in Fig. 4 (a). In this way, we obtained both the absolute value and phase of the parallel transmittance amplitude describing the part of transmitted radiation field with the same linear polarization as in the initial beam. In terms of circular transmission amplitudes entering Eq. (1), . The interferometric measurements allow us to independently study the real and imaginary parts of the transmittance and, thereby, to test further the dynamic Lifshitz-Kosevich formula (3).
In Fig. 4 (b) and (c) we show the magnetic field dependences of the magnitude of the parallel transmittance amplitude and its phase , respectively, measured at 360 GHz on the GaAs sample. Both signals reveal optical SdH oscillations. Panels (d) and (e) show the same data in scale, with the smooth Drude background subtracted. Thanks to higher frequency, more nodes are resolved here. There is one universal node at on both curves, other nodes are tunable and have different magnetic field positions in the transmittance amplitude and its phase. The theory curves, shown in red, are calculated using Eqs. (1) and (3), and they demonstrate that the positions of all nodes are well reproduced using the same effective mass as in Fig. 1, . It should be mentioned that some deviations between the curves can be due to standing waves in the optical setup, see Supplementary Sec. S3 bellow, and Ref. [9] for more details. Further on, the high-field node position in Fig. 4 (b) at T-1 is poorly fitted. This can be due to the transition to a regime of separated Landau levels which requires next-order expansion terms in Eq. (3). In theoretical fits, we omitted the CR regions where the condition no longer holds. At the same time, it is seen that the phase shift of the calculated optical SdH oscillations agrees well with the experiment on both sides of the CR, which confirms the node at . Overall, the comparison shows that Eq. (3) for the optical SdH oscillations works well, and reproduces the position of nodes and the phase jumps of the oscillations.
Summary and outlook. The observed SdH oscillations in transmittance are as fundamental as their static counterpart that provides a powerful tool to characterize 2DES. They are formed in the optical response of the system irrespective of the type of the band dispersion, and their main frequency is precisely determined by the 2DES density. In contrast to the well known static SdH oscillations, the dynamic oscillations in transmittance have an extra modulation that is controlled by the ratio in a unique way – the quantum conductivity correction has an imaginary part that is as essential as the real part. There are universal nodes in the transmittance oscillations at integer that should appear in the same positions in absorption and transmission. There is also a similar number of additional, tunable nodes that appear at different position in the amplitude and phase measurements of the transmission and reflection, while in the absorption they translate into the nodes at half-integer [3]. The optically tunable nodes in transmittance can be explored using both constant-frequency and time-domain set-ups, and are sensitive to all parameters of the structure allowing to determine these parameters with high accuracy.
We acknowledge the financial support of the Austrian Science Funds (I 3456-N27, I 5539-N). I.A.D. acknowledges the support from the German Research Foundation (Deutsche Forschungsgemeinschaft) via project DM1-6/1.
References
- Ando et al. [1982] T. Ando, A. B. Fowler, and F. Stern, Electronic properties of two-dimensional systems, Rev. Mod. Phys. 54, 437 (1982).
- Abstreiter et al. [1976] G. Abstreiter, J. P. Kotthaus, J. F. Koch, and G. Dord, Cyclotron resonance of electrons in surface space-charge layers on silicon, Phys. Rev. B 14, 2480 (1976).
- Fedorych et al. [2010] O. M. Fedorych, M. Potemski, S. A. Studenikin, J. A. Gupta, Z. R. Wasilewski, and I. A. Dmitriev, Quantum oscillations in the microwave magnetoabsorption of a two-dimensional electron gas, Phys. Rev. B 81, 201302 (2010).
- Shuvaev et al. [2013] A. M. Shuvaev, G. V. Astakhov, G. Tkachov, C. Brüne, H. Buhmann, L. W. Molenkamp, and A. Pimenov, Terahertz quantum Hall effect of Dirac fermions in a topological insulator, Phys. Rev. B 87, 121104(R) (2013).
- Dziom et al. [2019] V. Dziom, A. Shuvaev, A. V. Shchepetilnikov, D. MacFarland, G. Strasser, and A. Pimenov, High-frequency breakdown of the integer quantum Hall effect in GaAs/AlGaAs heterojunctions, Phys. Rev. B 99, 045305 (2019).
- Ando [1975] T. Ando, Theory of Cyclotron Resonance Lineshape in a Two-Dimensional Electron System, J. Phys. Soc. Japan 38, 989 (1975).
- Dmitriev et al. [2003] I. A. Dmitriev, A. D. Mirlin, and D. G. Polyakov, Cyclotron-Resonance Harmonics in the ac Response of a 2D Electron Gas with Smooth Disorder, Phys. Rev. Lett. 91, 226802 (2003).
- Raichev [2008] O. E. Raichev, Magnetic oscillations of resistivity and absorption of radiation in quantum wells with two populated subbands, Phys. Rev. B 78, 125304 (2008).
- Savchenko et al. [2022] M. L. Savchenko, A. Shuvaev, I. A. Dmitriev, S. D. Ganichev, Z. D. Kvon, and A. Pimenov, Demonstration of high sensitivity of microwave-induced resistance oscillations to circular polarization, Phys. Rev. B 106, L161408 (2022).
- Shoenberg [1984] D. Shoenberg, Magnetic Oscillations in Metals, Cambridge Univ. Press https://doi.org/10.1017/CBO9780511897870 (1984).
- Dmitriev et al. [2012] I. A. Dmitriev, A. D. Mirlin, D. G. Polyakov, and M. A. Zudov, Nonequilibrium phenomena in high Landau levels, Rev. Mod. Phys. 84, 1709 (2012).
- Baba et al. [1983] T. Baba, T. Mizutani, and M. Ogawa, Elimination of Persistent Photoconductivity and Improvement in Si Activation Coefficient by Al Spatial Separation from Ga and Si in Al-Ga-As:Si Solid System – a Novel Short Period AlAs/n-GaAs Superlattice –, Jpn. J. Appl. Phys. 22, L627 (1983).
- Friedland et al. [1996] K.-J. Friedland, R. Hey, H. Kostial, R. Klann, and K. Ploog, New Concept for the Reduction of Impurity Scattering in Remotely Doped GaAs Quantum Wells, Phys. Rev. Lett. 77, 4616 (1996).
- Umansky et al. [2009] V. Umansky, M. Heiblum, Y. Levinson, J. Smet, J. Nübler, and M. Dolev, MBE growth of ultra-low disorder 2DEG with mobility exceeding 35×106cm2/Vs, J. Cryst. Growth 311, 1658 (2009).
- Manfra [2014] M. J. Manfra, Molecular Beam Epitaxy of Ultra-High-Quality AlGaAs/GaAs Heterostructures: Enabling Physics in Low-Dimensional Electronic Systems, Annu. Rev. Condens. Matter Phys. 5, 347 (2014).
- Kvon et al. [2011] Z. D. Kvon, S. N. Danilov, D. A. Kozlov, C. Zoth, N. N. Mikhailov, S. A. Dvoretskii, and S. D. Ganichev, Cyclotron Resonance of Dirac Ferions in HgTe Quantum Wells, JETP Lett. 94, 816 (2011).
- Shuvaev et al. [2022] A. Shuvaev, V. Dziom, J. Gospodarič, E. G. Novik, A. A. Dobretsova, N. N. Mikhailov, Z. D. Kvon, and A. Pimenov, Band Structure Near the Dirac Point in HgTe Quantum Wells with Critical Thickness, Nanomaterials 12, 2492 (2022).
- Hopkins et al. [1987] M. A. Hopkins, R. J. Nicholas, M. A. Brummell, and J. J. Harris, Cyclotron-resonance study of nonparabolicity and screening in GaAs-GaAlAs heterojunctions, Phys. Rev. B 36, 4789 (1987).
- Kukushkin and Schmult [2015] I. V. Kukushkin and S. Schmult, Fermi liquid effects and quasiparticle mass renormalization in a system of two-dimensional electrons with strong interaction, JETP Lett. 101, 693 (2015).
- Das et al. [1989] B. Das, D. C. Miller, S. Datta, R. Reifenberger, W. P. Hong, P. K. Bhattacharya, J. Singh, and M. Jaffe, Evidence for spin splitting in InxGa1-xAs/In0.52Al0.48As heterostructures as B -¿ 0, Phys. Rev. B 39, 1411 (1989).
- Hatke et al. [2012] A. T. Hatke, M. A. Zudov, L. N. Pfeiffer, and K. W. West, Shubnikov-de Haas oscillations in GaAs quantum wells in tilted magnetic fields, Phys. Rev. B 85, 241305 (2012).
- Volkov and Pankratov [1985] B. A. Volkov and O. A. Pankratov, Two-dimensional massless electrons in an inverted contact, JETP Lett. 42, 178 (1985).
- Buttner et al. [2011] B. Buttner, C. X. Liu, G. Tkachov, E. G. Novik, C. Brune, H. Buhmann, E. M. Hankiewicz, P. Recher, B. Trauzettel, S. C. Zhang, and L. W. Molenkamp, Single valley Dirac fermions in zero-gap HgTe quantum wells, Nat. Phys. 7, 418 (2011).
- Dziom et al. [2017a] V. Dziom, A. Shuvaev, N. N. Mikhailov, and A. Pimenov, Terahertz properties of Dirac fermions in HgTe films with optical doping, 2D Mater. 4, 024005 (2017a).
- Ikonnikov et al. [2011] A. V. Ikonnikov, M. S. Zholudev, K. E. Spirin, A. A. Lastovkin, K. V. Maremyanin, V. Y. Aleshkin, V. I. Gavrilenko, O. Drachenko, M. Helm, J. Wosnitza, M. Goiran, N. N. Mikhailov, S. A. Dvoretskii, F. Teppe, N. Diakonova, C. Consejo, B. Chenaud, and W. Knap, Cyclotron resonance and interband optical transitions in HgTe/CdTe(0 1 3) quantum well heterostructures, Semicond. Sci. Technol. 26, 125011 (2011).
- Minkov et al. [2020] G. M. Minkov, V. Aleshkin, O. Rut, A. Sherstobitov, A. Germanenko, S. Dvoretski, and N. Mikhailov, Electron mass in a HgTe quantum well: Experiment versus theory, Phys. E Low-dimensional Syst. Nanostructures 116, 113742 (2020).
- [27] See Supplemental Material at [URL will be inserted by publisher] for measurements at other frequencies, details of the fitting procedure, and a discussion on the influence of standing waves.
- Hatke et al. [2013] A. T. Hatke, M. A. Zudov, J. D. Watson, M. J. Manfra, L. N. Pfeiffer, and K. W. West, Evidence for effective mass reduction in GaAs/AlGaAs quantum wells, Phys. Rev. B 87, 161307 (2013).
- Tabrea et al. [2020] D. Tabrea, I. A. Dmitriev, S. I. Dorozhkin, B. P. Gorshunov, A. V. Boris, Y. Kozuka, and A. Tsukazaki, Microwave response of interacting oxide two-dimensional electron systems, Phys. Rev. B 102, 115432 (2020).
- Savchenko et al. [2021] M. L. Savchenko, A. Shuvaev, I. A. Dmitriev, A. A. Bykov, A. K. Bakarov, Z. D. Kvon, and A. Pimenov, High harmonics of the cyclotron resonance in microwave transmission of a high-mobility two-dimensional electron system, Phys. Rev. Res. 3, L012013 (2021), arXiv:2008.11114 .
- Volkov et al. [1985] A. A. Volkov, G. V. Kozlov, S. P. Lebedev, and A. M. Prokhorov, Dielectric measurements in the submillimeter wavelength region, Infrared Phys. 25, 369 (1985).
- Shuvaev et al. [2012] A. M. Shuvaev, G. V. Astakhov, C. Brüne, H. Buhmann, L. W. Molenkamp, and A. Pimenov, Terahertz magneto-optical spectroscopy in HgTe thin films, Semicond. Sci. Technol. 27, 124004 (2012).
- Dziom et al. [2017b] V. Dziom, A. Shuvaev, A. Pimenov, G. V. Astakhov, C. Ames, K. Bendias, J. Böttcher, G. Tkachov, E. M. Hankiewicz, C. Brüne, H. Buhmann, and L. W. Molenkamp, Observation of the universal magnetoelectric effect in a 3D topological insulator, Nat. Commun. 8, 15197 (2017b).
- Dziom [2018] V. Dziom, THz spectroscopy of novel spin and quantum Hall systems, Ph.D thesis, Vienna Univ. Technol. (2018).
- Zhang et al. [2014] Q. Zhang, T. Arikawa, E. Kato, J. L. Reno, W. Pan, J. D. Watson, M. J. Manfra, M. A. Zudov, M. Tokman, M. Erukhimova, A. Belyanin, and J. Kono, Superradiant Decay of Cyclotron Resonance of Two-Dimensional Electron Gases, Phys. Rev. Lett. 113, 047601 (2014).
SUPPLEMENTAL MATERIAL
S1 Optical SdH oscillations at other frequencies
S2 Importance of the imaginary part in the conductivity correction
S3 Standing waves in transmission
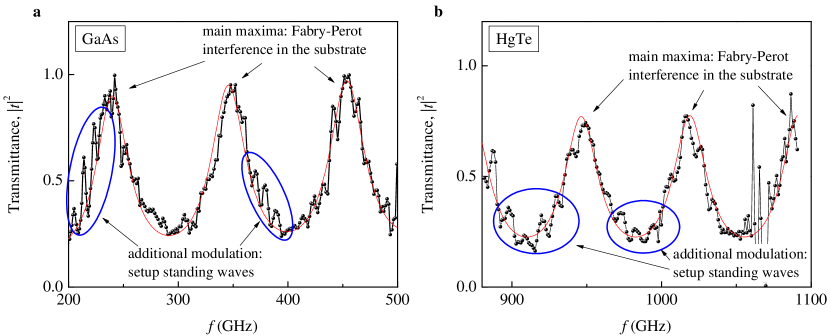
There are two types of standing waves in the transmission signal. The first type is due to Fabry-Pérot interference in the substrate. It modifies the transmittance according to Eq. (1) of the main text. The second type is die to inevitable reflections on the optical elements in the setup including cryostat windows, attenuators, lenses, etc. Figure S4 shows a typical frequency dependence of the transmittance observed in our experiments. Here the result of both types of the standing waves is seen. The main maxima come from the interference in the substrate, and they can be fitted by Eq. (1) (red lines). An additional modulation, coming from reflections in the optical setup, forms weaker quasi-periodic oscillations. Apart from distorting the frequency scans, such standing waves modify the magnetic scans as well. Therefore, the sample parameters, obtained from a single measurement, may differ from their real values [34]. To get more precise values, one needs to repeat magnetic field scans at different frequencies and attempt to fit them all with the same set of parameters.
S4 Universal and tunable nodes in transmittance SdH oscillations
Nodes in the SdH oscillations of the transmittance can come from two sources. First, the SdH-related correction to the optical conductivity (Eq. 3 of the main text)
| (S1) |
itself has nodes when is equal to an integer number and corresponding is equal to zero.
Additionally, since both the Drude transmittance and its oscillatory correction are complex numbers, they can be perpendicular to each other on a complex plane that results in additional nodes in the measured transmittance. Indeed, having the transmittance oscillations much smaller than the Drude transmittance
| (S2) |
When the phases and are shifted by , the transmittance oscillations acquire additional nodes, which we call tunable. In these conditions, variation of magnetic field rotates the complex transmittance while its length stays the same. To find positions of all tunable nodes in one needs to find zeros of . Taking into account that is approximately real away from , the equation determining positions of these nodes is
| (S3) |
For constructive Fabry-Pérot interference in the substrate and away from the cyclotron resonance, the right part of this equation becomes a linear function of the magnetic field, .
To illustrate the importance of both universal and tunable nodes, in Fig. S5 (a) we show the calculated using parameters in the insert. The chosen parameters are close to the ones of studied GaAs system, but to see more oscillations, the temperature is set close to zero and the quantum mobility is taken to be closer to the transport mobility. Here we have the CR near T and strong optical SdH oscillations. In panel (b), we show the oscillatory part of the transmittance, versus . It is clearly seen that there are few universal nodes at and at least one tunable node at T.
In Fig. S6 (a) we show the corresponding real and imaginary parts of and . It is seen that the tunable node in at does not correspond to vanishing Re() or Im. In the panel (b) we show the imaginary part of versus its real part. The dependence has a usual circular-like Drude behaviour with the CR near minimal values of Re. The optical SdH are also seen, and the total vector is shown by a green arrow for the magnetic field T equal to the position of the tunable node mentioned above. It is seen here that at this magnetic field two complex numbers and are perpendicular to each other resulting in the formation of the tunable node in .
In Fig. S6 (d) we show zoomed transmittance oscillations. They exhibit universal nodes coming from (see panel (c)) and tunable nodes arising at roots of Eq. (S3) (see panel (e)). It is seen that apart from the tunable node at T that we saw before, there are plenty of others.
Another peculiarity of the optical transmittance oscillations is related to the conditions for their observation. Here it is essential that the optical response is sensitive to conductivity corrections only not too far from the CR [2, 30]. Away from the CR, when in Eq. (1), the transmittance becomes insensitive to the conductivity of 2DES. This limits the range of the magnetic fields where optical SdH oscillations can be seen, and this is the main reason to use GaAs quantum well of high density – the CR width is proportional to the density for high-mobility 2DES [35].