uPLAM: Robust Panoptic Localization and Mapping Leveraging Perception Uncertainties
Abstract
The availability of a reliable map and a robust localization system is critical for the operation of an autonomous vehicle. In a modern system, both mapping and localization solutions generally employ convolutional neural network (CNN) –based perception. Hence, any algorithm should consider potential errors in perception for safe and robust functioning. In this work, we present uncertainty-aware panoptic Localization and Mapping (uPLAM), which employs perception uncertainty as a bridge to fuse the perception information with classical localization and mapping approaches. We introduce an uncertainty-based map aggregation technique to create a long-term panoptic bird’s eye view map and provide an associated mapping uncertainty. Our map consists of surface semantics and landmarks with unique IDs. Moreover, we present panoptic uncertainty-aware particle filter-based localization. To this end, we propose an uncertainty-based particle importance weight calculation for the adaptive incorporation of perception information into localization. We also present a new dataset for evaluating long-term panoptic mapping and map-based localization. Extensive evaluations showcase that our proposed uncertainty incorporation leads to better mapping with reliable uncertainty estimates and accurate localization. We make our dataset and code available at: http://uplam.cs.uni-freiburg.de
I Introduction
The perception systems extensively utilize deep-learning-based methods, given their superiority in extracting high-level scene information defined by various tasks such as object detection and segmentation. The primary focus of most perception methods has been to achieve the best performance based on the metrics, ignoring any uncertainty in the prediction. Thus, such deterministic predictions can provide good results on a particular dataset but lack the quantification of uncertainty estimation, which is crucial for a safe and reliable operation in unknown environments. Recently, Sirohi et al. [1] formulated the task of uncertainty-aware panoptic segmentation for a holistic and reliable scene understanding by considering both the segmentation performance and uncertainty estimation in their evaluation. With the availability of uncertainties, the next step is to utilize the uncertainties for the downstream tasks.
In addition to the perception, most modern autonomous systems utilize a map of the surroundings for robust planning and control. However, manual map labeling is not feasible, given the cost and time-intensive labeling process. Thus, current methods utilize deep learning-based perception algorithms to create maps automatically [2]. Due to the inherent problem of the non-availability of labels of the mapping area, methods generally train their networks on a separate dataset but do not consider the uncertainty in the prediction while creating maps. Thus, utilizing the uncertainty of perception in the mapping algorithm is crucial to robustly detect features in a novel environment by considering potential errors in perception. It is also essential to provide the mapping uncertainty because a wrong mapping can compromise a safe operation of planning and control. Moreover, most works focus on creating surface maps, including surface segmentation [3] and lane graphs [4]. However, a holistic map should contain not only surface elements such as drivable areas but also the landmarks such as traffic lights and signs to facilitate precise localization.
In the case of localization, the earlier classical probabilistic approaches rely either on the raw sensor data or high-level features such as lines or poles, whereas the current perception systems can provide a rich semantic representation of the surroundings. However, the deterministic perception output does not allow us to explore the full potential of the classical approach setting.
In this paper, we aim to provide the methods for using and integrating the perception uncertainties for robust long-term mapping and localization tasks. We propose uncertainty-aware panoptic mapping, which aims to predict the semantics of the surface regions and separate IDs and classes for landmarks such as traffic signs and lights together with underlying mapping uncertainty. We utilize a bird’s-eye-view (BEV) map representation, given that it requires less memory than a LiDAR point cloud map and richer semantic information compared to the lane graph representation. We propose an uncertainty-weighted aggregation of perception prediction to agregate the map by considering the network’s confidence in the prediction. Moreover, to facilitate the evaluation of the long trajectory panoptic mapping, we propose the Freiburg Panoptic Driving dataset, which includes labeled semantics and landmarks in the BEV format and raw sensor data from the camera, LiDAR, IMU, and GPS modalities. Moreover, we propose uncertainty-aware panoptic localization, incorporating the panoptic segmentation and uncertainties into the particle filter algorithm. To this end, we propose adaptive particle importance weight based on the prediction uncertainty. In summary our contributions are:
-
•
An uncertainty-aware panoptic mapping consisting of uncertainty-weighted map aggregation and uncertainty estimation.
-
•
Perception uncertainty-aware particle filter for localization with adaptive importance weight calculation.
-
•
Freiburg Panoptic Driving dataset with multimodal sensory information
-
•
Extensive experiments and ablations to test the various components of our approach.
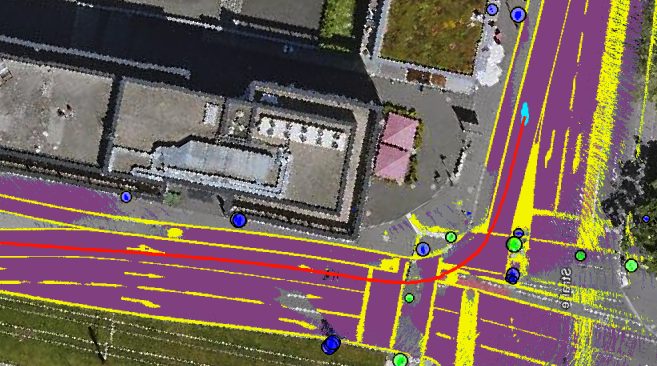
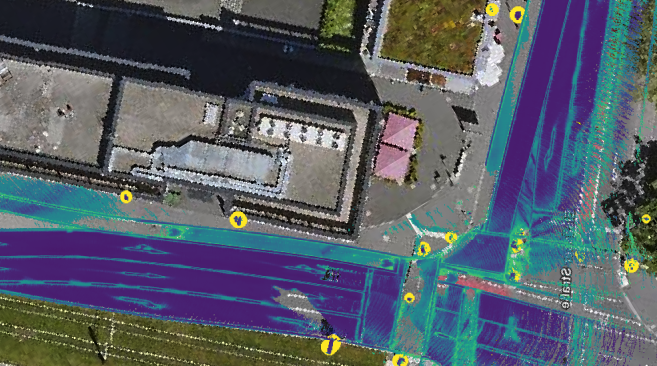
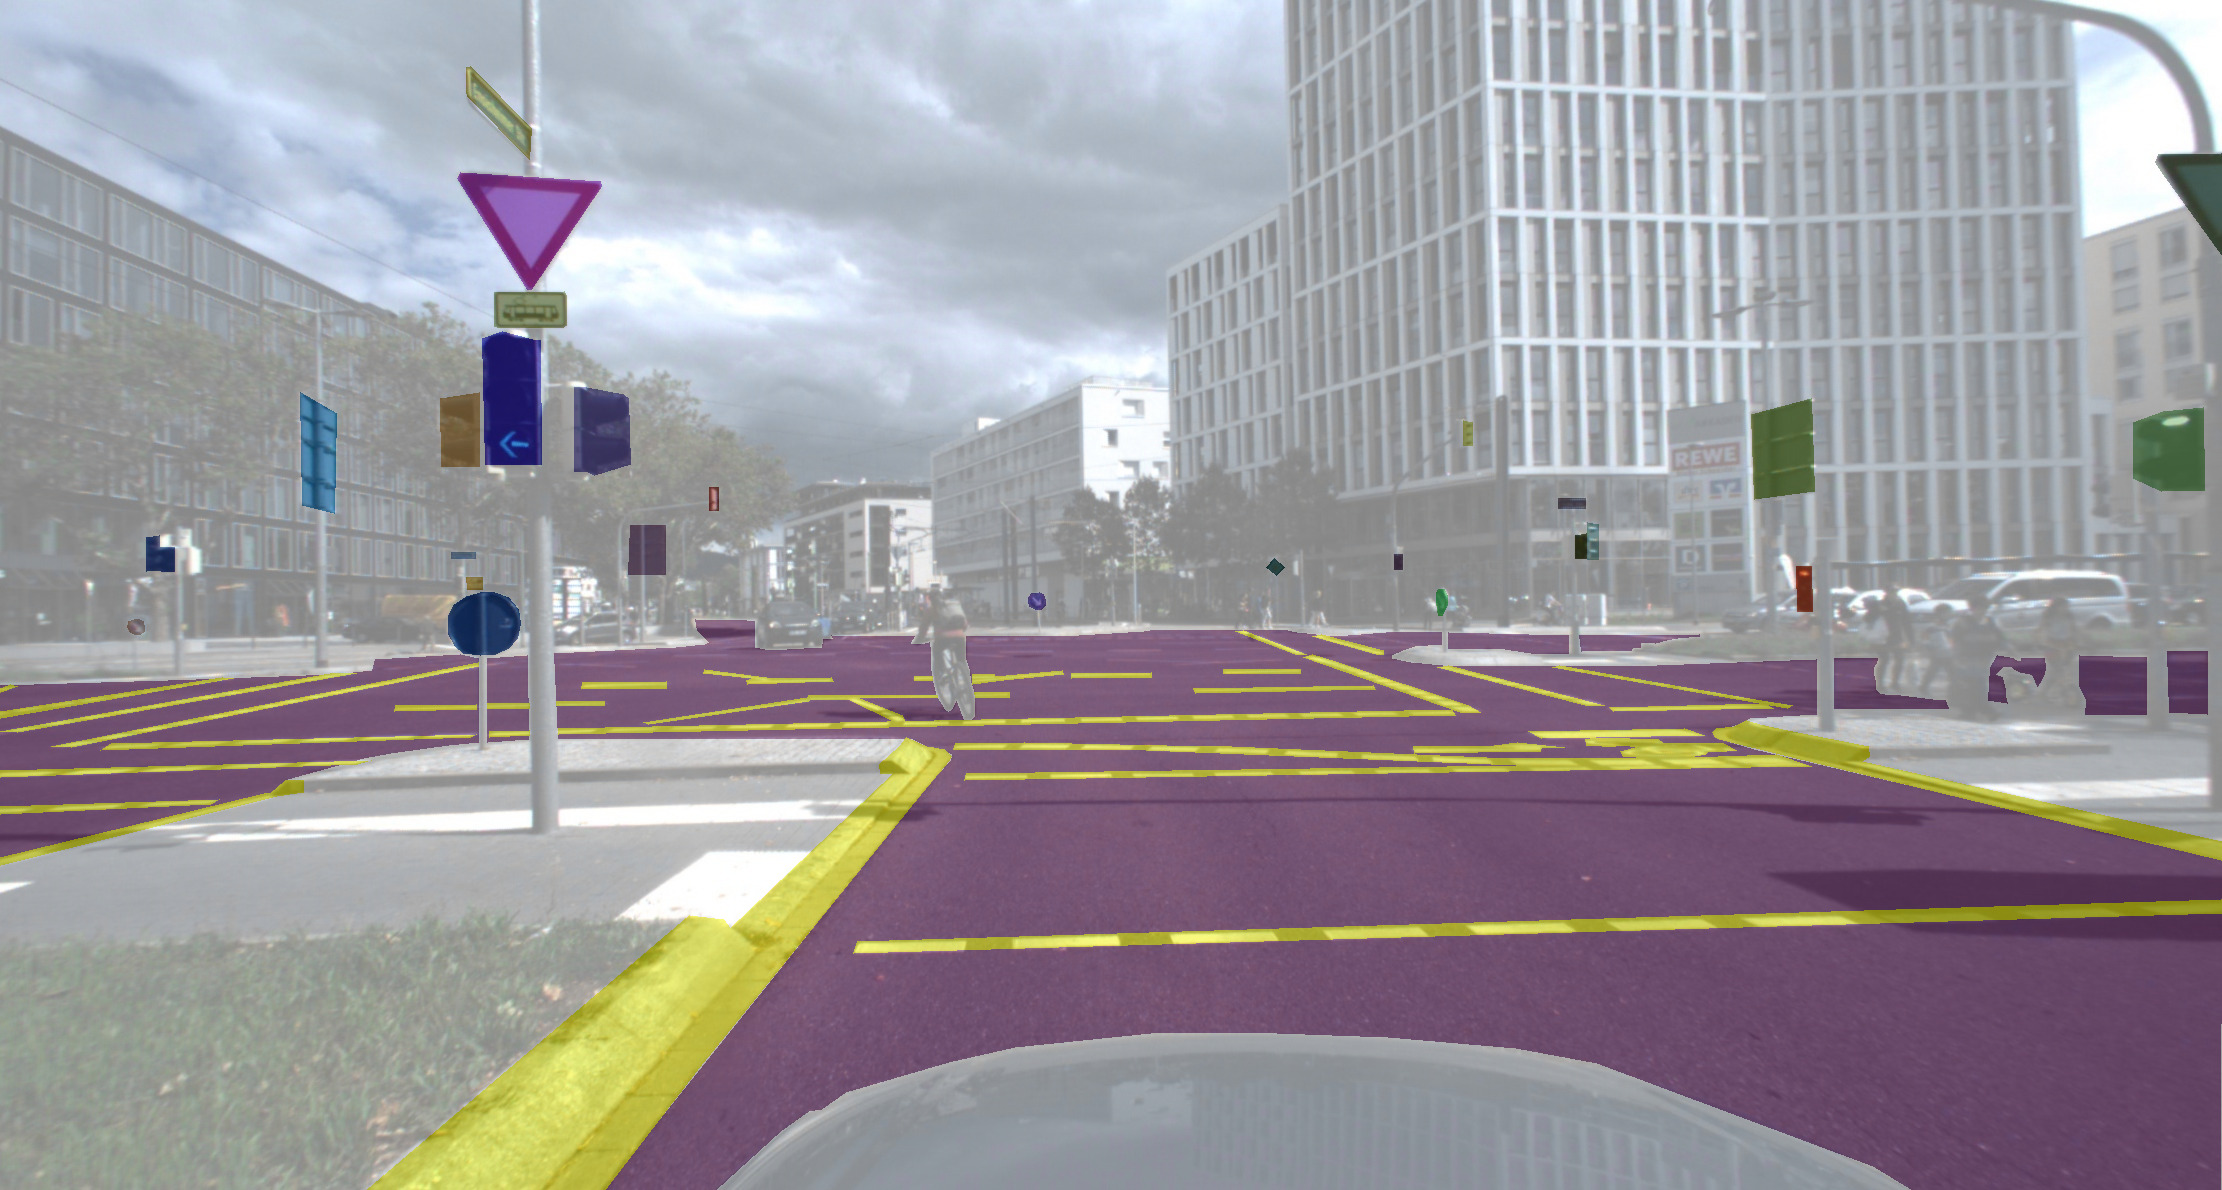
Example results using our method and dataset are showcased in Fig. 1.
II Related Work
II-A Panoptic Segmentation
The panoptic segmentation methods for both camera [5] and LiDAR modalities [6, 7] either follow a proposal-free [8] or a proposal-based approach [9, 10]. The proposal-free approach includes having a semantic segmentation branch followed by a clustering mechanism, such as center and offset regression [8], a Hough voting, or affinity calculation [11]. On the other hand, the proposal-based methods have two separate semantic segmentation and instance segmentation heads. The instance segmentation head usually employs the Mask-RCNN principle to generate bounding boxes and underlying masks for different instances [10].
II-B Uncertainty Estimation
Earlier works aiming at uncertainty estimation generally utilized one of the sampling-based methods, such as Bayesian Neural Networks and Monte Carlo (MC) Dropout [12] . However, sampling-based methods are unsuitable for real-time applications due to the intensive computational requirements.
Thus, sampling-free methods for uncertainty estimation have gained interest in recent times. Sensoy et al. [13] proposed evidential learning for sampling-free uncertainty estimation in the classification task which has been adapted in various tasks such as segmentation and object detection [14]. Sirohi et al. [1] recently formulated the task of uncertainty-aware panoptic segmentation and utilized evidential learning to provide the uncertainty estimate for both camera and LiDAR data [15]. They apply evidential learning to get separate uncertainties for semantic and instance segmentation, then combine them to get panoptic segmentation and uncertainty for each pixel. In this work, we utilize the work by [1] as our perception pipeline to obtain panoptic segmentation and uncertainty.
II-C Bird’s-Eye-View Mapping
There has been a recent emergence of deep learning-based automatic bird’s-eye-view (bev) mapping techniques for autonomous driving to avoid time-intensive manual annotation and ensure scalability on a large scale. BEV maps provide both, a dense representation of the semantics and good spatial separation as LiDAR maps, without requiring high storage resources.
Zuern et al. [16] and Buchner et al. [4] estimate lane graphs in the BEV maps through aerial images. However, lane graph representation lacks semantic cues and landmarks necessary for absolute path planning and localization tasks. Other works use monocular images [17] to create local BEV semantically rich segmentation maps. However, using only monocular images leads to degraded performance for high distances. It is also unsuitable for out-of-distribution scenarios due to reliance on depth estimation trained on a particular dataset. Moreover, such methods primarily focus only on creating the local rather than the global maps. LiDAR-based semantic maps [18] are also not scalable due to the high cost of labeling LiDAR data.
Thus, given the complementary information of camera and LiDAR sensors, Zuern et al. [19] and Zhang et al. [3] utilize both sensors to create surface semantic BEV maps. Zuern et al. [19] propose to create semantic surface annotations for camera images by tracking the trajectories of the traffic participants. During inference, they project the prediction done on the camera images into the BEV map utilizing the camera-LiDAR point cloud association. On the other hand, [3] creates a semantic BEV map of different surfaces by training the camera image-based network on a different dataset and similar projection into BEV as [19]. However, these methods neither provide information about the separate landmarks nor uncertainty estimation of the predicted map.
Our work aims to provide a panoptic BEV map that includes the surfaces’ semantics together with the unique IDs and classes for landmarks such as traffic signs and lights. In addition, we also utilize perception uncertainty to aggregate the map and provide an underlying segmentation uncertainty associated with each map cell prediction.
II-D Perception-uncertainty in Localization
Some localization works utilize information extracted from convolutional neural networks (CNNs) to extract information such as lanes, poles, and facades. However, these methods do not consider perception uncertainty. Petek et al. [20] provided a multi-task perception module with uncertainty estimation in their localization algorithm. They train their network to detect the drivable areas and utilize the perception uncertainty to extract lane boundaries and match them with the lane-based HD map to localize. However, as the authors suggest, such a method struggles in the occluded regions where the perception can not see overall drivable areas and hence cannot detect the correct boundary. In classical probabilistic localization algorithms, Monte Carlo localization [21] or particle filter are popular. However, particle-filters can have limited representational power due to limited number of particles and assumption that one of particle is at correct location. This assumption is in practice not true and likelihood functions need to generally need to be adapted for optimal distribution of particles. Pfaff et al. [22] proposed an adaptive likelihood mechanism based on particle spread for optimizing particle distribution to the most probable regions. They utilize LiDAR-based scan matching. In this work, we propose an uncertainty-aware panoptic particle filter-based localization that incorporates the following. 1) both the semantic and landmark instance information from perception and the BEV map. 2) directly utilize the perception uncertainties for adapting the likelihood function.
III Technical Approach
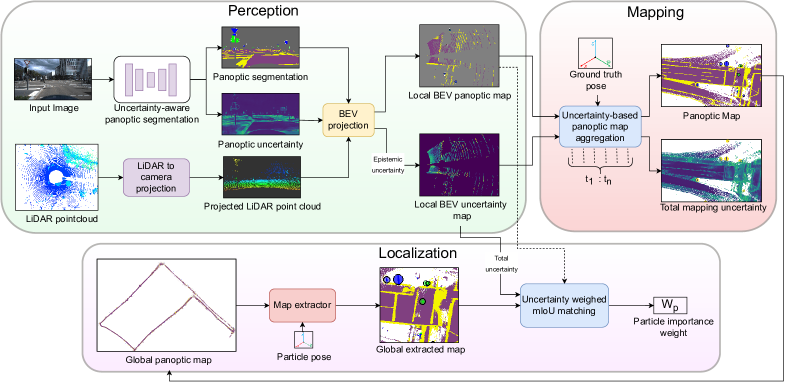
An overview of our approach is shown in Fig. 2. There are mainly three components of our approach, namely: perception, mapping, and localization. In perception, we perform uncertainty-aware panoptic segmentation of the camera image and utilize LiDAR point cloud to predict sparse local birds-eye-view(BEV map), which our uncertainty-aware panoptic mapping and localization utilize. Our uncertainty-aware panoptic mapping utilizes the epistemic or model uncertainties of the local BEV maps to aggregate the predictions over multiple time steps to create a dense global panoptic map and provide a corresponding total uncertainty estimate. Our uncertainty-aware localization utilizes local BEV uncertainties to calculate an uncertainty-weighted mIoU (mean intersection over union) between the global and the local BEV panoptic map, which serves as the particle importance weight for our particle filter-based localization algorithm.
III-A Perception
We employ the EvPSNet [1] for uncertainty-aware panoptic segmentation of camera images. The network consists of a shared backbone and two separate uncertainty-aware semantic and instance segmentation heads. The segmentation heads utilize evidential learning to provide per-pixel uncertainty for underlying segmentation predictions. The network predicts the parameters of a Dirichlet distribution, parametrized by , where is the number of classes and corresponds to the evidence for network output logit , pixel and class . The evidence measures the amount of support collected from data for a pixel to belong to a particular class. The corresponding per-pixel probability and uncertainty are calculated as follows:
| (1) | ||||
| (2) |
where , is a measure of the total evidence.
The network is trained for the classes drivable area, road marking (including curbs), traffic sign, and traffic light. It provides semantic segmentation for all classes, corresponding uncertainty estimates, and instance IDs for traffic signs and lights ( otherwise), resulting in an perception vector (, , , , , ) for each pixel.
For associating the LiDAR data with the network’s image prediction, we find the pixel location for each LiDAR point as
| (3) |
where is the intrinsic camera matrix, and T is the transformation between the two sensors. All LiDAR points with ranges up to 40 m that are in the image plane are then appended with the pixels’ perception vector, resulting in augmented points .
III-B Uncertainty-aware Panoptic Mapping
We chose a BEV grid representation for our map, storing a perception of size in each of its 1010 cm2 cells. The measurements (augmented LiDAR points) are projected into the map frame using the vehicle’s location.
III-B1 Semantic Map Aggregation
We propose a perception uncertainty-based map aggregation scheme that utilizes the evidential output of the perception network. Considering grid cell the semantic vector is calculated as a weighted sum over the predicted probabilities, employing the uncertainties as inverse weights:
| (4) |
Here, is the number of measurements, and we observe that the sum simplifies to the average evidence over all measurements. Finally, the per-class probability for each map cell can be calculated using Eq. (1):
| (5) |
III-B2 Map Uncertainty
A central component to reliable robot localization are proper uncertainty estimates, including the map uncertainty. We already derived cell-wise epistemic uncertainties for our network in Eq. (2). However, in practice the perception network is likely to be trained on different data than the one used in a later mapping run. Hence, it is essential to capture the total (or predictive) uncertainty . We employ the entropy, which is a good measure to represent the uncertainty encapsulated by the probability vector distribution [23], to quantify the total uncertainty for grid cell as
| (6) |
where the denominator ensures .
III-B3 Landmark Extraction
We extract landmarks from traffic signs and lights utilizing the predicted instance IDs from our panoptic network. However, the prediction from convolutional neural networks is usually blurry at the instance borders due to down- and up-sampling of the images. When these inconsistent results are projected onto LiDAR data, the effect becomes more evident, since a one-pixel distance in the 2D images can correspond to many meters in the 3D point cloud, leading to drastic leaking effects. Hence, we apply a statistical outlier rejection for the LiDAR points belonging to a particular instance. Further, we remove instances with less than 10 LiDAR points to increase stability.
To assign consistent and unique instance IDs, we save the 3D center coordinates for every filtered instance of a particular time step. These are associated to the instances with the same class at the next time step using closest-neighbor search within the radius of 50 cm. If a match is found, the instance ID from the earlier time step is kept, otherwise a new ID is assigned. The instance IDs are stored for each grid cell .
III-C Localization
We employ particle-filter-based localization for our approach [21], representing the posterior probability distribution of the robot pose by a set of weighted samples (particles). The importance weights are calculated from the measurement likelihood as , where is the measurement (perception) at time , is the corresponding vehicle pose, and is the static map. We apply the particle filter algorithm out-of-the-box and focus on calculating the particle weights based on our uncertainty-based panoptic map and perception, and additionally employing uncertainty estimates for the perception, as described below. We set the number of particles to 100 and calculate the final pose as the weighted average pose over the particles.
III-C1 Panoptic importance weights
Each particle carries an importance weight that represents the likelihood of the current observation given the map and the particles’ pose. Common localization methods rely on local occupancy maps, created from the latest range sensor data, and calculate the likelihood of it matching a static global map [22]. However, in our approach, we additionally make use of panoptic information from camera images. We create a local BEV panoptic grid map from the current camera image and LiDAR scan, in addition to a global map, as described above. The local map is aligned to the global map according to each particle’s pose, and the corresponding importance weights are calculated based on the matching of all grid cells that carry information in both maps, as described in the following.
Our approach employs the Intersection-over-Union (IoU), which is a well established metric for evaluating semantic segmentation performance, and is well applicable to our map matching. It is calculated as
| (7) |
where is the intersection of grid cells that carry class in both maps:
| (8) |
Accordingly, is the union of all cells that carry class either in the local or global map. Then the semantic mean IoU, , is calculated by averaging over all classes .
We further calculate a matching score for the instances (landmarks). First, the instances between the two maps are associated as follows. For all grid cells of a specific instance ID in the local map, the corresponding cells in the global map at the same locations that carry the same class are considered. The most occurring instance in those cells is taken as match to the local map instance. Then we calculate the matching score (similar to the Panoptic Quality, PQ) as the of each matched instance pair . Similar to above, we further calculate the instance mean IoU, , as the average over all detected instance pairs in the current frame.
Our semantic and instance mean IoUs are employed for calculating a panoptic importance weight. However, a regularizer is applied first. Previous range sensor-based methods suffer from highly peaked likelihood functions, which can lead to overconfident results, converging into local minima. Typically, these methods apply regularizers to reduce the importance of peaks [22]. Instead, we find that our mean IoUs are not peaked enough to be used as a weight directly, leading to a wider spread of particles than desired. Thus, we increase the importance of peaks using an exponential-based regularizer and calculate the weight as
| (9) |
where the free parameter is chosen to be . We have evaluated various choices for the matching metric and regularizers, discussed in Sec. V-F.
III-C2 Perception uncertainty
Our localization algorithm utilizes the prediction of semantic information using camera images. However, these predictions can be wrong, such that taking the corresponding uncertainty into account can be very beneficial for reliable results. We incorporate the predictive uncertainty of Eq. (6) for each grid cell belonging to class by modifying of Eq. (8) as
| (10) |
We utilize this weighted intersection to calculate both and and propagate it to the final particle weight . Hence, predictions with larger uncertainty will receive less importance in the localization.
IV Dataset
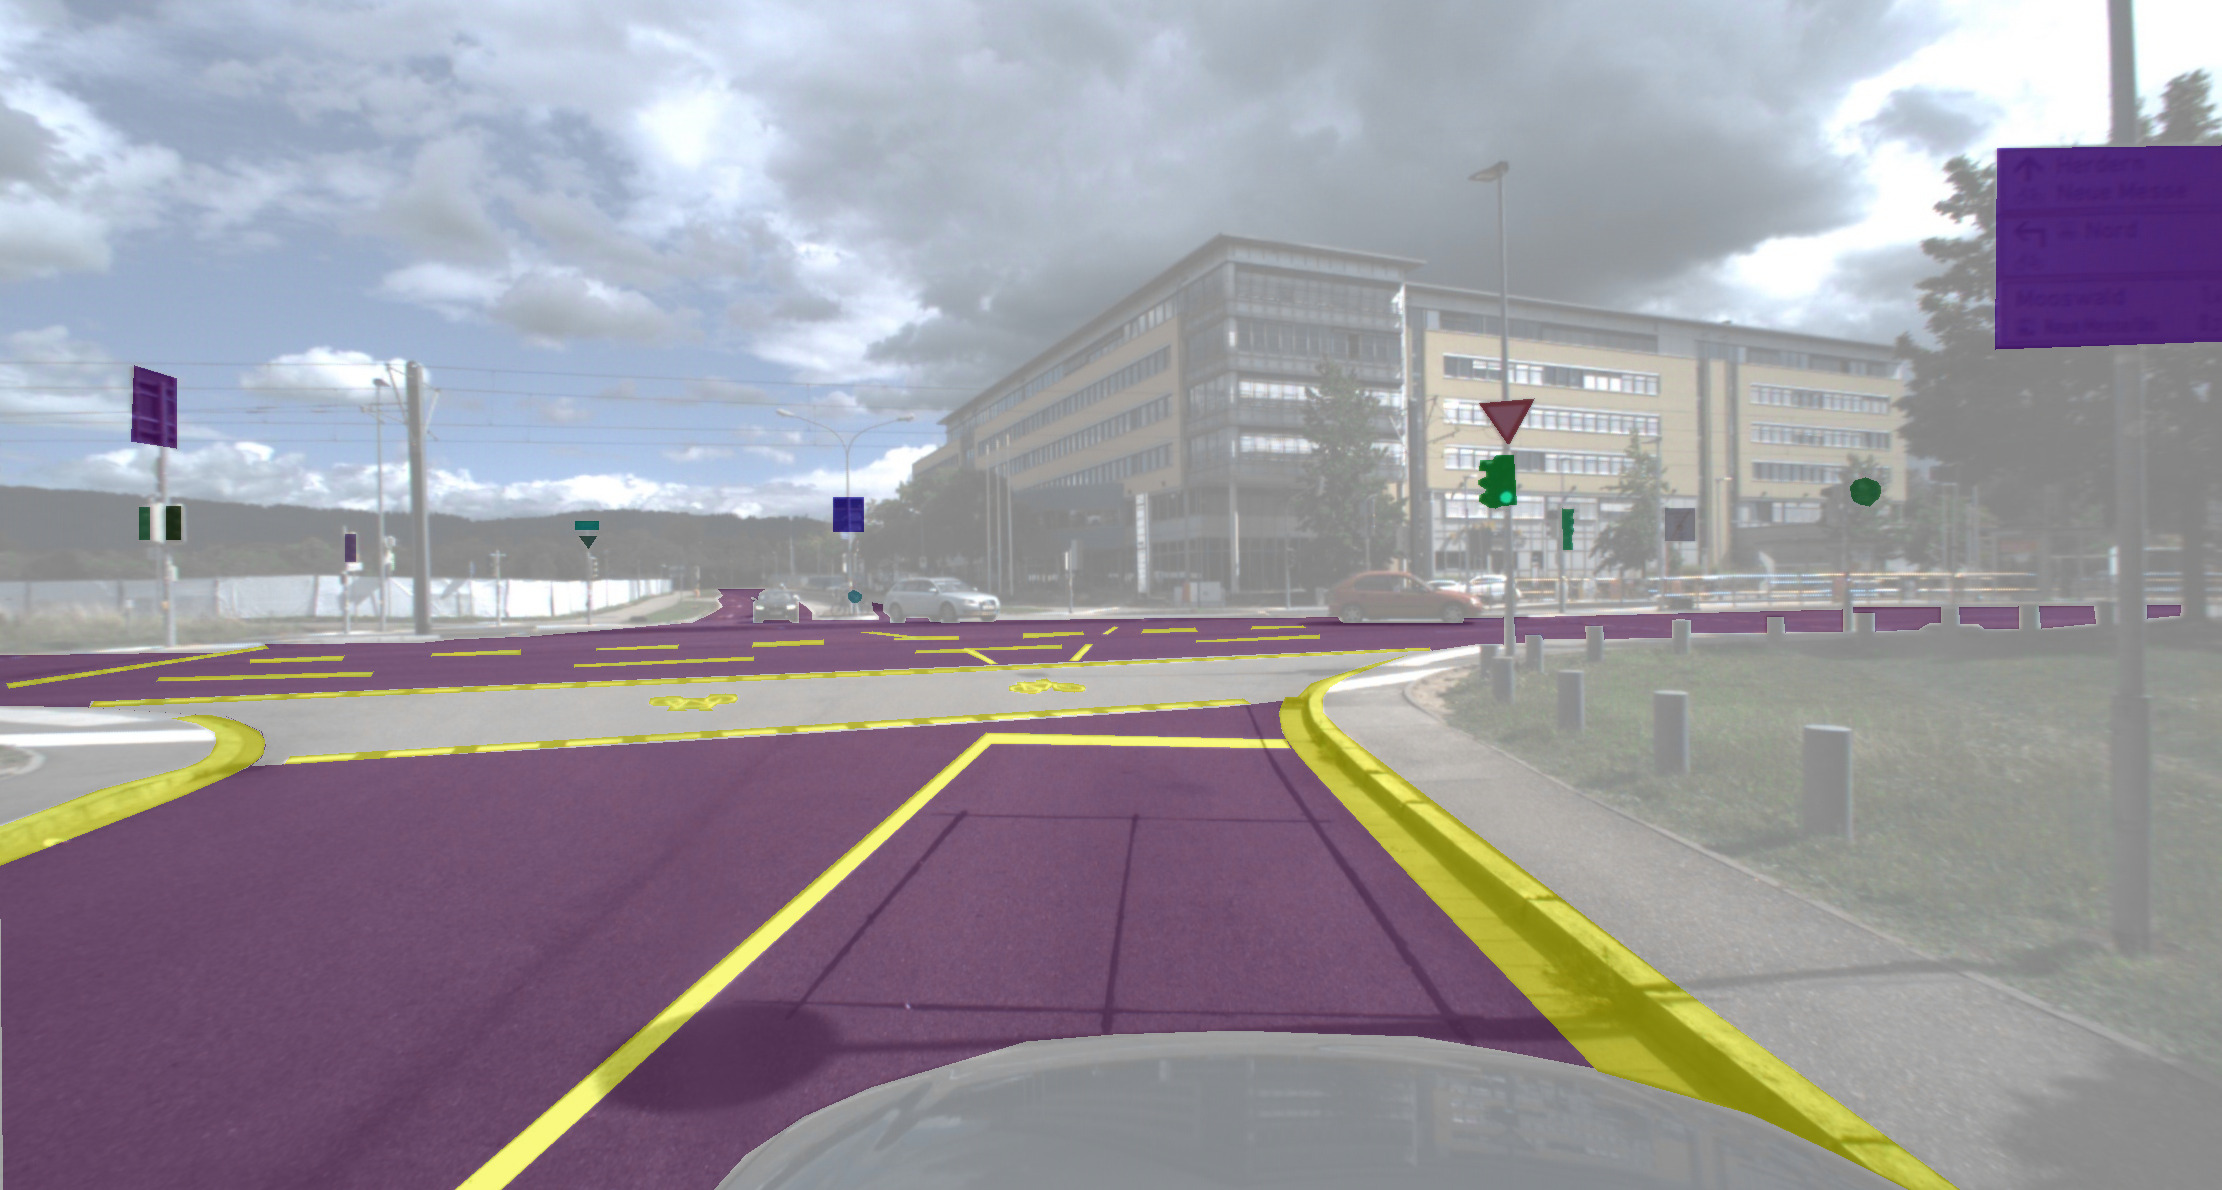
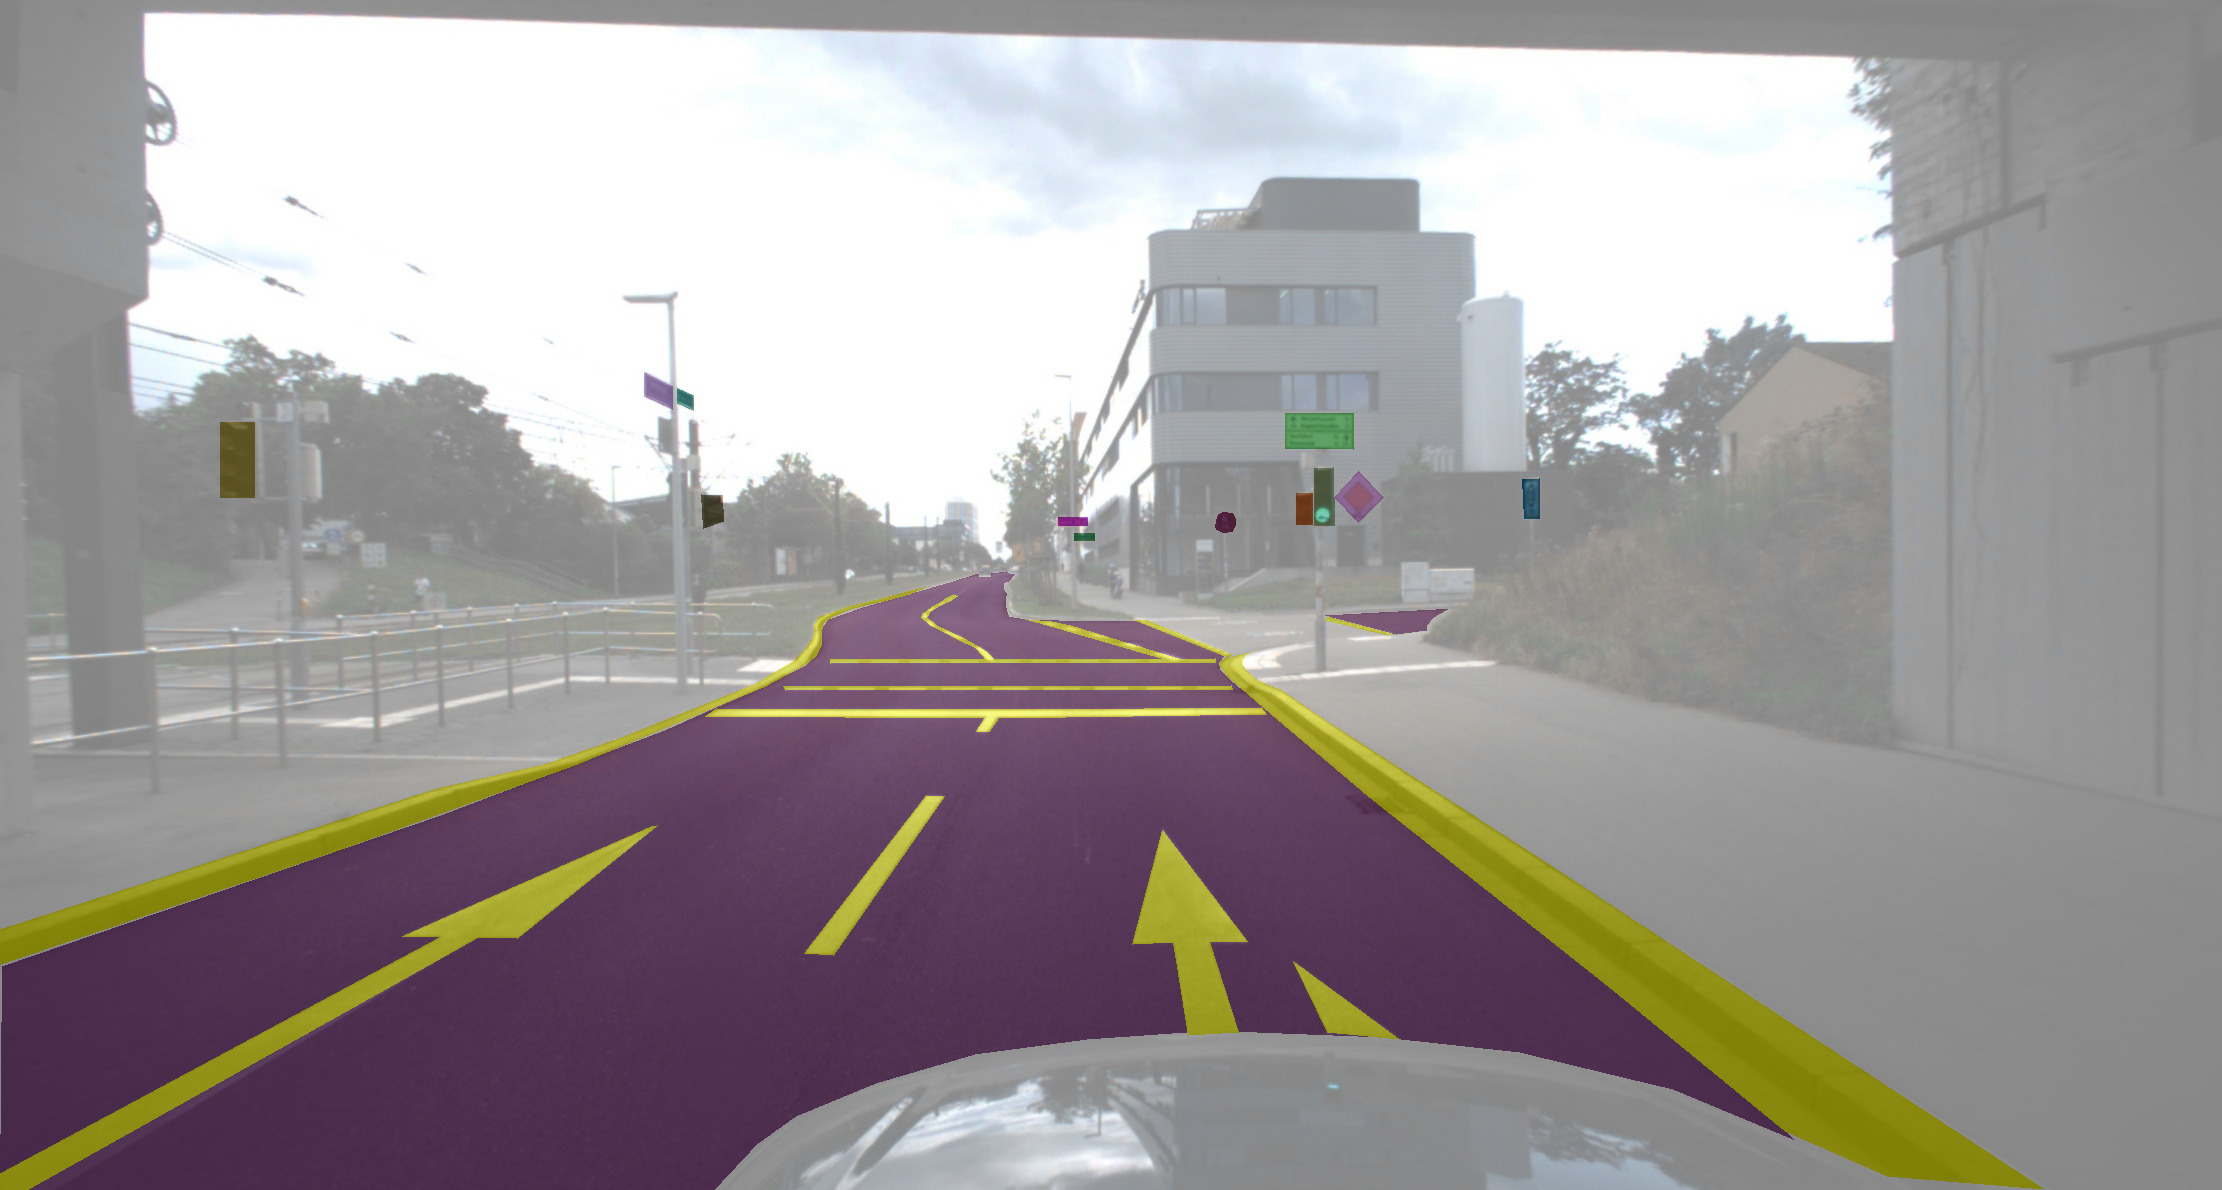
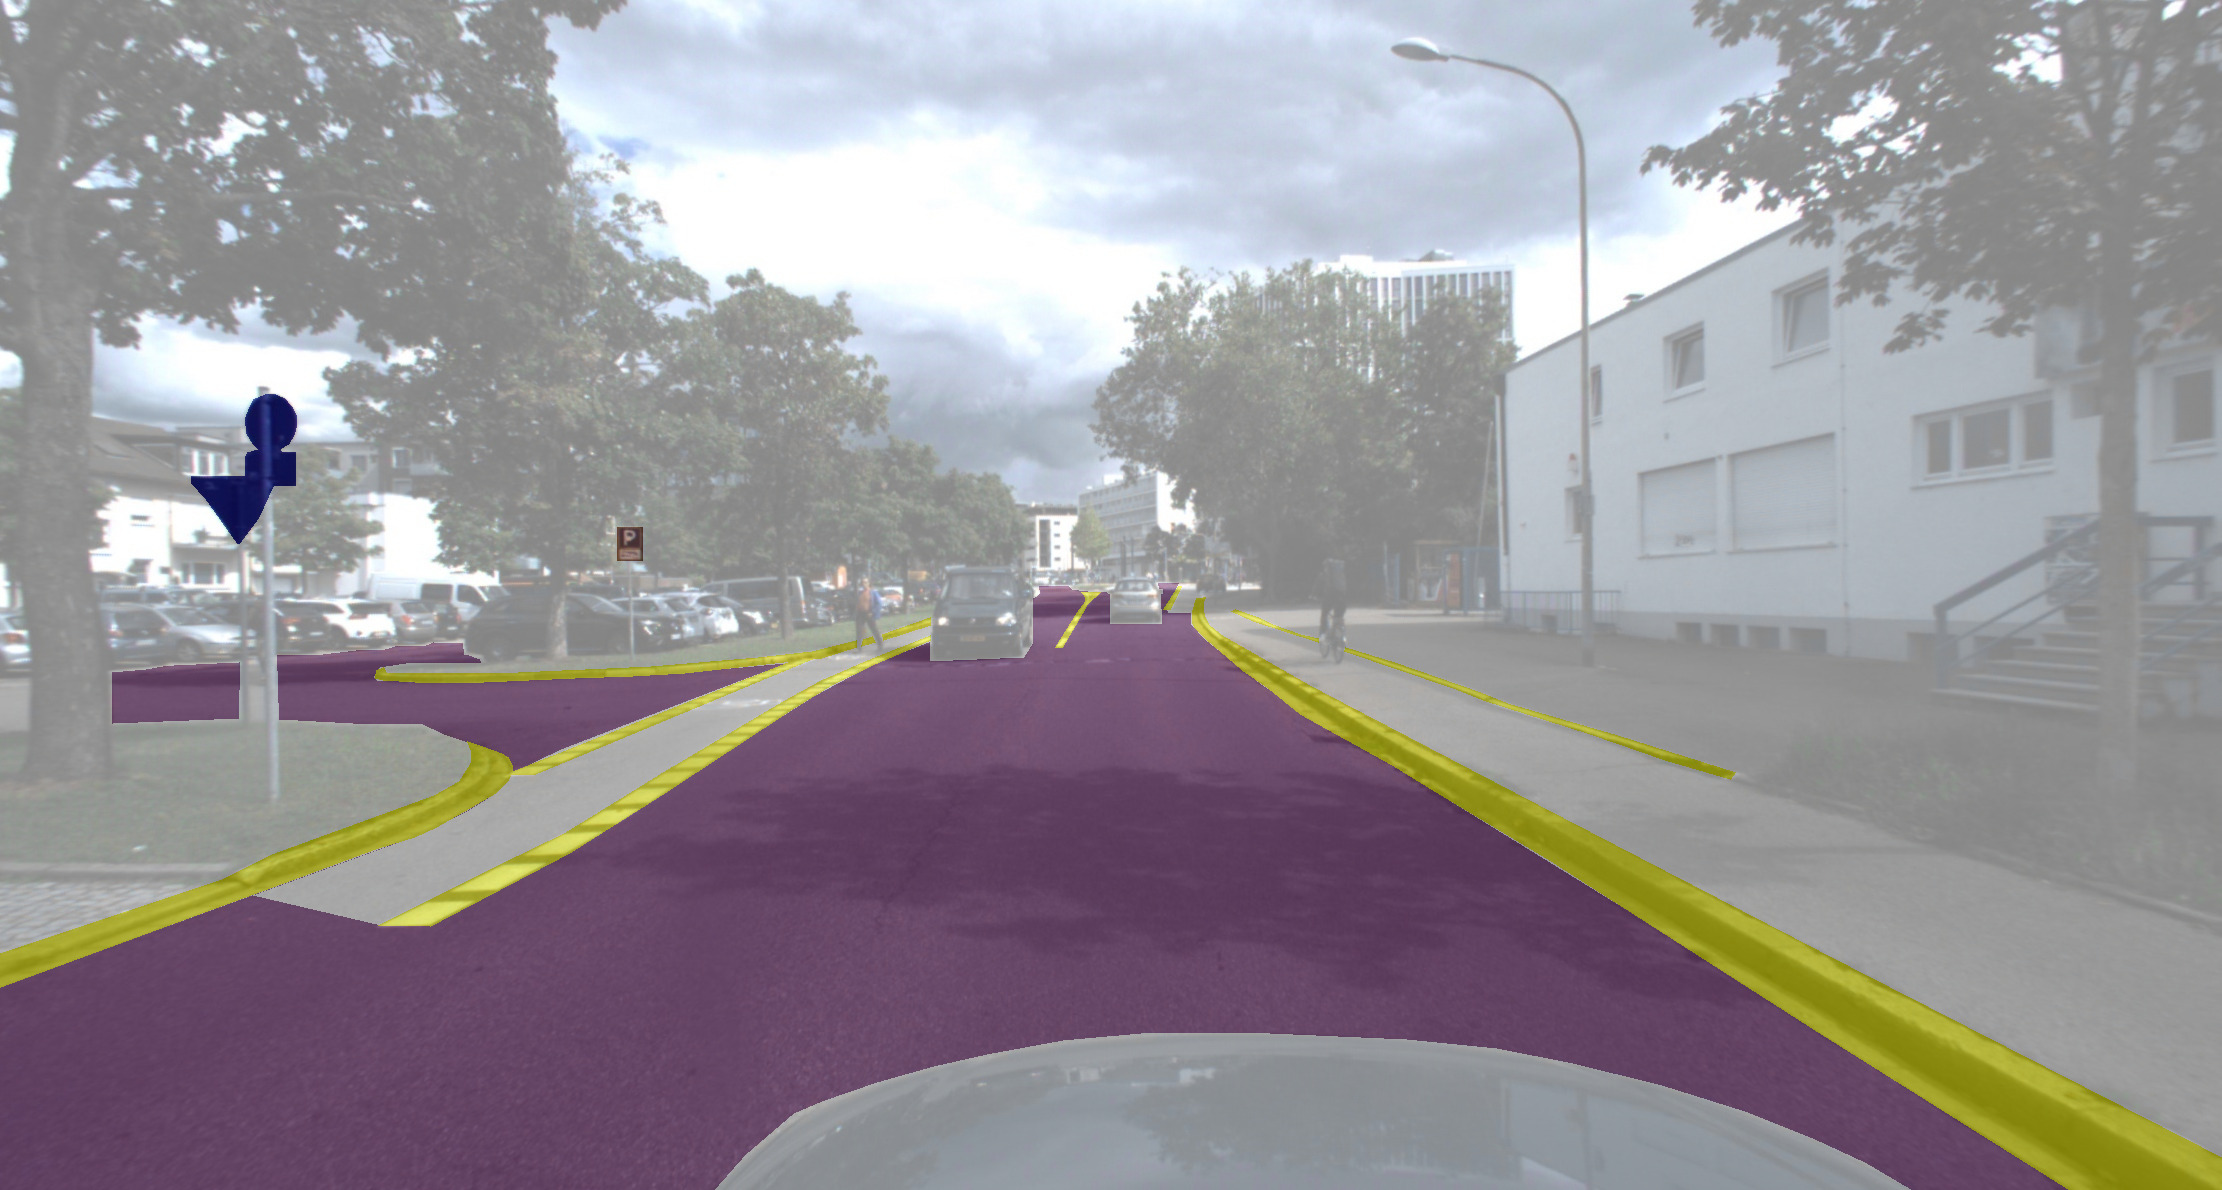
We present the Freiburg Panoptic Driving dataset aiming to foster research in the area of uncertainty-aware panoptic mapping, and downstream tasks, such as localization and planning. The dataset was recorded in the city of Freiburg, Germany and consists of scenarios from main traffic roads and residential areas, collected during two daytime runs and one nighttime run. The data was recorded by our perception car, consisting of time-synchronized Ouster 128 beam LiDAR, Blackfly RGB camera, Applanix GPS/GNSS, and IMU. We further provide high-quality hand-crafted panoptic labels for one fully connected day-time sequence, with the classes drivable area, road marking (including curbs), traffic sign, and traffic light, as detailed in Tab. I. Some of the labeling scenarios are showcased in Fig. 3, in particular the challenging high-density case of intersections. We provide also our uncertainty-aware panoptic map, which we created from the labelled day-time sequence, with the method described in Sec. III-B. Most datasets focus on the perception task. Hence, they either do not provide long driving sequences for testing long term mapping and localization [24] and/or do not provide labeled maps [25]. In contrast, we provide a long labelled sequence together with a ground-truth map, enabling proper evaluation of localization and mapping approaches.
| Raw data frames (3 runs) | Labeled data (1 day-time run) | ||
|---|---|---|---|
| RGB images | 41,047 | Mapped area | 22186.82 m2 |
| LiDAR | 17,524 | Labeled images | 1561 |
| GPS | 183,675 | Labeled classes | 4 |
| IMU | 183,742 | Trajectory length | 2.73 km |
 |
 |
 |
 |
V Experimental Evaluation
V-A Perception training details
Our perception network is trained on a separate dataset to fully test its capabilities for automated mapping in unknown scenarios. For training we chose Mapillary Vistas v2 [26] with the classes drivable area (class IDs We use 13,185 images from the training split with random crops of 19201080 pixels, flipping and scaling in the range from 0.5 to 2.0. Similar to [1], we pre-train the backbone on the ImageNet dataset and use Xavier initialization for the other layers. The network is optimized using stochastic gradient descent for 160 epochs, with a batch size of 8, a momentum of 0.9 and a multi-step learning rate schedule. The evidential learning regularizer is initialized as and increased linearly to a maximum value of 0.8 at epoch 100.
V-B Perception results
We present the results of image panoptic segmentation performance of our network on the Freiburg data in Tab. II. We train our network on the Mapillary dataset and never used any image from Freiburg data during training. We utilize the common panoptic segmentation metrics: Panoptic quality (PQ), Segmentation Quality (SQ) and Recognition Quality (RQ) as described by [5]. In addition, we also compare the semantic segmentation performance for different classes using Intersection-over-Union (IoU).
| Class | PQ | SQ | RQ | IoU |
|---|---|---|---|---|
| Drivable area | 84.0 | 85.5 | 98.3 | 84.4 |
| Road marking | 3.6 | 52.6 | 6.8 | 34.2 |
| Traffic sign | 34.4 | 76.5 | 44.9 | 44.5 |
| Traffic light | 34.3 | 70.2 | 48.9 | 34.4 |
V-C Mapping results
In this section we analyze the performance of our uncertainty-aware panoptic mapping on the Freiburg data. We compare our map against our ground-truth labels (which are not used for training) using the IoU to evaluate the semantic segmentation performance. We additionally provide the PQ for landmarks to evaluate panoptic segmentation performance. For evaluating the calibration of the uncertainty estimation, we utilize the uncertainty-based Expected Calibration Error (uECE) [1], which correlates the predicted uncertainties with the actual accuracy. Moreover, we provide the Root-Mean-Square Error (RMSE) and the Mean Absolute Error (MAE) to evaluate the accuracy of the predicted landmark centers.
We compare our evidential uncertainty-aware map aggregation method against two baselines. The first on does not combine measurements instead, we simply fill and overwrite the map with the latest perception results. The second baseline utilize the log-odds-softmax as suggested by [19]. To this end we train a network without uncertainty estimation capability, use the softmax operation to calculate the predicted probabilities for the log-odds notation, and employ Eq. (6) to calculate the map uncertainty.
The results are presented in Tab. III. Our method performs best for the overall segmentation (mIoU), closely followed by the log-odds-softmax baseline. Using only the latest perception results in the worst segmentation, which can be expected considering the noise in the measurements. However, this method performs best for the uECE metric, showcasing the well-calibrated uncertainty predictions from our perception network. Our evidential aggregation method provides a reasonable uECE, while the log-odds-softmax method provides considerably worse uncertainty predictions.
| Drivable | Marking | Traffic sign | Traffic light | Overall | ||||||||
|---|---|---|---|---|---|---|---|---|---|---|---|---|
| Aggregation method | IoU | IoU | IoU | PQ | RMSE | MAE | IoU | PQ | RMSE | MAE | mIoU | uECE |
| Latest perception | 68.1 | 26.6 | 37.6 | 21.0 | 0.17 | 0.15 | 31.3 | 10.7 | 0.22 | 0.17 | 40.9 | 1.5 |
| Log-odds-softmax | 80.9 | 42.3 | 49.9 | 19.7 | 0.18 | 0.15 | 43.4 | 16.1 | 0.17 | 0.14 | 54.1 | 37.0 |
| Evidential (ours) | 81.2 | 44.3 | 50.8 | 24.0 | 0.17 | 0.14 | 42.2 | 14.2 | 0.19 | 0.15 | 54.6 | 3.0 |
V-D Localization results
We evaluate our localization method on the data that was used for mapping as well and simulate odomotry by adding random noise the ground-truth motion of the vehicle. This way, we were able run multiple experiments and evaluate the statistical standard deviation of our results, which was found to be of the same order as the precision of our results in the following.
We compare our method to a baseline that uses a simplified importance weight calculation, i.e., it uses the semantic IoUk of 7 directly as weight. Further, we add parts of our method step-by-step to arrive back to our final weight calculation. The results are presented in Tab. IV. We provide RMSE and MAE for the lateral (lat), longitudinal (long), total translational (trans) and orientational (yaw) deviations from the ground-truth trajectory.
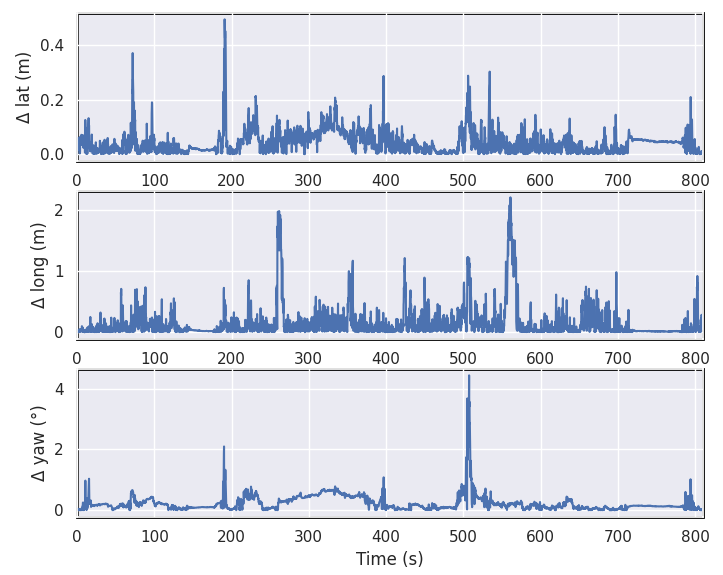
Comparing to the baseline, the regularizer significantly improves the lateral and longitudinal localization accuracy. At this point, the orientational accuracy is already at sub-degree level, and the lateral accuracy is below the grid cell size of 1010 cm2. Adding the perception uncertainty and the instance IoUl (landmarks) both help to significantly improve the longitudinal accuracy further. In particular, the RMSE is decreased when adding the landmarks, indicating a mitigation of spikes in the localization uncertainty. The evolution of the deviation from the ground truth trajectory for a single experiment with our final method is presented in Fig. 4.
| MAE | RMSE | |||||||
|---|---|---|---|---|---|---|---|---|
| Importance weight | trans | lat | long | yaw | trans | lat | long | yaw |
| Semantic mIoUk (baseline) | 0.50 | 0.08 | 0.47 | 0.30 | 1.04 | 0.16 | 1.03 | 0.44 |
| + Regularizer | 0.28 | 0.04 | 0.26 | 0.29 | 0.68 | 0.06 | 0.68 | 0.54 |
| + Perception uncertainty | 0.20 | 0.05 | 0.18 | 0.31 | 0.43 | 0.07 | 0.43 | 0.69 |
| + Instance mIoUl (ours) | 0.18 | 0.05 | 0.16 | 0.31 | 0.35 | 0.07 | 0.34 | 0.59 |
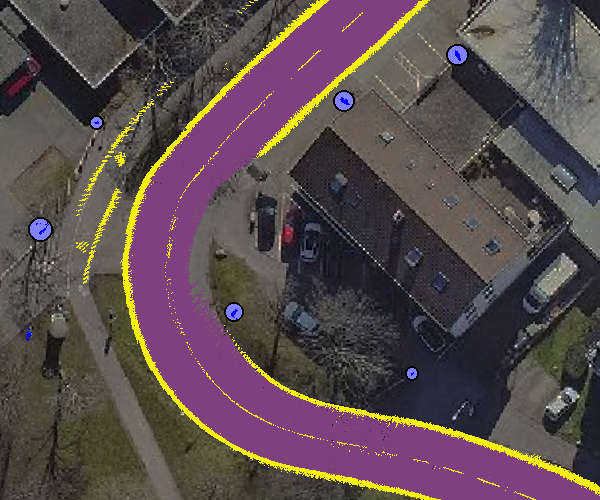
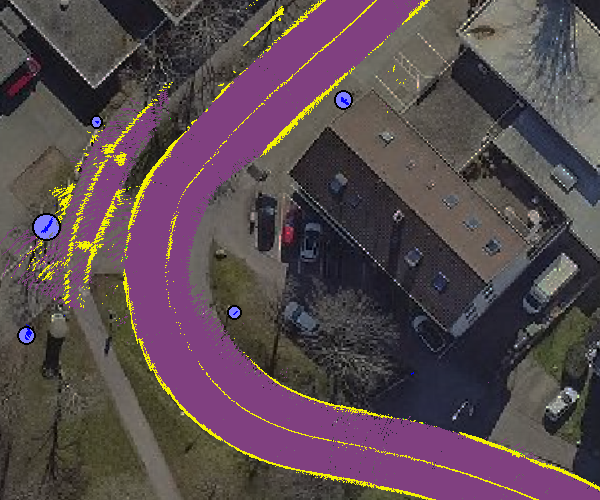
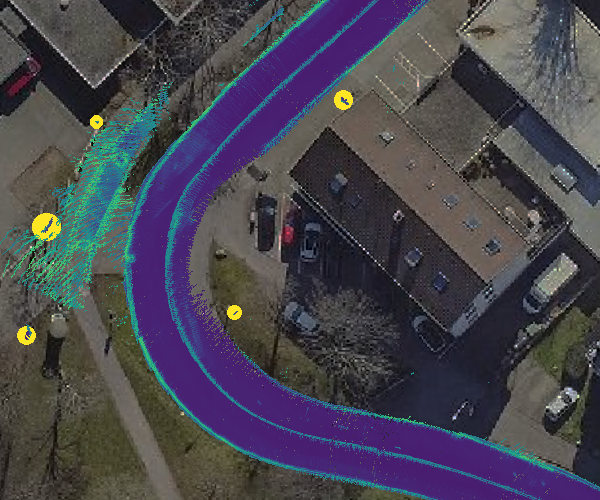
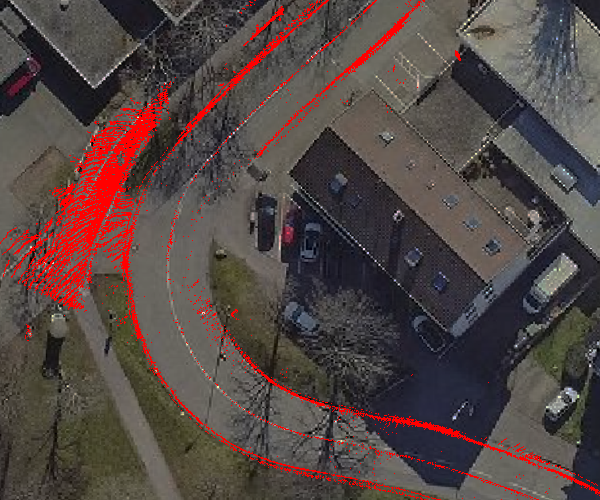
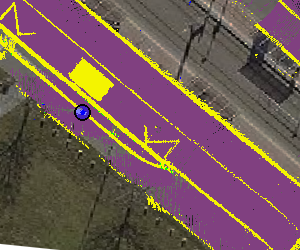
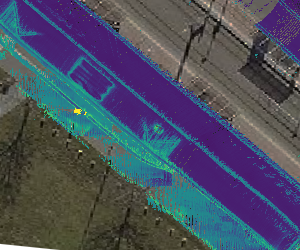
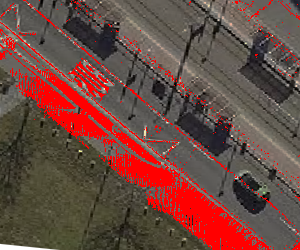
| Ground Truth | Predicted Map | Uncertainty Map | Error Map | |
|
(a) |
|
|
|
|
|---|---|---|---|---|
|
(b) |
|
|
|
|
|
(c) |

|
|
|
|
|
(d) |
|
|
|
|
V-E Qualitative Results
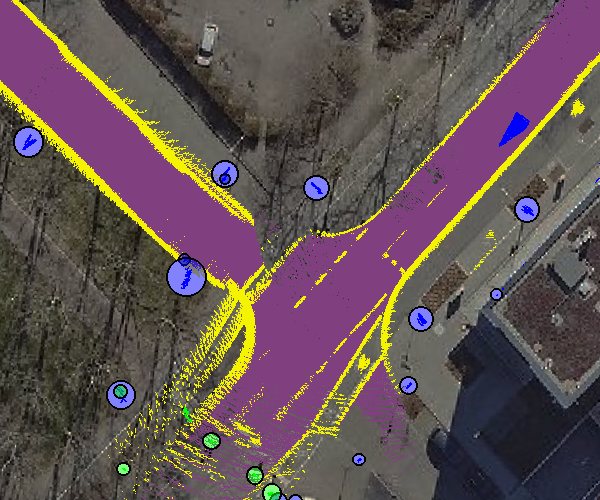
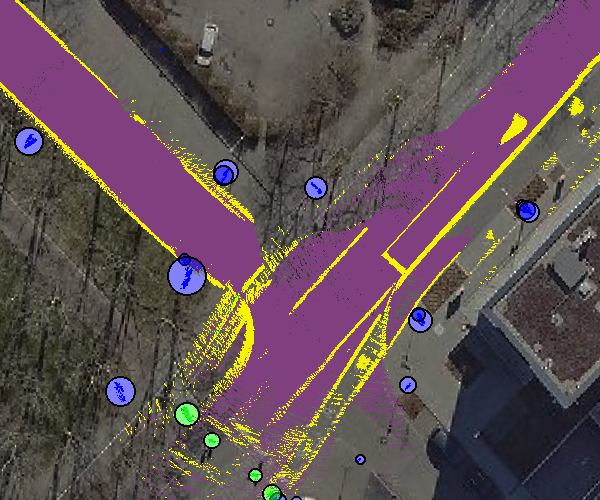
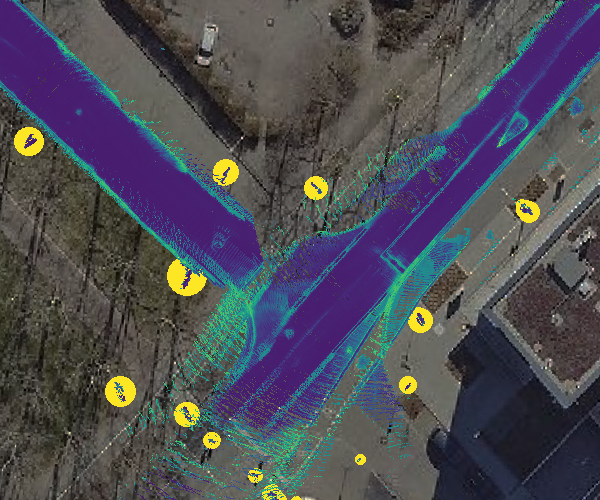
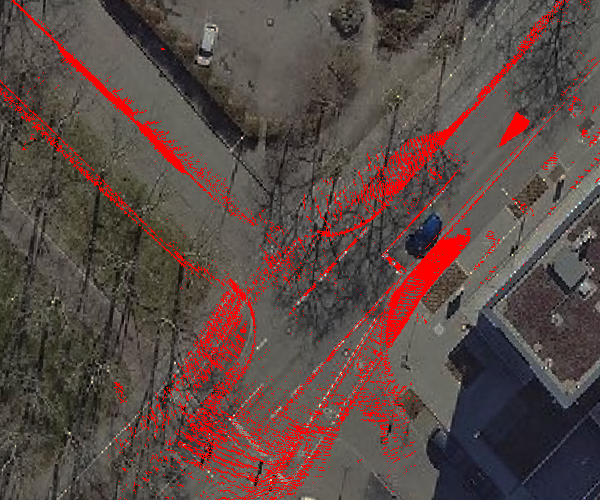
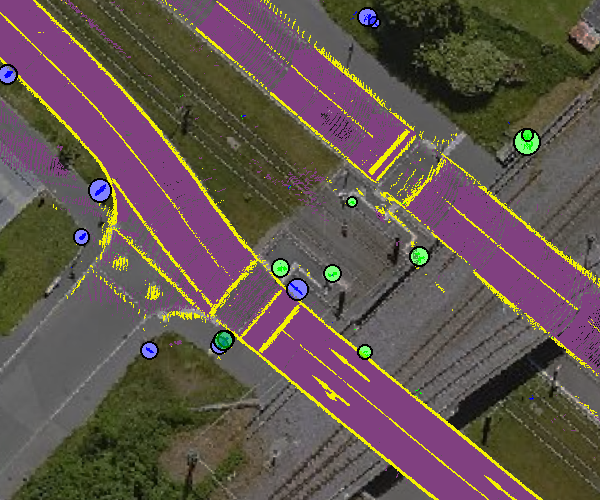
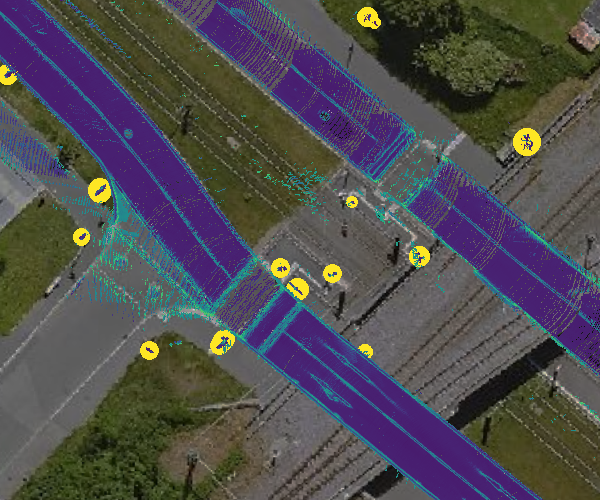
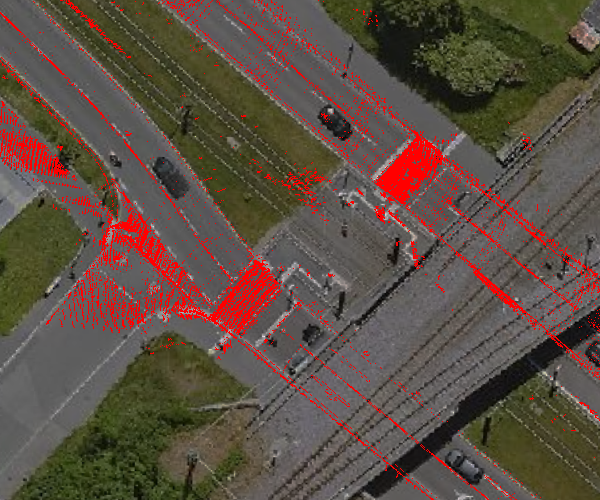
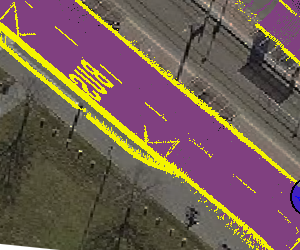
Fig. V-D presents the qualitative results including our ground truth Freiburg map, predicted panoptic map, underlying uncertainty and error map. The traffic signs are depicted in blue color and the traffic lights are depicted in green, with separate instances having a circle around them for better visualization. The error map visualizes the location of wrongly mapped elements. Our Mapping misclassifies surfaces such as bike lane (Fig. V-D(a) and Fig. V-D(b)) and side walk (Fig. V-D(d)) as drivable areas, due to similarity to roads. However, we can clearly see that the our predicted mapping uncertainty are also high in such regions. Similarly, the detailed elements such as the BUS marking in (Fig. V-D(d)), the mapping is not able to properly capture it. However, the uncertainty map showcase the actual boundary of the BUS marking. Overall, the mapping uncertainty showcase high correlation with the error map, validating the quality of uncertainty estimation. Moreover, Fig. V-D also provides insight into the mapping quality of our ground truth Freiburg panoptic map, with detailed boundaries and separate lane segment markings.
V-F Ablation Studies
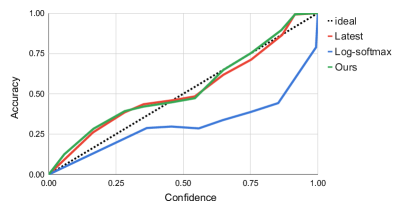
V-F1 Calibration of the Mapping Uncertainties
The ECE metric quantifies the uncertainty estimation performance but does not indicate whether the estimation is over- or under-confident. Thus, we utilize a calibration plot to check whether the softmax-based uncertainty estimation in mapping is also overconfident, as in perception. Fig. 6 is the calibration plot between accuracy and confidence (1 - uncertainty) of the mapping techniques presented in Tab. III. We can see that both the latest perception-based mapping and our mapping stay close to the ideal line. Meanwhile, the log-softmax-based aggregation curve is below the ideal line, with high predicted confidence for lower accuracy, signifying that the map predictions are over-confident, which is generally unsuitable for safe operation. Thus, this map aggregation strategy is prone to prediction uncertainty even for wrong predictions.
V-F2 Weight Selection
In this section, we analyze the effect of using different metrics as particle importance weights in our localization setting. We choose cosine similarity, accuracy, and mean intersection-over-union (mIoU) as base metrics. Tab. V presents the localization results using various metrics. As can be seen, mIoU performs the best out of three metrics. It is because mIoU involves calculating IoU for each class and then taking the direct mean, giving each class equal weight. Accuracy and cosine similarity can overestimate the weights by correctly estimating the persistent class, such as drivable areas, while incorrectly predicting less frequent courses, such as road markings. Thus, particles can have similar weights at multiple locations, leading to less convergence.
| MAE | RMSE | |||
|---|---|---|---|---|
| Weight metric | trans | yaw | trans | yaw |
| Cosine similarity | 1.26 | 0.46 | 1.92 | 0.69 |
| Accuracy | 0.83 | 0.35 | 1.35 | 0.52 |
| mIoU (ours) | 0.50 | 0.30 | 1.04 | 0.44 |
V-F3 Regularizer
In this study, we compare the effect of using different values for the regularizer. Tab. VI depicts the localization results for different values for the regularizer. As we can see, a regularizer value of 10 achieves the best localization performance. The values below 10 still keep some mIoU values between [0,1], thus not significantly affecting the localization. However, higher r leads to better results, verifying our observation that mIoU is not peaked enough for the particle filter to converge. Interestingly, values above 10 lead to worse results, especially signified by high RMSE. We suspect high values lead to overcompensation of mIoU, hence converging to the incorrect locations. Thus, we chose r=10 for our final implementation.
| MAE | RMSE | |||
|---|---|---|---|---|
| Regularizer | trans | yaw | trans | yaw |
| 0.39 | 0.29 | 0.84 | 0.44 | |
| 0.29 | 0.32 | 0.71 | 0.64 | |
| (ours) | 0.18 | 0.31 | 0.35 | 0.59 |
| 0.22 | 0.34 | 0.48 | 0.73 | |
| 0.21 | 0.35 | 0.44 | 0.70 | |
VI Conclusions
In this paper, we proposed uncertainty-aware panoptic Localization and Mapping (uPLAM), a novel approach to utilizing perception uncertainty for long-term panoptic BEV mapping and localization. To this end, we propose model uncertainty-based aggregation of map predictions over time to create a consistent panoptic BEV map, which includes both the surface semantics and the class and the separate instance IDs of the landmarks. Additionally, we compute the mapping uncertainties for all the mapped elements. Moreover, we also proposed a novel particle filter-based localization approach that incorporates the panoptic information and utilizes the predictive uncertainty for importance weight calculation. Finally, we presented a Freiburg Panoptic Driving, which allows for the evaluation of the long-term panoptic mapping and localization. Our proposed approach achieves the best performance on mapping and localization tasks and showcases the efficacy of uncertainty utilization. We hope our work will motivate future works to utilize and explore the prediction uncertainties for other downstream tasks, such as planning with uncertainty-aware maps and reliable integration of deep learning prediction with classical robotics methods.
References
- [1] K. Sirohi, S. Marvi, D. Büscher, and W. Burgard, “Uncertainty-aware panoptic segmentation,” IEEE Robotics and Automation Letters, vol. 8, no. 5, pp. 2629–2636, 2023.
- [2] J. Zürn, J. Vertens, and W. Burgard, “Lane graph estimation for scene understanding in urban driving,” IEEE Robotics and Automation Letters, vol. 6, no. 4, pp. 8615–8622, 2021.
- [3] H. Zhang, S. Venkatramani, D. Paz, Q. Li, H. Xiang, and H. I. Christensen, “Probabilistic semantic mapping for autonomous driving in urban environments,” Sensors, vol. 23, no. 14, p. 6504, 2023.
- [4] M. Büchner, J. Zürn, I.-G. Todoran, A. Valada, and W. Burgard, “Learning and aggregating lane graphs for urban automated driving,” in Proceedings of the IEEE/CVF Conference on Computer Vision and Pattern Recognition, 2023, pp. 13 415–13 424.
- [5] A. Kirillov, K. He, R. Girshick, C. Rother, and P. Dollár, “Panoptic segmentation,” in Proceedings of the IEEE/CVF conference on computer vision and pattern recognition, 2019, pp. 9404–9413.
- [6] A. Milioto, J. Behley, C. McCool, and C. Stachniss, “Lidar panoptic segmentation for autonomous driving,” in 2020 IEEE/RSJ International Conference on Intelligent Robots and Systems (IROS). IEEE, 2020, pp. 8505–8512.
- [7] K. Sirohi, R. Mohan, D. Büscher, W. Burgard, and A. Valada, “EfficientLPS: Efficient lidar panoptic segmentation,” IEEE Transactions on Robotics, vol. 38, no. 3, pp. 1894–1914, 2021.
- [8] B. Cheng, M. D. Collins, Y. Zhu, T. Liu, T. S. Huang, H. Adam, and L.-C. Chen, “Panoptic-deeplab: A simple, strong, and fast baseline for bottom-up panoptic segmentation,” in Proceedings of the IEEE/CVF conference on computer vision and pattern recognition, 2020, pp. 12 475–12 485.
- [9] L. Porzi, S. R. Bulo, A. Colovic, and P. Kontschieder, “Seamless scene segmentation,” in Proceedings of the IEEE/CVF Conference on Computer Vision and Pattern Recognition, 2019, pp. 8277–8286.
- [10] R. Mohan and A. Valada, “EfficientPS: Efficient panoptic segmentation,” International Journal of Computer Vision, vol. 129, no. 5, pp. 1551–1579, 2021.
- [11] N. Gao, Y. Shan, Y. Wang, X. Zhao, Y. Yu, M. Yang, and K. Huang, “SSAP: Single-shot instance segmentation with affinity pyramid,” in Proceedings of the IEEE/CVF international conference on computer vision, 2019, pp. 642–651.
- [12] Y. Gal and Z. Ghahramani, “Dropout as a bayesian approximation: Representing model uncertainty in deep learning,” in international conference on machine learning. PMLR, 2016, pp. 1050–1059.
- [13] M. Sensoy, L. Kaplan, and M. Kandemir, “Evidential deep learning to quantify classification uncertainty,” Advances in neural information processing systems, vol. 31, 2018.
- [14] M. R. Nallapareddy, K. Sirohi, P. L. Drews, W. Burgard, C.-H. Cheng, and A. Valada, “Evcenternet: Uncertainty estimation for object detection using evidential learning,” in 2023 IEEE/RSJ International Conference on Intelligent Robots and Systems (IROS). IEEE, 2023, pp. 5699–5706.
- [15] K. Sirohi, S. Marvi, D. Büscher, and W. Burgard, “Uncertainty-aware lidar panoptic segmentation,” in 2023 IEEE international conference on robotics and automation (ICRA). IEEE, 2023, pp. 8277–8283.
- [16] J. Zürn, I. Posner, and W. Burgard, “Autograph: Predicting lane graphs from traffic observations,” arXiv preprint arXiv:2306.15410, 2023.
- [17] N. Gosala and A. Valada, “Bird’s-eye-view panoptic segmentation using monocular frontal view images,” IEEE Robotics and Automation Letters, vol. 7, no. 2, pp. 1968–1975, 2022.
- [18] X. Chen, A. Milioto, E. Palazzolo, P. Giguere, J. Behley, and C. Stachniss, “SuMa++: Efficient lidar-based semantic slam,” in 2019 IEEE/RSJ International Conference on Intelligent Robots and Systems (IROS). IEEE, 2019, pp. 4530–4537.
- [19] J. Zürn, S. Weber, and W. Burgard, “Trackletmapper: Ground surface segmentation and mapping from traffic participant trajectories,” in 6th Annual Conference on Robot Learning, 2022.
- [20] K. Petek, K. Sirohi, D. Büscher, and W. Burgard, “Robust monocular localization in sparse hd maps leveraging multi-task uncertainty estimation,” in 2022 International Conference on Robotics and Automation (ICRA). IEEE, 2022, pp. 4163–4169.
- [21] F. Dellaert, D. Fox, W. Burgard, and S. Thrun, “Monte carlo localization for mobile robots,” in Proceedings 1999 IEEE international conference on robotics and automation (Cat. No. 99CH36288C), vol. 2. IEEE, 1999, pp. 1322–1328.
- [22] P. Pfaff, W. Burgard, and D. Fox, “Robust monte-carlo localization using adaptive likelihood models,” in European robotics symposium 2006. Springer, 2006, pp. 181–194.
- [23] A. Malinin and M. Gales, “Predictive uncertainty estimation via prior networks,” Advances in neural information processing systems, vol. 31, 2018.
- [24] H. Caesar, V. Bankiti, A. H. Lang, S. Vora, V. E. Liong, Q. Xu, A. Krishnan, Y. Pan, G. Baldan, and O. Beijbom, “nuscenes: A multimodal dataset for autonomous driving,” in Proceedings of the IEEE/CVF conference on computer vision and pattern recognition, 2020, pp. 11 621–11 631.
- [25] J. Mei, A. Z. Zhu, X. Yan, H. Yan, S. Qiao, L.-C. Chen, and H. Kretzschmar, “Waymo open dataset: Panoramic video panoptic segmentation,” in European Conference on Computer Vision. Springer, 2022, pp. 53–72.
- [26] G. Neuhold, T. Ollmann, S. Rota Bulo, and P. Kontschieder, “The mapillary vistas dataset for semantic understanding of street scenes,” in Proceedings of the IEEE international conference on computer vision, 2017, pp. 4990–4999.