Matter-wave interferometers with trapped strongly interacting Feshbach molecules
Abstract
We implement two types of matter wave interferometers using trapped Bose-condensed Feshbach molecules, from weak to strong interactions. In each case, we focus on investigating interaction effects and their implications for the performance. In the Ramsey-type interferometer where the interference between the two motional quantum states in an optical lattice is observed, inter-particle interactions are found to induce energy shifts in the states. Consequently, this results in a reduction of the interferometer frequency and introduces a phase shift during the lattice pulses used for state manipulation. Furthermore, non-uniformity leads to dephasing and collisional losses of condensate contribute to the degradation of contrast. In the Michelson-type interferometer, where matter waves are spatially split and recombined in a waveguide, interference is observed in the presence of significant interaction, however coherence degrades with increasing interaction strength. Notably, coherence is also observed in thermal clouds, indicating the white-color nature of the implemented Michelson interferometer.
I Introduction
Since the first demonstration of Bose-Einstein condensate (BEC) interference [1], BECs have emerged as an important source for interferometry [2, 3] and many matter-wave interferometers using BECs have been implemented in a large variety of configurations. Here we focus on interference with trapped atoms in different motional states. Examples include interference in waveguides [4, 5, 6, 7, 8, 9], in double-wells [10, 11, 12, 13, 14, 15], multiple transverse motional states [16, 17] and Talbot effect [18, 19, 20]. Unlike optical interferometers, trapped matter-waves experience particle-particle interactions that, on one hand result in phase shifts limiting the system’s coherence time [21, 22, 23, 24], but on the other hand allow to probe and characterize many-body systems and their dynamics [25, 26, 27, 28, 29]. By suppressing the strength of interaction, long coherence times have been achieved [30, 31]. In addition, these interactions induce quantum properties like squeezing and entanglement, beneficial for precision metrology [13, 14, 15]. Controlling the splitting process squeezing and entanglement can be enhanced [32, 33]. All these experiments are conducted with weakly interacting systems where the scattering length is small compared to the unitary limit. In our present work, we study interference in systems of strongly interacting particles with large scattering lengths. 6Li2 Feshbach molecules are particularly well-suited for research within the strongly interacting regime, due to their minimal losses from inelastic collisions [34, 35].
In the experiments presented here, we implement and study two distinct matter-wave interferometer schemes: Ramsey and Michelson interferometers, with strongly interacting 6Li2 Feshbach molecules. We particularly focus on the effects of inter-particle interactions on interferometer performance – frequency, phase shift, read-out contrast, and coherence. The measurements are compared with numerical simulations and calculations based on the experimental parameters. In addition, we observe interference and coherence in the Michelson interferometer scheme with non-condensed, thermal Feshbach molecules.
Both interferometer schemes are implemented in our 6Li experimental apparatus, described with full details in Ref. [36]. The configurations in both schemes are highly similar. In both experiments, we start with a BEC of 6Li2 Feshbach molecules and set the inter-particle interaction strength over a range by tuning the -wave scattering length via the Feshbach resonance [37]. A Feshbach molecule is formed by two lithium atoms in the lowest hyperfine states and . The molecular condensate is confined in a hybrid trap formed by an optical dipole potential produced by a red-detuned laser beam and a magnetic confinement in the horizontal plane originating from magnetic field curvature. The trap is elongated with axial and radial frequencies of 18.5 Hz and 80 Hz, respectively. A pair of 1064 nm laser beams crossing at an angle of 15∘ form an optical lattice potential with a lattice spacing of and its wave vector oriented in the axial direction of the mBEC. The optical lattice depth can be modulated in pulses to manipulate particle states and stabilized at a constant value to enable the study of the evolution of superposition states in the Ramsey interferometer.
II Ramsey Type Interferometer
II.1 Experimental implementation
In the Ramsey interferometer scheme, two Bloch bands within the optical lattice are utilized: the ground band and the second excited band , conceptualized as a spin-1/2 system [17]. The lattice depth, calibrated through Kapitza-Dirac (KD) scattering, is set at . Here, denotes the characteristic energy of the lattice, with the wave vector of the optical lattice, the lattice spacing, and the molecular mass. For the chosen experimental parameters, the bandwidths of and are significantly smaller than the energy gap between them, as detailed in Fig. 1a. Therefore, the broadening of the band transition due to the quasi-momentum distribution is not considered further.
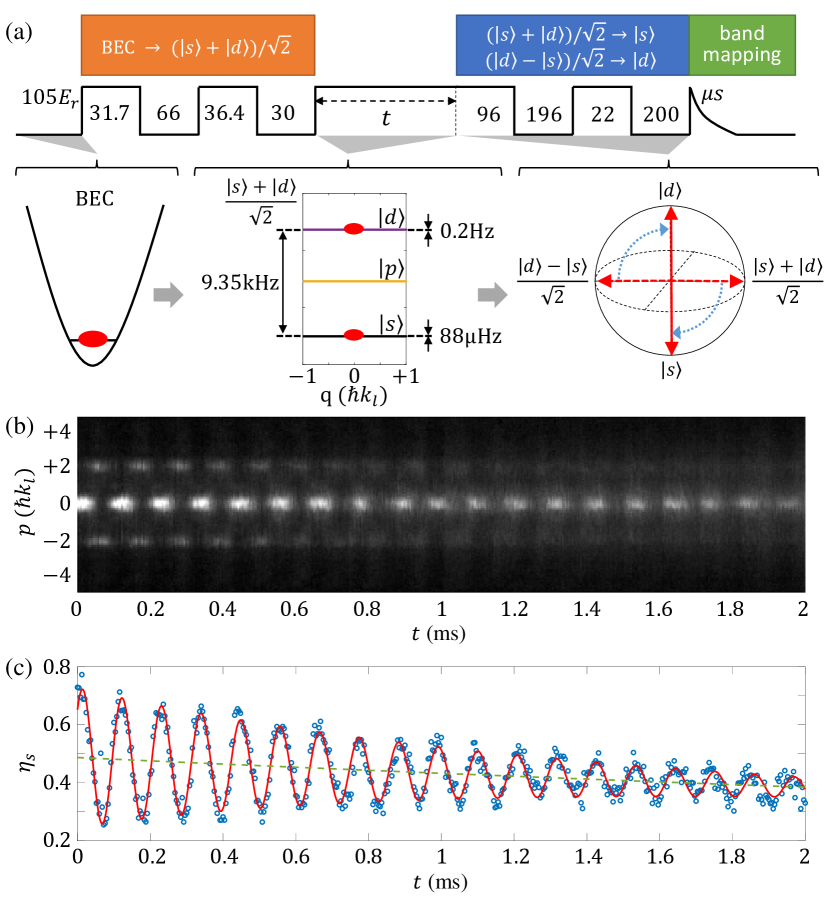
Initially, a nearly pure condensate with negligible thermal component is prepared, comprising 3500 to 9500 Feshbach molecules. The variation in particle numbers results from different loss rates, influenced by inter-particle interaction. Using a short-cut loading method [38], as shown in Fig. 1a, the BEC in the ground state of a weak harmonic confinement is transformed into the superposition state within the optical lattice using two lattice pulses. Instead of first loading the BEC into the state and then sequentially executing a rotation, this combined operation is found to be more robust and efficient. The lattice pulse sequence, tailored for maximum operation fidelity under non-interacting conditions, can achieve up to 98.4% fidelity based on calculations. For further details on the calculations of pulse sequence, see our previous work [36]. The superposition state is maintained in the optical lattice for a variable interference time . A subsequent two-pulse operation then transfers the state to and the to . Immediately afterward, the state occupation is read out using the band mapping [39]. After an adiabatic opening of the lattice and a time-of-flight (TOF), particles in different states separate and are detected via standard absorption imaging.
II.2 Interaction effects in Ramsey interferometer
We first perform the Ramsey interferometer experiment with a molecular number and an inter-molecular scattering length . Here, denotes the Bohr radius. Unless specified otherwise, refers to the -wave scattering length between molecules, approximately 0.6 times the scattering length between the two constituent atoms in different spin states [34]. Fig. 1b displays a time carpet showing the oscillating occupations of the and states over the interference time, which evidences the Ramsey interference. Particles in the state occupy the central zone (the first Brillouin zone), while those in the state appear around . The proportion of particles in the state, denoted as , is determined by the ratio , where is the number of particles found in the first Brillouin zone and is the total particle number at that time. Fig. 1c shows a damped oscillation of as a function of the interference time , with its fitting curve by the function
| (1) |
In the analysis of our experimental data, we focus on the following key parameters extracted from fitting the observed interference patterns:
1) Interference frequency : The interference frequency is determined to be kHz. Compared to the case of zero interaction where the energy gap is calculated to be kHz, the and states are subject to different energy shifts due to interactions. Because of the broader localized wave functions in higher states, the energy level of the state shifts upward to a greater extent than the state, resulting in a reduced energy gap under stronger interactions. Accounting for interactions, the calculated energy gap shifts to 9.066 kHz, which is in good agreement with our experimentally measured value. The differential energy shift between the two states can also be interpreted as an effective reduction of the lattice depth due to the interactions counteracting the lattice potential, which has been demonstrated in our previous work by observing the slowing-down effect in the time evolution of the momentum mode populations under strong interactions [36]. The variation of interference frequency relative to interactions will be further explored in Sec. II.3-II.4 and summarized in Fig. 3.
2) Phase shift : We observe the emergence of an additional phase shift, determined to be based on the fit results. The lattice pulse sequences are designed to align the two operations (the first operation is implicit in the first two-pulse sequence) under the condition of vanishing interaction, setting the initial phase to zero. Nonetheless, interactions occurring during the lattice pulses can introduce a phase shift in the diffraction processes. The variation of phase shift relative to interactions will be discussed in Sec. II.3 and summarized in Fig. 4a.
3) Maximal contrast : The contrast of the interference pattern is peaked at , determined to be 0.44(3). The reduction of is primarily attributed to collisional losses of condensed particles, which in turn attenuates the read-out signal. Particles in motion exhibit random scattering during elastic collisions; notably, when two groups of particles with distinct momenta begin to spatially separate during TOF, the collisions lead to a diminished peak in the most populated condensate. Additionally, throughout the state manipulation pulse sequence, particles transiently occupy higher energy states, and those in excited states may undergo inelastic collisions, transitioning to lower states and thereby losing coherence. Moreover, imperfections in the state preparation also contribute to the reduced contrast, especially at very strong interactions. These imperfections stem from the fact that the lattice pulse sequences for state manipulation are designed without considering interactions. As interaction strength increases, a minor imbalance between the and states, along with slight occupations on higher momentum modes, are expected. While the imperfection of state preparation is not remarkable under the conditions presented in Fig. 1, it presents a certain significance at stronger interaction strengths. The variation of maximal contrast relative to interactions will be discussed in Sec. II.3 and summarized in Fig. 4b.
4) Contrast decay rate : The interference contrast experiences an exponential decay over time, characterized by a contrast decay rate . This decay primarily arises from the non-uniform density distribution of particles across lattice sites, resulting in varying energy shifts for particles within the cloud. When averaging the read-out across the entire cloud, this dephasing process leads to a gradual reduction in interference contrast, particularly noticeable under strong interactions. Collisional losses also play a role in the decay of contrast at strong interactions. In addition to the dephasing effect and the collisional losses, other mechanisms contributing to contrast decay under weak interactions have been explored in Ref [17]. Their study demonstrated that radial dynamics, such as cloud expansion following shortcut loading, and intensity fluctuations of trapping lasers, significantly accelerate contrast decay. They also identified thermal fluctuations as the primary mechanism for contrast decay, which cannot be suppressed by the echo technique, while quantum fluctuations have only a moderate effect. The variation of contrast decay rate relative to interactions will be discussed in Sec. II.3 and summarized in Fig. 4c.
5) Parameters describing the monotonically decreasing offset: , , and . This offset occurs because an increasing number of particles are scattered into a broad background distribution due to collisions, leading to a downward shift in the oscillation signal’s center. The green dashed curve in Fig. 1c depicts this offset decay, mathematically represented by the expression .
II.3 Ramsey interference at varying interaction strengths
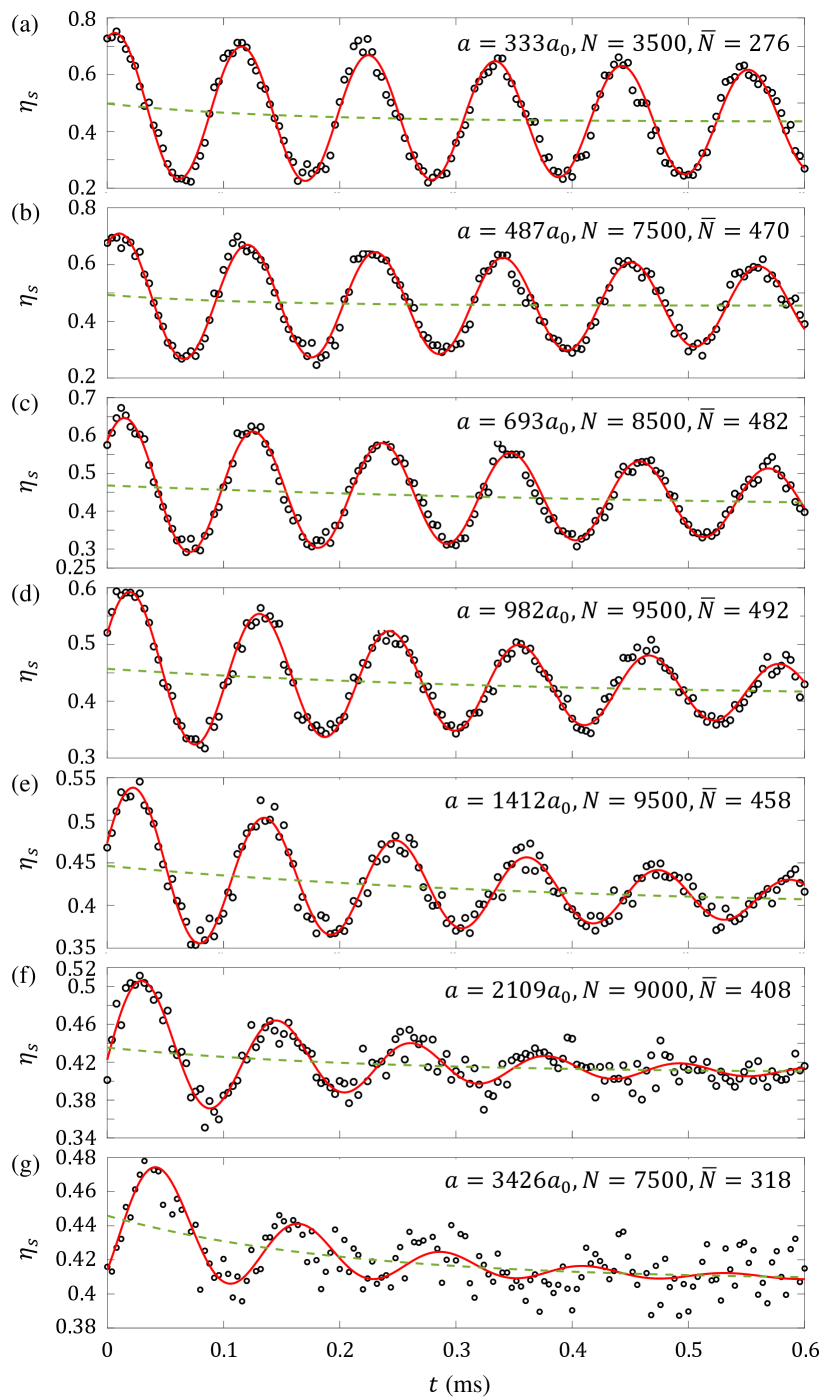
To further explore the interaction effects, we perform additional Ramsey interferometric measurements over a range of scattering lengths from to , by adjusting the magnetic field near a Feshbach resonance. The measured interference signals are shown in Fig. 2. It is important to note that the initial conditions differ across datasets due to changes in the BEC ground-state spatial profiles and particle loss rates with varying interactions. For each dataset, the inter-particle scattering lengths , the total molecule numbers , and the corresponding weighted-average number per lattice site (, where is the site index) are provided in the figure. Continuing with the methodology outlined in Sec. II.2, we fit the experimental data using damped oscillations, shown as red curves in Fig. 2. From these fits, parameters such as , , , and are determined. In this study, we primarily focus on examining how the interference frequency varies in response to changes in the inter-particle interaction strengths and comparing our measurement results with theoretical calculations. As for other parameters, we limit ourselves to presenting measurement results without conducting related calculations. This is due to the difficulty of modeling collisional losses. In the following discussion of parameters, the paragraph numbering for corresponding parameters continues from Sec. II.2.
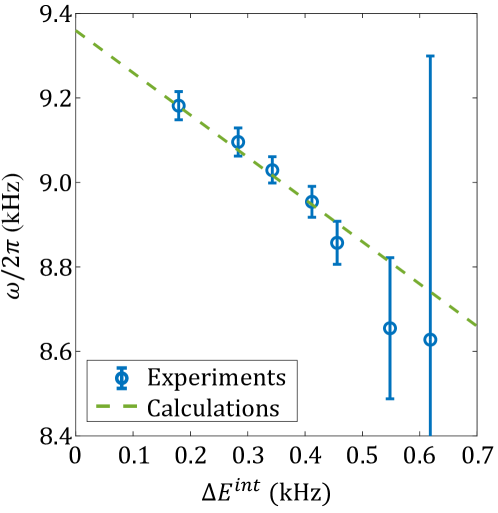
1) The interference frequency is found to decrease with increasing interaction strength. In Fig.3, the measurements are presented against the calculated differential energy shift between the and states due to interaction, denoted as . The observed frequency changes are minimally affected by collisional losses, directly reflecting the shifts in energy levels within the optical lattice induced by interactions. A dashed line indicates the expected interference frequency based on the energy gap at zero interaction and the calculated energy shifts, aligning well with the experimental measurements within the margin of error. Further details about the calculations are provided in Sec.II.4.
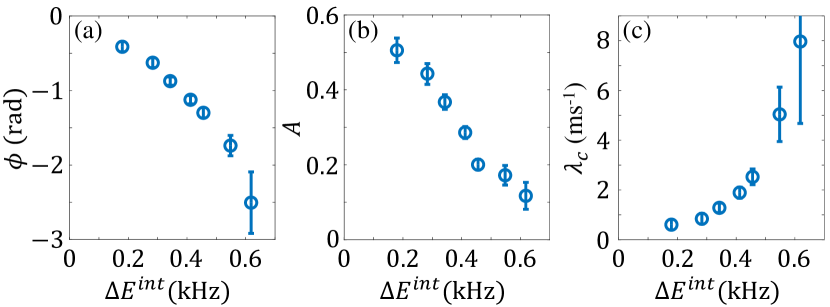
The interaction energy is a uniform parameter related to interaction strength, that compensates for variations in ground state sizes and particle numbers across the different implemented scattering lengths. Therefore, we will also present the results for other parameters in relation to the calculated differential energy shift , as shown in Fig. 4.
2) The phase shift becomes more pronounced as the interaction strength increases, as shown in Fig. 4a. The sequential pulses, designed to result in zero differential phase in the absence of interaction, introduce additional phase shifts due to energy shifts at finite interaction strengths. This observation is consistent with previous findings [40, 20]. When extrapolating the curve along its trend, we observe an intercept close to zero, aligning with the intended behavior of the pulse sequence designed for zero interactions.
3) The maximum contrast is observed to decrease as the interaction strength increases, as shown in Fig. 4b. This reduction is mainly attributed to the increased collisional losses and imperfections in the initial state under strong interactions. Interference measurements are significantly constrained under strong interactions, as particles initially occupying the condensate peaks are scattered into the background, resulting in a reduction of the signal-to-noise ratio.
4) The contrast decay rates are enhanced under strong interactions for the reasons stated in Sec. II.2. The dephasing due to non-uniformity and collisional losses play crucial roles in the contrast decay under strong interactions. Based on the observed trend of the data points, we anticipate minor contrast decay at zero interaction strength.
II.4 Numerical calculations
Using the Bloch theorem [41], the single-particle spectrum and eigenfunctions in a one-dimensional (1D) optical lattice can be simply calculated. The energy band structure at a lattice depth of with an interaction strength of zero is illustrated in Fig. 1a. Here, the energy gap between the and states amounts to , and it serves as the reference for the following calculations. We proceed to calculate the differential energy shifts of these two states relative to , thereby obtaining the energy gap at a specific interaction strength. The energy gap between the two states directly determines the interference oscillation frequency.
In the deep lattice limit, a condensate in a 1D optical lattice can be described by the 1D discrete nonlinear Schrödinger equation (DNLS) [42]. Under the tight-binding approximation (TBA) [43], the system behaviors are described by the localized wave function in each lattice site
| (2) |
where and denote the particle number and the phase at the th lattice site. The spatial wave function,
| (3) |
is factorized into a product of a Wannier function (in the axial direction ) and a 2D Thomas-Fermi wave function (in the radial direction). Considering that the lattice loading time is significantly shorter than the timescale associated with the radial trap frequency, we assume that remains the cross-sectional profile at of the pre-lattice 3D BEC wave function, which is determined by the pre-lattice potential geometry, the total particle number , and the scattering strength . The interaction chemical potential at the th lattice site is calculated as
| (4) |
and it determines the energy shift of the state due to interaction. Here .
We now consider a system containing both the and states, each with a particle number of . We extend this theoretical framework to independently calculate the energy shifts in these two states, with their difference yielding the differential energy shift at the th lattice site, denoted as . Given our experimental conditions, we neglect the coupling between the and states due to the minimal spatial overlap between them. There is a marked difference in magnitudes: is two orders of magnitude smaller compared to both and , where is the Wannier function of the () state. Additionally, we assume that remains consistent for the two states.
To evaluate the interaction effect throughout the entire cloud, we calculate the weighted-average differential interaction energy as
| (5) |
III Michelson Type Interferometer
III.1 Experimental implementation
A Michelson-type interferometer in a waveguide is also implemented, investigating the interference phenomena occurring between spatially separated paths. The splitting and recombining of a molecular condensate are achieved by Kapitza-Dirac (KD) scattering pulses. During the process between splitting and recombination, the two emerging clouds undergo half an oscillation in the weak harmonic potential along the wave guide. A differential phase shift between two separated arms of the interferometer is introduced by a magnetic field gradient pulse. The operation adheres to the procedure outlined in pioneering works [4, 5, 6, 7, 8, 9], with a key distinction in our interferometer: the matter waves consist of Feshbach molecules, exhibiting significant interactions. An additional feature of the Michelson interferometer in comparison to the Ramsey interferometer, is the relative bulk motion of the wave packets. With the Michelson scheme, one has the opportunity to look into the collisional loss during the passage of the wave packets through each other, and its effect on coherence.
The experimental setup employs an mBEC consisting of 6000 Feshbach molecules, with the scattering length between molecules ranging from to . The processes of splitting, phase shifting, recombining, and detecting the matter waves are illustrated in Fig. 5a. The interference occurs within a waveguide potential given by . Initially at rest, the condensed molecules are exposed to two sequential KD scattering pulses. The lattice depth during this process is maintained at . This process, following the Newton’s cradle experiment [44], splits the molecules into two momentum modes along the waveguide. After the splitting, the two matter-wave packets separate along the waveguide and ascend the axial harmonic potential.
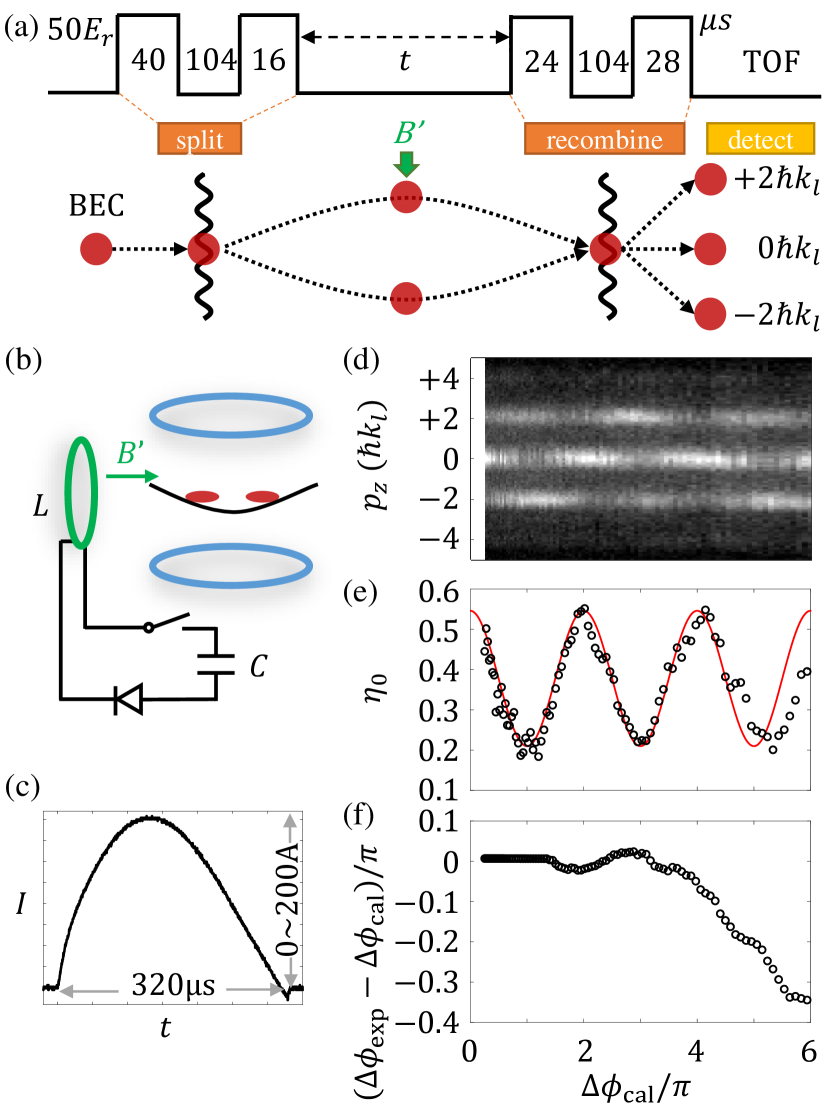
To demonstrate interference and controllability, a differential phase shift is introduced between the two arms of the interferometer when the two matter-wave packets are at their maximum separation of . This phase shift is induced by a magnetic field gradient pulse, generated by an electrical current pulse flowing through a gradient coil, whose central axis is aligned with the interferometer arms. The coil setup used in our Michelson interferometer experiment is shown in Fig. 5b. The gradient coil, in conjunction with a precharged capacitor, forms an LC resonant circuit. A diode is integrated into the circuit in series to ensure unidirectional current flow. Each time the circuit is closed, it produces a pulse of a field gradient along the waveguide that lasts for half of an LC oscillation cycle, as shown in Fig. 5c. The duration of the pulse, determined by the capacitance and inductance, remains constant throughout the experiment. The pulse strength, which is adjusted by varying the charging voltage applied to the capacitor, determines the differential phase shift. The separation between the two packets is considerably larger than their individual sizes, and the duration of the field gradient pulse is significantly shorter than the propagation time between the splitting and recombining of the matter-wave packets. Therefore, we make the assumption in the calculation that the two wave packets remain stationary during the pulse. The differential phase shift is given by
| (6) |
Here, is the magnetic dipole moment of 6Li2 molecule, and are the time-dependent magnetic fields at the two separated locations of the matter-wave packets.
Following the application of the phase shift, the two wave packets reverse their directions of motion and propagate back toward their origin. Upon reaching the origin, the two wave packets are recombined using a second pair of KD pulses.
The interference pattern is analyzed by examining the distribution of particles across various momentum modes as a function of the differential phase shift. Following the recombination pulses, all optical potentials are abruptly turned off, allowing the cloud to expand while the magnetic field is maintained. During the TOF, the field curvature provides a focusing potential in the horizontal plane for momentum distribution measurement [45]. Consequently, the cloud quickly expands in the radial direction, resulting in a rapid decrease in inter-particle interactions. After a quarter of the oscillation period, determined by the horizontal trapping frequency of 18.5 Hz, the spatial profile of the cloud along the axial () direction reflects the momentum at the moment when the optical potentials are turned off. Detection is achieved by employing absorption imaging.
III.2 Michelson interference at varying interaction strengths
We first demonstrate the interferometric results measured at . Fig. 5d displays the oscillating occupations of the and modes as the differential phase shift increases (via an increase in the magnetic field gradient strength). In addition, a very small occupation in the modes is noted, attributed to the imperfect design of the splitting and recombining processes. The imbalance between and arises from the disturbance in the motion of the cloud caused by the magnetic field gradient.
To determine the occupation in each momentum mode, we fit the momentum distribution at each time point using a profile comprising five narrow condensate peaks positioned at (with particle numbers , , , , ) superimposed on a broad Gaussian peak that represents the scattered particles. We exclude the scattered particles, and only account for the particles in the condensate modes to calculate the fractional occupation of each state. For instance, the population in the mode is determined as (illustrated in Fig. 5e). The results in Fig. 5d-f are shown as a function of the calculated differential phase shift between the two interferometer arms . The phase shift calculation is conducted through a numerical integration based on the Biot-Savart law along our coil wire to determine the magnetic fields at the locations of the two wave packets. This process takes into account the precise positioning and dimensions of each coil turn. In Fig. 5e, a reference interference signal, produced from the calculated phase shift and the experimentally measured amplitude, is presented alongside the measurements for visual comparison. In Fig. 5f, we present the discrepancy between the experimentally measured phase shifts and the calculated phase shifts . The acquisition of is obtained by fitting experimental data within a close range to a single period of a cosine curve. The smooth results at arise because the data used for fitting to determine the phase shift within this range are fixed.
In the measurements presented in Fig. 5d-f, we note that for phase shifts , the calculations closely match the observations with an error margin of . However, for larger phase shifts, where stronger magnetic field gradients are applied, the actual phase shift increases at a slower rate than calculated. This growing discrepancy is attributed to the disturbances to the wave packet trajectories caused by strong magnetic field gradient pulses.
In Ref. [6] and Ref. [46], it has been demonstrated that under weak interactions, the main limitations on the coherence time of guided-wave atom interferometry arise from phase gradients caused by axial confinement and inter-particle interactions. The dephasing of wave packets due to phase gradients could be suppressed by ensuring sufficient separation between the two wave packets in space and allowing them to undergo symmetric motion in the waveguide, such as completing a full oscillation. However, as the inter-particle interaction becomes stronger, collisional loss emerges as the predominant factor in decoherence processes. Since collisional loss is not dependent on position, it cannot be suppressed through a symmetric trajectory design. In our experiments, it is confirmed that applying the recombining pulses upon the completion of one full oscillation results in a further reduction in fringe contrast, dropping to as low as 20%. This indicates a more pronounced decrease compared to the scenario of a half-period oscillation. This observation underscores the collisional loss as a key limiting factor in the performance of interferometry with strong interaction.
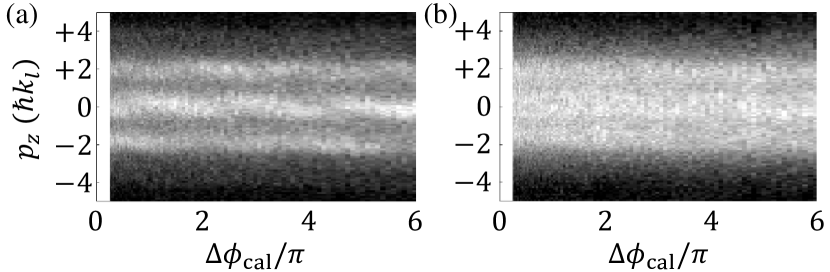
This reduction in contrast due to collisional losses becomes particularly pronounced as we continue to increase the interaction strength. In Fig. 6, we present additional measurements performed at stronger interactions, specifically at scattering lengths of and . These results indicate that stronger interactions lead to increased condensate loss, significantly diminishing interference contrasts [47]. Our observations highlight the challenges in achieving extended coherence times under strong interaction conditions.
III.3 Interference in thermal clouds
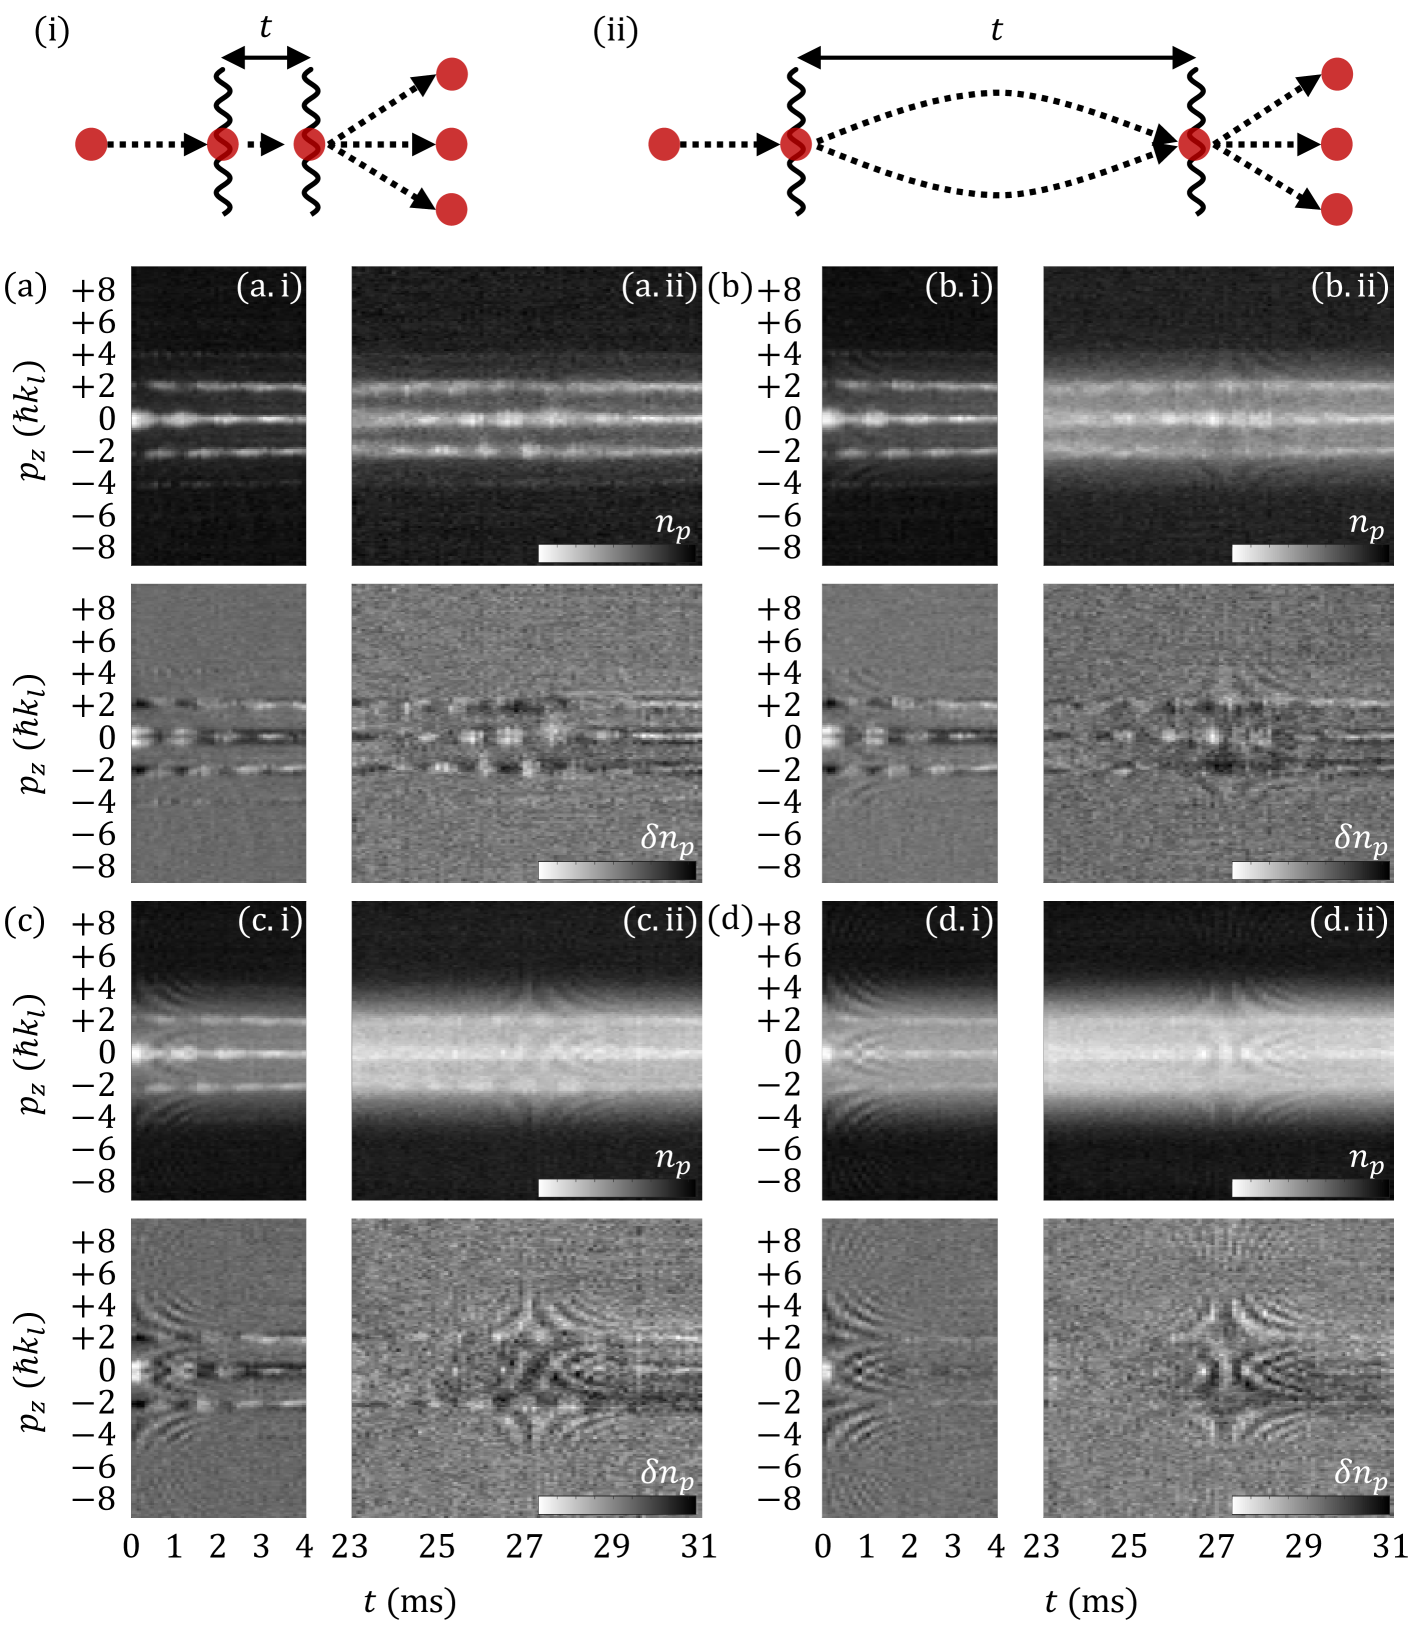
Interference phenomena are not exclusive to BECs, but are also present in thermal clouds [48, 7]. To investigate the white light characteristics of the implemented guided Michelson geometry, we make a modification to the experimental scheme used in Sec. III.1-III.2. Interference is alternatively observed in the absence of a differential phase shift by varying the propagation time in the waveguide. We apply the recombining pulses at various times, (i) ranging from immediately after the splitting pulses to 4ms later, and (ii) within a time window of 8ms centered around the moment when the two packets are maximally overlapped upon their first return to the origin. The experimental sequences for these two groups of measurements are depicted at the top of Fig. 7, with the labels (i) and (ii) used to indicate the respective experimental results. As shown in Fig. 7a, the measurements are performed on a nearly pure condensate with a scattering length of and a particle number of . The interference is demonstrated by the oscillating occupation of particles in different momentum modes. The occupation in the modes and oscillates at a frequency of =1.0 kHz. Additionally, a minimal occupation is observed in the modes, which results from imperfections in the KD pulse sequence, oscillating at a four-fold higher frequency of . The variations in the interference contrast over time are mainly due to the axial displacement of the two wave packets. The contrast reaches its (local) maximum when the two packets overlap at ms and again at half an oscillation (ms), and diminishes as the packets gradually separate.
Next, we perform measurements on clouds containing various proportions of thermal atoms at different temperatures. These thermal clouds are prepared by terminating the evaporative cooling process at various stages. Fig. 7b-d illustrates the coherence properties of these thermal clouds, with each figure showing clouds at gradually increasing temperatures. To improve the visibility of interference patterns, we compute the deviation of the momentum distribution at each time point from the time-averaged distribution, expressed as . The graphs of are placed below each set of corresponding results.
From these figures, we observe the presence of finer interference fringes in the cases of thermal clouds, superimposed on the interference signals from the condensates. With rising temperatures, the thermal clouds span a wider range of momentum modes, thereby extending the coherent fringe to a large momentum range of . This observation illustrates the coherence imprinted by the beam splitter (optical lattice pulses). The emergence of these fringes results from the differential response of particles to lattice pulses across various momentum modes. During evolution, each momentum mode accumulates phase relative to its momentum. Notably, the presence of these coherent signals from thermal atoms remains distinctly visible even after half a period of oscillatory evolution in the waveguide, as demonstrated in Group (ii) in Fig. 7. Our harmonic potential along the waveguide is ideally configured, ensuring the refocusing of all momentum modes at the precise time, which enables the observation of interference patterns after half an oscillation. These fringes are a sign of the white-light nature of the implemented Michelson interferometer.
To support our interpretation of the fringes observed in the thermal clouds, we conduct a schematic numerical calculation to reproduce the interference pattern observed in Fig. 7d.i. We begin with a thermal cloud characterized by a Gaussian momentum distribution, with a width of , and segment it into discrete momentum modes based on the resolution of the experimental imaging. These modes are assumed to be mutually incoherent, with each treated as a plane wave denoted by , where is the mode index. We calculate the state of the system following a sequence of lattice pulses (as given in Fig. 5a), comprising four lattice pulses and three time intervals, totaling seven steps. This calculation is done using . Here, is the evolution operator in the th step. denotes the interference time, also referred to as in the calculations. equals zero during the intervals between pulses. The interaction term is neglected. By executing the evolution calculations individually across all momentum modes and then superimposing the outcomes, we obtain the interference fringes of thermal clouds. Varying the interference time in the calculations allows us to observe the interference pattern that emerges after the recombining pulses. The time step for the calculations is set to , five times shorter than that used in the experiments (). In Fig. 8, we compare the experimental observations with the calculation results. This modeling approach replicates certain features of the experimental fringe patterns and captures the basic principles of the interferometer. Although these calculations do not encompass the full complexity of the experimentally measured patterns, they nonetheless provide valuable insights into the formation of the fringes, enhancing our understanding of the underlying physical processes.
IV Conclusions
Our studies investigated the performance of matter-wave interferometers using Feshbach molecules across a range of interaction strengths, extending into the very strongly interacting regime. Our experiments demonstrated controllability and read-out of our molecular interferometers and provided an examination of the effects of interaction on signal properties. We observed and analyzed the influences on interference frequency, phase shift, and contrast, including its decay. Additionally, we explored particle loss due to scattering and the coherence of thermal particles. Where possible, we compared our findings with theoretical calculations, thereby establishing a quantitative and theoretical understanding of the results. Our work with extreme cases aims to be a further step towards understanding and potentially harnessing interactions for sensing and quantum mechanical devices.
Acknowledgements
We thank Sebastian Erne for helpful discussions. This work is supported by the ERC-AdG Emergence in Quantum Physics (EmQ) under Grant Agreement No. 101097858, the DFG/FWF CRC 1225 ’ISOQUANT’, with the Vienna participation financed by the Austrian Science Fund (FWF) (grant DOI 10.55776/I4863) and the FWF project 10.55776/P35390: Non-equilibrium dynamics in strongly interacting 1D quantum systems (NEqD-si1D). C.L. is supported by the Austrian Science Fund (FWF) through the ESPRIT grant 10.55776/ESP310 (EAPQuP).
References
- Andrews et al. [1997] M. R. Andrews, C. G. Townsend, H.-J. Miesner, D. S. Durfee, D. M. Kurn, and W. Ketterle, Observation of interference between two Bose condensates, Science 275, 637 (1997).
- Cronin et al. [2009] A. D. Cronin, J. Schmiedmayer, and D. E. Pritchard, Optics and interferometry with atoms and molecules, Rev. Mod. Phys. 81, 1051 (2009).
- Hogan et al. [2009] J. M. Hogan, D. M. S. Johnson, and M. A. Kasevich, Light-pulse atom interferometry, in Proceedings of the International School of Physics ”Enrico Fermi”, Atom Optics and Space Physics, Vol. 168 (IOS Press, Amsterdam, 2009) pp. 411–447.
- Wang et al. [2005] Y.-J. Wang, D. Z. Anderson, V. M. Bright, E. A. Cornell, Q. Diot, T. Kishimoto, M. Prentiss, R. A. Saravanan, S. R. Segal, and S. Wu, Atom Michelson interferometer on a chip using a Bose-Einstein condensate, Phys. Rev. Lett. 94, 090405 (2005).
- Garcia et al. [2006] O. Garcia, B. Deissler, K. J. Hughes, J. M. Reeves, and C. A. Sackett, Bose-Einstein-condensate interferometer with macroscopic arm separation, Phys. Rev. A 74, 031601 (2006).
- Burke et al. [2008] J. H. T. Burke, B. Deissler, K. J. Hughes, and C. A. Sackett, Confinement effects in a guided-wave atom interferometer with millimeter-scale arm separation, Phys. Rev. A 78, 023619 (2008).
- Sapiro et al. [2009] R. E. Sapiro, R. Zhang, and G. Raithel, Atom interferometry using Kapitza-Dirac scattering in a magnetic trap, Phys. Rev. A 79, 043630 (2009).
- McDonald et al. [2013] G. D. McDonald, H. Keal, P. A. Altin, J. E. Debs, S. Bennetts, C. C. N. Kuhn, K. S. Hardman, M. T. Johnsson, J. D. Close, and N. P. Robins, Optically guided linear Mach-Zehnder atom interferometer, Phys. Rev. A 87, 013632 (2013).
- Li et al. [2014] W. Li, T. He, and A. Smerzi, Multimode Kapitza-Dirac interferometry with trapped cold atoms, Phys. Rev. Lett. 113, 023003 (2014).
- Shin et al. [2004] Y. Shin, M. Saba, T. A. Pasquini, W. Ketterle, D. E. Pritchard, and A. E. Leanhardt, Atom interferometry with Bose-Einstein condensates in a double-well potential, Phys. Rev. Lett. 92, 050405 (2004).
- Albiez et al. [2005] M. Albiez, R. Gati, J. Fölling, S. Hunsmann, M. Cristiani, and M. K. Oberthaler, Direct observation of tunneling and nonlinear self-trapping in a single bosonic Josephson junction, Physical Review Letters 95, 010402 (2005).
- Schumm et al. [2005] T. Schumm, S. Hofferberth, L. M. Andersson, S. Wildermuth, S. Groth, I. Bar-Joseph, J. Schmiedmayer, and P. Krüger, Matter-wave interferometry in a double well on an atom chip, Nature Physics 1, 57 (2005).
- Estève et al. [2008] J. Estève, C. Gross, A. Weller, S. Giovanazzi, and M. K. Oberthaler, Squeezing and entanglement in a bose–einstein condensate, Nature 455, 1216 (2008).
- Gross [2012] C. Gross, Spin squeezing, entanglement and quantum metrology with Bose–Einstein condensates, Journal of Physics B: Atomic, Molecular and Optical Physics 45, 103001 (2012).
- Berrada et al. [2013] T. Berrada, S. van Frank, R. Bücker, T. Schumm, J.-F. Schaff, and J. Schmiedmayer, Integrated Mach–Zehnder interferometer for Bose–Einstein condensates, Nature Communications 4, 2077 (2013).
- van Frank et al. [2014] S. van Frank, A. Negretti, T. Berrada, R. Bücker, S. Montangero, J.-F. Schaff, T. Schumm, T. Calarco, and J. Schmiedmayer, Interferometry with non-classical motional states of a Bose–Einstein condensate, Nature Communications 5, 4009 (2014).
- Hu et al. [2018] D. Hu, L. Niu, S. Jin, X. Chen, G. Dong, J. Schmiedmayer, and X. Zhou, Ramsey interferometry with trapped motional quantum states, Communications Physics 1, 29 (2018).
- Deng et al. [1999] L. Deng, E. W. Hagley, J. Denschlag, J. E. Simsarian, M. Edwards, C. W. Clark, K. Helmerson, S. L. Rolston, and W. D. Phillips, Temporal, matter-wave-dispersion Talbot effect, Phys. Rev. Lett. 83, 5407 (1999).
- Mark et al. [2011] M. J. Mark, E. Haller, J. G. Danzl, K. Lauber, M. Gustavsson, and H.-C. Nägerl, Demonstration of the temporal matter-wave talbot effect for trapped matter waves, New Journal of Physics 13, 085008 (2011).
- Yue et al. [2013] X. Yue, Y. Zhai, Z. Wang, H. Xiong, X. Chen, and X. Zhou, Observation of diffraction phases in matter-wave scattering, Phys. Rev. A 88, 013603 (2013).
- Dimopoulos et al. [2008] S. Dimopoulos, P. W. Graham, J. M. Hogan, and M. A. Kasevich, General relativistic effects in atom interferometry, Phys. Rev. D 78, 042003 (2008).
- Grond et al. [2011] J. Grond, U. Hohenester, J. Schmiedmayer, and A. Smerzi, Mach-Zehnder interferometry with interacting trapped Bose-Einstein condensates, Physical Review A 84, 023619 (2011).
- Grond et al. [2010] J. Grond, U. Hohenester, I. Mazets, and J. Schmiedmayer, Atom interferometry with trapped Bose-Einstein condensates: Impact of atom-atom interactions, New Journal of Physics 12, 1 (2010).
- Jannin et al. [2015] R. Jannin, P. Cladé, and S. Guellati-Khélifa, Phase shift due to atom-atom interactions in a light-pulse atom interferometer, Phys. Rev. A 92, 013616 (2015).
- Hadzibabic et al. [2006] Z. Hadzibabic, P. Krüger, M. Cheneau, B. Battelier, and J. Dalibard, Berezinskii–Kosterlitz–Thouless crossover in a trapped atomic gas, Nature 441, 1118 (2006).
- Hofferberth et al. [2007] S. Hofferberth, I. Lesanovsky, B. Fischer, T. Schumm, and J. Schmiedmayer, Non-equilibrium coherence dynamics in one-dimensional bose gases, Nature 449, 324 (2007).
- Hofferberth et al. [2008] S. Hofferberth, I. Lesanovsky, T. Schumm, A. Imambekov, V. Gritsev, E. Demler, and J. Schmiedmayer, Probing quantum and thermal noise in an interacting many-body system, Nature Physics 4, 489 (2008).
- Langen et al. [2015] T. Langen, S. Erne, R. Geiger, B. Rauer, T. Schweigler, M. Kuhnert, W. Rohringer, I. E. Mazets, T. Gasenzer, and J. Schmiedmayer, Experimental observation of a generalized Gibbs ensemble, Science 348, 207 (2015).
- Schweigler et al. [2017] T. Schweigler, V. Kasper, S. Erne, I. Mazets, B. Rauer, F. Cataldini, T. Langen, T. Gasenzer, J. Berges, and J. Schmiedmayer, Experimental characterization of a quantum many-body system via higher-order correlations, Nature 545, 323 (2017).
- Fattori et al. [2008] M. Fattori, C. D’Errico, G. Roati, M. Zaccanti, M. Jona-Lasinio, M. Modugno, M. Inguscio, and G. Modugno, Atom interferometry with a weakly interacting Bose-Einstein condensate, Phys. Rev. Lett. 100, 080405 (2008).
- Gustavsson et al. [2008] M. Gustavsson, E. Haller, M. J. Mark, J. G. Danzl, G. Rojas-Kopeinig, and H.-C. Nägerl, Control of interaction-induced dephasing of Bloch oscillations, Phys. Rev. Lett. 100, 080404 (2008).
- Grond et al. [2009] J. Grond, J. Schmiedmayer, and U. Hohenester, Optimizing number squeezing when splitting a mesoscopic condensate, Physical Review A 79, 021603 (2009).
- Zhang et al. [2023] T. Zhang, M. Maiwöger, F. Borselli, Y. Kuriatnikov, J. Schmiedmayer, and M. Prüfer, Squeezing oscillations in a multimode bosonic Josephson junction (2023), arXiv:2304.02790 [cond-mat.quant-gas] .
- Petrov et al. [2004] D. S. Petrov, C. Salomon, and G. V. Shlyapnikov, Weakly bound dimers of fermionic atoms, Phys. Rev. Lett. 93, 090404 (2004).
- Petrov et al. [2005] D. S. Petrov, C. Salomon, and G. V. Shlyapnikov, Scattering properties of weakly bound dimers of fermionic atoms, Phys. Rev. A 71, 012708 (2005).
- Liang et al. [2022] Q. Liang, C. Li, S. Erne, P. Paranjape, R. Wu, and J. Schmiedmayer, Diffraction of strongly interacting molecular Bose-Einstein condensate from standing wave light pulses, SciPost Phys. 12, 154 (2022).
- Bartenstein et al. [2005] M. Bartenstein, A. Altmeyer, S. Riedl, R. Geursen, S. Jochim, C. Chin, J. H. Denschlag, R. Grimm, A. Simoni, E. Tiesinga, C. J. Williams, and P. S. Julienne, Precise determination of cold collision parameters by radio-frequency spectroscopy on weakly bound molecules, Phys. Rev. Lett. 94, 103201 (2005).
- Zhou et al. [2018] X. Zhou, S. Jin, and J. Schmiedmayer, Shortcut loading a Bose–Einstein condensate into an optical lattice, New Journal of Physics 20, 055005 (2018).
- Greiner et al. [2001] M. Greiner, I. Bloch, O. Mandel, T. W. Hänsch, and T. Esslinger, Exploring phase coherence in a 2D lattice of Bose-Einstein condensates, Phys. Rev. Lett. 87, 160405 (2001).
- Büchner et al. [2003] M. Büchner, R. Delhuille, A. Miffre, C. Robilliard, J. Vigué, and C. Champenois, Diffraction phases in atom interferometers, Phys. Rev. A 68, 013607 (2003).
- Dalibard [2013] J. Dalibard, Optical lattices, Lecture at Collège de France (2013).
- Trombettoni and Smerzi [2001] A. Trombettoni and A. Smerzi, Discrete solitons and breathers with dilute Bose-Einstein condensates, Phys. Rev. Lett. 86, 2353 (2001).
- Smerzi and Trombettoni [2003] A. Smerzi and A. Trombettoni, Nonlinear tight-binding approximation for Bose-Einstein condensates in a lattice, Phys. Rev. A 68, 023613 (2003).
- Li et al. [2020] C. Li, T. Zhou, I. Mazets, H.-P. Stimming, F. S. Møller, Z. Zhu, Y. Zhai, W. Xiong, X. Zhou, X. Chen, and J. Schmiedmayer, Relaxation of bosons in one dimension and the onset of dimensional crossover, SciPost Physics 9, 058 (2020).
- Murthy et al. [2014] P. A. Murthy, D. Kedar, T. Lompe, M. Neidig, M. G. Ries, A. N. Wenz, G. Zürn, and S. Jochim, Matter-wave Fourier optics with a strongly interacting two-dimensional Fermi gas, Phys. Rev. A 90, 043611 (2014).
- Horikoshi and Nakagawa [2007] M. Horikoshi and K. Nakagawa, Suppression of dephasing due to a trapping potential and atom-atom interactions in a trapped-condensate interferometer, Phys. Rev. Lett. 99, 180401 (2007).
- Höllmer et al. [2019] P. Höllmer, J.-S. Bernier, C. Kollath, C. Baals, B. Santra, and H. Ott, Talbot effect in the presence of interactions, Phys. Rev. A 100, 063613 (2019).
- Miller et al. [2005] D. E. Miller, J. R. Anglin, J. R. Abo-Shaeer, K. Xu, J. K. Chin, and W. Ketterle, High-contrast interference in a thermal cloud of atoms, Phys. Rev. A 71, 043615 (2005).