Does the Use of Unusual Combinations of Datasets Contribute to Greater Scientific Impact?
Abstract
Scientific datasets play a crucial role in contemporary data-driven research, as they allow for the progress of science by facilitating the discovery of new patterns and phenomena. This mounting demand for empirical research raises important questions on how strategic data utilization in research projects can stimulate scientific advancement. In this study, we examine the hypothesis inspired by the recombination theory, which suggests that innovative combinations of existing knowledge, including the use of unusual combinations of datasets, can lead to high-impact discoveries. We investigate the scientific outcomes of such atypical data combinations in more than 30,000 publications that leverage over 6,000 datasets curated within one of the largest social science databases, ICPSR. This study offers four important insights. First, combining datasets, particularly those infrequently paired, significantly contributes to both scientific and broader impacts (e.g., dissemination to the general public). Second, the combination of datasets with atypically combined topics has the opposite effect – the use of such data is associated with fewer citations. Third, younger and less experienced research teams tend to use atypical combinations of datasets in research at a higher frequency than their older and more experienced counterparts. Lastly, despite the benefits of data combination, papers that amalgamate data remain infrequent. This finding suggests that the unconventional combination of datasets is an under-utilized but powerful strategy correlated with the scientific and broader impact of scientific discoveries.
Introduction
The recognition of the immense power of datasets in scientific and economic advancements has prompted academia, industry, and society to collectively invest substantial effort in generating and making datasets publicly available [1, 2, 3]. The open science movement, for instance, has emphasized the crucial practice of data sharing to enhance research reproducibility, facilitate collaboration, and enable subsequent studies [4, 5, 6, 7]. Initially, the call for sharing and managing datasets faced numerous barriers, including limited funding [8], inadequate institutional support, time constraints [9], lack of suitable platforms [10], and a lack of sharing social norms in academia [11, 12]. Fortunately, over the past decade, there has been a notable increase in funding, institutional and support, and the development of platforms dedicated to supporting data sharing and curation[13, 14, 15]. As a result, a wealth of publicly available datasets is now accessible for reuse [16, 13, 17, 18, 19].
Given the wide accessibility of publicly available data and the significance of datasets within the scientific community, it is crucial to understand how scientists utilize these datasets, especially when their use fosters high-impact and innovative scientific development. Numerous studies have endeavored to discern the motivations and challenges surrounding the reuse of datasets [20, 21, 8]. These studies aim to promote data reuse and enhance the curation process (such as improving the data search experience) [22, 23], thereby encouraging researchers to effectively utilize existing datasets or identify suitable data for their studies. However, the link between dataset utilization and scientific advancement remains uncertain. In this study, we aim to fill this gap, particularly by analyzing how strategic data utilization in research projects can drive scientific advancement and foster high-impact, innovative scientific development.
A line of study in recombination theory offers a broader perspective on the potential relationship between diversity (unusual combinations) and scientific advancement. This body of literature suggests that unconventional combinations of existing knowledge that retain a certain level of conventionality (e.g., combining two high-impact findings from different domains) can lead to novel discoveries and scientific breakthroughs [24, 25, 26, 27, 28, 24].While these studies do not offer empirical evidence linking data usage practices to scientific advancement, they do provide valuable insights that lead us to ask: do unconventional combinations of datasets contribute to scientific breakthroughs? Examining the scientific impact of novel dataset combinations can provide valuable insights for publication agencies, data curators, researchers, and funders. These findings can inform the development of policies and practices that facilitate and encourage data linking, ultimately enhancing the overall research landscape.
In order to examine the potential for a unique combination of datasets to contribute to scientific breakthroughs, we first assess the level of scientific attention through citations received by publications that utilize multiple datasets (using data combination). We then define a unique combination of datasets as one that is infrequently employed and quantify its relationship with scientific influence. Moreover, we leverage the topic tags linked to each individual dataset to measure the uniqueness of dataset combinations in relation to their content. We aim to explore whether novelty in dataset combinations and topic combinations exerts distinct influences on scientific advancement.
We have compiled a comprehensive dataset comprising more than 30,000 papers that utilize over 6,000 distinct datasets. The dataset used in our study was obtained from the Inter-university Consortium for Political and Social Research (ICPSR)111urlhttps://www.icpsr.umich.edu/web/pages/, a renowned data curation service extensively utilized by social scientists. This dataset is meticulously labeled by ICPSR data curators, and the linkage between datasets and publications is established only when a paper extensively employs a particular dataset in its results. The precision of data usage within publications is crucial for our analysis due to two reasons: first, data citations are commonly absent from certain publications [29, 30], and second, datasets are often cited for various reasons, many of which do not indicate substantial reuse (e.g., citing in the introduction or discussion) [31, 32]. After identifying this crucial dataset from ICPSR, we connect the publication record data through Crossref222urlhttps://www.crossref.org/, OpenAlex333urlhttps://openalex.org/, and Altmetrics444urlhttps://www.altmetric.com/, which provide information on citations and mentions of the research papers over the past decade on online platforms, such as news and social media. An complete description of our data description is provided in the ’Materials and Methods’ section and in the Supplemental Information (SI) Appendix, section 1. The granularity and scale of our data allowed us to define unique data combinations in various ways, such as uniqueness in data usage and uniqueness in data topics. We investigate the impact of unique data combinations across multiple dimensions, including scientific impact (e.g., citations) and broader impacts (e.g., policy implications and general knowledge impact). Consequently, our study offers a systematic investigation into the effect of the uniqueness of data integration on scientific and broader impacts.
The effect of dataset combinations on scientific impact
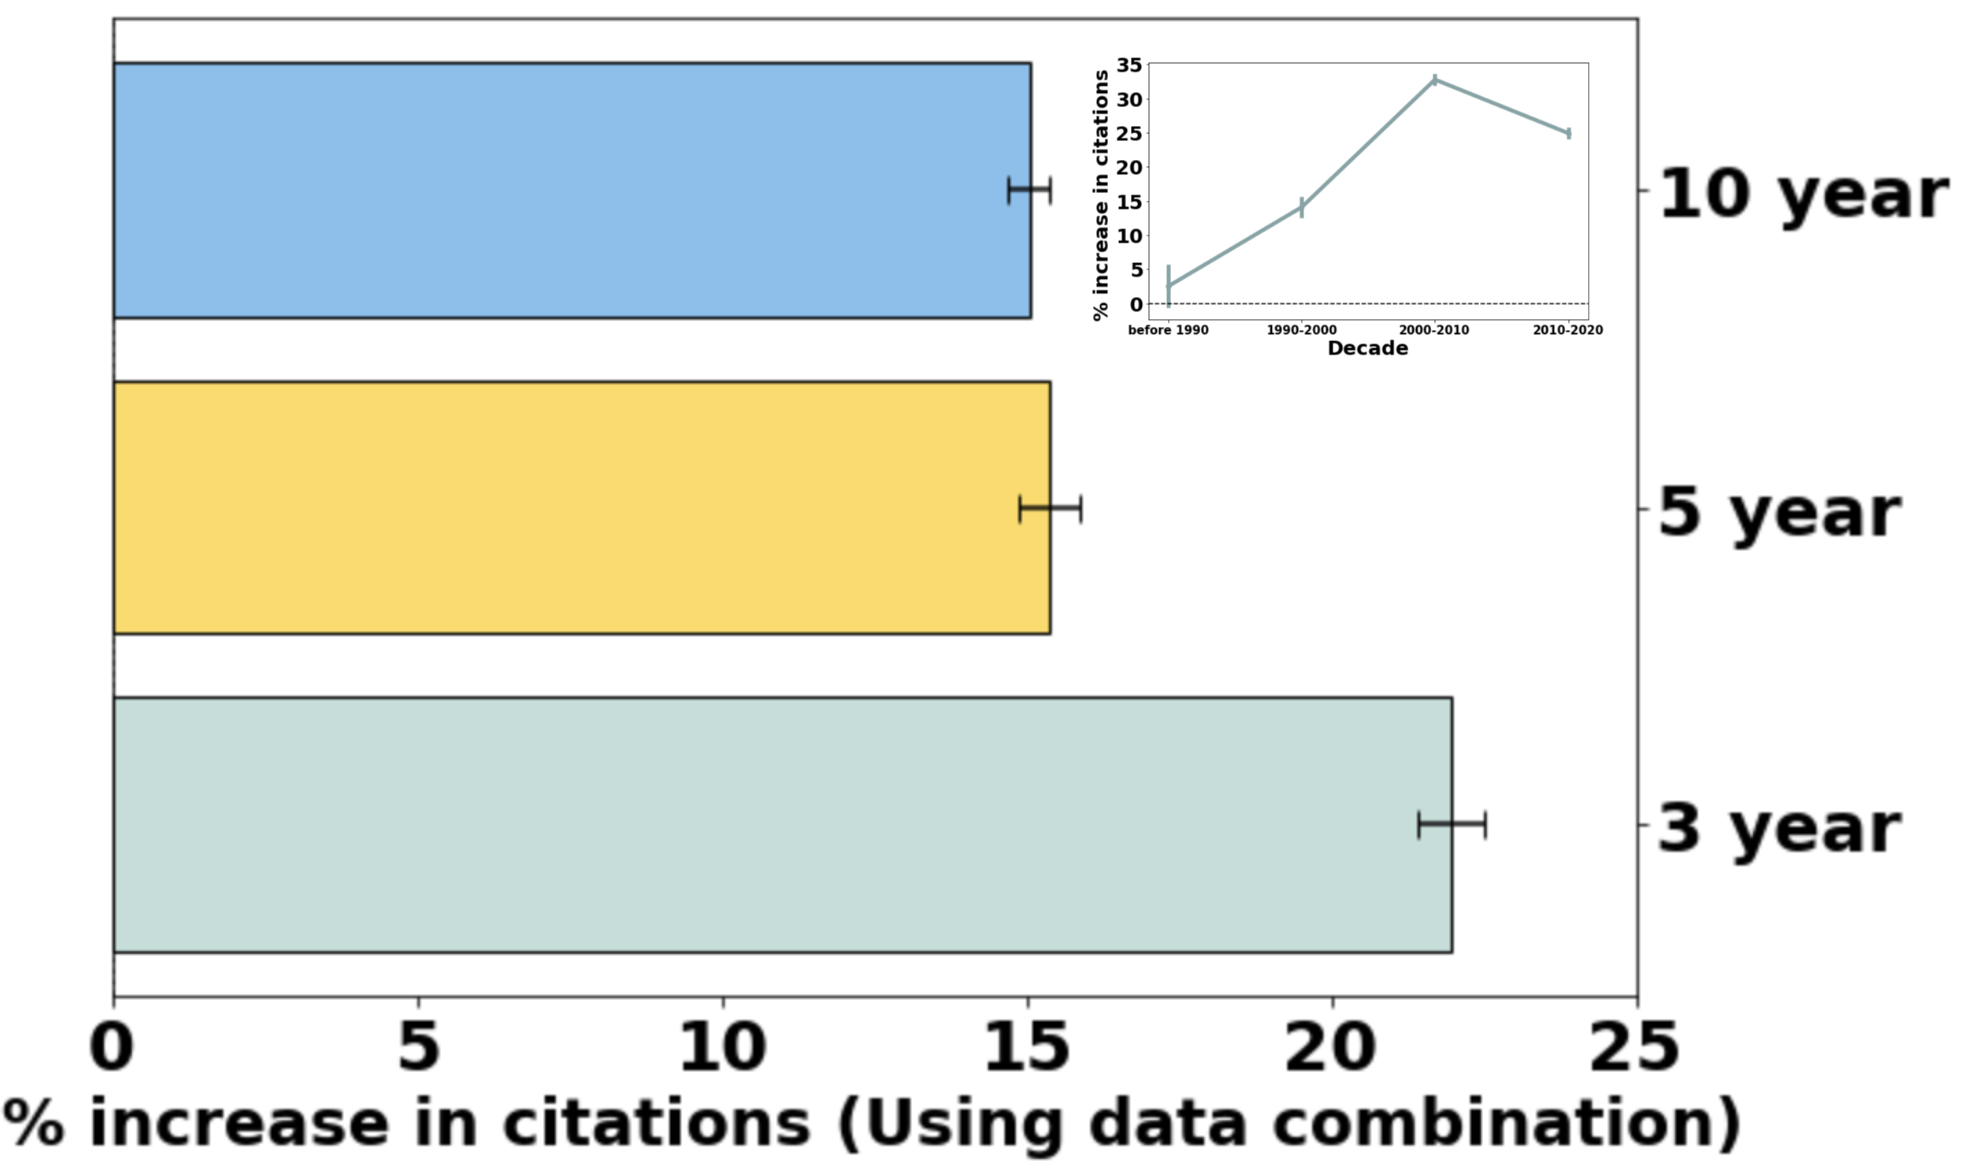
A prerequisite for data combination is using multiple datasets. Thus, our analysis begins by examining the impact of using multiple datasets on the paper’s citations. Our primary citation impact metric is the number of citations a paper obtained in the fixed number of years after publication.
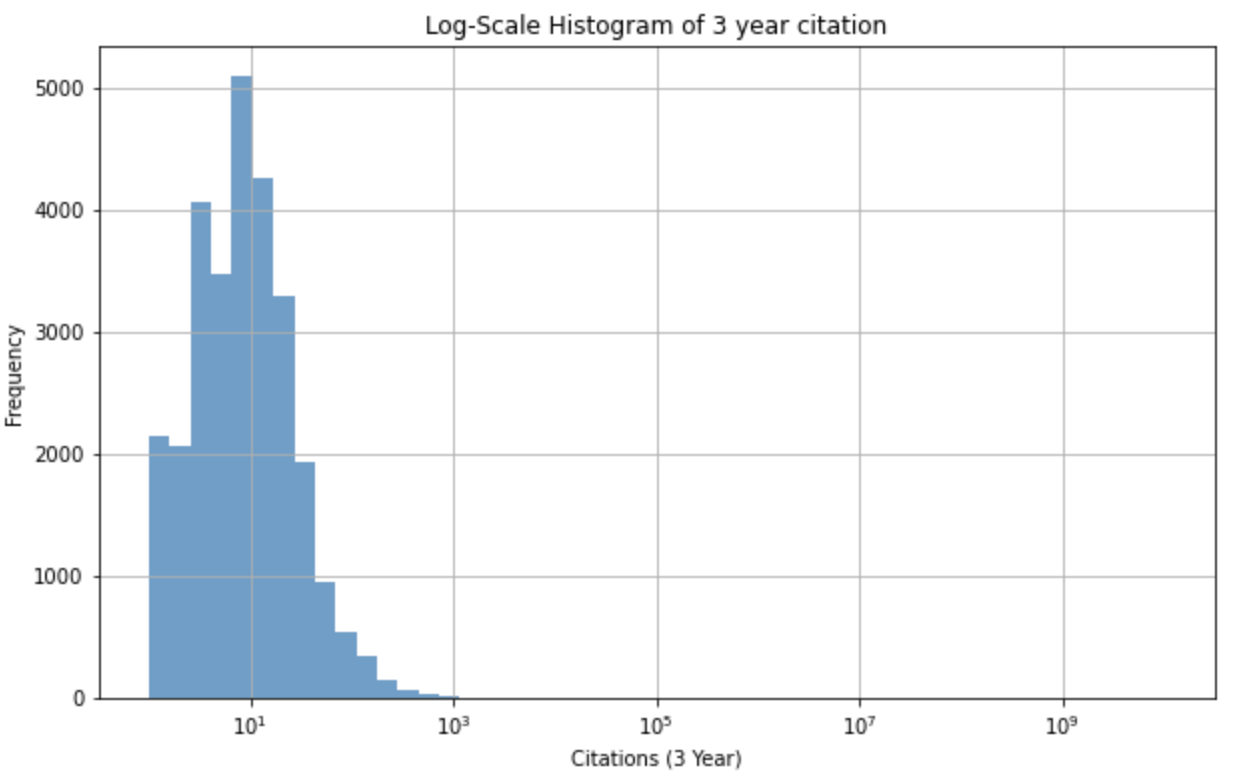
Since our outcome variable tracks the counts of citations and exhibits a long tail distribution (see Figure S5 in Supplemental Information (SI)), we employ a Poisson regression to effectively model the relationship between citation count and the use of multiple datasets. Further, we control for average data use frequency, since frequently used datasets could link to trending topics. Additionally, we control for the impact of team size, team experience, disciplines, publication time, and journal impact factor, as these factors have been found to influence citation performance due to their influence on team composition and journal characteristics [33, 34, 35, 36]. We provide a detailed explanation of these measurements in the Supplemental Information (SI) Appendix Section 3. In our initial analysis, we use a binary variable that encodes whether a publication utilizes multiple datasets (data combination) or a single dataset and the number of citations 3, 5, and 10 years after publication as the outcome variable. As shown in Figure 1, the Poisson regression results show a statistically significant increase in citations for papers that use multiple datasets, compared to those that did not (P-value 0.001). Papers that used more than one dataset garnered 22%, 15%, and 15% more citations over 3, 5, and 10 years relative to papers that used a single dataset (See Supplemental Information (SI) Appendix Section 4, regression table S1 - S3). As shown in the inset of Figure 1, over time, the effect has remained significant and consistent, except for papers published before 1900. There is a notably larger effect size in recent years, particularly after 2000 (see SI Appendix section 4 Table S4 - S7 for full regression table). We additionally perform an analysis treating our binary variable as a continuous one that represents the number of datasets used in a paper. The results obtained from this analysis are qualitatively similar (See Supplemental Information (SI) Appendix Section 4, regression table S8 - S10).
Atypical combinations of datasets associate with high impact
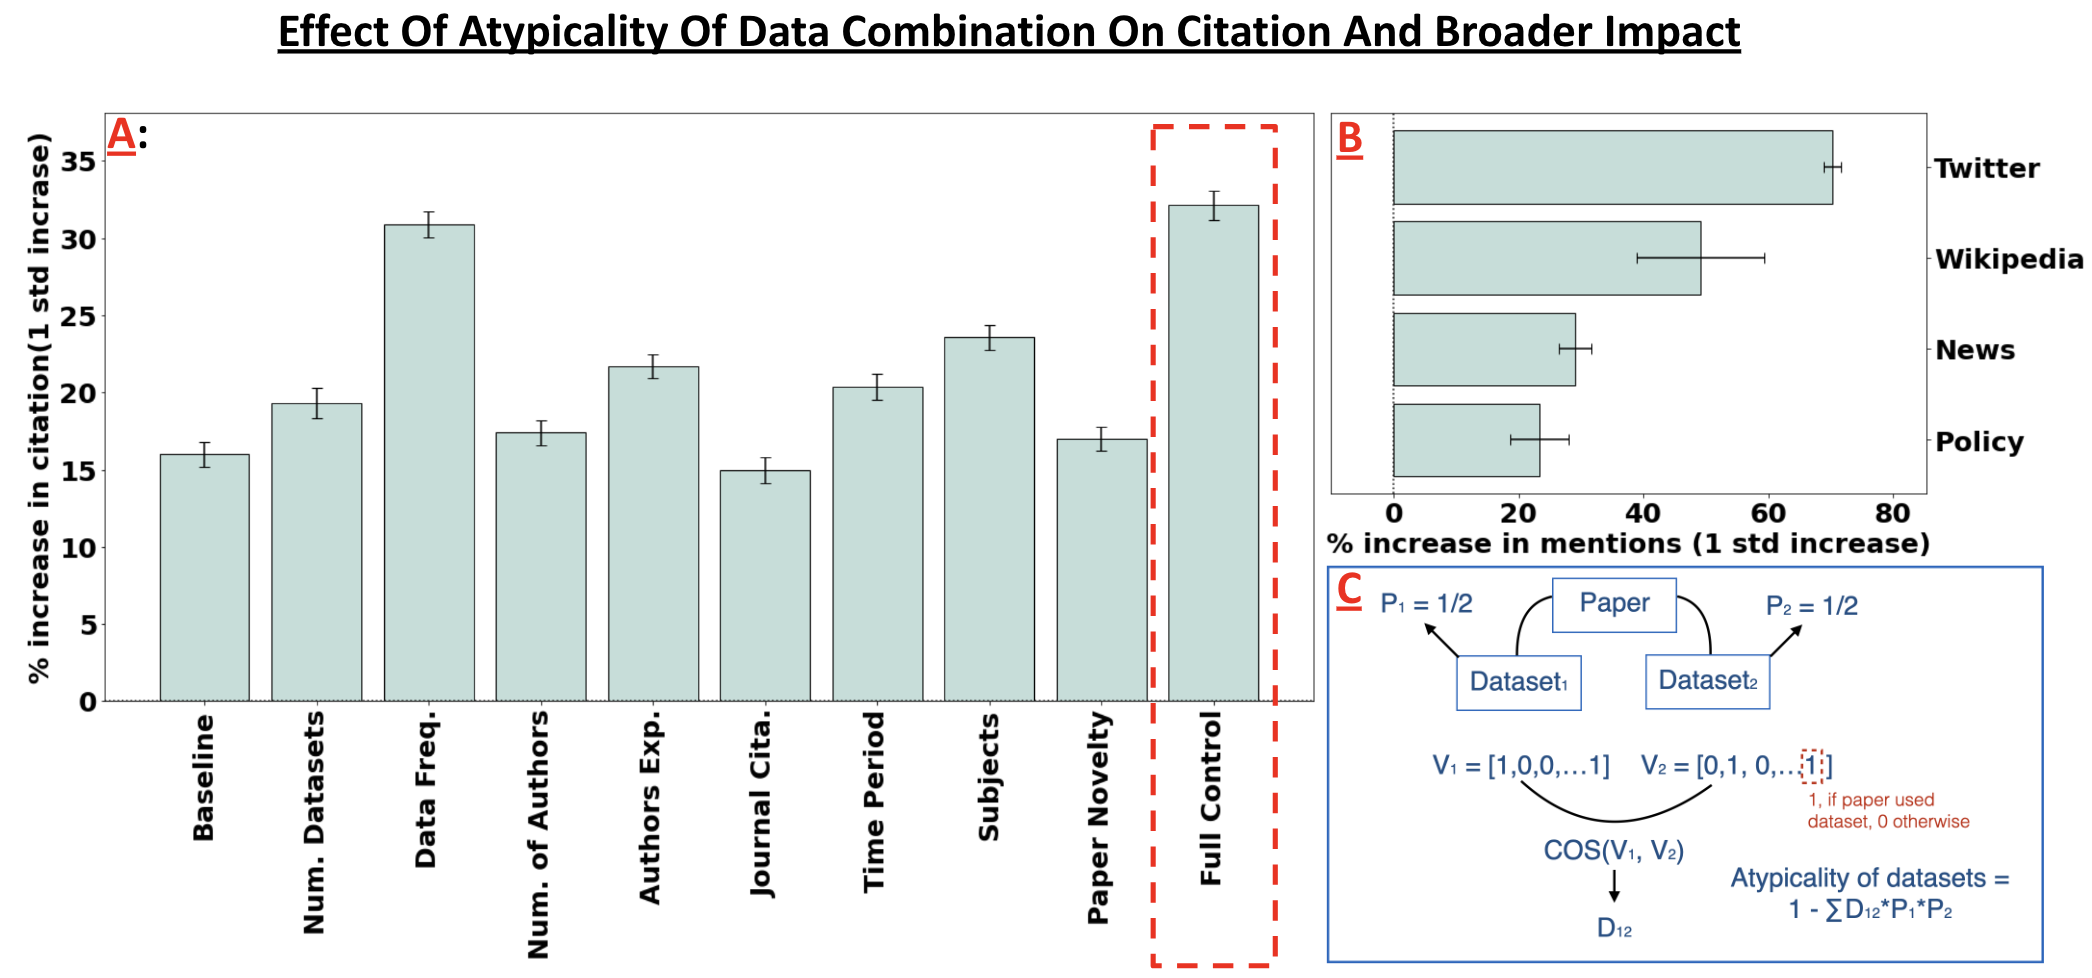
Subsequently, we evaluate the impact of data combination beyond the number of datasets; we now consider the impact of using rarely combined datasets. We assess the atypicality of a paper’s data usage by employing the Sterling index [37], a general-purpose measure of atypicality. Prior studies have utilized the Sterling index to quantify atypicality in the combination of references or multidisciplinary contexts [38, 39]. The Sterling index varies from 0 to 1, with higher values denoting greater atypicality. The ’Materials and Methods’ section provides additional operational details of this metric. We also provide examples representing the top 25% and bottom 25% of data combinations, as determined by the atypicality of data combination score, in the Supplemental Information (SI) Appendix, section 2. Figure 2(c) also illustrates the measurement.
We employed fixed-effects Poisson regressions to investigate the effect of the atypicality of dataset combination on the citation impact of a paper. In the primary analysis, we examine exclusively 8,881 papers that employ a minimum of two datasets and utilize a three-year citation window to determine the citation impact of publications. Additionally, in the Supplemental Information (SI) Appendix, section 4 Table S22, we provide results on alternative citation impact measurements, including the five and ten-year citation window and whether a paper is in the top 5% most cited in our dataset [40, 38]. Here, we also use control variables, including team size, team experience, journal impact factor, disciplines, publication time, and average data use frequency, as in the previous analysis. Additionally, we control for the number of datasets utilized in the paper, which have been shown to be associated with citation impact in our first analysis. Furthermore, acknowledging prior research that indicates a link between atypical combinations of prior knowledge and citation impact [40, 27], we account for this effect by controlling for the atypicality in the combination of references’ journals, which we refer to as paper novelty in our study (See Materials and Methods and Supplemental Information (SI) Appendix, section 3. for a full description of this measure).
Figure 2(a) displays the regression coefficients of the main and several control variables (see the full regression table in Supplemental Information (SI) Appendix, section 4 Table S11.). The result suggests that papers that utilize more uncommonly combined datasets significantly garner more citations (P-value 0.001). For each standard deviation increase in data atypicality, papers receive 32% more citations. These results hold robust across various settings and controls, including when we measure the outcome variables as the number of citations obtained within five and ten years after publication or consider whether the paper became a hit paper (the 5% most cited papers), as shown in the SI Appendix, section 4 Table S11-S13 (outcome as 3, 5, and 10-year citations) and S22 (5% most cited papers). We also find that dataset atypicality retains its strong, significant explanatory power, even after accounting for potential confounding factors, including paper novelty, team composition, journal-related characteristics, and dataset-related features. Over time, the effect remains significant and consistent, with a noticeably larger effect size in recent years. As shown in the SI Appendix, section 4 Table S14 - S17, the effects for each time period are as follows: before 1990 (21%), 1990-2000(8%), 2000-2010(54%) and 2010-2020(37%)
Furthermore, our analysis reveals that the impact of atypical dataset combinations on research publications extends beyond citation counts. We observe substantial effects on the broader dissemination of research findings, including their presence in general knowledge platforms such as Wikipedia, their presence on policy documents, and their attention on social media (Twitter) and news platforms. As illustrated in Figure 2(b), a one standard deviation increase in atypical dataset combinations is associated with a 23% increase in policy mentions, a 49% increase in Wikipedia mentions, a 70% increase in Twitter mentions, and a 29% increase in news mentions (see the full regression table in Supplemental Information (SI) Appendix, section 4 Table S18 - S21.). An description of policy, Wikipedia, Twitter, and news mentions is provided in the Materials and Methods and the Supplemental Information (SI) Appendix, section 1.
The effect of atypical dataset topic combinations on scientific impact
The datasets in our analysis are tagged with a set of expert-defined topics. For instance, the dataset titled “Cost of Living in the United States” includes topics such as consumers, the cost of living, economic indicators, expenses, families, households, income, urban populations, and the working class. This enables us to assess the atypicality, not only of individual datasets used in a paper, but also of the atypicality of the topics covered by such datasets. Our subsequent analysis explores the interplay between the atypicality of topics within datasets and their implications for scientific outcomes.
We measure topic typicality in the datasets used by academic papers using the Sterling index described above, though we consider the topics of the datasets, not the datasets, as the units of analysis to be combined. We operationalize the metric for “topic atypicality” by first taking the union of all topics associated with each dataset used by a paper and then measuring the atypicality of these topics. This determines whether the paper uses datasets that collectively combine atypical topics. We include examples representing the top 25% and bottom 25% topic atypicality, as determined by topic atypicality score, in the Supplemental Information (SI) Appendix, section 2. Figure 3(a) illustrates the measurements of topic atypicality of datasets.
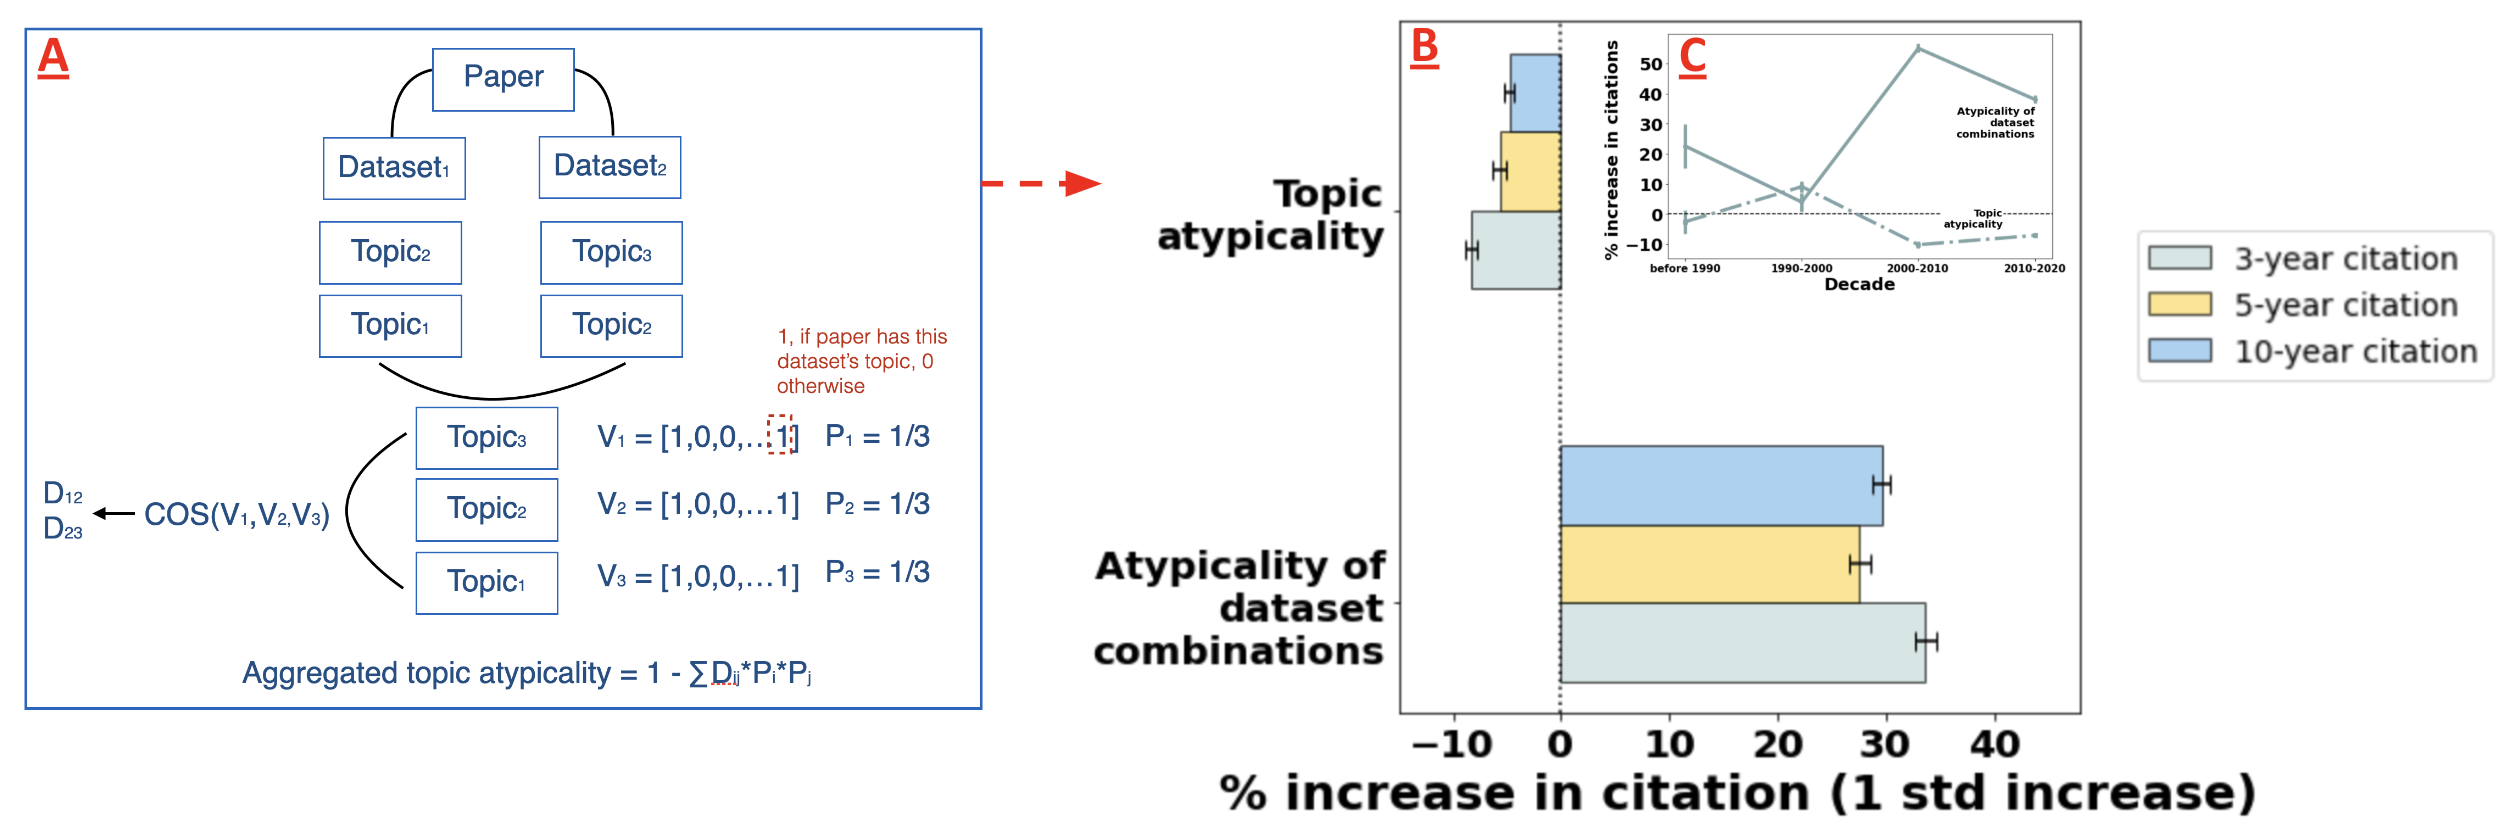
Figure 3(b) displays the regression results illustrating the correlation between citation impact and two atypicality metrics: atypicality of dataset combinations and topic atypicality. We present these results after controlling for the variables mentioned in the preceding analysis. Our results show that papers combining datasets with atypically combined topics unusually receive significantly fewer citations (P-value 0.001) 3 (8% decrease), 5 (5% decrease), or 10 years (5% decrease) after publication (see the full regression table in Supplemental Information (SI) Appendix, section 4 Table S23-S25.). This suggests that while integrating multiple datasets with non-novel topics might enhance the exploration of fundamental topics in a research community, combining novel data sets on conventional topics might allow researchers to make difficult-to-make connections and explore conventional topics through new empirical lenses.
Figure 3(c) displays separate analyses conducted for each decade: publications before 1900 (grouped due to limited observations), 1990-2000, 2000-2010, and 2010-2020. Our results reveal that the main result is driven by recent publications, particularly after 2000. While the impact of dataset atypicality on citations consistently remains positive over time, the effect size for publications in the last two decades is significantly larger compared to papers from before the 21st century. The influence of topic atypicality is either very small or statistically insignificant for publications before 2000. However, from 2000 onwards, this effect becomes consistently significant. (see the full regression table in Supplemental Information (SI) Appendix, section 4 Table S26 -S29.)
What type of research teams combine atypical datasets?
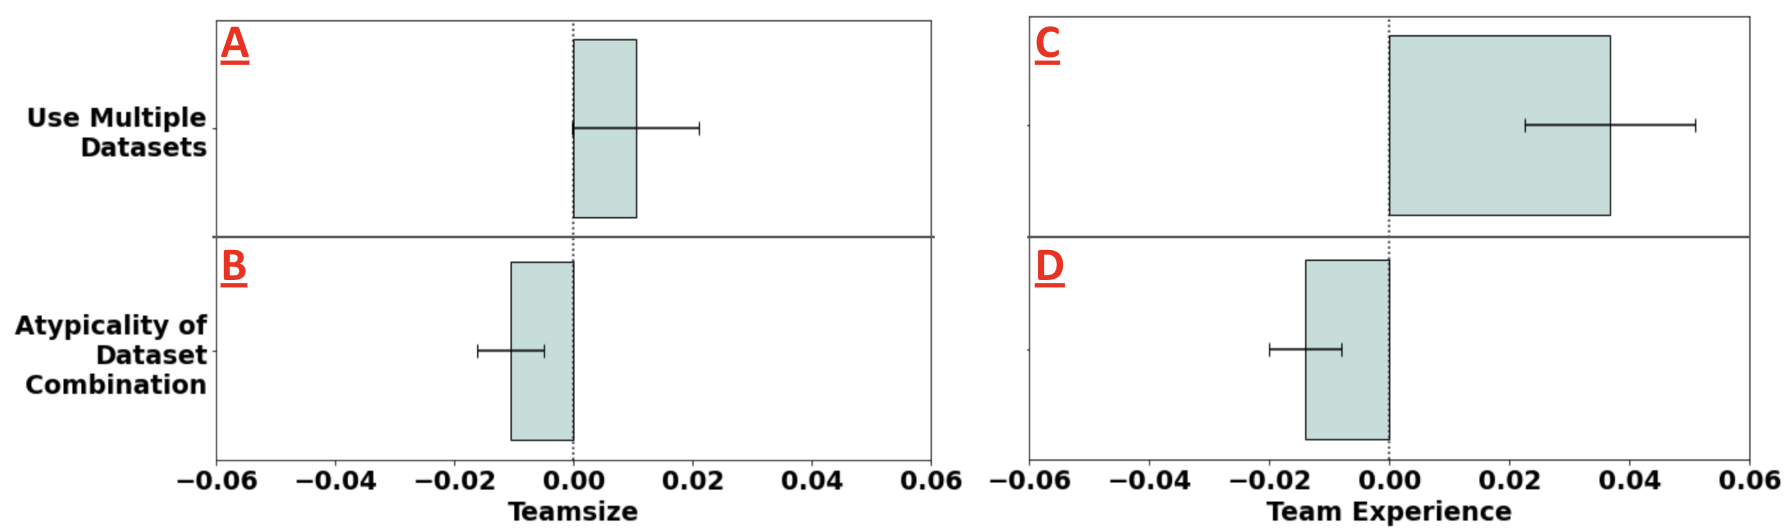
Given that data combinations, particularly atypical combinations, contribute to scientific impact, our final analysis aims to understand which research teams are more likely to employ atypical data. Prior studies have emphasized the significance of teams in fostering scientific innovation [40, 41] and have focused especially on team size. Meanwhile, it is posited that the age or experience of authors is associated with creativity and innovation [42]. Therefore, we also seek to gain insights into the types of teams that are more inclined to utilize an atypical combination of datasets. We utilize logistic regression to model two relationships: 1) the likelihood of using multiple datasets (data combination) and team size (Model a in Fig.4) and 2) the likelihood of using multiple datasets and team experience (Model c). Then, we use Ordinary Least Squares (OLS) regression to model relationships between: 3) team size and the atypicality of data combinations (Model b), and 4) the atypicality of data combinations and team experience (Model d). To model 1) and 2), we control for average data use frequency and the impact factor of the journal. To model 3) and 4), we further include control variables for the number of datasets. We find that larger or more experienced teams, as measured by the average citation count of the authors, tend to use multiple datasets. Furthermore, smaller or less experienced teams tend to use atypical combinations of datasets. However, when examining all the research teams in our dataset, we observe that less than 30% of the research teams (29%) in our analysis incorporate multiple datasets (See the Supplemental Information (SI) Appendix, section 4 Table S31 - S34, for full regression tables).
Discussion
By conducting a meticulous analysis of a curated dataset comprising over 30,000 papers and over 6,000 datasets, we have found that the combination of datasets, particularly those that are not typically combined, is associated with an overall higher citation rate (a 32% increase per one standard deviation difference). This finding remains robust even after controlling for various factors, such as disciplines, team compositions, time periods, and paper novelty. A noteworthy finding in this work is that novelty in data combinations does not invariably yield positive results – the atypicality of topic combinations shows that employing datasets with conventional topics garners more citations.
Our study parallels previous research asserting that atypical combinations of previous knowledge lead to high-impact scientific findings [40]. However, we build upon this work by uncovering specific implications for data use. While previous studies have examined novelty in a uni-dimensional manner, without specifying how various aspects of a scientific paper’s novelty relate to its scientific impact [43, 44, 45, 46, 47, 25, 48, 49], or have solely investigated novelty in certain aspects that are orthogonal to data use (such as methods, theories, and finding) [50], this research advances our understanding on the association between data use and impact. Importantly, we found that novelty in datasets, the cornerstone of data-driven studies, has a significantly larger effect size on citations than novelty at the paper level as measured by references. This suggests that novelty in data may be more impactful than general novelty of knowledge. Previous studies have primarily found a positive impact of novel combinations various aspects of a paper, such as references, methods, and results [24, 25, 26, 27, 28, 24]. In contrast, our research suggests that combinations of datasets of unusually combined topics can also have a negative impact.
Beyond academic contributions, our findings also present strategies for scientists, policymakers, and data curators for using and managing scientific data for research. We encourage researchers to explore new research avenues by combining infrequently paired datasets, while also considering “conventionality” — whether the topics of combined datasets are relatively “traditional”. Given that data combination has a significant effect on producing high-impact scientific findings, policymakers may encourage or even require the publication of data, particularly when it includes the possibility of linking to other data sources[19, 51]. Similarly, data curators might consider making datasets more “linkable” to other public datasets. For example, in research that employs individual publications as observations, we recommend that researchers include DOIs in their published data to facilitate linking by other researchers. Concurrently, data curators could create a data recommender system that considers the novelty of data pairings as part of the recommendations for data use. [23].
Several potential avenues for future research can be pursued based on the current results. First, considering the significant value of data combination in scientific outcomes, it is noteworthy that researchers seldom engage in this practice. Future studies could delve into the multiple stakeholders involved in data curation and research, aiming to understand the reasons behind the infrequent combination of data and the challenges encountered when attempting to combine datasets atypically. A comprehensive qualitative investigation may be necessary to shed light on these issues.
Second, we recommend a causal analysis to discern the mechanisms behind the increased scientific and broader impacts resulting from the combination of usually paired data. For instance, does the scientific community place greater value on evaluating hypotheses across multiple datasets and different settings? Or does connecting data, such as linking two datasets through a shared variable, lead to more groundbreaking scientific discoveries? To address these questions, the establishment of an improved data citation infrastructure that includes additional indications and labels for data linking is crucial.
Third, it is worth noting that our analysis focused solely on social science research. Future research should aim to replicate our findings in other disciplines. Moreover, exploring the potential heterogeneous effects of data combination across different fields, given disciplinary variations in data curation and usage practices, would be valuable. However, the successful execution of such studies is contingent upon resolving the challenges associated with data citation infrastructure, such as the labor-intensive nature of manual data citation. Apart from our dataset, data citations in other contexts should also be considered.
The strategic utilization of datasets in research holds promise for scientific advancement. Although combining datasets, particularly through atypical combinations, is not yet a common practice, our research suggests that promoting this approach among researchers, policies, and data curators could lead to scientific products that advance knowledge and raise awareness of scientific contributions.
Materials and Methods
Our analysis is based on a dataset comprising over 30,366 papers published in the past six decades, which extensively utilize 6,859 datasets from the Inter-university Consortium for Political and Social Research (ICPSR) [52]. The ICPSR is a leading provider of social science data for research, offering a comprehensive archive of data sources. The link between the dataset and publication is manually curated, with a link established only when a publication significantly utilizes the datasets to produce results, as opposed to brief or tangential references. The initial dataset comprises 101,674 publications, out of which 59,315 are missing DOI information. We locate papers that lacked DOIs in the dataset by matching titles, publication years, and author information through CrossRef. This process yields a total of 90,693 papers. Subsequently, we gather further information about each paper (e.g., citation counts, discipline, publication year, impact factor, references) and each author (e.g., author experience measured by number of citations) via the OpenAlex API [53]. Out of the 90,693 papers, 78,964 have records on OpenAlex, 51,209 include also author information, and 30,366 papers published before 2020 also have both concept (subject) tags and references available. Ultimately, our final sample consists of 30,366 papers, all of which have comprehensive information across all the aforementioned categories and were published before 2020. We also leverage the Altmetric dataset to identify mentions of research papers across multiple online sources, such as news, social media, policy documents, and Wikipedia. This dataset, provided by Altmetric (version as of July 3rd, 2023), extensively monitors various online platforms to detect posts containing links or references to published research. Additional details can be found in the SI Appendix section 1.
Atypicality of dataset measurement
To measure novelty, we adopt a general framework provided by the Stirling diversity measurement [37, 38]. Our novelty metric centers on dataset pairings within a paper, with infrequently paired datasets considered novel. From our dataset, we can calculate how often each pair of datasets has been used together in papers drawing from ICPSR data. Here, represents the atypicality of dataset combinations of paper . represents the set of datasets used in paper , and . represents the cosine similarity between dataset and in the data co-citation matrix, with and representing the proportion of datasets in paper . To compute , we create an article vector for each dataset . Each coordinate in vector represents an article, and is 1 if dataset is used in article , and 0 otherwise. is then defined as the cosine similarity between and . and are propositional representations of dataset and dataset in article ( and is the total number of datasets in article ). is defined in Equation 1. In the regression analysis, we standardize the atypicality score to account for potential variations and enhance comparability across different variables.
| (1) |
Topic atypicality
Adopting a similar quantification methodology as shown in Equation 1, we first gather all topics covered by the datasets used in a single publication and calculate how often each pair of data topics has been used together amongst all ICPSR datasets. Here, represents the topic atypicality of the dataset of paper . represents the union of topics covered by the datasets used in paper , and , with representing the cosine similarity between dataset topics, and representing the proportion of topics in a dataset. To compute , we create an article vector for each topic . Each coordinate of the vector represents each dataset’s topic in our sample, where each coordinate corresponds to an article, and is 1 if topic is used in article , and 0 otherwise. With the article vectors defined, we can compare how different topics are utilized in the article. We calculate via computing cosine similarity between and . and are propositional representations of topic and topic in article ( and is the total number of topics in article ). is defined in Equation 2.
| (2) |
Paper novelty
To measure the novelty of a paper, we use a similar approach to the one used to measure the atypicality of datasets (Equation 1). Following prior work [40], our novelty measure centers on journal pairings referenced within a paper, with infrequently paired journals considered novel. We calculate how often each pair of journals has been referenced together in papers, drawing on OpenAlex data. represents the paper novelty of paper . represents the set of journals referenced in paper , and . Here, represents the cosine similarity between journals and in the journal co-citation matrix, with and representing the proportion of reference’s journal in a publication. To compute , we create an article vector for each journal , with being 1 if journal is referenced in article and 0 otherwise. With the article vectors defined, we can compare how different journals are utilized in the papers. We calculate via the cosine similarity between and . and are propositional representations of journal and journal in article . Further details are provided in the SI Appendix, section 3. is defined in Equation 3.
| (3) |
References
- [1] Viktor Mayer-Schönberger and Kenneth Cukier. Big Data: A Revolution that Will Transform how We Live, Work, and Think. Houghton Mifflin Harcourt, 2013.
- [2] Virginia Gewin. Data sharing: An open mind on open data. Nature, 529(7584):117–119, January 2016.
- [3] Brooks Hanson, Andrew Sugden, and Bruce Alberts. Making data maximally available. Science, 331(6018):649, February 2011.
- [4] Mokter Hossain and Ilkka Kauranen. Open innovation in SMEs: a systematic literature review. Journal of Strategy and Management, 9(1):58–73, January 2016.
- [5] Peter Murray-Rust. Open data in science. Nature Precedings, pages 1–1, January 2008.
- [6] Matthias Scheffler, Martin Aeschlimann, Martin Albrecht, Tristan Bereau, Hans-Joachim Bungartz, Claudia Felser, Mark Greiner, Axel Groß, Christoph T Koch, Kurt Kremer, Wolfgang E Nagel, Markus Scheidgen, Christof Wöll, and Claudia Draxl. FAIR data enabling new horizons for materials research. Nature, 604(7907):635–642, April 2022.
- [7] Michael P Milham, R Cameron Craddock, Jake J Son, Michael Fleischmann, Jon Clucas, Helen Xu, Bonhwang Koo, Anirudh Krishnakumar, Bharat B Biswal, F Xavier Castellanos, Stan Colcombe, Adriana Di Martino, Xi-Nian Zuo, and Arno Klein. Assessment of the impact of shared brain imaging data on the scientific literature. Nat. Commun., 9(1):2818, July 2018.
- [8] Carol Tenopir, Suzie Allard, Kimberly Douglass, Arsev Umur Aydinoglu, Lei Wu, Eleanor Read, Maribeth Manoff, and Mike Frame. Data sharing by scientists: practices and perceptions. PloS one, 6(6):e21101, 2011.
- [9] Carol Tenopir, Natalie M Rice, Suzie Allard, Lynn Baird, Josh Borycz, Lisa Christian, Bruce Grant, Robert Olendorf, and Robert J Sandusky. Data sharing, management, use, and reuse: Practices and perceptions of scientists worldwide. PLoS One, 15(3):e0229003, March 2020.
- [10] Christopher J Markiewicz, Krzysztof J Gorgolewski, Franklin Feingold, Ross Blair, Yaroslav O Halchenko, Eric Miller, Nell Hardcastle, Joe Wexler, Oscar Esteban, Mathias Goncavles, Anita Jwa, and Russell Poldrack. The OpenNeuro resource for sharing of neuroscience data. Elife, 10, October 2021.
- [11] Patrick Andreoli-Versbach and Frank Mueller-Langer. Open access to data: An ideal professed but not practised. Res. Policy, 43(9):1621–1633, November 2014.
- [12] Christy A Hipsley and Emma Sherratt. Psychology, not technology, is our biggest challenge to open digital morphology data. Sci Data, 6(1):41, April 2019.
- [13] Jocelyn Kaiser and Jeffrey Brainard. Ready, set, share! Science, 379(6630):322–325, 2023.
- [14] Thijs Devriendt, Mahsa Shabani, and Pascal Borry. Data sharing platforms and the academic evaluation system. EMBO reports, 21(8):e50690, 2020.
- [15] Eva Mendez, Rebecca Lawrence, Catriona J MacCallum, Eva Moar, and Inge Van Nieuwerburgh. Progress on open science: towards a shared research knowledge system. final report of the open science policy platform. 2020.
- [16] Jelte M Wicherts, Marjan Bakker, and Dylan Molenaar. Willingness to share research data is related to the strength of the evidence and the quality of reporting of statistical results. PLoS One, 6(11):e26828, November 2011.
- [17] Steve Kelling, Wesley M Hochachka, Daniel Fink, Mirek Riedewald, Rich Caruana, Grant Ballard, and Giles Hooker. Data-intensive science: A new paradigm for biodiversity studies. Bioscience, 59(7):613–620, July 2009.
- [18] Benedikt Fecher, Sascha Friesike, and Marcel Hebing. What drives academic data sharing? PLoS One, 10(2):e0118053, February 2015.
- [19] Ryan Hill, Carolyn Stein, and Heidi Williams. Internalizing externalities: Designing effective data policies. AEA Papers and Proceedings, 110:49–54, May 2020.
- [20] Irene V Pasquetto, Bernadette M Randles, and Christine L Borgman. On the reuse of scientific data. 2017.
- [21] Irene V Pasquetto, Christine L Borgman, and Morgan F Wofford. Uses and reuses of scientific data: The data creators’ advantage. 2019.
- [22] Sara Lafia, AJ Million, and Libby Hemphill. Direct, orienting, and scenic paths: How users navigate search in a research data archive. In Proceedings of the 2023 Conference on Human Information Interaction and Retrieval, pages 128–136, 2023.
- [23] Vijay Viswanathan, Luyu Gao, Tongshuang Wu, Pengfei Liu, and Graham Neubig. DataFinder: Scientific dataset recommendation from natural language descriptions. In Proceedings of the 61st Annual Meeting of the Association for Computational Linguistics (Volume 1: Long Papers), pages 10288–10303, Toronto, Canada, July 2023. Association for Computational Linguistics.
- [24] E Leahey, J Lee, and R J Funk. What types of novelty are most disruptive? Am. Sociol. Rev.
- [25] Brian Uzzi, Satyam Mukherjee, Michael Stringer, and Ben Jones. Atypical combinations and scientific impact. Science, 342(6157):468–472, October 2013.
- [26] Feng Shi and James Evans. Surprising combinations of research contents and contexts are related to impact and emerge with scientific outsiders from distant disciplines. Nat. Commun., 14(1):1641, March 2023.
- [27] J G Foster, A Rzhetsky, and others. Tradition and innovation in scientists’ research strategies. Am. Sociol. Rev., 2015.
- [28] Y Lin, J A Evans, and L Wu. New directions in science emerge from disconnection and discord. J. Informetr., 2022.
- [29] Martin Fenner, Mercè Crosas, Jeffrey S Grethe, David Kennedy, Henning Hermjakob, Phillippe Rocca-Serra, Gustavo Durand, Robin Berjon, Sebastian Karcher, Maryann Martone, et al. A data citation roadmap for scholarly data repositories. Scientific data, 6(1):28, 2019.
- [30] Helena Cousijn, Patricia Feeney, Daniella Lowenberg, Eleonora Presani, and Natasha Simons. Bringing citations and usage metrics together to make data count. Data Science Journal, 18:9–9, 2019.
- [31] Elizabeth Moss and Jared Lyle. Opaque data citation: Actual citation practice and its implication for tracking data use. Poster presented at the 13th International Digital Curation Conference …, 2018.
- [32] Catherine Blake. Beyond genes, proteins, and abstracts: Identifying scientific claims from full-text biomedical articles. Journal of biomedical informatics, 43(2):173–189, 2010.
- [33] Stefan Wuchty, Benjamin F Jones, and Brian Uzzi. The increasing dominance of teams in production of knowledge. Science, 316(5827):1036–1039, 2007.
- [34] Katherine W McCain. Mapping authors in intellectual space: A technical overview. Journal of the American Society for Information Science (1986-1998), 41(6):433, 1990.
- [35] Filippo Radicchi, Santo Fortunato, and Claudio Castellano. Universality of citation distributions: Toward an objective measure of scientific impact. Proceedings of the National Academy of Sciences, 105(45):17268–17272, 2008.
- [36] Sidney Redner. How popular is your paper? an empirical study of the citation distribution. The European Physical Journal B-Condensed Matter and Complex Systems, 4(2):131–134, 1998.
- [37] Andy Stirling. A general framework for analysing diversity in science, technology and society. J. R. Soc. Interface, 4(15):707–719, August 2007.
- [38] Yang Yang, Tanya Y Tian, Teresa K Woodruff, Benjamin F Jones, and Brian Uzzi. Gender-diverse teams produce more novel and higher-impact scientific ideas. Proc. Natl. Acad. Sci. U. S. A., 119(36):e2200841119, September 2022.
- [39] Alan Porter and Ismael Rafols. Is science becoming more interdisciplinary? measuring and mapping six research fields over time. Scientometrics, 81(3):719–745, 2009.
- [40] Brian Uzzi, Satyam Mukherjee, Michael Stringer, and Ben Jones. Atypical combinations and scientific impact. Science, 342(6157):468–472, 2013.
- [41] Lingfei Wu, Dashun Wang, and James A Evans. Large teams develop and small teams disrupt science and technology. Nature, 566(7744):378–382, 2019.
- [42] Benjamin F Jones. The burden of knowledge and the “death of the renaissance man”: Is innovation getting harder? The Review of Economic Studies, 76(1):283–317, 2009.
- [43] Kevin Boudreau, Eva Catharina Guinan, Karim R Lakhani, and Christoph Riedl. The novelty paradox & bias for normal science: Evidence from randomized medical grant proposal evaluations. Harvard Business School working paper series# 13-053, 2012.
- [44] Dennis Verhoeven, Jurriën Bakker, and Reinhilde Veugelers. Measuring technological novelty with patent-based indicators. Res. Policy, 45(3):707–723, April 2016.
- [45] J Wang, R Veugelers, and P Stephan. Bias against novelty in science: A cautionary tale for users of bibliometric indicators. Res. Policy, 2017.
- [46] You-Na Lee, John P Walsh, and Jian Wang. Creativity in scientific teams: Unpacking novelty and impact. Res. Policy, 44(3):684–697, April 2015.
- [47] Lingfei Wu, Dashun Wang, and James A Evans. Large teams develop and small teams disrupt science and technology. Nature, 566(7744):378–382, February 2019.
- [48] Lutz Bornmann, Alexander Tekles, Helena H Zhang, and Fred Y Ye. Do we measure novelty when we analyze unusual combinations of cited references? a validation study of bibliometric novelty indicators based on F1000Prime data. J. Informetr., 13(4):100979, November 2019.
- [49] Sotaro Shibayama, Deyun Yin, and Kuniko Matsumoto. Measuring novelty in science with word embedding. PLoS One, 16(7):e0254034, July 2021.
- [50] Erin Leahey, Jina Lee, and Russell J Funk. What types of novelty are most disruptive? American Sociological Review, 88(3):562–597, 2023.
- [51] J Mason Heberling, Joseph T Miller, Daniel Noesgaard, Scott B Weingart, and Dmitry Schigel. Data integration enables global biodiversity synthesis. Proc. Natl. Acad. Sci. U. S. A., 118(6), February 2021.
- [52] Sara Lafia, Lizhou Fan, Andrea Thomer, and Libby Hemphill. Subdivisions and crossroads: Identifying hidden community structures in a data archive’s citation network. Quantitative Science Studies, 3(3):694–714, 2022.
- [53] Jason Priem, Heather Piwowar, and Richard Orr. Openalex: A fully-open index of scholarly works, authors, venues, institutions, and concepts. arXiv preprint arXiv:2205.01833, 2022.
Supplementary Information
This document includes:
Supplementary Note 1: Data Description
Supplementary Note 2: Example of Measurements
Supplementary Note 3: Variable Description
Supplementary Note 4: Regression Tables
Supplementary Note 5: Regression Equations
1. Data Description
In order to quantify the effect of aytpicality of data combinations on scientific impact, we intregrat three data resource.
(1) ICPSR Bibliography: a meticulously curated data citation link comprising social science datasets curated by ICPSR and publications published between 1962 and 2021 that have cited these datasets. This link is established exclusively when the publications incorporate comprehensive discussions of data-related methodologies. To ensure data accuracy, papers lacking DOIs in the dataset were located using CrossRef, supplemented by manual verification.
(2) Openalex dataset: a fully-open scientific knowledge graph was launched to replace the discontinued Microsoft Academic Graph (MAG), encompassing metadata for 209 million works and 2,013 million authors. In this project, we relied on the Openalex dataset (Openalex API) to extract publication information, including references, citations, author lists, and disciplines. Additionally, we extracted author information, such as their total citations.
(3) Altmetric Dataset: The Altmetric Dataset captures online attention given to research publications. It encompasses approximately 191 million mentions of 35 million research outputs and identifies references to research papers from various online sources, including news articles, social media platforms, policy documents, and Wikipedia. To identify paper mentions from news, social media, policy documents, and Wikipedia, we utilize DOI linking in our dataset. We extracted number of mentions in news, social media, policy documents, and Wikipedia for all papers included in the analysis till July 2023.
In total, we obtain 30,366 papers with 6,859 unique datasets that were published before 2020 with data citation in ICPSR.
2. Example of Measurements
Atypicality of dataset combination:
10 ramdom example of top 25% quantile atypicality of data combination score and bottom 25% quantile atypicality of data combination score See pages - of highatyplicality_example_nb.pdf See pages - of lowatyplicality_example_nb.pdf
Topic atypicality:
10 ramdom example of top 25% quantile topic atypicality and bottom 25% quantile topic atypicality See pages - of Topic_atyplicality_high_novelty.pdf See pages - of Topic_atyplicality_low_novelty.pdf
3. Variables Description
Number of datasets: The total number of datasets used in a paper. A publication needs to significantly utilize the datasets to produce results to be counted, as opposed to brief or tangential references [52].
3 year citation impact of paper: We utilize the OpenAlex API to extract all papers that have cited the targeted paper within a 3-year timeframe, starting from its publication year.
5% hit paper: We define a “5% hit paper” as a paper that has received citations within the top 5% of all papers in our dataset, based on their citation count over a 3-year period.
Publication year: The year of publication is significantly associated with citation rates. Therefore, in order to control for potential time effects, we incorporate the year variable as dummy variables. Each dummy variable corresponds to a five-year interval, allowing us to effectively account for the impact of time on citation patterns.
Dataset use frequency: A paper utilizing a frequently used dataset may focus on popular research questions, which could potentially confound the citation analysis. To address this concern, we introduce dataset use frequency as a controlling variable when investigating its impact on citation rates. In cases where a paper incorporates multiple datasets, we calculate the average frequency at which each dataset is utilized within the paper.
Number of authors: Research on team science suggests that the number of co-authors is positively associated with citation impact, as a larger number of co-authors tends to result in a more extensive citation network.
Author Recognition: Author recognition can serve as a proxy for experience and authority in the field. Moreover, this variable has a strong correlation with citation impact. In this study, we assess author recognition by calculating the average number of citations received by the authors of a given paper.
Disciplines: In this study, we adopt the notion of Level 0 disciplines as provided by the Openalex dataset. Each paper in the dataset is associated with one or more discipline labels, and the weights for these labels are derived using deep learning models. The 19 major disciplines considered in the analysis are sociology, psychology, political science, physics, philosophy, medicine, mathematics, material science, history, geology, geography, environmental science, engineering, economics, computer science, chemistry, business, biology, and art.
Impact Factor of Journal: The majority of journals in our dataset do not have a public recorded impact factor. To address this limitation, we employ an alternative approach by calculating the average citation count for papers published in these journals during the year 2019. This average citation count is used as a proxy for the impact factor of the journal.
Paper novelty (Atypicality of reference’s journal combination): We assess the atypicality of reference combination employing the Sterling index [37], a general-purpose tool for measuring atypicality. Prior studies have utilized the Sterling index to quantify atypicality in the combination of references’ journal or multidisciplinary contexts [38, 39]. Papers that use commonly combined reference’s journal represent typical papers, whereas those combining seldom associated ’s journal depict novel or atypical reference combinations. The Sterling index varies from 0 to 1, with higher values denoting greater atypicality.
4. Regression Tables
The full regression table is presented in Table 1 to Table 33.
(1) The effect of dataset combinations on scientific impact:- Impact of using multiple datasets (using data combinations) on citation over 3, 5, 10 year(Table 1-3).
| Dep. Variable: 3 year citation | coef | std err | z | Pz | [0.025 | 0.975] |
|---|---|---|---|---|---|---|
| Intercept | -2.7475 | 0.028 | -99.895 | 0.000 | -2.801 | -2.694 |
| binary UsingMultipleDataset | 0.2197 | 0.003 | 75.747 | 0.000 | 0.214 | 0.225 |
| Data use frequency(log) | 0.0492 | 0.001 | 61.196 | 0.000 | 0.048 | 0.051 |
| NumAuthor | 0.0276 | 0.000 | 96.397 | 0.000 | 0.027 | 0.028 |
| AuthorExprience(log) | 0.4091 | 0.001 | 341.456 | 0.000 | 0.407 | 0.411 |
| ImpactFactor(log) | 0.4503 | 0.002 | 207.277 | 0.000 | 0.446 | 0.455 |
| Art | -0.7981 | 0.157 | -5.084 | 0.000 | -1.106 | -0.490 |
| Biology | -1.0346 | 0.033 | -31.451 | 0.000 | -1.099 | -0.970 |
| Business | -0.1333 | 0.019 | -6.920 | 0.000 | -0.171 | -0.096 |
| Chemistry | 0.4076 | 0.036 | 11.365 | 0.000 | 0.337 | 0.478 |
| Computer_science | 0.4604 | 0.021 | 21.425 | 0.000 | 0.418 | 0.503 |
| Economics | 0.3351 | 0.014 | 24.578 | 0.000 | 0.308 | 0.362 |
| Engineering | -0.3978 | 0.054 | -7.322 | 0.000 | -0.504 | -0.291 |
| Environmental_science | 1.7511 | 0.039 | 44.433 | 0.000 | 1.674 | 1.828 |
| Geography | -0.3756 | 0.020 | -18.493 | 0.000 | -0.415 | -0.336 |
| Geology | -0.7238 | 0.222 | -3.261 | 0.001 | -1.159 | -0.289 |
| History | -0.9133 | 0.089 | -10.302 | 0.000 | -1.087 | -0.740 |
| Materials_science | -1.7100 | 0.407 | -4.205 | 0.000 | -2.507 | -0.913 |
| Mathematics | 0.2039 | 0.028 | 7.379 | 0.000 | 0.150 | 0.258 |
| Medicine | 0.5839 | 0.010 | 58.530 | 0.000 | 0.564 | 0.603 |
| Philosophy | 0.3109 | 0.116 | 2.675 | 0.007 | 0.083 | 0.539 |
| Physics | 0.6722 | 0.126 | 5.352 | 0.000 | 0.426 | 0.918 |
| Political_science | 0.2422 | 0.014 | 17.654 | 0.000 | 0.215 | 0.269 |
| Psychology | -0.0519 | 0.010 | -5.334 | 0.000 | -0.071 | -0.033 |
| Sociology | 0.3856 | 0.015 | 25.722 | 0.000 | 0.356 | 0.415 |
| 1974, 1979 | 0.1374 | 0.029 | 4.705 | 0.000 | 0.080 | 0.195 |
| 1979, 1984 | -0.2165 | 0.028 | -7.699 | 0.000 | -0.272 | -0.161 |
| 1984, 1989 | -0.0826 | 0.026 | -3.127 | 0.002 | -0.134 | -0.031 |
| 1989, 1994 | 0.1791 | 0.025 | 7.077 | 0.000 | 0.129 | 0.229 |
| 1994, 1999 | 0.6874 | 0.025 | 28.002 | 0.000 | 0.639 | 0.736 |
| 1999, 2004 | 0.8155 | 0.024 | 33.369 | 0.000 | 0.768 | 0.863 |
| 2004, 2009 | 0.8505 | 0.024 | 34.863 | 0.000 | 0.803 | 0.898 |
| 2009, 2014 | 0.6496 | 0.024 | 26.616 | 0.000 | 0.602 | 0.697 |
| 2014, 2020 | 0.5258 | 0.024 | 21.509 | 0.000 | 0.478 | 0.574 |
| No. Observations: | 30366 | Log-Likelihood: | -5.0561e+05 | |||
| Df Residuals: | 30332 | Df Model: | 33 | |||
| Deviance: | 8.9371e+05 | Pearson chi2: | 2.70e+06 |
| Dep. Variable: 5 year citation | coef | std err | z | Pz | [0.025 | 0.975] |
|---|---|---|---|---|---|---|
| Intercept | -1.2852 | 0.023 | -55.693 | 0.000 | -1.330 | -1.240 |
| binary UsingMultipleDataset | 0.1539 | 0.003 | 58.957 | 0.000 | 0.149 | 0.159 |
| Data use frequency(log) | 0.0389 | 0.001 | 56.480 | 0.000 | 0.038 | 0.040 |
| NumAuthor | 0.0211 | 0.000 | 67.469 | 0.000 | 0.020 | 0.022 |
| AuthorExprience(log) | 0.3186 | 0.001 | 311.465 | 0.000 | 0.317 | 0.321 |
| ImpactFactor(log) | 0.3640 | 0.002 | 192.990 | 0.000 | 0.360 | 0.368 |
| Art | -0.7803 | 0.131 | -5.974 | 0.000 | -1.036 | -0.524 |
| Biology | -0.7382 | 0.028 | -25.926 | 0.000 | -0.794 | -0.682 |
| Business | -0.2115 | 0.016 | -12.918 | 0.000 | -0.244 | -0.179 |
| Chemistry | 0.1866 | 0.033 | 5.614 | 0.000 | 0.121 | 0.252 |
| Computer_science | 0.3092 | 0.019 | 16.085 | 0.000 | 0.272 | 0.347 |
| Economics | 0.2830 | 0.012 | 24.137 | 0.000 | 0.260 | 0.306 |
| Engineering | -0.1653 | 0.046 | -3.626 | 0.000 | -0.255 | -0.076 |
| Environmental_science | 1.0098 | 0.040 | 25.002 | 0.000 | 0.931 | 1.089 |
| Geography | -0.2437 | 0.017 | -14.283 | 0.000 | -0.277 | -0.210 |
| Geology | -0.4126 | 0.188 | -2.195 | 0.028 | -0.781 | -0.044 |
| History | -0.8108 | 0.073 | -11.088 | 0.000 | -0.954 | -0.668 |
| Materials_science | -0.4554 | 0.317 | -1.437 | 0.151 | -1.077 | 0.166 |
| Mathematics | -0.3393 | 0.026 | -13.104 | 0.000 | -0.390 | -0.289 |
| Medicine | 0.4128 | 0.009 | 47.290 | 0.000 | 0.396 | 0.430 |
| Philosophy | 0.3227 | 0.096 | 3.359 | 0.001 | 0.134 | 0.511 |
| Physics | 1.2021 | 0.100 | 12.040 | 0.000 | 1.006 | 1.398 |
| Political_science | 0.0622 | 0.012 | 5.329 | 0.000 | 0.039 | 0.085 |
| Psychology | -0.0535 | 0.008 | -6.294 | 0.000 | -0.070 | -0.037 |
| Sociology | 0.3062 | 0.013 | 24.280 | 0.000 | 0.281 | 0.331 |
| 1974, 1979 | 0.0061 | 0.025 | 0.242 | 0.809 | -0.043 | 0.055 |
| 1979, 1984 | -0.1383 | 0.023 | -5.908 | 0.000 | -0.184 | -0.092 |
| 1984, 1989 | -0.0098 | 0.022 | -0.446 | 0.656 | -0.053 | 0.033 |
| 1989, 1994 | 0.1956 | 0.021 | 9.212 | 0.000 | 0.154 | 0.237 |
| 1994, 1999 | 0.5945 | 0.021 | 28.822 | 0.000 | 0.554 | 0.635 |
| 1999, 2004 | 0.7950 | 0.020 | 38.781 | 0.000 | 0.755 | 0.835 |
| 2004, 2009 | 0.8808 | 0.020 | 43.073 | 0.000 | 0.841 | 0.921 |
| 2009, 2014 | 0.7441 | 0.020 | 36.396 | 0.000 | 0.704 | 0.784 |
| 2014, 2020 | 0.6283 | 0.021 | 30.516 | 0.000 | 0.588 | 0.669 |
| No. Observations: | 27099 | Log-Likelihood: | -4.3479e+05 | |||
| Df Residuals: | 27065 | Df Model: | 33 | |||
| Deviance: | 7.5235e+05 | Pearson chi2: | 1.71e+06 |
| Dep. Variable: 10 year citation | coef | std err | z | Pz | [0.025 | 0.975] |
|---|---|---|---|---|---|---|
| Intercept | -0.6815 | 0.016 | -41.526 | 0.000 | -0.714 | -0.649 |
| binary UsingMultipleDataset | 0.1504 | 0.002 | 73.114 | 0.000 | 0.146 | 0.154 |
| Data use frequency(log) | 0.0469 | 0.001 | 88.141 | 0.000 | 0.046 | 0.048 |
| NumAuthor | 0.0419 | 0.000 | 117.849 | 0.000 | 0.041 | 0.043 |
| AuthorExprience(log) | 0.3621 | 0.001 | 444.072 | 0.000 | 0.361 | 0.364 |
| ImpactFactor(log) | 0.2981 | 0.001 | 217.426 | 0.000 | 0.295 | 0.301 |
| Art | -0.5721 | 0.094 | -6.112 | 0.000 | -0.756 | -0.389 |
| Biology | -1.2346 | 0.022 | -55.212 | 0.000 | -1.278 | -1.191 |
| Business | -0.3985 | 0.013 | -30.558 | 0.000 | -0.424 | -0.373 |
| Chemistry | 0.1425 | 0.023 | 6.083 | 0.000 | 0.097 | 0.188 |
| Computer_science | 0.1758 | 0.015 | 11.756 | 0.000 | 0.147 | 0.205 |
| Economics | 0.2306 | 0.009 | 26.718 | 0.000 | 0.214 | 0.248 |
| Engineering | -0.6921 | 0.039 | -17.936 | 0.000 | -0.768 | -0.616 |
| Environmental_science | 1.3456 | 0.029 | 47.020 | 0.000 | 1.289 | 1.402 |
| Geography | -0.3086 | 0.013 | -23.255 | 0.000 | -0.335 | -0.283 |
| Geology | -0.0610 | 0.141 | -0.433 | 0.665 | -0.338 | 0.215 |
| History | -0.7625 | 0.051 | -14.939 | 0.000 | -0.863 | -0.662 |
| Materials_science | -0.7998 | 0.384 | -2.083 | 0.037 | -1.552 | -0.047 |
| Mathematics | 0.0013 | 0.019 | 0.067 | 0.946 | -0.036 | 0.038 |
| Medicine | 0.1474 | 0.007 | 22.162 | 0.000 | 0.134 | 0.160 |
| Philosophy | 0.2225 | 0.067 | 3.339 | 0.001 | 0.092 | 0.353 |
| Physics | 0.8489 | 0.085 | 10.035 | 0.000 | 0.683 | 1.015 |
| Political_science | 0.0117 | 0.009 | 1.359 | 0.174 | -0.005 | 0.028 |
| Psychology | -0.0163 | 0.007 | -2.493 | 0.013 | -0.029 | -0.003 |
| Sociology | 0.3678 | 0.009 | 40.345 | 0.000 | 0.350 | 0.386 |
| 1974, 1979 | -0.0937 | 0.018 | -5.353 | 0.000 | -0.128 | -0.059 |
| 1979, 1984 | -0.2308 | 0.016 | -14.178 | 0.000 | -0.263 | -0.199 |
| 1984, 1989 | -0.0151 | 0.015 | -0.995 | 0.320 | -0.045 | 0.015 |
| 1989, 1994 | 0.2806 | 0.015 | 19.227 | 0.000 | 0.252 | 0.309 |
| 1994, 1999 | 0.7030 | 0.014 | 49.384 | 0.000 | 0.675 | 0.731 |
| 1999, 2004 | 0.8460 | 0.014 | 59.672 | 0.000 | 0.818 | 0.874 |
| 2004, 2009 | 0.8168 | 0.014 | 57.666 | 0.000 | 0.789 | 0.845 |
| 2009, 2014 | 0.6302 | 0.014 | 44.285 | 0.000 | 0.602 | 0.658 |
| No. Observations: | 19565 | Log-Likelihood: | -7.0562e+05 | |||
| Df Residuals: | 19532 | Df Model: | 32 | |||
| Deviance: | 1.3100e+06 | Pearson chi2: | 2.84e+06 |
Tables 4 - 7 present the effects of using multiple dataset (data combination) on citations, based on a three-year analysis of publications released in four distinct time periods: before 1990, 1990-2000, 2000-2010, and 2010-2020.
| Dep. Variable: 3 year citation | coef | std err | z | Pz | [0.025 | 0.975] |
|---|---|---|---|---|---|---|
| Intercept | -1.5993 | 0.020 | -80.091 | 0.000 | -1.638 | -1.560 |
| binary UsingMultipleDataset | 0.2494 | 0.004 | 58.626 | 0.000 | 0.241 | 0.258 |
| Data use frequency(log) | 0.0199 | 0.001 | 16.081 | 0.000 | 0.017 | 0.022 |
| NumAuthor | 0.0215 | 0.000 | 51.089 | 0.000 | 0.021 | 0.022 |
| AuthorExprience(log) | 0.3319 | 0.002 | 189.542 | 0.000 | 0.328 | 0.335 |
| ImpactFactor(log) | 0.5927 | 0.004 | 155.499 | 0.000 | 0.585 | 0.600 |
| Art | -0.2598 | 0.253 | -1.026 | 0.305 | -0.756 | 0.237 |
| Biology | -0.8674 | 0.047 | -18.648 | 0.000 | -0.959 | -0.776 |
| Business | -0.0578 | 0.028 | -2.052 | 0.040 | -0.113 | -0.003 |
| Chemistry | 0.0213 | 0.063 | 0.338 | 0.735 | -0.102 | 0.144 |
| Computer_science | 0.3820 | 0.032 | 12.102 | 0.000 | 0.320 | 0.444 |
| Economics | 0.3558 | 0.024 | 14.908 | 0.000 | 0.309 | 0.403 |
| Engineering | 0.1694 | 0.069 | 2.445 | 0.014 | 0.034 | 0.305 |
| Environmental_science | -0.4740 | 0.093 | -5.106 | 0.000 | -0.656 | -0.292 |
| Geography | -0.5325 | 0.030 | -17.627 | 0.000 | -0.592 | -0.473 |
| Geology | -0.1124 | 0.403 | -0.279 | 0.781 | -0.903 | 0.678 |
| History | -1.1710 | 0.170 | -6.875 | 0.000 | -1.505 | -0.837 |
| Materials_science | -1.1174 | 0.486 | -2.299 | 0.022 | -2.070 | -0.165 |
| Mathematics | -0.5977 | 0.047 | -12.681 | 0.000 | -0.690 | -0.505 |
| Medicine | 0.3664 | 0.016 | 23.573 | 0.000 | 0.336 | 0.397 |
| Philosophy | 0.4069 | 0.290 | 1.404 | 0.160 | -0.161 | 0.975 |
| Physics | -0.7937 | 0.223 | -3.562 | 0.000 | -1.230 | -0.357 |
| Political_science | 0.3325 | 0.024 | 14.108 | 0.000 | 0.286 | 0.379 |
| Psychology | -0.1245 | 0.015 | -8.466 | 0.000 | -0.153 | -0.096 |
| Sociology | 0.3916 | 0.026 | 15.271 | 0.000 | 0.341 | 0.442 |
| No. Observations: | 14705 | Log-Likelihood: | -1.9782e+05 | |||
| Df Residuals: | 14679 | Df Model: | 25 | |||
| Deviance: | 3.3968e+05 | Pearson chi2: | 1.02e+06 |
| Dep. Variable: 3 year citation | coef | std err | z | Pz | [0.025 | 0.975] |
|---|---|---|---|---|---|---|
| Intercept | -2.8696 | 0.020 | -140.519 | 0.000 | -2.910 | -2.830 |
| binary UsingMultipleDataset | 0.3278 | 0.004 | 77.533 | 0.000 | 0.320 | 0.336 |
| Data use frequency(log) | 0.0680 | 0.001 | 57.684 | 0.000 | 0.066 | 0.070 |
| NumAuthor | 0.0507 | 0.001 | 83.210 | 0.000 | 0.049 | 0.052 |
| AuthorExprience(log) | 0.5255 | 0.002 | 282.144 | 0.000 | 0.522 | 0.529 |
| ImpactFactor(log) | 0.3822 | 0.003 | 130.855 | 0.000 | 0.376 | 0.388 |
| Art | -3.2169 | 0.275 | -11.690 | 0.000 | -3.756 | -2.678 |
| Biology | -1.9846 | 0.049 | -40.588 | 0.000 | -2.080 | -1.889 |
| Business | -0.4030 | 0.032 | -12.588 | 0.000 | -0.466 | -0.340 |
| Chemistry | 0.3855 | 0.045 | 8.602 | 0.000 | 0.298 | 0.473 |
| Computer_science | 0.5521 | 0.033 | 16.526 | 0.000 | 0.487 | 0.618 |
| Economics | 0.4159 | 0.021 | 19.365 | 0.000 | 0.374 | 0.458 |
| Engineering | -1.7110 | 0.099 | -17.219 | 0.000 | -1.906 | -1.516 |
| Environmental_science | 2.6763 | 0.044 | 60.421 | 0.000 | 2.589 | 2.763 |
| Geography | -0.7585 | 0.032 | -23.898 | 0.000 | -0.821 | -0.696 |
| Geology | 1.2022 | 0.279 | 4.314 | 0.000 | 0.656 | 1.748 |
| History | -1.3570 | 0.156 | -8.710 | 0.000 | -1.662 | -1.052 |
| Materials_science | -30.2787 | 3.673 | -8.244 | 0.000 | -37.477 | -23.080 |
| Mathematics | 0.5864 | 0.040 | 14.696 | 0.000 | 0.508 | 0.665 |
| Medicine | 0.4286 | 0.015 | 28.690 | 0.000 | 0.399 | 0.458 |
| Philosophy | 2.3551 | 0.169 | 13.976 | 0.000 | 2.025 | 2.685 |
| Physics | 2.2358 | 0.181 | 12.380 | 0.000 | 1.882 | 2.590 |
| Political_science | 0.3147 | 0.022 | 14.427 | 0.000 | 0.272 | 0.357 |
| Psychology | -0.1773 | 0.015 | -11.938 | 0.000 | -0.206 | -0.148 |
| Sociology | 0.3438 | 0.024 | 14.525 | 0.000 | 0.297 | 0.390 |
| No. Observations: | 10299 | Log-Likelihood: | -2.4564e+05 | |||
| Df Residuals: | 10273 | Df Model: | 25 | |||
| Deviance: | 4.4993e+05 | Pearson chi2: | 1.22e+06 |
| Dep. Variable: 3 year citation | coef | std err | z | Pz | [0.025 | 0.975] |
|---|---|---|---|---|---|---|
| Intercept | -3.7332 | 0.034 | -109.848 | 0.000 | -3.800 | -3.667 |
| binary UsingMultipleDataset | 0.1411 | 0.008 | 17.673 | 0.000 | 0.125 | 0.157 |
| Data use frequency(log) | 0.1273 | 0.002 | 56.220 | 0.000 | 0.123 | 0.132 |
| NumAuthor | 0.0694 | 0.002 | 42.746 | 0.000 | 0.066 | 0.073 |
| AuthorExprience(log) | 0.4306 | 0.003 | 142.325 | 0.000 | 0.425 | 0.437 |
| ImpactFactor(log) | 0.6062 | 0.005 | 118.780 | 0.000 | 0.596 | 0.616 |
| Art | 0.8904 | 0.270 | 3.294 | 0.001 | 0.361 | 1.420 |
| Biology | 0.4074 | 0.086 | 4.713 | 0.000 | 0.238 | 0.577 |
| Business | 0.1727 | 0.045 | 3.850 | 0.000 | 0.085 | 0.261 |
| Chemistry | 0.8022 | 0.124 | 6.479 | 0.000 | 0.560 | 1.045 |
| Computer_science | 0.6777 | 0.055 | 12.391 | 0.000 | 0.570 | 0.785 |
| Economics | 0.7600 | 0.029 | 26.397 | 0.000 | 0.704 | 0.816 |
| Engineering | -0.1597 | 0.158 | -1.008 | 0.313 | -0.470 | 0.151 |
| Environmental_science | 1.7341 | 0.186 | 9.342 | 0.000 | 1.370 | 2.098 |
| Geography | 0.6188 | 0.053 | 11.722 | 0.000 | 0.515 | 0.722 |
| Geology | -2.1956 | 0.511 | -4.295 | 0.000 | -3.198 | -1.194 |
| History | 0.1470 | 0.165 | 0.890 | 0.373 | -0.177 | 0.471 |
| Materials_science | 1.5184 | 1.001 | 1.517 | 0.129 | -0.444 | 3.481 |
| Mathematics | 0.4465 | 0.069 | 6.443 | 0.000 | 0.311 | 0.582 |
| Medicine | 1.3813 | 0.024 | 57.640 | 0.000 | 1.334 | 1.428 |
| Philosophy | -0.8591 | 0.263 | -3.262 | 0.001 | -1.375 | -0.343 |
| Physics | 3.0929 | 0.223 | 13.846 | 0.000 | 2.655 | 3.531 |
| Political_science | 0.7404 | 0.029 | 25.277 | 0.000 | 0.683 | 0.798 |
| Psychology | 0.4200 | 0.024 | 17.224 | 0.000 | 0.372 | 0.468 |
| Sociology | 0.6812 | 0.032 | 21.129 | 0.000 | 0.618 | 0.744 |
| No. Observations: | 4994 | Log-Likelihood: | -87491. | |||
| Df Residuals: | 4968 | Df Model: | 25 | |||
| Deviance: | 1.5785e+05 | Pearson chi2: | 5.06e+05 |
| Dep. Variable: 3 year citation | coef | std err | z | Pz | [0.025 | 0.975] |
|---|---|---|---|---|---|---|
| Intercept | -1.2257 | 0.057 | -21.673 | 0.000 | -1.337 | -1.115 |
| binary UsingMultipleDataset | 0.0255 | 0.016 | 1.608 | 0.108 | -0.006 | 0.057 |
| Data use frequency(log) | -0.0249 | 0.004 | -6.067 | 0.000 | -0.033 | -0.017 |
| NumAuthor | 0.0958 | 0.006 | 15.173 | 0.000 | 0.083 | 0.108 |
| AuthorExprience(log) | 0.3161 | 0.005 | 64.861 | 0.000 | 0.307 | 0.326 |
| ImpactFactor(log) | 0.2748 | 0.009 | 29.975 | 0.000 | 0.257 | 0.293 |
| Art | -1.3671 | 0.775 | -1.764 | 0.078 | -2.886 | 0.152 |
| Biology | 0.3344 | 0.178 | 1.876 | 0.061 | -0.015 | 0.684 |
| Business | -0.3997 | 0.090 | -4.451 | 0.000 | -0.576 | -0.224 |
| Chemistry | 1.5099 | 0.188 | 8.029 | 0.000 | 1.141 | 1.878 |
| Computer_science | -0.8659 | 0.098 | -8.875 | 0.000 | -1.057 | -0.675 |
| Economics | 0.3343 | 0.049 | 6.764 | 0.000 | 0.237 | 0.431 |
| Engineering | -1.6837 | 0.273 | -6.179 | 0.000 | -2.218 | -1.150 |
| Environmental_science | -2.4969 | 0.497 | -5.019 | 0.000 | -3.472 | -1.522 |
| Geography | 0.4517 | 0.087 | 5.204 | 0.000 | 0.282 | 0.622 |
| Geology | -2.6760 | 1.333 | -2.008 | 0.045 | -5.288 | -0.064 |
| History | -0.7268 | 0.204 | -3.565 | 0.000 | -1.126 | -0.327 |
| Materials_science | -0.7081 | 0.751 | -0.943 | 0.346 | -2.179 | 0.763 |
| Mathematics | -0.0998 | 0.102 | -0.975 | 0.330 | -0.300 | 0.101 |
| Medicine | -0.0120 | 0.049 | -0.246 | 0.806 | -0.108 | 0.084 |
| Philosophy | -0.8907 | 0.269 | -3.310 | 0.001 | -1.418 | -0.363 |
| Physics | 0.6643 | 0.349 | 1.904 | 0.057 | -0.019 | 1.348 |
| Political_science | -0.3159 | 0.045 | -6.990 | 0.000 | -0.404 | -0.227 |
| Psychology | 0.2292 | 0.043 | 5.353 | 0.000 | 0.145 | 0.313 |
| Sociology | 0.0270 | 0.050 | 0.536 | 0.592 | -0.072 | 0.125 |
| No. Observations: | 2695 | Log-Likelihood: | -17287. | |||
| Df Residuals: | 2669 | Df Model: | 25 | |||
| Deviance: | 26479. | Pearson chi2: | 4.33e+04 |
Alternative Robustness check: Impact of number of datasets used on citation over 3, 5, 10 year. (Table 8-10)
| Dep. Variable: 3 year citation | coef | std err | z | Pz | [0.025 | 0.975] |
|---|---|---|---|---|---|---|
| Intercept | -2.7251 | 0.027 | -99.142 | 0.000 | -2.779 | -2.671 |
| NumDatasets | 0.0089 | 0.000 | 48.705 | 0.000 | 0.009 | 0.009 |
| Data use frequency(log) | 0.0464 | 0.001 | 58.483 | 0.000 | 0.045 | 0.048 |
| NumAuthor | 0.0270 | 0.000 | 94.000 | 0.000 | 0.026 | 0.028 |
| AuthorExprience(log) | 0.4112 | 0.001 | 343.487 | 0.000 | 0.409 | 0.414 |
| ImpactFactor(log) | 0.4537 | 0.002 | 208.933 | 0.000 | 0.449 | 0.458 |
| Art | -0.6858 | 0.157 | -4.360 | 0.000 | -0.994 | -0.378 |
| Biology | -1.0741 | 0.033 | -32.736 | 0.000 | -1.138 | -1.010 |
| Business | -0.1537 | 0.019 | -7.972 | 0.000 | -0.191 | -0.116 |
| Chemistry | 0.4184 | 0.036 | 11.669 | 0.000 | 0.348 | 0.489 |
| Computer_science | 0.4348 | 0.022 | 20.214 | 0.000 | 0.393 | 0.477 |
| Economics | 0.3315 | 0.014 | 24.264 | 0.000 | 0.305 | 0.358 |
| Engineering | -0.4853 | 0.055 | -8.892 | 0.000 | -0.592 | -0.378 |
| Environmental_science | 1.7763 | 0.040 | 44.916 | 0.000 | 1.699 | 1.854 |
| Geography | -0.3629 | 0.020 | -17.860 | 0.000 | -0.403 | -0.323 |
| Geology | -0.7848 | 0.222 | -3.529 | 0.000 | -1.221 | -0.349 |
| History | -0.8487 | 0.088 | -9.591 | 0.000 | -1.022 | -0.675 |
| Materials_science | -1.5624 | 0.404 | -3.869 | 0.000 | -2.354 | -0.771 |
| Mathematics | 0.2206 | 0.028 | 7.988 | 0.000 | 0.166 | 0.275 |
| Medicine | 0.6028 | 0.010 | 60.418 | 0.000 | 0.583 | 0.622 |
| Philosophy | 0.3251 | 0.116 | 2.801 | 0.005 | 0.098 | 0.553 |
| Physics | 0.6058 | 0.125 | 4.836 | 0.000 | 0.360 | 0.851 |
| Political_science | 0.2689 | 0.014 | 19.584 | 0.000 | 0.242 | 0.296 |
| Psychology | -0.0805 | 0.010 | -8.289 | 0.000 | -0.100 | -0.061 |
| Sociology | 0.3778 | 0.015 | 25.183 | 0.000 | 0.348 | 0.407 |
| 1974, 1979 | 0.1568 | 0.029 | 5.368 | 0.000 | 0.100 | 0.214 |
| 1979, 1984 | -0.2063 | 0.028 | -7.339 | 0.000 | -0.261 | -0.151 |
| 1984, 1989 | -0.0675 | 0.026 | -2.555 | 0.011 | -0.119 | -0.016 |
| 1989, 1994 | 0.1929 | 0.025 | 7.625 | 0.000 | 0.143 | 0.243 |
| 1994, 1999 | 0.7005 | 0.025 | 28.542 | 0.000 | 0.652 | 0.749 |
| 1999, 2004 | 0.8131 | 0.024 | 33.276 | 0.000 | 0.765 | 0.861 |
| 2004, 2009 | 0.8739 | 0.024 | 35.838 | 0.000 | 0.826 | 0.922 |
| 2009, 2014 | 0.6744 | 0.024 | 27.642 | 0.000 | 0.627 | 0.722 |
| 2014, 2020 | 0.5457 | 0.024 | 22.332 | 0.000 | 0.498 | 0.594 |
| No. Observations: | 30366 | Log-Likelihood: | -5.0561e+05 | |||
| Df Model: | 33 | Df Residuals: | 30332 | |||
| Pearson chi2: | 2.77e+06 | Deviance: | 8.9762e+05 |
| Dep. Variable: 5 year citation | coef | std err | z | Pz | [0.025 | 0.975] |
|---|---|---|---|---|---|---|
| Intercept | -1.2719 | 0.023 | -55.138 | 0.000 | -1.317 | -1.227 |
| NumDatasets | 0.0050 | 0.000 | 25.341 | 0.000 | 0.005 | 0.005 |
| Data use frequency(log) | 0.0363 | 0.001 | 53.195 | 0.000 | 0.035 | 0.038 |
| NumAuthor | 0.0208 | 0.000 | 66.236 | 0.000 | 0.020 | 0.021 |
| AuthorExprience(log) | 0.3206 | 0.001 | 313.596 | 0.000 | 0.319 | 0.323 |
| ImpactFactor(log) | 0.3668 | 0.002 | 194.489 | 0.000 | 0.363 | 0.371 |
| Art | -0.6998 | 0.131 | -5.349 | 0.000 | -0.956 | -0.443 |
| Biology | -0.7715 | 0.028 | -27.127 | 0.000 | -0.827 | -0.716 |
| Business | -0.2274 | 0.016 | -13.887 | 0.000 | -0.260 | -0.195 |
| Chemistry | 0.1954 | 0.033 | 5.880 | 0.000 | 0.130 | 0.260 |
| Computer_science | 0.2889 | 0.019 | 15.022 | 0.000 | 0.251 | 0.327 |
| Economics | 0.2878 | 0.012 | 24.503 | 0.000 | 0.265 | 0.311 |
| Engineering | -0.2033 | 0.046 | -4.450 | 0.000 | -0.293 | -0.114 |
| Environmental_science | 1.0203 | 0.040 | 25.200 | 0.000 | 0.941 | 1.100 |
| Geography | -0.2343 | 0.017 | -13.726 | 0.000 | -0.268 | -0.201 |
| Geology | -0.4590 | 0.188 | -2.437 | 0.015 | -0.828 | -0.090 |
| History | -0.7790 | 0.073 | -10.669 | 0.000 | -0.922 | -0.636 |
| Materials_science | -0.2671 | 0.315 | -0.847 | 0.397 | -0.885 | 0.351 |
| Mathematics | -0.3243 | 0.026 | -12.532 | 0.000 | -0.375 | -0.274 |
| Medicine | 0.4274 | 0.009 | 48.975 | 0.000 | 0.410 | 0.444 |
| Philosophy | 0.3125 | 0.096 | 3.254 | 0.001 | 0.124 | 0.501 |
| Physics | 1.1659 | 0.100 | 11.704 | 0.000 | 0.971 | 1.361 |
| Political_science | 0.0779 | 0.012 | 6.676 | 0.000 | 0.055 | 0.101 |
| Psychology | -0.0766 | 0.008 | -9.034 | 0.000 | -0.093 | -0.060 |
| Sociology | 0.3002 | 0.013 | 23.798 | 0.000 | 0.275 | 0.325 |
| 1974, 1979]] | 0.0203 | 0.025 | 0.805 | 0.421 | -0.029 | 0.070 |
| 979, 1984 | -0.1295 | 0.023 | -5.533 | 0.000 | -0.175 | -0.084 |
| 1984, 1989 | 0.0024 | 0.022 | 0.111 | 0.912 | -0.041 | 0.046 |
| 1989, 1994 | 0.2064 | 0.021 | 9.726 | 0.000 | 0.165 | 0.248 |
| 994, 1999 | 0.6053 | 0.021 | 29.350 | 0.000 | 0.565 | 0.646 |
| 1999, 2004 | 0.7964 | 0.020 | 38.851 | 0.000 | 0.756 | 0.837 |
| 2004, 2009 | 0.8983 | 0.020 | 43.944 | 0.000 | 0.858 | 0.938 |
| 2009, 2014 | 0.7636 | 0.020 | 37.359 | 0.000 | 0.724 | 0.804 |
| 2014, 2020 | 0.6477 | 0.021 | 31.467 | 0.000 | 0.607 | 0.688 |
| No. Observations: | 27099 | Log-Likelihood: | -4.3623e+05 | |||
| Df Model: | 33 | Df Residuals: | 27065 | |||
| Pearson chi2: | 1.75e+06 | Deviance: | 7.5523e+05 |
| Dep. Variable: 10 year citation | coef | std err | z | Pz | [0.025 | 0.975] |
|---|---|---|---|---|---|---|
| Intercept | -0.6641 | 0.016 | -40.488 | 0.000 | -0.696 | -0.632 |
| NumDatasets | 0.0040 | 0.000 | 22.553 | 0.000 | 0.004 | 0.004 |
| Data use frequency(log) | 0.0436 | 0.001 | 82.803 | 0.000 | 0.043 | 0.045 |
| numauthor | 0.0414 | 0.000 | 116.432 | 0.000 | 0.041 | 0.042 |
| AuthorExprience(log) | 0.3638 | 0.001 | 446.591 | 0.000 | 0.362 | 0.365 |
| ImpactFactor(log) | 0.3016 | 0.001 | 219.886 | 0.000 | 0.299 | 0.304 |
| Art | -0.4967 | 0.094 | -5.294 | 0.000 | -0.681 | -0.313 |
| Biology | -1.2774 | 0.022 | -57.183 | 0.000 | -1.321 | -1.234 |
| Business | -0.4114 | 0.013 | -31.546 | 0.000 | -0.437 | -0.386 |
| Chemistry | 0.1352 | 0.023 | 5.768 | 0.000 | 0.089 | 0.181 |
| Computer_science | 0.1490 | 0.015 | 9.957 | 0.000 | 0.120 | 0.178 |
| Economics | 0.2420 | 0.009 | 28.009 | 0.000 | 0.225 | 0.259 |
| Engineering | -0.7161 | 0.039 | -18.530 | 0.000 | -0.792 | -0.640 |
| Environmental_science | 1.3530 | 0.029 | 47.202 | 0.000 | 1.297 | 1.409 |
| Geography | -0.2990 | 0.013 | -22.524 | 0.000 | -0.325 | -0.273 |
| Geology | -0.1811 | 0.141 | -1.284 | 0.199 | -0.458 | 0.095 |
| History | -0.7488 | 0.051 | -14.697 | 0.000 | -0.849 | -0.649 |
| Materials_science | -0.4629 | 0.368 | -1.259 | 0.208 | -1.184 | 0.258 |
| Mathematics | 0.0212 | 0.019 | 1.118 | 0.263 | -0.016 | 0.058 |
| Medicine | 0.1616 | 0.007 | 24.317 | 0.000 | 0.149 | 0.175 |
| Philosophy | 0.2186 | 0.067 | 3.284 | 0.001 | 0.088 | 0.349 |
| Physics | 0.8942 | 0.084 | 10.604 | 0.000 | 0.729 | 1.059 |
| Political_science | 0.0287 | 0.009 | 3.349 | 0.001 | 0.012 | 0.046 |
| Psychology | -0.0436 | 0.007 | -6.683 | 0.000 | -0.056 | -0.031 |
| Sociology | 0.3629 | 0.009 | 39.800 | 0.000 | 0.345 | 0.381 |
| 1974, 1979 | -0.0803 | 0.018 | -4.585 | 0.000 | -0.115 | -0.046 |
| 1979, 1984 | -0.2220 | 0.016 | -13.641 | 0.000 | -0.254 | -0.190 |
| 1984, 1989 | -0.0033 | 0.015 | -0.214 | 0.831 | -0.033 | 0.027 |
| 1989, 1994 | 0.2915 | 0.015 | 19.976 | 0.000 | 0.263 | 0.320 |
| 1994, 1999 | 0.7141 | 0.014 | 50.172 | 0.000 | 0.686 | 0.742 |
| 1999, 2004 | 0.8496 | 0.014 | 59.935 | 0.000 | 0.822 | 0.877 |
| 2004, 2009 | 0.8365 | 0.014 | 59.082 | 0.000 | 0.809 | 0.864 |
| 2009, 2014 | 0.6556 | 0.014 | 46.083 | 0.000 | 0.628 | 0.683 |
| No. Observations: | 19565 | Log-Likelihood: | -7.0803e+05 | |||
| Df Model: | 32 | Df Residuals: | 19532 | |||
| Pearson chi2: | 2.90e+06 | Deviance: | 1.3149e+06 |
(2) Atypical combinations of datasets associate with high impact: - Impact of using atypical combinations of datasets on citation over 3, 5, 10 year. (Table 11-13)
| Dep. Variable:3 year citation | coef | std err | z | Pz | [0.025 | 0.975] |
|---|---|---|---|---|---|---|
| Intercept | -4.3594 | 0.061 | -71.903 | 0.000 | -4.478 | -4.241 |
| Paper novelty | 0.0550 | 0.003 | 15.839 | 0.000 | 0.048 | 0.062 |
| Atypicality of datasets | 0.3215 | 0.005 | 65.195 | 0.000 | 0.312 | 0.331 |
| Data use frequency(log) | 0.1376 | 0.002 | 69.178 | 0.000 | 0.134 | 0.141 |
| NumAuthor | 0.0724 | 0.001 | 116.115 | 0.000 | 0.071 | 0.074 |
| AuthorExprience(log) | 0.4329 | 0.002 | 201.810 | 0.000 | 0.429 | 0.437 |
| ImpactFactor(log) | 0.4419 | 0.004 | 121.090 | 0.000 | 0.435 | 0.449 |
| NumDatasets | -0.0022 | 0.000 | -6.051 | 0.000 | -0.003 | -0.001 |
| Art | 0.3109 | 0.219 | 1.420 | 0.156 | -0.118 | 0.740 |
| Biology | 0.3438 | 0.059 | 5.802 | 0.000 | 0.228 | 0.460 |
| Business | 0.3959 | 0.033 | 11.879 | 0.000 | 0.331 | 0.461 |
| Chemistry | 0.4922 | 0.062 | 7.974 | 0.000 | 0.371 | 0.613 |
| Computer_science | -0.4798 | 0.046 | -10.486 | 0.000 | -0.569 | -0.390 |
| Economics | 0.8035 | 0.024 | 34.088 | 0.000 | 0.757 | 0.850 |
| Engineering | 0.1481 | 0.103 | 1.440 | 0.150 | -0.053 | 0.350 |
| Environmental_science | 0.2071 | 0.090 | 2.306 | 0.021 | 0.031 | 0.383 |
| Geography | -0.0271 | 0.034 | -0.801 | 0.423 | -0.093 | 0.039 |
| Geology | 0.9256 | 0.406 | 2.281 | 0.023 | 0.130 | 1.721 |
| History | -1.0323 | 0.160 | -6.444 | 0.000 | -1.346 | -0.718 |
| Materials_science | -0.7044 | 0.533 | -1.322 | 0.186 | -1.748 | 0.340 |
| Mathematics | 1.8077 | 0.041 | 43.678 | 0.000 | 1.727 | 1.889 |
| Medicine | 0.9180 | 0.017 | 53.210 | 0.000 | 0.884 | 0.952 |
| Philosophy | -0.5977 | 0.239 | -2.501 | 0.012 | -1.066 | -0.129 |
| Physics | 0.4930 | 0.261 | 1.892 | 0.059 | -0.018 | 1.004 |
| Political_science | 0.5703 | 0.024 | 23.854 | 0.000 | 0.523 | 0.617 |
| Psychology | 0.3149 | 0.017 | 18.314 | 0.000 | 0.281 | 0.349 |
| Sociology | 0.7462 | 0.028 | 26.666 | 0.000 | 0.691 | 0.801 |
| 1974, 1979 | 0.0134 | 0.063 | 0.213 | 0.831 | -0.110 | 0.137 |
| 1979, 1984 | -0.1972 | 0.061 | -3.250 | 0.001 | -0.316 | -0.078 |
| 1984, 1989 | -0.2019 | 0.058 | -3.464 | 0.001 | -0.316 | -0.088 |
| 1989, 1994 | -0.0128 | 0.057 | -0.226 | 0.821 | -0.124 | 0.098 |
| 1994, 1999 | 0.6417 | 0.055 | 11.568 | 0.000 | 0.533 | 0.750 |
| 1999, 2004 | 0.6260 | 0.055 | 11.279 | 0.000 | 0.517 | 0.735 |
| 2004, 2009 | 0.8274 | 0.055 | 14.935 | 0.000 | 0.719 | 0.936 |
| 2009, 2014 | 0.4945 | 0.055 | 8.914 | 0.000 | 0.386 | 0.603 |
| 2014, 2020 | 0.3720 | 0.056 | 6.690 | 0.000 | 0.263 | 0.481 |
| No. Observations: | 8881 | Log-Likelihood: | -1.9460e+05 | |||
| Df Residuals: | 8845 | Df Model: | 35 | |||
| Pearson chi2: | 9.54e+05 | Deviance: | 3.5493e+05 |
| Dep. Variable: 5 year citation | coef | std err | z | Pz | [0.025 | 0.975] |
|---|---|---|---|---|---|---|
| Intercept | -2.5849 | 0.052 | -49.681 | 0.000 | -2.687 | -2.483 |
| Paper novelty | 0.0545 | 0.003 | 18.185 | 0.000 | 0.049 | 0.060 |
| Atypicality of datasets | 0.2647 | 0.005 | 57.307 | 0.000 | 0.256 | 0.274 |
| Data use frequency(log) | 0.1036 | 0.002 | 59.321 | 0.000 | 0.100 | 0.107 |
| NumAuthor | 0.0490 | 0.001 | 67.884 | 0.000 | 0.048 | 0.050 |
| AuthorExprience(log) | 0.3443 | 0.002 | 183.405 | 0.000 | 0.341 | 0.348 |
| ImpactFactor(log) | 0.3474 | 0.003 | 108.216 | 0.000 | 0.341 | 0.354 |
| NumDatasets | -0.0066 | 0.000 | -17.132 | 0.000 | -0.007 | -0.006 |
| Art | 0.0218 | 0.184 | 0.119 | 0.905 | -0.339 | 0.382 |
| Biology | 0.4009 | 0.053 | 7.597 | 0.000 | 0.297 | 0.504 |
| Business | 0.2149 | 0.029 | 7.459 | 0.000 | 0.158 | 0.271 |
| Chemistry | 0.4319 | 0.056 | 7.699 | 0.000 | 0.322 | 0.542 |
| Computer_science | -0.0773 | 0.039 | -1.975 | 0.048 | -0.154 | -0.001 |
| Economics | 0.6627 | 0.021 | 32.010 | 0.000 | 0.622 | 0.703 |
| Engineering | 0.2233 | 0.086 | 2.597 | 0.009 | 0.055 | 0.392 |
| Environmental_science | 0.1861 | 0.080 | 2.323 | 0.020 | 0.029 | 0.343 |
| Geography | 0.0859 | 0.028 | 3.029 | 0.002 | 0.030 | 0.142 |
| Geology | 0.5550 | 0.351 | 1.582 | 0.114 | -0.133 | 1.243 |
| History | -0.4823 | 0.126 | -3.840 | 0.000 | -0.728 | -0.236 |
| Materials_science | 0.2145 | 0.341 | 0.630 | 0.529 | -0.453 | 0.882 |
| Mathematics | 0.4291 | 0.043 | 10.051 | 0.000 | 0.345 | 0.513 |
| Medicine | 0.7357 | 0.015 | 47.829 | 0.000 | 0.706 | 0.766 |
| Philosophy | 0.6872 | 0.185 | 3.719 | 0.000 | 0.325 | 1.049 |
| Physics | 1.3395 | 0.213 | 6.293 | 0.000 | 0.922 | 1.757 |
| Political_science | 0.3213 | 0.021 | 15.590 | 0.000 | 0.281 | 0.362 |
| Psychology | 0.2090 | 0.015 | 13.647 | 0.000 | 0.179 | 0.239 |
| Sociology | 0.5556 | 0.024 | 23.074 | 0.000 | 0.508 | 0.603 |
| 1974, 1979 | -0.0478 | 0.055 | -0.877 | 0.380 | -0.155 | 0.059 |
| 1979, 1984 | -0.0986 | 0.052 | -1.914 | 0.056 | -0.200 | 0.002 |
| 1984, 1989 | -0.0649 | 0.049 | -1.311 | 0.190 | -0.162 | 0.032 |
| 1989, 1994 | 0.1617 | 0.048 | 3.350 | 0.001 | 0.067 | 0.256 |
| 1994, 1999 | 0.6082 | 0.047 | 12.827 | 0.000 | 0.515 | 0.701 |
| 1999, 2004 | 0.6673 | 0.047 | 14.074 | 0.000 | 0.574 | 0.760 |
| 2004, 2009 | 0.8432 | 0.047 | 17.815 | 0.000 | 0.750 | 0.936 |
| 2009, 2014 | 0.6393 | 0.047 | 13.493 | 0.000 | 0.546 | 0.732 |
| 2014, 2020 | 0.5167 | 0.048 | 10.856 | 0.000 | 0.423 | 0.610 |
| No. Observations: | 7783 | Log-Likelihood: | -1.6670e+05 | |||
| Df Model: | 35 | Df Residuals: | 7524 | |||
| Pearson chi2: | 7.15e+05 | Deviance: | 2.9787e+05 |
| Dep. Variable: 10 year citation | coef | std err | z | Pz | [0.025 | 0.975] |
|---|---|---|---|---|---|---|
| Intercept | -1.7011 | 0.036 | -47.891 | 0.000 | -1.771 | -1.631 |
| Paper novelty | 0.1085 | 0.002 | 45.077 | 0.000 | 0.104 | 0.113 |
| Atypicality of datasets | 0.2849 | 0.004 | 77.401 | 0.000 | 0.278 | 0.292 |
| Data use frequency(log) | 0.0882 | 0.001 | 64.758 | 0.000 | 0.085 | 0.091 |
| NumAuthor | 0.0860 | 0.001 | 124.167 | 0.000 | 0.085 | 0.087 |
| AuthorExprience(log) | 0.3824 | 0.002 | 249.336 | 0.000 | 0.379 | 0.385 |
| ImpactFactor(log) | 0.2621 | 0.002 | 114.047 | 0.000 | 0.258 | 0.267 |
| NumDatasets | -0.0120 | 0.000 | -33.432 | 0.000 | -0.013 | -0.011 |
| Art | 0.5650 | 0.123 | 4.578 | 0.000 | 0.323 | 0.807 |
| Biology | 0.4638 | 0.041 | 11.421 | 0.000 | 0.384 | 0.543 |
| Business | 0.0107 | 0.023 | 0.466 | 0.641 | -0.034 | 0.056 |
| Chemistry | 0.5027 | 0.041 | 12.191 | 0.000 | 0.422 | 0.584 |
| Computer_science | -0.6530 | 0.033 | -20.005 | 0.000 | -0.717 | -0.589 |
| Economics | 0.5450 | 0.015 | 35.313 | 0.000 | 0.515 | 0.575 |
| Engineering | -0.1029 | 0.073 | -1.411 | 0.158 | -0.246 | 0.040 |
| Environmental_science | -0.0595 | 0.064 | -0.935 | 0.350 | -0.184 | 0.065 |
| Geography | -0.1090 | 0.022 | -4.865 | 0.000 | -0.153 | -0.065 |
| Geology | 1.1190 | 0.369 | 3.033 | 0.002 | 0.396 | 1.842 |
| History | -1.0919 | 0.102 | -10.748 | 0.000 | -1.291 | -0.893 |
| Materials_science | -0.1871 | 0.440 | -0.425 | 0.671 | -1.050 | 0.676 |
| Mathematics | 1.0780 | 0.029 | 36.629 | 0.000 | 1.020 | 1.136 |
| Medicine | 0.4044 | 0.012 | 33.770 | 0.000 | 0.381 | 0.428 |
| Philosophy | 0.3254 | 0.129 | 2.525 | 0.012 | 0.073 | 0.578 |
| Physics | 3.0672 | 0.146 | 20.981 | 0.000 | 2.781 | 3.354 |
| Political_science | 0.1489 | 0.015 | 9.691 | 0.000 | 0.119 | 0.179 |
| Psychology | 0.1664 | 0.012 | 13.752 | 0.000 | 0.143 | 0.190 |
| Sociology | 0.7244 | 0.017 | 41.425 | 0.000 | 0.690 | 0.759 |
| 1974, 1979 | -0.2107 | 0.036 | -5.791 | 0.000 | -0.282 | -0.139 |
| 1979, 1984 | -0.3051 | 0.034 | -8.882 | 0.000 | -0.372 | -0.238 |
| 1984, 1989 | -0.2161 | 0.033 | -6.600 | 0.000 | -0.280 | -0.152 |
| 1989, 1994 | 0.0634 | 0.032 | 1.993 | 0.046 | 0.001 | 0.126 |
| 1994, 1999 | 0.5536 | 0.031 | 17.718 | 0.000 | 0.492 | 0.615 |
| 1999, 2004 | 0.5745 | 0.031 | 18.369 | 0.000 | 0.513 | 0.636 |
| 2004, 2009 | 0.5799 | 0.031 | 18.537 | 0.000 | 0.519 | 0.641 |
| 2009, 2014 | 0.3309 | 0.031 | 10.541 | 0.000 | 0.269 | 0.392 |
| No. Observations: | 5518 | Log-Likelihood: | -2.5487e+05 | |||
| Df Model: | 34 | Df Residuals: | 5483 | |||
| Pearson chi2: | 1.03e+06 | Deviance: | 4.8079e+05 |
- Tables 14-17 present the effects of using atypical combinations of datasets on citations, based on a three-year analysis of publications released in four distinct time periods: before 1990, 1990-2000, 2000-2010, and 2010-2020.
| Dep. Variable: 3 year citation | coef | std err | z | Pz | [0.025 | 0.975] |
|---|---|---|---|---|---|---|
| Intercept | -4.2901 | 0.039 | -108.750 | 0.000 | -4.367 | -4.213 |
| Paper novelty | 0.0781 | 0.006 | 13.510 | 0.000 | 0.067 | 0.089 |
| Atypicality of datasets | 0.3713 | 0.007 | 53.776 | 0.000 | 0.358 | 0.385 |
| Data use frequency(log) | 0.1347 | 0.003 | 44.558 | 0.000 | 0.129 | 0.141 |
| NumAuthor | 0.0543 | 0.001 | 65.872 | 0.000 | 0.053 | 0.056 |
| AuthorExprience(log) | 0.3906 | 0.003 | 130.977 | 0.000 | 0.385 | 0.396 |
| ImpactFactor(log) | 0.7208 | 0.006 | 117.299 | 0.000 | 0.709 | 0.733 |
| NumDatasets | 0.0011 | 0.000 | 3.101 | 0.002 | 0.000 | 0.002 |
| Art | 0.0236 | 0.394 | 0.060 | 0.952 | -0.749 | 0.796 |
| Biology | -0.4040 | 0.092 | -4.415 | 0.000 | -0.583 | -0.225 |
| Business | 0.2929 | 0.048 | 6.158 | 0.000 | 0.200 | 0.386 |
| Chemistry | -0.5078 | 0.092 | -5.547 | 0.000 | -0.687 | -0.328 |
| Computer_science | 0.2923 | 0.061 | 4.786 | 0.000 | 0.173 | 0.412 |
| Economics | 1.2012 | 0.040 | 30.099 | 0.000 | 1.123 | 1.279 |
| Engineering | 0.7644 | 0.127 | 6.027 | 0.000 | 0.516 | 1.013 |
| Environmental_science | -0.0848 | 0.144 | -0.590 | 0.555 | -0.367 | 0.197 |
| Geography | -0.3905 | 0.053 | -7.348 | 0.000 | -0.495 | -0.286 |
| Geology | 1.8139 | 0.545 | 3.330 | 0.001 | 0.746 | 2.882 |
| History | -0.0923 | 0.236 | -0.390 | 0.696 | -0.555 | 0.371 |
| Materials_science | -0.7990 | 0.843 | -0.947 | 0.344 | -2.452 | 0.854 |
| Mathematics | -0.5627 | 0.082 | -6.834 | 0.000 | -0.724 | -0.401 |
| Medicine | 0.8554 | 0.026 | 33.490 | 0.000 | 0.805 | 0.905 |
| Philosophy | -2.0613 | 0.749 | -2.754 | 0.006 | -3.529 | -0.594 |
| Physics | -1.3571 | 0.501 | -2.707 | 0.007 | -2.340 | -0.374 |
| Political_science | 0.9716 | 0.041 | 23.935 | 0.000 | 0.892 | 1.051 |
| Psychology | 0.2434 | 0.025 | 9.853 | 0.000 | 0.195 | 0.292 |
| Sociology | 0.6768 | 0.047 | 14.330 | 0.000 | 0.584 | 0.769 |
| No. Observations: | 4663 | Log-Likelihood: | -84860. | |||
| Df Model: | 26 | Df Residuals: | 4636 | |||
| Pearson chi2: | 3.61e+05 | Deviance: | 1.5142e+05 |
| Dep. Variable: 3 year citation | coef | std err | z | Pz | [0.025 | 0.975] |
|---|---|---|---|---|---|---|
| Intercept | -5.9333 | 0.040 | -146.676 | 0.000 | -6.013 | -5.854 |
| Paper novelty | -0.0069 | 0.005 | -1.382 | 0.167 | -0.017 | 0.003 |
| Atypicality of datasets | 0.5409 | 0.007 | 73.293 | 0.000 | 0.526 | 0.555 |
| Data use frequency(log) | 0.1645 | 0.003 | 55.547 | 0.000 | 0.159 | 0.170 |
| NumAuthor | 0.1106 | 0.001 | 97.572 | 0.000 | 0.108 | 0.113 |
| AuthorExprience(log) | 0.6042 | 0.003 | 177.609 | 0.000 | 0.598 | 0.611 |
| ImpactFactor(log) | 0.3741 | 0.005 | 79.761 | 0.000 | 0.365 | 0.383 |
| NumDatasets | -0.0247 | 0.001 | -31.085 | 0.000 | -0.026 | -0.023 |
| Art | -3.8217 | 0.442 | -8.648 | 0.000 | -4.688 | -2.956 |
| Biology | 0.1266 | 0.096 | 1.316 | 0.188 | -0.062 | 0.315 |
| Business | 0.4126 | 0.057 | 7.224 | 0.000 | 0.301 | 0.525 |
| Chemistry | 1.1241 | 0.084 | 13.364 | 0.000 | 0.959 | 1.289 |
| Computer_science | -0.6370 | 0.080 | -7.933 | 0.000 | -0.794 | -0.480 |
| Economics | 1.1949 | 0.037 | 32.169 | 0.000 | 1.122 | 1.268 |
| Engineering | -1.7206 | 0.206 | -8.350 | 0.000 | -2.125 | -1.317 |
| Environmental_science | 0.0997 | 0.149 | 0.671 | 0.502 | -0.192 | 0.391 |
| Geography | 0.0199 | 0.051 | 0.387 | 0.699 | -0.081 | 0.121 |
| Geology | 15.6892 | 1.131 | 13.868 | 0.000 | 13.472 | 17.907 |
| History | -3.2420 | 0.299 | -10.841 | 0.000 | -3.828 | -2.656 |
| Materials_science | -26.4480 | 4.941 | -5.352 | 0.000 | -36.133 | -16.763 |
| Mathematics | 3.2368 | 0.051 | 63.060 | 0.000 | 3.136 | 3.337 |
| Medicine | 1.3272 | 0.026 | 50.197 | 0.000 | 1.275 | 1.379 |
| Philosophy | 3.8550 | 0.419 | 9.190 | 0.000 | 3.033 | 4.677 |
| Physics | 6.1148 | 0.373 | 16.411 | 0.000 | 5.384 | 6.845 |
| Political_science | 0.9561 | 0.038 | 24.889 | 0.000 | 0.881 | 1.031 |
| Psychology | 0.5550 | 0.027 | 20.484 | 0.000 | 0.502 | 0.608 |
| Sociology | 1.5093 | 0.046 | 32.696 | 0.000 | 1.419 | 1.600 |
| No. Observations: | 2810 | Log-Likelihood: | -99248. | |||
| Df Model: | 26 | Df Residuals: | 2783 | |||
| Pearson chi2: | 4.97e+05 | Deviance: | 1.8680e+05 |
| Dep. Variable: 3 year citation | coef | std err | z | Pz | [0.025 | 0.975] |
|---|---|---|---|---|---|---|
| Intercept | -2.5988 | 0.067 | -38.643 | 0.000 | -2.731 | -2.467 |
| Paper novelty | 0.3920 | 0.010 | 39.465 | 0.000 | 0.373 | 0.411 |
| Atypicality of datasets | 0.0763 | 0.015 | 5.000 | 0.000 | 0.046 | 0.106 |
| Data use frequency(log) | 0.1718 | 0.006 | 29.506 | 0.000 | 0.160 | 0.183 |
| NumAuthor | 0.0341 | 0.005 | 6.399 | 0.000 | 0.024 | 0.045 |
| AuthorExprience(log) | 0.3881 | 0.006 | 68.900 | 0.000 | 0.377 | 0.399 |
| ImpactFactor(log) | 0.3407 | 0.009 | 37.799 | 0.000 | 0.323 | 0.358 |
| NumDatasets | -0.0047 | 0.002 | -2.982 | 0.003 | -0.008 | -0.002 |
| Art | -0.1024 | 0.296 | -0.346 | 0.729 | -0.682 | 0.477 |
| Biology | 5.3751 | 0.133 | 40.372 | 0.000 | 5.114 | 5.636 |
| Business | 0.0524 | 0.077 | 0.679 | 0.497 | -0.099 | 0.204 |
| Chemistry | -2.2936 | 0.453 | -5.063 | 0.000 | -3.182 | -1.406 |
| Computer_science | -0.5853 | 0.124 | -4.720 | 0.000 | -0.828 | -0.342 |
| Economics | 0.4847 | 0.054 | 8.908 | 0.000 | 0.378 | 0.591 |
| Engineering | -2.3758 | 0.415 | -5.719 | 0.000 | -3.190 | -1.562 |
| Environmental_science | 0.5461 | 0.238 | 2.292 | 0.022 | 0.079 | 1.013 |
| Geography | 0.6989 | 0.080 | 8.697 | 0.000 | 0.541 | 0.856 |
| Geology | -5.4165 | 1.145 | -4.729 | 0.000 | -7.661 | -3.172 |
| History | -1.0739 | 0.428 | -2.507 | 0.012 | -1.913 | -0.234 |
| Materials_science | 7.4941 | 1.724 | 4.346 | 0.000 | 4.114 | 10.874 |
| Mathematics | -1.9569 | 0.156 | -12.547 | 0.000 | -2.263 | -1.651 |
| Medicine | 0.7242 | 0.046 | 15.741 | 0.000 | 0.634 | 0.814 |
| Philosophy | -1.4593 | 0.536 | -2.724 | 0.006 | -2.509 | -0.409 |
| Physics | -1.2409 | 0.499 | -2.486 | 0.013 | -2.219 | -0.263 |
| Political_science | 0.0080 | 0.052 | 0.154 | 0.878 | -0.094 | 0.110 |
| Psychology | -0.0531 | 0.047 | -1.123 | 0.262 | -0.146 | 0.040 |
| Sociology | 0.1601 | 0.058 | 2.784 | 0.005 | 0.047 | 0.273 |
| No. Observations: | 1369 | Log-Likelihood: | -22386. | |||
| Df Model: | 26 | Df Residuals: | 1342 | |||
| Pearson chi2: | 8.77e+04 | Deviance: | 39949. |
| Dep. Variable: 3 year citation | coef | std err | z | Pz | [0.025 | 0.975] |
|---|---|---|---|---|---|---|
| Intercept | -1.7434 | 0.137 | -12.756 | 0.000 | -2.011 | -1.476 |
| Paper novelty | 0.1369 | 0.012 | 11.276 | 0.000 | 0.113 | 0.161 |
| Atypicality of datasets | 0.2132 | 0.036 | 5.961 | 0.000 | 0.143 | 0.283 |
| Data use frequency(log) | 0.0435 | 0.011 | 3.844 | 0.000 | 0.021 | 0.066 |
| NumAuthor | -0.0080 | 0.016 | -0.498 | 0.618 | -0.039 | 0.023 |
| AuthorExprience(log) | 0.3130 | 0.010 | 32.532 | 0.000 | 0.294 | 0.332 |
| ImpactFactor(log) | 0.1827 | 0.019 | 9.717 | 0.000 | 0.146 | 0.220 |
| NumDatasets | -0.0142 | 0.005 | -3.017 | 0.003 | -0.023 | -0.005 |
| Art | -21.0434 | 11.637 | -1.808 | 0.071 | -43.851 | 1.764 |
| Biology | 1.1870 | 0.499 | 2.378 | 0.017 | 0.209 | 2.166 |
| Business | -0.5877 | 0.200 | -2.939 | 0.003 | -0.980 | -0.196 |
| Chemistry | 8.3031 | 0.533 | 15.582 | 0.000 | 7.259 | 9.347 |
| Computer_science | -0.4287 | 0.185 | -2.316 | 0.021 | -0.791 | -0.066 |
| Economics | 1.0440 | 0.097 | 10.802 | 0.000 | 0.855 | 1.233 |
| Engineering | -4.0208 | 0.775 | -5.187 | 0.000 | -5.540 | -2.501 |
| Environmental_science | -2.6882 | 1.053 | -2.554 | 0.011 | -4.751 | -0.625 |
| Geography | -0.0532 | 0.183 | -0.291 | 0.771 | -0.412 | 0.306 |
| Geology | 2.873e-13 | 1.59e-13 | 1.812 | 0.070 | -2.35e-14 | 5.98e-13 |
| History | -1.5599 | 0.400 | -3.900 | 0.000 | -2.344 | -0.776 |
| Materials_science | -0.0359 | 0.761 | -0.047 | 0.962 | -1.527 | 1.455 |
| Mathematics | 0.1253 | 0.213 | 0.589 | 0.556 | -0.292 | 0.542 |
| Medicine | 0.2546 | 0.099 | 2.570 | 0.010 | 0.060 | 0.449 |
| Philosophy | 1.1241 | 0.407 | 2.763 | 0.006 | 0.327 | 1.922 |
| Physics | -2.7459 | 1.156 | -2.375 | 0.018 | -5.012 | -0.480 |
| Political_science | 0.1006 | 0.086 | 1.174 | 0.241 | -0.067 | 0.269 |
| Psychology | 0.3487 | 0.084 | 4.134 | 0.000 | 0.183 | 0.514 |
| Sociology | -0.1810 | 0.100 | -1.808 | 0.071 | -0.377 | 0.015 |
| No. Observations: | 721 | Log-Likelihood: | -4241.8 | |||
| Df Model: | 25 | Df Residuals: | 695 | |||
| Pearson chi2: | 9.25e+03 | Deviance: | 6271.3 |
Impact of using atypical combinations of datasets on broader scientific impact - Wikipedia, Policy, News, and Twitter mentions.(Table 18 - 21)
| Dep. Variable: Wikipedia | coef | std err | z | Pz | [0.025 | 0.975] |
|---|---|---|---|---|---|---|
| Intercept | -7.9476 | 0.758 | -10.486 | 0.000 | -9.433 | -6.462 |
| Paper novelty | 0.2754 | 0.042 | 6.547 | 0.000 | 0.193 | 0.358 |
| Atypicality of datasets | 0.4912 | 0.052 | 9.458 | 0.000 | 0.389 | 0.593 |
| Data use frequency(log) | -0.0595 | 0.021 | -2.826 | 0.005 | -0.101 | -0.018 |
| NumAuthor | -0.0072 | 0.013 | -0.539 | 0.590 | -0.033 | 0.019 |
| AuthorExprience(log) | 0.3108 | 0.023 | 13.648 | 0.000 | 0.266 | 0.355 |
| ImpactFactor(log) | 0.5293 | 0.041 | 12.869 | 0.000 | 0.449 | 0.610 |
| NumDatasets | 0.0059 | 0.002 | 2.573 | 0.010 | 0.001 | 0.010 |
| Art | 0.0907 | 1.631 | 0.056 | 0.956 | -3.106 | 3.288 |
| Biology | 0.9624 | 0.619 | 1.555 | 0.120 | -0.250 | 2.175 |
| Business | -1.1196 | 0.346 | -3.232 | 0.001 | -1.799 | -0.441 |
| Chemistry | 0.8967 | 0.701 | 1.279 | 0.201 | -0.478 | 2.271 |
| Computer_science | -1.0078 | 0.439 | -2.296 | 0.022 | -1.868 | -0.147 |
| Economics | 0.0019 | 0.219 | 0.009 | 0.993 | -0.428 | 0.432 |
| Engineering | 1.2291 | 0.763 | 1.611 | 0.107 | -0.266 | 2.724 |
| Environmental_science | -0.1709 | 0.915 | -0.187 | 0.852 | -1.964 | 1.622 |
| Geography | -2.0834 | 0.399 | -5.226 | 0.000 | -2.865 | -1.302 |
| Geology | 3.4369 | 2.774 | 1.239 | 0.215 | -2.000 | 8.874 |
| History | 0.0019 | 1.256 | 0.001 | 0.999 | -2.460 | 2.464 |
| Materials_science | -79.6453 | 6.648 | -11.980 | 0.000 | -92.675 | -66.615 |
| Mathematics | 1.2745 | 0.466 | 2.736 | 0.006 | 0.361 | 2.188 |
| Medicine | -0.5294 | 0.185 | -2.856 | 0.004 | -0.893 | -0.166 |
| Philosophy | -4.2729 | 2.748 | -1.555 | 0.120 | -9.658 | 1.112 |
| Physics | -2.4721 | 2.616 | -0.945 | 0.345 | -7.600 | 2.656 |
| Political_science | 0.6118 | 0.210 | 2.910 | 0.004 | 0.200 | 1.024 |
| Psychology | -0.7208 | 0.177 | -4.082 | 0.000 | -1.067 | -0.375 |
| Sociology | 0.1720 | 0.248 | 0.694 | 0.488 | -0.314 | 0.658 |
| 1974, 1979 | 1.0770 | 0.754 | 1.428 | 0.153 | -0.401 | 2.555 |
| 1979, 1984 | -0.0916 | 0.792 | -0.116 | 0.908 | -1.644 | 1.460 |
| 1984, 1989 | 0.7361 | 0.733 | 1.004 | 0.315 | -0.701 | 2.173 |
| 1989, 1994 | 0.8325 | 0.724 | 1.150 | 0.250 | -0.586 | 2.251 |
| 1994, 1999 | 1.6208 | 0.714 | 2.270 | 0.023 | 0.221 | 3.020 |
| 1999, 2004 | 1.8259 | 0.714 | 2.557 | 0.011 | 0.427 | 3.225 |
| 2004, 2009 | 1.5631 | 0.715 | 2.187 | 0.029 | 0.162 | 2.964 |
| 2009, 2014 | 1.0050 | 0.716 | 1.404 | 0.160 | -0.398 | 2.408 |
| 2014, 2020 | 1.2881 | 0.716 | 1.799 | 0.072 | -0.115 | 2.691 |
| No. Observations: | 8881 | Log-Likelihood: | -4687.3 | |||
| Df Model: | 35 | Df Residuals: | 8845 | |||
| Pearson chi2: | 3.92e+04 | Deviance: | 7898.2 |
| Dep. Variable: Policy | coef | std err | z | Pz | [0.025 | 0.975] |
|---|---|---|---|---|---|---|
| Intercept | -3.6058 | 0.195 | -18.529 | 0.000 | -3.987 | -3.224 |
| Paper novelty | 0.0691 | 0.014 | 4.819 | 0.000 | 0.041 | 0.097 |
| Atypicality of datasets | 0.2335 | 0.024 | 9.848 | 0.000 | 0.187 | 0.280 |
| Data use frequency(log) | -0.1289 | 0.009 | -13.686 | 0.000 | -0.147 | -0.110 |
| NumAuthor | 0.0396 | 0.006 | 6.570 | 0.000 | 0.028 | 0.051 |
| AuthorExprience(log) | 0.3515 | 0.011 | 33.258 | 0.000 | 0.331 | 0.372 |
| ImpactFactor(log) | 0.3974 | 0.017 | 23.055 | 0.000 | 0.364 | 0.431 |
| NumDatasets | -0.0007 | 0.001 | -0.592 | 0.554 | -0.003 | 0.002 |
| Art | -4.2404 | 1.683 | -2.519 | 0.012 | -7.540 | -0.941 |
| Biology | 1.9197 | 0.237 | 8.086 | 0.000 | 1.454 | 2.385 |
| Business | 0.7155 | 0.109 | 6.564 | 0.000 | 0.502 | 0.929 |
| Chemistry | -0.3621 | 0.470 | -0.770 | 0.441 | -1.283 | 0.559 |
| Computer_science | -0.3347 | 0.216 | -1.548 | 0.122 | -0.758 | 0.089 |
| Economics | 1.6275 | 0.097 | 16.798 | 0.000 | 1.438 | 1.817 |
| Engineering | 0.7990 | 0.412 | 1.938 | 0.053 | -0.009 | 1.607 |
| Environmental_science | -0.7441 | 0.429 | -1.735 | 0.083 | -1.585 | 0.097 |
| Geography | 0.1509 | 0.145 | 1.038 | 0.299 | -0.134 | 0.436 |
| Geology | -2.7330 | 2.387 | -1.145 | 0.252 | -7.412 | 1.946 |
| History | 0.6575 | 0.499 | 1.317 | 0.188 | -0.321 | 1.636 |
| Materials_science | -10.9997 | 6.077 | -1.810 | 0.070 | -22.911 | 0.912 |
| Mathematics | -1.7670 | 0.283 | -6.241 | 0.000 | -2.322 | -1.212 |
| Medicine | -0.2742 | 0.087 | -3.166 | 0.002 | -0.444 | -0.104 |
| Philosophy | -6.5418 | 1.753 | -3.731 | 0.000 | -9.978 | -3.105 |
| Physics | -0.0594 | 1.169 | -0.051 | 0.959 | -2.350 | 2.232 |
| Political_science | -1.5392 | 0.111 | -13.871 | 0.000 | -1.757 | -1.322 |
| Psychology | -0.2642 | 0.086 | -3.089 | 0.002 | -0.432 | -0.097 |
| Sociology | -0.6217 | 0.133 | -4.691 | 0.000 | -0.882 | -0.362 |
| 1974, 1979 | -0.3718 | 0.197 | -1.888 | 0.059 | -0.758 | 0.014 |
| 1979, 1984 | -0.8496 | 0.183 | -4.632 | 0.000 | -1.209 | -0.490 |
| 1984, 1989 | -0.4159 | 0.165 | -2.514 | 0.012 | -0.740 | -0.092 |
| 1989, 1994 | -0.4142 | 0.161 | -2.567 | 0.010 | -0.730 | -0.098 |
| 1994, 1999 | 0.0375 | 0.158 | 0.238 | 0.812 | -0.272 | 0.347 |
| 1999, 2004 | -0.1088 | 0.159 | -0.686 | 0.492 | -0.420 | 0.202 |
| 2004, 2009 | -0.4644 | 0.160 | -2.910 | 0.004 | -0.777 | -0.152 |
| 2009, 2014 | -0.9718 | 0.160 | -6.055 | 0.000 | -1.286 | -0.657 |
| 2014, 2020 | -1.6053 | 0.164 | -9.818 | 0.000 | -1.926 | -1.285 |
| No. Observations: | 8881 | Log-Likelihood: | -13097. | |||
| Df Model: | 35 | Df Residuals: | 8845 | |||
| Pearson chi2: | 4.89e+04 | Deviance: | 20655. |
| Dep. Variable: Twitter | coef | std err | z | Pz | [0.025 | 0.975] |
|---|---|---|---|---|---|---|
| Intercept | -4.2941 | 0.099 | -43.404 | 0.000 | -4.488 | -4.100 |
| Paper novelty | 0.0414 | 0.005 | 7.659 | 0.000 | 0.031 | 0.052 |
| Atypicality of datasets | 0.7022 | 0.007 | 97.103 | 0.000 | 0.688 | 0.716 |
| Data use frequency(log) | -0.1374 | 0.003 | -43.620 | 0.000 | -0.144 | -0.131 |
| NumAuthor | 0.0510 | 0.001 | 51.045 | 0.000 | 0.049 | 0.053 |
| AuthorExprience(log) | 0.1751 | 0.003 | 62.307 | 0.000 | 0.170 | 0.181 |
| ImpactFactor(log) | 0.7504 | 0.006 | 117.913 | 0.000 | 0.738 | 0.763 |
| NumDatasets | 0.0089 | 0.000 | 33.004 | 0.000 | 0.008 | 0.009 |
| Art | 0.8759 | 0.288 | 3.046 | 0.002 | 0.312 | 1.440 |
| Biology | 0.5445 | 0.095 | 5.722 | 0.000 | 0.358 | 0.731 |
| Business | -0.9448 | 0.044 | -21.238 | 0.000 | -1.032 | -0.858 |
| Chemistry | -2.7338 | 0.184 | -14.883 | 0.000 | -3.094 | -2.374 |
| Computer_science | -0.9568 | 0.062 | -15.404 | 0.000 | -1.079 | -0.835 |
| Economics | -0.6566 | 0.038 | -17.342 | 0.000 | -0.731 | -0.582 |
| Engineering | -0.8770 | 0.128 | -6.866 | 0.000 | -1.127 | -0.627 |
| Environmental_science | 0.1001 | 0.117 | 0.854 | 0.393 | -0.130 | 0.330 |
| Geography | -0.4932 | 0.051 | -9.669 | 0.000 | -0.593 | -0.393 |
| Geology | -0.7570 | 0.484 | -1.564 | 0.118 | -1.706 | 0.192 |
| History | 3.6985 | 0.134 | 27.499 | 0.000 | 3.435 | 3.962 |
| Materials_science | -5.9001 | 2.244 | -2.629 | 0.009 | -10.299 | -1.501 |
| Mathematics | -0.6095 | 0.100 | -6.066 | 0.000 | -0.806 | -0.413 |
| Medicine | -0.0283 | 0.027 | -1.065 | 0.287 | -0.080 | 0.024 |
| Philosophy | 0.5084 | 0.428 | 1.188 | 0.235 | -0.330 | 1.347 |
| Physics | -8.8850 | 0.646 | -13.750 | 0.000 | -10.151 | -7.618 |
| Political_science | 1.8854 | 0.032 | 58.632 | 0.000 | 1.822 | 1.948 |
| Psychology | -0.2122 | 0.025 | -8.605 | 0.000 | -0.261 | -0.164 |
| Sociology | -1.0493 | 0.040 | -26.100 | 0.000 | -1.128 | -0.970 |
| 1974, 1979 | -1.7856 | 0.175 | -10.225 | 0.000 | -2.128 | -1.443 |
| 1979, 1984 | -0.5658 | 0.112 | -5.030 | 0.000 | -0.786 | -0.345 |
| 1984, 1989 | -0.6214 | 0.106 | -5.883 | 0.000 | -0.828 | -0.414 |
| 1989, 1994 | -0.6102 | 0.102 | -5.986 | 0.000 | -0.810 | -0.410 |
| 1994, 1999 | -0.2630 | 0.096 | -2.734 | 0.006 | -0.452 | -0.074 |
| 1999, 2004 | 0.0499 | 0.095 | 0.526 | 0.599 | -0.136 | 0.236 |
| 2004, 2009 | 0.3253 | 0.093 | 3.486 | 0.000 | 0.142 | 0.508 |
| 2009, 2014 | 1.3825 | 0.092 | 15.001 | 0.000 | 1.202 | 1.563 |
| 2014, 2020 | 2.7403 | 0.092 | 29.791 | 0.000 | 2.560 | 2.921 |
| No. Observations: | 8881 | Log-Likelihood: | -1.4961e+05 | |||
| Df Model: | 35 | Df Residuals: | 8845 | |||
| Pearson chi2: | 1.69e+06 | Deviance: | 2.8640e+05 |
| Dep. Variable: News mention | coef | std err | z | Pz | [0.025 | 0.975] |
|---|---|---|---|---|---|---|
| Intercept | -3.8531 | 0.152 | -25.284 | 0.000 | -4.152 | -3.554 |
| Paper novelty | -0.0987 | 0.009 | -11.605 | 0.000 | -0.115 | -0.082 |
| Atypicality of datasets | 0.2911 | 0.013 | 22.100 | 0.000 | 0.265 | 0.317 |
| Data use frequency(log) | -0.0159 | 0.006 | -2.693 | 0.007 | -0.027 | -0.004 |
| NumAuthor | 0.0383 | 0.002 | 19.002 | 0.000 | 0.034 | 0.042 |
| AuthorExprience(log) | 0.1356 | 0.005 | 25.710 | 0.000 | 0.125 | 0.146 |
| ImpactFactor(log) | 0.5075 | 0.012 | 43.208 | 0.000 | 0.484 | 0.530 |
| NumDatasets | 0.0166 | 0.000 | 39.688 | 0.000 | 0.016 | 0.017 |
| Art | 0.2356 | 0.668 | 0.353 | 0.724 | -1.074 | 1.546 |
| Biology | 2.6198 | 0.143 | 18.278 | 0.000 | 2.339 | 2.901 |
| Business | -0.9265 | 0.108 | -8.592 | 0.000 | -1.138 | -0.715 |
| Chemistry | 2.8442 | 0.152 | 18.722 | 0.000 | 2.546 | 3.142 |
| Computer_science | -0.9359 | 0.148 | -6.341 | 0.000 | -1.225 | -0.647 |
| Economics | 0.0171 | 0.083 | 0.208 | 0.835 | -0.145 | 0.179 |
| Engineering | 1.1003 | 0.228 | 4.823 | 0.000 | 0.653 | 1.547 |
| Environmental_science | 1.5885 | 0.203 | 7.820 | 0.000 | 1.190 | 1.987 |
| Geography | 0.3666 | 0.102 | 3.578 | 0.000 | 0.166 | 0.567 |
| Geology | -2.3412 | 1.208 | -1.939 | 0.053 | -4.708 | 0.026 |
| History | 1.5477 | 0.370 | 4.186 | 0.000 | 0.823 | 2.272 |
| Materials_science | -81.4548 | 2.698 | -30.188 | 0.000 | -86.743 | -76.166 |
| Mathematics | 0.4801 | 0.186 | 2.580 | 0.010 | 0.115 | 0.845 |
| Medicine | 1.7851 | 0.052 | 34.176 | 0.000 | 1.683 | 1.887 |
| Philosophy | 6.7036 | 0.607 | 11.037 | 0.000 | 5.513 | 7.894 |
| Physics | -8.2348 | 1.566 | -5.258 | 0.000 | -11.304 | -5.165 |
| Political_science | 1.6401 | 0.073 | 22.441 | 0.000 | 1.497 | 1.783 |
| Psychology | 0.5631 | 0.051 | 11.109 | 0.000 | 0.464 | 0.662 |
| Sociology | -0.4950 | 0.092 | -5.359 | 0.000 | -0.676 | -0.314 |
| 974, 1979 | -2.1746 | 0.289 | -7.513 | 0.000 | -2.742 | -1.607 |
| 1979, 1984 | -2.7851 | 0.298 | -9.355 | 0.000 | -3.369 | -2.202 |
| 1984, 1989 | -2.4268 | 0.225 | -10.776 | 0.000 | -2.868 | -1.985 |
| 1989, 1994 | -0.7683 | 0.148 | -5.181 | 0.000 | -1.059 | -0.478 |
| 1994, 1999 | -0.9325 | 0.144 | -6.477 | 0.000 | -1.215 | -0.650 |
| 1999, 2004 | -0.1218 | 0.138 | -0.883 | 0.377 | -0.392 | 0.149 |
| 2004, 2009 | 0.0289 | 0.136 | 0.212 | 0.832 | -0.238 | 0.296 |
| 2009, 2014 | 0.4175 | 0.135 | 3.082 | 0.002 | 0.152 | 0.683 |
| 2014, 2020 | 1.5811 | 0.135 | 11.697 | 0.000 | 1.316 | 1.846 |
| No. Observations: | 8881 | Log-Likelihood: | -52361. | |||
| Df Model: | 35 | Df Residuals: | 8845 | |||
| Pearson chi2: | 4.95e+05 | Deviance: | 99273. |
-Alternative Impact Quantification: We examined the impact of using atypical combinations of datasets on the likelihood of becoming top 5% hit papers – publications that received citations within the top 5% in our dataset.(Table 22)
| Dep. Variable: top 5% hit paper (binary) | coef | std err | z | Pz | [0.025 | 0.975] |
|---|---|---|---|---|---|---|
| Intercept | -11.4285 | 1.186 | -9.636 | 0.000 | -13.753 | -9.104 |
| Paper novelty | 0.3354 | 0.085 | 3.930 | 0.000 | 0.168 | 0.503 |
| Atypicality of datasets | 0.3927 | 0.098 | 4.015 | 0.000 | 0.201 | 0.584 |
| Data use frequency(log) | 0.1613 | 0.041 | 3.947 | 0.000 | 0.081 | 0.241 |
| NumAuthor | 0.0805 | 0.017 | 4.773 | 0.000 | 0.047 | 0.114 |
| AuthorExprience(log) | 0.5594 | 0.047 | 11.996 | 0.000 | 0.468 | 0.651 |
| ImpactFactor(log) | 0.5592 | 0.076 | 7.316 | 0.000 | 0.409 | 0.709 |
| NumDatasets | 0.0077 | 0.005 | 1.470 | 0.141 | -0.003 | 0.018 |
| Art | 1.6101 | 3.464 | 0.465 | 0.642 | -5.180 | 8.400 |
| Biology | 1.3109 | 1.068 | 1.228 | 0.220 | -0.782 | 3.404 |
| Business | -0.3643 | 0.728 | -0.501 | 0.617 | -1.790 | 1.062 |
| Chemistry | 1.6869 | 1.099 | 1.535 | 0.125 | -0.467 | 3.841 |
| Computer_science | -0.0325 | 0.935 | -0.035 | 0.972 | -1.866 | 1.801 |
| Economics | 1.0014 | 0.470 | 2.129 | 0.033 | 0.080 | 1.923 |
| Engineering | 0.7782 | 2.025 | 0.384 | 0.701 | -3.191 | 4.747 |
| Environmental_science | 0.4132 | 1.688 | 0.245 | 0.807 | -2.895 | 3.722 |
| Geography | 0.3084 | 0.641 | 0.481 | 0.630 | -0.948 | 1.565 |
| Geology | -341.6914 | 3.91e+05 | -0.001 | 0.999 | -7.66e+05 | 7.65e+05 |
| History | -1.4400 | 3.584 | -0.402 | 0.688 | -8.464 | 5.584 |
| Materials_science | -208.5084 | 3.32e+05 | -0.001 | 0.999 | -6.51e+05 | 6.51e+05 |
| Mathematics | -0.8916 | 1.127 | -0.791 | 0.429 | -3.100 | 1.317 |
| Medicine | 0.6473 | 0.353 | 1.833 | 0.067 | -0.045 | 1.339 |
| Philosophy | -2.4573 | 6.195 | -0.397 | 0.692 | -14.600 | 9.685 |
| Physics | 7.7597 | 3.707 | 2.093 | 0.036 | 0.495 | 15.024 |
| Political_science | 0.0287 | 0.490 | 0.058 | 0.953 | -0.933 | 0.990 |
| Psychology | -0.0770 | 0.350 | -0.220 | 0.826 | -0.762 | 0.608 |
| Sociology | 0.7001 | 0.565 | 1.240 | 0.215 | -0.406 | 1.807 |
| 1974, 1979 | -1.3654 | 1.449 | -0.942 | 0.346 | -4.206 | 1.475 |
| 1979, 1984 | -1.9777 | 1.445 | -1.369 | 0.171 | -4.810 | 0.855 |
| 1984, 1989 | -1.4380 | 1.192 | -1.206 | 0.228 | -3.775 | 0.899 |
| 1989, 1994 | -0.5431 | 1.083 | -0.501 | 0.616 | -2.666 | 1.580 |
| 1994, 1999 | 0.3408 | 1.054 | 0.323 | 0.747 | -1.726 | 2.407 |
| 1999, 2004 | 0.5007 | 1.054 | 0.475 | 0.635 | -1.565 | 2.566 |
| 2004, 2009 | 0.4232 | 1.054 | 0.401 | 0.688 | -1.643 | 2.489 |
| 2009, 2014 | -0.2723 | 1.057 | -0.258 | 0.797 | -2.343 | 1.799 |
| 2014, 2020 | -0.4091 | 1.059 | -0.386 | 0.699 | -2.485 | 1.667 |
| No. Observations: | 8881 | Log-Likelihood: | -1684.8 | |||
| Df Model: | 35 | Df Residuals: | 8845 | |||
| Pearson chi2: | 8.90e+03 | Deviance: | 3369.5 |
(3) The effect of atypical dataset topic combinations on scientific impact: -Impact of using atypical dataset topic combinations and atypical combinations of datasets on citation over 3, 5, 10 year. (Table 23-25)
| Dep. Variable: 3 year citation | coef | std err | z | Pz | [0.025 | 0.975] |
|---|---|---|---|---|---|---|
| Intercept | -4.2803 | 0.061 | -70.466 | 0.000 | -4.399 | -4.161 |
| Paper novelty | 0.0636 | 0.004 | 18.130 | 0.000 | 0.057 | 0.070 |
| Atypicality of datasets | 0.3366 | 0.005 | 67.347 | 0.000 | 0.327 | 0.346 |
| Topic atypicality | -0.0832 | 0.003 | -25.656 | 0.000 | -0.090 | -0.077 |
| Data use frequency(log) | 0.1194 | 0.002 | 56.767 | 0.000 | 0.115 | 0.124 |
| NumAuthor | 0.0733 | 0.001 | 118.888 | 0.000 | 0.072 | 0.075 |
| AuthorExprience(log) | 0.4397 | 0.002 | 203.480 | 0.000 | 0.435 | 0.444 |
| ImpactFactor(log) | 0.4405 | 0.004 | 120.934 | 0.000 | 0.433 | 0.448 |
| NumDatasets | -0.0024 | 0.000 | -6.622 | 0.000 | -0.003 | -0.002 |
| Art | 0.3571 | 0.218 | 1.642 | 0.101 | -0.069 | 0.783 |
| Biology | 0.3260 | 0.059 | 5.493 | 0.000 | 0.210 | 0.442 |
| Business | 0.3902 | 0.033 | 11.704 | 0.000 | 0.325 | 0.456 |
| Chemistry | 0.4657 | 0.062 | 7.545 | 0.000 | 0.345 | 0.587 |
| Computer_science | -0.4823 | 0.046 | -10.545 | 0.000 | -0.572 | -0.393 |
| Economics | 0.8239 | 0.024 | 34.943 | 0.000 | 0.778 | 0.870 |
| Engineering | 0.0316 | 0.103 | 0.308 | 0.758 | -0.170 | 0.233 |
| Environmental_science | 0.2272 | 0.090 | 2.529 | 0.011 | 0.051 | 0.403 |
| Geography | -0.0244 | 0.034 | -0.724 | 0.469 | -0.091 | 0.042 |
| Geology | 0.9024 | 0.410 | 2.201 | 0.028 | 0.099 | 1.706 |
| History | -0.9833 | 0.160 | -6.132 | 0.000 | -1.298 | -0.669 |
| Materials_science | -0.5378 | 0.531 | -1.013 | 0.311 | -1.578 | 0.502 |
| Mathematics | 1.7861 | 0.041 | 43.093 | 0.000 | 1.705 | 1.867 |
| Medicine | 0.8823 | 0.017 | 51.078 | 0.000 | 0.848 | 0.916 |
| Philosophy | -0.5537 | 0.238 | -2.329 | 0.020 | -1.020 | -0.088 |
| Physics | 0.5045 | 0.261 | 1.935 | 0.053 | -0.007 | 1.016 |
| Political_science | 0.5302 | 0.024 | 22.140 | 0.000 | 0.483 | 0.577 |
| Psychology | 0.3306 | 0.017 | 19.233 | 0.000 | 0.297 | 0.364 |
| Sociology | 0.7883 | 0.028 | 28.095 | 0.000 | 0.733 | 0.843 |
| 1974, 1979 | 0.0074 | 0.063 | 0.118 | 0.906 | -0.116 | 0.131 |
| 1979, 1984 | -0.1949 | 0.061 | -3.211 | 0.001 | -0.314 | -0.076 |
| 1984, 1989 | -0.2067 | 0.058 | -3.546 | 0.000 | -0.321 | -0.092 |
| 1989, 1994 | -0.0174 | 0.057 | -0.307 | 0.759 | -0.129 | 0.094 |
| 1994, 1999 | 0.6429 | 0.055 | 11.583 | 0.000 | 0.534 | 0.752 |
| 1999, 2004 | 0.6282 | 0.056 | 11.314 | 0.000 | 0.519 | 0.737 |
| 2004, 2009 | 0.8366 | 0.055 | 15.095 | 0.000 | 0.728 | 0.945 |
| 2009, 2014 | 0.5060 | 0.056 | 9.116 | 0.000 | 0.397 | 0.615 |
| 2014, 2020 | 0.3826 | 0.056 | 6.877 | 0.000 | 0.274 | 0.492 |
| No. Observations: | 8881 | Log-Likelihood: | -1.9428e+05 | |||
| Df Residuals: | 8844 | Df Model: | 36 | |||
| Pearson chi2: | 9.48e+05 | Deviance: | 3.5429e+05 |
| Dep. Variable: 5 year citation | coef | std err | z | Pz | [0.025 | 0.975] |
|---|---|---|---|---|---|---|
| Intercept | -2.5216 | 0.052 | -48.344 | 0.000 | -2.624 | -2.419 |
| Paper novelty | 0.0588 | 0.003 | 19.522 | 0.000 | 0.053 | 0.065 |
| Atypicality of datasets | 0.2755 | 0.005 | 58.987 | 0.000 | 0.266 | 0.285 |
| Topic atypicality | -0.0570 | 0.003 | -18.943 | 0.000 | -0.063 | -0.051 |
| Data use frequency(log) | 0.0909 | 0.002 | 48.776 | 0.000 | 0.087 | 0.095 |
| NumAuthor | 0.0497 | 0.001 | 69.369 | 0.000 | 0.048 | 0.051 |
| AuthorExprience(log) | 0.3480 | 0.002 | 184.354 | 0.000 | 0.344 | 0.352 |
| ImpactFactor(log) | 0.3469 | 0.003 | 108.153 | 0.000 | 0.341 | 0.353 |
| NumDatasets | -0.0068 | 0.000 | -17.457 | 0.000 | -0.008 | -0.006 |
| Art | 0.0491 | 0.183 | 0.268 | 0.789 | -0.310 | 0.408 |
| Biology | 0.3870 | 0.053 | 7.324 | 0.000 | 0.283 | 0.491 |
| Business | 0.2197 | 0.029 | 7.623 | 0.000 | 0.163 | 0.276 |
| Chemistry | 0.4189 | 0.056 | 7.472 | 0.000 | 0.309 | 0.529 |
| Computer_science | -0.0811 | 0.039 | -2.070 | 0.038 | -0.158 | -0.004 |
| Economics | 0.6711 | 0.021 | 32.416 | 0.000 | 0.631 | 0.712 |
| Engineering | 0.1579 | 0.086 | 1.839 | 0.066 | -0.010 | 0.326 |
| Environmental_science | 0.1993 | 0.080 | 2.487 | 0.013 | 0.042 | 0.356 |
| Geography | 0.0893 | 0.028 | 3.151 | 0.002 | 0.034 | 0.145 |
| Geology | 0.5817 | 0.353 | 1.647 | 0.099 | -0.110 | 1.274 |
| History | -0.4454 | 0.126 | -3.542 | 0.000 | -0.692 | -0.199 |
| Materials_science | 0.3115 | 0.340 | 0.917 | 0.359 | -0.354 | 0.977 |
| Mathematics | 0.4171 | 0.043 | 9.762 | 0.000 | 0.333 | 0.501 |
| Medicine | 0.7139 | 0.015 | 46.337 | 0.000 | 0.684 | 0.744 |
| Philosophy | 0.6905 | 0.184 | 3.744 | 0.000 | 0.329 | 1.052 |
| Physics | 1.3365 | 0.213 | 6.278 | 0.000 | 0.919 | 1.754 |
| Political_science | 0.2945 | 0.021 | 14.263 | 0.000 | 0.254 | 0.335 |
| Psychology | 0.2201 | 0.015 | 14.365 | 0.000 | 0.190 | 0.250 |
| Sociology | 0.5825 | 0.024 | 24.132 | 0.000 | 0.535 | 0.630 |
| 1974, 1979 | -0.0529 | 0.055 | -0.969 | 0.332 | -0.160 | 0.054 |
| 1979, 1984 | -0.0983 | 0.052 | -1.908 | 0.056 | -0.199 | 0.003 |
| 1984, 1989 | -0.0697 | 0.050 | -1.407 | 0.159 | -0.167 | 0.027 |
| 1989, 1994 | 0.1584 | 0.048 | 3.279 | 0.001 | 0.064 | 0.253 |
| 1994, 1999 | 0.6089 | 0.047 | 12.837 | 0.000 | 0.516 | 0.702 |
| 1999, 2004 | 0.6692 | 0.047 | 14.109 | 0.000 | 0.576 | 0.762 |
| 2004, 2009 | 0.8481 | 0.047 | 17.912 | 0.000 | 0.755 | 0.941 |
| 2009, 2014 | 0.6446 | 0.047 | 13.600 | 0.000 | 0.552 | 0.738 |
| 2014, 2020 | 0.5235 | 0.048 | 10.994 | 0.000 | 0.430 | 0.617 |
| No. Observations: | 7783 | Log-Likelihood: | -1.6601e+05 | |||
| Df Model: | 36 | Df Residuals: | 7746 | |||
| Pearson chi2: | 7.12e+05 | Deviance: | 2.9751e+05 |
| Dep. Variable: 10 year citation | coef | std err | z | Pz | [0.025 | 0.975] |
|---|---|---|---|---|---|---|
| Intercept | -1.6405 | 0.036 | -45.989 | 0.000 | -1.710 | -1.571 |
| Paper novelty | 0.1111 | 0.002 | 46.002 | 0.000 | 0.106 | 0.116 |
| Atypicality of datasets | 0.2962 | 0.004 | 79.292 | 0.000 | 0.289 | 0.304 |
| Topic atypicality | -0.0481 | 0.003 | -18.978 | 0.000 | -0.053 | -0.043 |
| Data use frequency(log) | 0.0773 | 0.001 | 52.417 | 0.000 | 0.074 | 0.080 |
| NumAuthor | 0.0874 | 0.001 | 125.526 | 0.000 | 0.086 | 0.089 |
| AuthorExprience(log) | 0.3840 | 0.002 | 250.016 | 0.000 | 0.381 | 0.387 |
| ImpactFactor(log) | 0.2616 | 0.002 | 113.997 | 0.000 | 0.257 | 0.266 |
| NumDatasets | -0.0122 | 0.000 | -33.842 | 0.000 | -0.013 | -0.012 |
| Art | 0.5567 | 0.123 | 4.524 | 0.000 | 0.316 | 0.798 |
| Biology | 0.4488 | 0.041 | 11.030 | 0.000 | 0.369 | 0.529 |
| Business | 0.0184 | 0.023 | 0.798 | 0.425 | -0.027 | 0.064 |
| Chemistry | 0.4860 | 0.041 | 11.786 | 0.000 | 0.405 | 0.567 |
| Computer_science | -0.6514 | 0.033 | -19.960 | 0.000 | -0.715 | -0.587 |
| Economics | 0.5517 | 0.015 | 35.733 | 0.000 | 0.521 | 0.582 |
| Engineering | -0.1249 | 0.073 | -1.713 | 0.087 | -0.268 | 0.018 |
| Environmental_science | -0.0373 | 0.064 | -0.587 | 0.558 | -0.162 | 0.087 |
| Geography | -0.1051 | 0.022 | -4.692 | 0.000 | -0.149 | -0.061 |
| Geology | 1.0712 | 0.373 | 2.875 | 0.004 | 0.341 | 1.801 |
| History | -1.0564 | 0.102 | -10.393 | 0.000 | -1.256 | -0.857 |
| Materials_science | -0.1202 | 0.437 | -0.275 | 0.783 | -0.976 | 0.735 |
| Mathematics | 1.0660 | 0.029 | 36.211 | 0.000 | 1.008 | 1.124 |
| Medicine | 0.3828 | 0.012 | 31.846 | 0.000 | 0.359 | 0.406 |
| Philosophy | 0.3285 | 0.129 | 2.553 | 0.011 | 0.076 | 0.581 |
| Physics | 3.1067 | 0.146 | 21.229 | 0.000 | 2.820 | 3.394 |
| Political_science | 0.1257 | 0.015 | 8.159 | 0.000 | 0.096 | 0.156 |
| Psychology | 0.1769 | 0.012 | 14.611 | 0.000 | 0.153 | 0.201 |
| Sociology | 0.7480 | 0.018 | 42.629 | 0.000 | 0.714 | 0.782 |
| 1974, 1979 | -0.2142 | 0.036 | -5.887 | 0.000 | -0.285 | -0.143 |
| 1979, 1984 | -0.3048 | 0.034 | -8.870 | 0.000 | -0.372 | -0.237 |
| 1984, 1989 | -0.2200 | 0.033 | -6.719 | 0.000 | -0.284 | -0.156 |
| 1989, 1994 | 0.0616 | 0.032 | 1.935 | 0.053 | -0.001 | 0.124 |
| 1994, 1999 | 0.5551 | 0.031 | 17.760 | 0.000 | 0.494 | 0.616 |
| 1999, 2004 | 0.5775 | 0.031 | 18.456 | 0.000 | 0.516 | 0.639 |
| 2004, 2009 | 0.5861 | 0.031 | 18.727 | 0.000 | 0.525 | 0.647 |
| 2009, 2014 | 0.3365 | 0.031 | 10.715 | 0.000 | 0.275 | 0.398 |
| No. Observations: | 5518 | Log-Likelihood: | -2.5469e+05 | |||
| Df Model: | 35 | Df Residuals: | 5482 | |||
| Pearson chi2: | 1.03e+06 | Deviance: | 4.8044e+05 |
Tables 26-29 present the effects of using atypical combinations of datasets on citations, based on a three-year analysis of publications released in four distinct time periods: before 1990, 1990-2000, 2000-2010, and 2010-2020.
| Dep. Variable: 3 year citation | coef | std err | z | Pz | [0.025 | 0.975] |
|---|---|---|---|---|---|---|
| Intercept | -4.2499 | 0.040 | -107.545 | 0.000 | -4.327 | -4.172 |
| Paper novelty | 0.0944 | 0.006 | 15.929 | 0.000 | 0.083 | 0.106 |
| Atypicality of datasets | 0.3803 | 0.007 | 54.521 | 0.000 | 0.367 | 0.394 |
| Topic atypicality | -0.0716 | 0.004 | -16.152 | 0.000 | -0.080 | -0.063 |
| Data use frequency(log) | 0.1196 | 0.003 | 37.825 | 0.000 | 0.113 | 0.126 |
| NumAuthor | 0.0548 | 0.001 | 67.097 | 0.000 | 0.053 | 0.056 |
| AuthorExprience(log) | 0.3999 | 0.003 | 131.562 | 0.000 | 0.394 | 0.406 |
| ImpactFactor(log) | 0.7222 | 0.006 | 117.636 | 0.000 | 0.710 | 0.734 |
| NumDatasets | 0.0011 | 0.000 | 3.099 | 0.002 | 0.000 | 0.002 |
| Art | 0.1108 | 0.393 | 0.282 | 0.778 | -0.660 | 0.882 |
| Biology | -0.4090 | 0.091 | -4.473 | 0.000 | -0.588 | -0.230 |
| Business | 0.2628 | 0.048 | 5.523 | 0.000 | 0.170 | 0.356 |
| Chemistry | -0.5522 | 0.092 | -6.032 | 0.000 | -0.732 | -0.373 |
| Computer_science | 0.2867 | 0.061 | 4.690 | 0.000 | 0.167 | 0.407 |
| Economics | 1.2212 | 0.040 | 30.641 | 0.000 | 1.143 | 1.299 |
| Engineering | 0.5985 | 0.127 | 4.723 | 0.000 | 0.350 | 0.847 |
| Environmental_science | -0.1153 | 0.144 | -0.803 | 0.422 | -0.397 | 0.166 |
| Geography | -0.3872 | 0.053 | -7.295 | 0.000 | -0.491 | -0.283 |
| Geology | 1.7828 | 0.550 | 3.241 | 0.001 | 0.705 | 2.861 |
| History | -0.0534 | 0.237 | -0.225 | 0.822 | -0.518 | 0.412 |
| Materials_science | -0.6510 | 0.845 | -0.771 | 0.441 | -2.307 | 1.005 |
| Mathematics | -0.5828 | 0.083 | -7.062 | 0.000 | -0.745 | -0.421 |
| Medicine | 0.8267 | 0.026 | 32.348 | 0.000 | 0.777 | 0.877 |
| Philosophy | -1.8637 | 0.748 | -2.492 | 0.013 | -3.329 | -0.398 |
| Physics | -1.4598 | 0.504 | -2.898 | 0.004 | -2.447 | -0.472 |
| Political_science | 0.9201 | 0.041 | 22.594 | 0.000 | 0.840 | 1.000 |
| Psychology | 0.2473 | 0.025 | 10.018 | 0.000 | 0.199 | 0.296 |
| Sociology | 0.7076 | 0.047 | 14.967 | 0.000 | 0.615 | 0.800 |
| No. Observations: | 4663 | Log-Likelihood: | -84732. | |||
| Df Model: | 27 | Df Residuals: | 4635 | |||
| Pearson chi2: | 3.58e+05 | Deviance: | 1.5117e+05 |
| Dep. Variable: 3 year citation | coef | std err | z | Pz | [0.025 | 0.975] |
|---|---|---|---|---|---|---|
| Intercept | -5.7557 | 0.041 | -139.019 | 0.000 | -5.837 | -5.675 |
| Paper novelty | 0.0001 | 0.005 | 0.022 | 0.982 | -0.010 | 0.010 |
| Atypicality of datasets | 0.5501 | 0.007 | 74.228 | 0.000 | 0.536 | 0.565 |
| Topic atypicality | -0.1025 | 0.006 | -18.222 | 0.000 | -0.114 | -0.091 |
| Data use frequency(log) | 0.1401 | 0.003 | 43.364 | 0.000 | 0.134 | 0.146 |
| NumAuthor | 0.1137 | 0.001 | 99.210 | 0.000 | 0.111 | 0.116 |
| AuthorExprience(log) | 0.6075 | 0.003 | 178.333 | 0.000 | 0.601 | 0.614 |
| ImpactFactor(log) | 0.3711 | 0.005 | 79.411 | 0.000 | 0.362 | 0.380 |
| NumDatasets | -0.0247 | 0.001 | -30.974 | 0.000 | -0.026 | -0.023 |
| Art | -3.5524 | 0.439 | -8.096 | 0.000 | -4.412 | -2.692 |
| Biology | 0.1872 | 0.096 | 1.946 | 0.052 | -0.001 | 0.376 |
| Business | 0.4262 | 0.057 | 7.451 | 0.000 | 0.314 | 0.538 |
| Chemistry | 1.1126 | 0.084 | 13.228 | 0.000 | 0.948 | 1.277 |
| Computer_science | -0.6015 | 0.080 | -7.496 | 0.000 | -0.759 | -0.444 |
| Economics | 1.2263 | 0.037 | 32.953 | 0.000 | 1.153 | 1.299 |
| Engineering | -1.7638 | 0.207 | -8.517 | 0.000 | -2.170 | -1.358 |
| Environmental_science | 0.1332 | 0.149 | 0.894 | 0.371 | -0.159 | 0.425 |
| Geography | 0.0248 | 0.051 | 0.483 | 0.629 | -0.076 | 0.126 |
| Geology | 14.7637 | 1.143 | 12.913 | 0.000 | 12.523 | 17.005 |
| History | -3.0534 | 0.298 | -10.263 | 0.000 | -3.637 | -2.470 |
| Materials_science | -25.7187 | 4.949 | -5.196 | 0.000 | -35.419 | -16.018 |
| Mathematics | 3.1481 | 0.052 | 61.074 | 0.000 | 3.047 | 3.249 |
| Medicine | 1.2871 | 0.026 | 48.627 | 0.000 | 1.235 | 1.339 |
| Philosophy | 3.5488 | 0.422 | 8.411 | 0.000 | 2.722 | 4.376 |
| Physics | 5.8489 | 0.373 | 15.685 | 0.000 | 5.118 | 6.580 |
| Political_science | 0.9305 | 0.038 | 24.241 | 0.000 | 0.855 | 1.006 |
| Psychology | 0.5765 | 0.027 | 21.286 | 0.000 | 0.523 | 0.630 |
| Sociology | 1.5516 | 0.046 | 33.536 | 0.000 | 1.461 | 1.642 |
| No. Observations: | 2810 | Log-Likelihood: | -99085. | |||
| Df Model: | 27 | Df Residuals: | 2782 | |||
| Pearson chi2: | 4.94e+05 | Deviance: | 1.8647e+05 |
| Dep. Variable: 3 year citation | coef | std err | z | Pz | [0.025 | 0.975] |
|---|---|---|---|---|---|---|
| Intercept | -2.7339 | 0.069 | -39.906 | 0.000 | -2.868 | -2.600 |
| Paper novelty | 0.3856 | 0.010 | 38.917 | 0.000 | 0.366 | 0.405 |
| Atypicality of datasets | 0.0391 | 0.016 | 2.507 | 0.012 | 0.009 | 0.070 |
| Topic atypicality | 0.0906 | 0.009 | 9.594 | 0.000 | 0.072 | 0.109 |
| Data use frequency(log) | 0.1957 | 0.006 | 30.935 | 0.000 | 0.183 | 0.208 |
| NumAuthor | 0.0338 | 0.005 | 6.355 | 0.000 | 0.023 | 0.044 |
| AuthorExprience(log) | 0.3902 | 0.006 | 69.051 | 0.000 | 0.379 | 0.401 |
| ImpactFactor(log) | 0.3418 | 0.009 | 37.677 | 0.000 | 0.324 | 0.360 |
| NumDatasets | -0.0038 | 0.002 | -2.439 | 0.015 | -0.007 | -0.001 |
| Art | -0.0807 | 0.297 | -0.271 | 0.786 | -0.663 | 0.502 |
| Biology | 5.5991 | 0.135 | 41.544 | 0.000 | 5.335 | 5.863 |
| Business | 0.0214 | 0.077 | 0.277 | 0.782 | -0.130 | 0.173 |
| Chemistry | -2.0695 | 0.453 | -4.566 | 0.000 | -2.958 | -1.181 |
| Computer_science | -0.5673 | 0.124 | -4.568 | 0.000 | -0.811 | -0.324 |
| Economics | 0.4759 | 0.054 | 8.761 | 0.000 | 0.369 | 0.582 |
| Engineering | -2.2828 | 0.418 | -5.462 | 0.000 | -3.102 | -1.464 |
| Environmental_science | 0.3978 | 0.240 | 1.661 | 0.097 | -0.072 | 0.867 |
| Geography | 0.6588 | 0.081 | 8.182 | 0.000 | 0.501 | 0.817 |
| Geology | -5.5128 | 1.142 | -4.826 | 0.000 | -7.752 | -3.274 |
| History | -1.0789 | 0.427 | -2.526 | 0.012 | -1.916 | -0.242 |
| Materials_science | 7.2364 | 1.727 | 4.191 | 0.000 | 3.852 | 10.621 |
| Mathematics | -1.9254 | 0.156 | -12.351 | 0.000 | -2.231 | -1.620 |
| Medicine | 0.7698 | 0.046 | 16.675 | 0.000 | 0.679 | 0.860 |
| Philosophy | -1.5685 | 0.535 | -2.932 | 0.003 | -2.617 | -0.520 |
| Physics | -1.3102 | 0.497 | -2.635 | 0.008 | -2.285 | -0.336 |
| Political_science | 0.0624 | 0.052 | 1.193 | 0.233 | -0.040 | 0.165 |
| Psychology | -0.1112 | 0.048 | -2.327 | 0.020 | -0.205 | -0.018 |
| Sociology | 0.1185 | 0.058 | 2.061 | 0.039 | 0.006 | 0.231 |
| No. Observations: | 1369 | Log-Likelihood: | -22339. | |||
| Df Model: | 27 | Df Residuals: | 1341 | |||
| Pearson chi2: | 8.68e+04 | Deviance: | 39856. |
| Dep. Variable: 3 year citation | coef | std err | z | Pz | [0.025 | 0.975] |
|---|---|---|---|---|---|---|
| Intercept | -1.6950 | 0.142 | -11.972 | 0.000 | -1.973 | -1.418 |
| Paper novelty | 0.1380 | 0.012 | 11.332 | 0.000 | 0.114 | 0.162 |
| Atypicality of datasets | 0.2252 | 0.037 | 6.095 | 0.000 | 0.153 | 0.298 |
| Topic atypicality | -0.0262 | 0.020 | -1.310 | 0.190 | -0.066 | 0.013 |
| Data use frequency(log) | 0.0331 | 0.014 | 2.391 | 0.017 | 0.006 | 0.060 |
| NumAuthor | -0.0083 | 0.016 | -0.517 | 0.605 | -0.040 | 0.023 |
| AuthorExprience(log) | 0.3132 | 0.010 | 32.549 | 0.000 | 0.294 | 0.332 |
| ImpactFactor(log) | 0.1821 | 0.019 | 9.698 | 0.000 | 0.145 | 0.219 |
| NumDatasets | -0.0139 | 0.005 | -2.937 | 0.003 | -0.023 | -0.005 |
| Art | -21.1784 | 11.638 | -1.820 | 0.069 | -43.989 | 1.632 |
| Biology | 1.0751 | 0.507 | 2.122 | 0.034 | 0.082 | 2.068 |
| Business | -0.5813 | 0.200 | -2.906 | 0.004 | -0.973 | -0.189 |
| Chemistry | 8.2699 | 0.533 | 15.506 | 0.000 | 7.225 | 9.315 |
| Computer_science | -0.4575 | 0.186 | -2.457 | 0.014 | -0.822 | -0.093 |
| Economics | 1.0366 | 0.097 | 10.705 | 0.000 | 0.847 | 1.226 |
| Engineering | -4.0168 | 0.775 | -5.180 | 0.000 | -5.537 | -2.497 |
| Environmental_science | -2.6149 | 1.054 | -2.481 | 0.013 | -4.681 | -0.549 |
| Geography | -0.0726 | 0.184 | -0.395 | 0.693 | -0.433 | 0.288 |
| Geology | -6.612e-13 | 3.64e-13 | -1.819 | 0.069 | -1.37e-12 | 5.13e-14 |
| History | -1.5640 | 0.400 | -3.906 | 0.000 | -2.349 | -0.779 |
| Materials_science | -0.0245 | 0.758 | -0.032 | 0.974 | -1.511 | 1.462 |
| Mathematics | 0.1311 | 0.213 | 0.616 | 0.538 | -0.286 | 0.548 |
| Medicine | 0.2202 | 0.102 | 2.150 | 0.032 | 0.019 | 0.421 |
| Philosophy | 1.1093 | 0.406 | 2.732 | 0.006 | 0.314 | 1.905 |
| Physics | -2.7589 | 1.156 | -2.387 | 0.017 | -5.024 | -0.493 |
| Political_science | 0.0819 | 0.087 | 0.943 | 0.346 | -0.088 | 0.252 |
| Psychology | 0.3542 | 0.084 | 4.194 | 0.000 | 0.189 | 0.520 |
| Sociology | -0.1717 | 0.100 | -1.712 | 0.087 | -0.368 | 0.025 |
| No. Observations: | 721 | Log-Likelihood: | -4241.0 | |||
| Df Model: | 26 | Df Residuals: | 694 | |||
| Pearson chi2: | 9.25e+03 | Deviance: | 6269.6 |
-Alternative Impact Quantification: We examined the impact of using atypical topic and atypical combinations of datasets on the likelihood of becoming top 5% hit papers – publications that received citations within the top 5% in our dataset.(Table 30)
| Dep. Variable: top 5% hit paper (binary) | coef | std err | z | Pz | [0.025 | 0.975] |
|---|---|---|---|---|---|---|
| Intercept | -11.2910 | 1.189 | -9.493 | 0.000 | -13.622 | -8.960 |
| Paper novelty | 0.3528 | 0.087 | 4.074 | 0.000 | 0.183 | 0.523 |
| Atypicality of datasets | 0.4151 | 0.099 | 4.187 | 0.000 | 0.221 | 0.609 |
| Topic atypicality | -0.1407 | 0.067 | -2.106 | 0.035 | -0.272 | -0.010 |
| Data use frequency(log) | 0.1312 | 0.043 | 3.043 | 0.002 | 0.047 | 0.216 |
| NumAuthor | 0.0830 | 0.017 | 4.907 | 0.000 | 0.050 | 0.116 |
| AuthorExprience(log) | 0.5708 | 0.047 | 12.138 | 0.000 | 0.479 | 0.663 |
| ImpactFactor(log) | 0.5588 | 0.076 | 7.322 | 0.000 | 0.409 | 0.708 |
| NumDatasets | 0.0076 | 0.005 | 1.430 | 0.153 | -0.003 | 0.018 |
| Art | 1.6738 | 3.441 | 0.486 | 0.627 | -5.071 | 8.419 |
| Biology | 1.2921 | 1.071 | 1.206 | 0.228 | -0.807 | 3.391 |
| Business | -0.3590 | 0.728 | -0.493 | 0.622 | -1.787 | 1.069 |
| Chemistry | 1.6447 | 1.099 | 1.496 | 0.135 | -0.509 | 3.799 |
| Computer_science | -0.0239 | 0.936 | -0.026 | 0.980 | -1.859 | 1.811 |
| Economics | 1.0363 | 0.471 | 2.202 | 0.028 | 0.114 | 1.959 |
| Engineering | 0.5604 | 2.018 | 0.278 | 0.781 | -3.395 | 4.516 |
| Environmental_science | 0.4675 | 1.676 | 0.279 | 0.780 | -2.816 | 3.751 |
| Geography | 0.3234 | 0.641 | 0.505 | 0.614 | -0.933 | 1.579 |
| Geology | -341.3370 | 3.91e+05 | -0.001 | 0.999 | -7.66e+05 | 7.66e+05 |
| History | -1.3602 | 3.585 | -0.379 | 0.704 | -8.387 | 5.666 |
| Materials_science | -206.8201 | 3.33e+05 | -0.001 | 1.000 | -6.52e+05 | 6.52e+05 |
| Mathematics | -0.9394 | 1.133 | -0.829 | 0.407 | -3.160 | 1.281 |
| Medicine | 0.5948 | 0.354 | 1.683 | 0.092 | -0.098 | 1.288 |
| Philosophy | -2.3853 | 6.182 | -0.386 | 0.700 | -14.502 | 9.731 |
| Physics | 7.6929 | 3.716 | 2.070 | 0.038 | 0.410 | 14.976 |
| Political_science | -0.0296 | 0.491 | -0.060 | 0.952 | -0.992 | 0.933 |
| Psychology | -0.0415 | 0.350 | -0.119 | 0.906 | -0.727 | 0.644 |
| Sociology | 0.7746 | 0.567 | 1.367 | 0.172 | -0.336 | 1.885 |
| 1974, 1979 | -1.3909 | 1.450 | -0.959 | 0.338 | -4.233 | 1.451 |
| 1979, 1984 | -1.9994 | 1.446 | -1.383 | 0.167 | -4.834 | 0.835 |
| 1984, 1989 | -1.4697 | 1.194 | -1.231 | 0.218 | -3.810 | 0.870 |
| 1989, 1994 | -0.5749 | 1.085 | -0.530 | 0.596 | -2.701 | 1.551 |
| 1994, 1999 | 0.3249 | 1.056 | 0.308 | 0.758 | -1.745 | 2.394 |
| 1999, 2004 | 0.4920 | 1.056 | 0.466 | 0.641 | -1.577 | 2.561 |
| 2004, 2009 | 0.4193 | 1.056 | 0.397 | 0.691 | -1.650 | 2.489 |
| 2009, 2014 | -0.2743 | 1.058 | -0.259 | 0.795 | -2.348 | 1.800 |
| 2014, 2020 | -0.4117 | 1.061 | -0.388 | 0.698 | -2.491 | 1.667 |
| No. Observations: | 8881 | Log-Likelihood: | -1682.6 | |||
| Df Model: | 36 | Df Residuals: | 8844 | |||
| Pearson chi2: | 8.71e+03 | Deviance: | 3365.2 |
(4) What type of research teams combine atypical datasets: Impact of Team Size and Team experience on likelihood of using Data Combination (Table 31-32)
| Dep. Variable: Using Data Combination (using multiple dataset) | coef | std err | t | Pt | [0.025 | 0.975] |
|---|---|---|---|---|---|---|
| Intercept | -0.8816 | 0.049 | -18.071 | 0.000 | -0.977 | -0.786 |
| NumAuthor | 0.0104 | 0.005 | 2.000 | 0.046 | 0.000 | 0.021 |
| Data use frequency(log) | 0.1169 | 0.017 | 6.735 | 0.000 | 0.083 | 0.151 |
| ImpactFactor(log) | -0.0725 | 0.007 | -11.106 | 0.000 | -0.085 | -0.060 |
| Model: | Logit | Pseudo R-squ.: | 0.004525 | |||
| Log-Likelihood: | -18268 | Method: | MLE | |||
| No. Observations: | 30366 | Df Residuals: | 30362 |
| Dep. Variable: Using Data Combination (using multiple dataset) | coef | std err | t | Pt | [0.025 | 0.975] |
|---|---|---|---|---|---|---|
| Intercept | -1.0764 | 0.065 | -16.609 | 0.000 | -1.203 | -0.949 |
| AuthorExprience(log) | 0.0368 | 0.007 | 4.929 | 0.000 | 0.022 | 0.051 |
| Data use frequency(log) | -0.0762 | 0.007 | -11.574 | 0.000 | -0.089 | -0.063 |
| ImpactFactor(log) | 0.1017 | 0.018 | 5.784 | 0.000 | 0.067 | 0.136 |
| Model: | Logit | Pseudo R-squ.: | 0.005088 | |||
| Log-Likelihood: | -18258. | Method: | MLE | |||
| No. Observations: | 30366 | Df Residuals: | 30362 |
- Impact of Team Size and Team experience on Atypicality of dataset combination (Table 33-34).
| Dep. Variable: Atypicality of dataset combination | coef | std err | t | Pt | [0.025 | 0.975] |
|---|---|---|---|---|---|---|
| Intercept | 2.6208 | 0.024 | 110.357 | 0.000 | 2.574 | 2.667 |
| numauthor | -0.0106 | 0.003 | -3.972 | 0.000 | -0.016 | -0.005 |
| AuthorExprience(log) | -0.0275 | 0.004 | -6.652 | 0.000 | -0.036 | -0.019 |
| ImpactFactor(log) | 0.0030 | 0.008 | 0.402 | 0.688 | -0.012 | 0.018 |
| Model: | OLS | R-squared: | 0.009 | |||
| Log-Likelihood: | -7156.2 | F-statistic: | 25.74 | |||
| No. Observations: | 8881 | AIC: | 1.432e+04 |
| Dep. Variable: Atypicality of dataset combination | coef | std err | t | Pt | [0.025 | 0.975] |
|---|---|---|---|---|---|---|
| Intercept | 2.4287 | 0.027 | 90.192 | 0.000 | 2.376 | 2.481 |
| AuthorExprience(log) | -0.0140 | 0.003 | -4.747 | 0.000 | -0.020 | -0.008 |
| Data use frequency(log) | -0.0054 | 0.004 | -1.477 | 0.140 | -0.013 | 0.002 |
| ImpactFactor(log) | 0.0299 | 0.001 | 50.024 | 0.000 | 0.029 | 0.031 |
| NumDatasets | 0.0063 | 0.007 | 0.935 | 0.350 | -0.007 | 0.020 |
| Model: | OLS | R-squared: | 0.227 | |||
| Log-Likelihood: | -6053.8 | Prob (F-statistic): | 650.1 | |||
| No. Observations: | 8881 | AIC: | 1.212e+04 |
5. Regression Equations
We employ fixed effect Poisson models to quantify the relationship between the atypicality of data usage and scientific impact. These models control for confounders such as publication year, dataset use frequency, number of authors, author experience (measured by average citation count of authors in the targeted publication), number of datasets, estimated impact factor, and disciplines. Alternative measurements, null models, and analyses with different dataset samples further support our results (further details are provided in the SI Appendix section 4).
The initial analysis, conducted using Equation 4, investigates the relationship between the variable (Using data combination) and the citation impact, as depicted in Figure 1(a).
| (4) |
The following/main analysis, conducted using Equation 5, investigates the relationship between the variable (Atpicality of datasets combinations) and the citation impact, as depicted in Figure 2(a).
| (5) |
We then examine different approaches for defining the atypicality of dataset combinations. Utilizing Equation 6, we analyze the relationship between the variables (Topic atypicality) and citation impact. The findings are illustrated in Figure 3(b).
| (6) |
Finally, the relationship between team size, team experience, the likelihood of utilizing data combination, and the atypicality of dataset combinations in academic papers is examined using Equation 7, 8, 9, and 10, as depicted in Figure 4(a)(b).
| (7) |
| (8) |
| (9) |
| (10) |