Exhaust Gas Optimization of Modern Scooters by Velocity Control
Abstract
This paper investigates the optimization of the exhaust gas composition by applying a velocity-controlled Throttle-by-Wire-System on modern 50 cc scooters (Euro 5). Nowadays combustion-powered scooters are still inefficiently restricted, resulting in an unreasonably high fuel consumption and unfavorable exhaust emissions. The velocity control prevents restriction by negatively shifting the ignition timing and regulates the throttle valve opening instead. Injection quantity, engine speed, ignition timing, cylinder wall temperature, exhaust gas temperature, oxygen sensor data, crankshaft position and in-cylinder pressure were acquired to measure engine parameters. At the same time, vehicle data on the CAN bus, such as throttle opening angle, the rider’s acceleration command and vehicle velocity were recorded. For determination of the exhaust gas composition, five probes were sensing CO, CO2, NOx, O2 and HC in addition to the temperature and mass flow. A Peugeot Kisbee 50 4T (Euro 5) serves as test vehicle. The original and the optimized restriction were subjected to various gradients on a roller dynamometer at top speed. Thus, a statement can be made about all operating points of restriction. The resistance parameters required, were previously determined in a coast down test. When driving on level ground, a difference of 50% in the throttle opening leads to a 17% improvement in fuel economy. By measuring the engine parameters, optimum ignition timing could be proven with increasing internal cylinder pressure. Further, 17% reduction in exhaust gas flow was demonstrated. CO emissions decreased by a factor of 8.4, CO2 by 1.17 and HC by 2.1 while NOx increased by a factor of 3.
keywords:
Velocity control , Throttle-by-Wire , Fuel saving , Motorcycle powertrain , Alternative restricting[1]organization=Dep. of Computing and Engineering, Frankfurt University of Applied Sciences, city=Frankfurt, postcode=60318, state=Hessen, country=Germany \affiliation[2]organization=Dep. of Automation, Electronics and Computing Architecture and Networks, University of Cadiz, city=Puerto Real, postcode=11519, state=Andalusia, country=Spain
1 Introduction
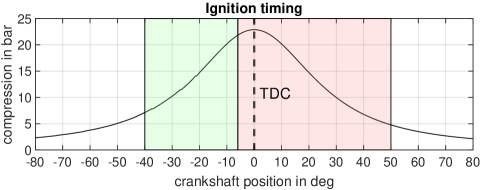
The demand on individual transportation is increasing, while requirements on climate protection are being tightened by the European Climate Change Act (European Parliament, 2021). Modern Euro 5 scooters could serve as an eco-friendly alternative to cars, reasoned by better fuel-economy and thus a minimized CO2 footprint (European Parliament, 2007). To meet the Euro 5 standard, today’s scooters are equipped with a regulated catalytic converter and fuel injection. Legislation in the EU sets a max. speed of 45 km/h for this class of vehicle (European Parliament, 2002). In the past, speed limitation was often realized through mechanical restrictors, manipulating the transmission ratio or mixture/exhaust flow (Stoffregen, 2018). Euro 2 certified scooters were frequently restricted by leaning, which led to high NOx emissions despite 3-way catalytic converters (Favre et al., 2011). Nowadays engine controllers are mostly shifting the ignition timing to limit the engine’s performance. Reducing the injection quantity would lead to an unfavorable stoichiometric ratio () (Görgen et al., 2018) and thus negatively affect the functioning of the catalyst (Kumar et al., 2023). The Original Restriction (OR) is bypassed and replaced by velocity-dependent control of the throttle valve position (air supply) (Kreß et al., 2024). This is made possible by integrating a Throttle-by-Wire-System (TbWS) (Kreß et al., 2023), resulting in an optimum ignition timing while less fuel is injected to remain . The ignition timing is dependent on engine speed and varies between 6° to 40° before the Top Dead Center (TDC). For restriction, the timing is delayed and causes an inefficient engine operation. Consequently, combustion takes place during the downward movement of the piston (expansion) (Leyda and Wos, 2012). Figure 1 shows the optimum ignition timing left and the delayed timing right. The compression curve shown, corresponds to that of the test vehicle’s engine.
Suppressing the OR and controlling the air inflow instead, leads to a drastic reduction of exhaust pollutants. To the best of our knowledge, this is the first application of a velocity-controlled TbWS on a modern four-stroke 50 cc scooter for restriction purposes. The following novelties will make a substantial scientific contribution to the efficiency and environmental friendliness of scooters.
-
1.
The efficiency is increased and the injection quantity is reduced by 17% at top speed.
-
2.
Limiting the air supply is directly minimizing the exhaust mass flow by 17% while maintaining .
-
3.
Through an optimized combustion process, the exhaust gas composition is positively affected by lowered CO, CO2 and HC emissions.
-
4.
Exhaust gas temperatures are lowered by up to 300°C, reducing thermal stress to the exhaust system.
1.1 Background on velocity-controlled TbWSs
TbWSs are frequently used on high-performance motorcycles (Corno et al., 2008; Miritsch et al., 2021; Poschner et al., 2010). A TbWS describes the replacement of a mechanical connection (throttle cable) with an electronic signal. The rider’s throttle command is detected by a sensor and processed by an Electronic Control Unit (ECU), which controls an actuator on the throttle valve. TbWSs has also been applied to small-volume scooters. The aim was better control in the event of interference (Smither et al., 2008) or more efficient operation of mechanically restricted two-stroke scooters (Smither et al., 2011). A low-cost TbWS was specifically developed for this research project based on a magnetoresistive throttle position sensor and a stepper motor-based throttle valve actuator. The system provides 99.63% accuracy with a max. response time of 60 ms (Kreß et al., 2023), enabling the influence of driver assistance systems. A Velocity Control (VC) has been implemented as intelligent and eco-friendly restriction, leading to road-tested fuel savings of 14% (OR: 2.11 l/100 km, VC: 1.82 l/100 km) while maintaining driving performance. A virtual dashboard, redundant wheel speed sensors (Kreß et al., 2021) and a main ECU have been developed. The VC prevents restriction due to ignition timing shift and significantly improves combustion efficiency by controlling the throttle valve. An adaptive PI-controller is performing precise and stable vehicle velocity control (Kreß et al., 2024).
1.2 Background on combustion & exhaust composition
Four-stroke gasoline engines burn fuels consisting of multiple short-chain hydrocarbons, also called CHO compounds. A perfect and complete combustion would convert CHO to carbon dioxide (CO2) and water (H2O) through oxidation. During the combustion process, several reaction stages are passed through, temporarily producing hydrogen (H), H2, oxygen (O), O2, hydroxide (OH), carbon monoxide (CO), CO2 and H2O. Only at high temperatures, CO and H2 are initially formed before CO oxidizes to CO2 and H2 to H2O (Basshuysen and Schäfer, 2015). In terms of emissions, on the one hand unburned components such as CO and hydrocarbons (HC) on the other nitrogen oxides (NOx) are critical constituents. The gases are produced as follows:
-
1.
CO2: A complete combustion of carbon converts a max. amount of CO2 (if = 1).
-
2.
CO: It is formed as an intermediate stage of carbon dioxide formation and in incomplete combustion under oxygen deficiency.
-
3.
HC: Unburned hydrocarbons are formed by the attachment of unreacted molecules to the cylinder wall, especially in the absence of oxygen.
-
4.
NOx: It is formed during combustion by nitrogen and oxygen. A surplus of air and high combustion temperatures lead to high emission.
When the Euro 2 standard was introduced, the emission reduction of 50 cc scooters was investigated for different drive types. In particular, four-stroke engines with direct injection and catalytic converter were found to be promising. CO and HC emissions were significantly lower compared to carburetor-fueled engines or two-stroke engines (Hirz et al., 2004). To convert pollutants in a Euro 5 compliant manner, regulated 3-way catalytic converters are usually used with four-stroke engines and fuel injection. CO and HC oxide to CO2 and H2O, while reduction converts NOx to nitrogen (N) and CO2 (Koltsakis and Stamatelos, 1997). The resulting conversion rates are better than 90% as long as (Merker and Teichmann, 2019). Accordingly, pollutants cannot be completely converted and the formation of the raw gases depends on the oxygen concentration of the mixture.
2 System evaluation
For a reproducible evaluation, the test runs are performed on a roller dynamometer. Parameter determination for dynamometer settings, measurement tools and evaluation strategy are described below.
2.1 Coast down test
To set suitable roller dynamometer parameters, the rolling and air resistances are determined by a coast down test, to ensure valid test conditions. These were carried out in calm wind conditions on a level and straight test track. First, the frontal area of the test vehicle, including rider (height: 1.8 m) and helmet, was visually determined to be 0.78 m2. In order to compensate small differences in gradient, path-time curves of two test runs in opposite directions of travel were averaged. Based on the parameters shown in Table 1 and the recorded path-time curves, a general driving resistance polynomial (1) is obtained for a Peugeot Kisbee 50 4T (Euro 5).
| Property | Symbol | Value | |
|---|---|---|---|
| 1 | Frontal area | 0.78 m2 | |
| 2 | Tyre pressure | 2.3 bar | |
| 3 | Moment of inertia factor | 1.04 | |
| 4 | Mass scooter | 99 kg | |
| 5 | Mass rider | 80 kg | |
| 6 | Air density | 1.232 kg/m3 |
| (1) |
Equation 1 is giving the needed force to overcome the velocity-dependent air resistance and constant rolling resistance at a certain velocity. The determined drag coefficient () is 0.7 and the rolling resistance coefficient () is 0.031. To verify the determined resistances, measurements of the throttle valve positions (TVP) at three reference velocities were taken. Therefore, the cruise control function of the velocity control was used. Afterwards the results were compared to throttle valve positions measured on the roller dynamometer. Table 2 proves the validity of the parameter set, since the throttle position is proportional to the required driving force.
| Velocity | TVPRoad | TVPDyno |
|---|---|---|
| 25 km/h | 16 % | 16 % |
| 35 km/h | 26 % | 27 % |
| 45 km/h | 45 % | 45 % |
2.2 Vehicle sensor integration
For evaluation, various quantities must be recorded to assess the effects on mixture preparation, engine and finally exhaust gas composition. This was realized by the development of a measurement box and the integration of multiple sensors.
Measurement box: The developed measurement box logs TbWS data and senses spatial vehicle movement. In this use case, the command variable (set velocity), the current throttle position (manipulated variable) and vehicle speed (controlled variable) are recorded. In addition, a small circuit processes the signal from the inductive crankshaft position sensor and provides an engine speed signal. To be able to make a statement about the air-fuel mixture, the signal voltage of the lambda sensor is transferred to an oxygen concentration by means of a look-up table. Finally, the cyclic opening time of the injection valve is sensed and stored as a duty cycle.
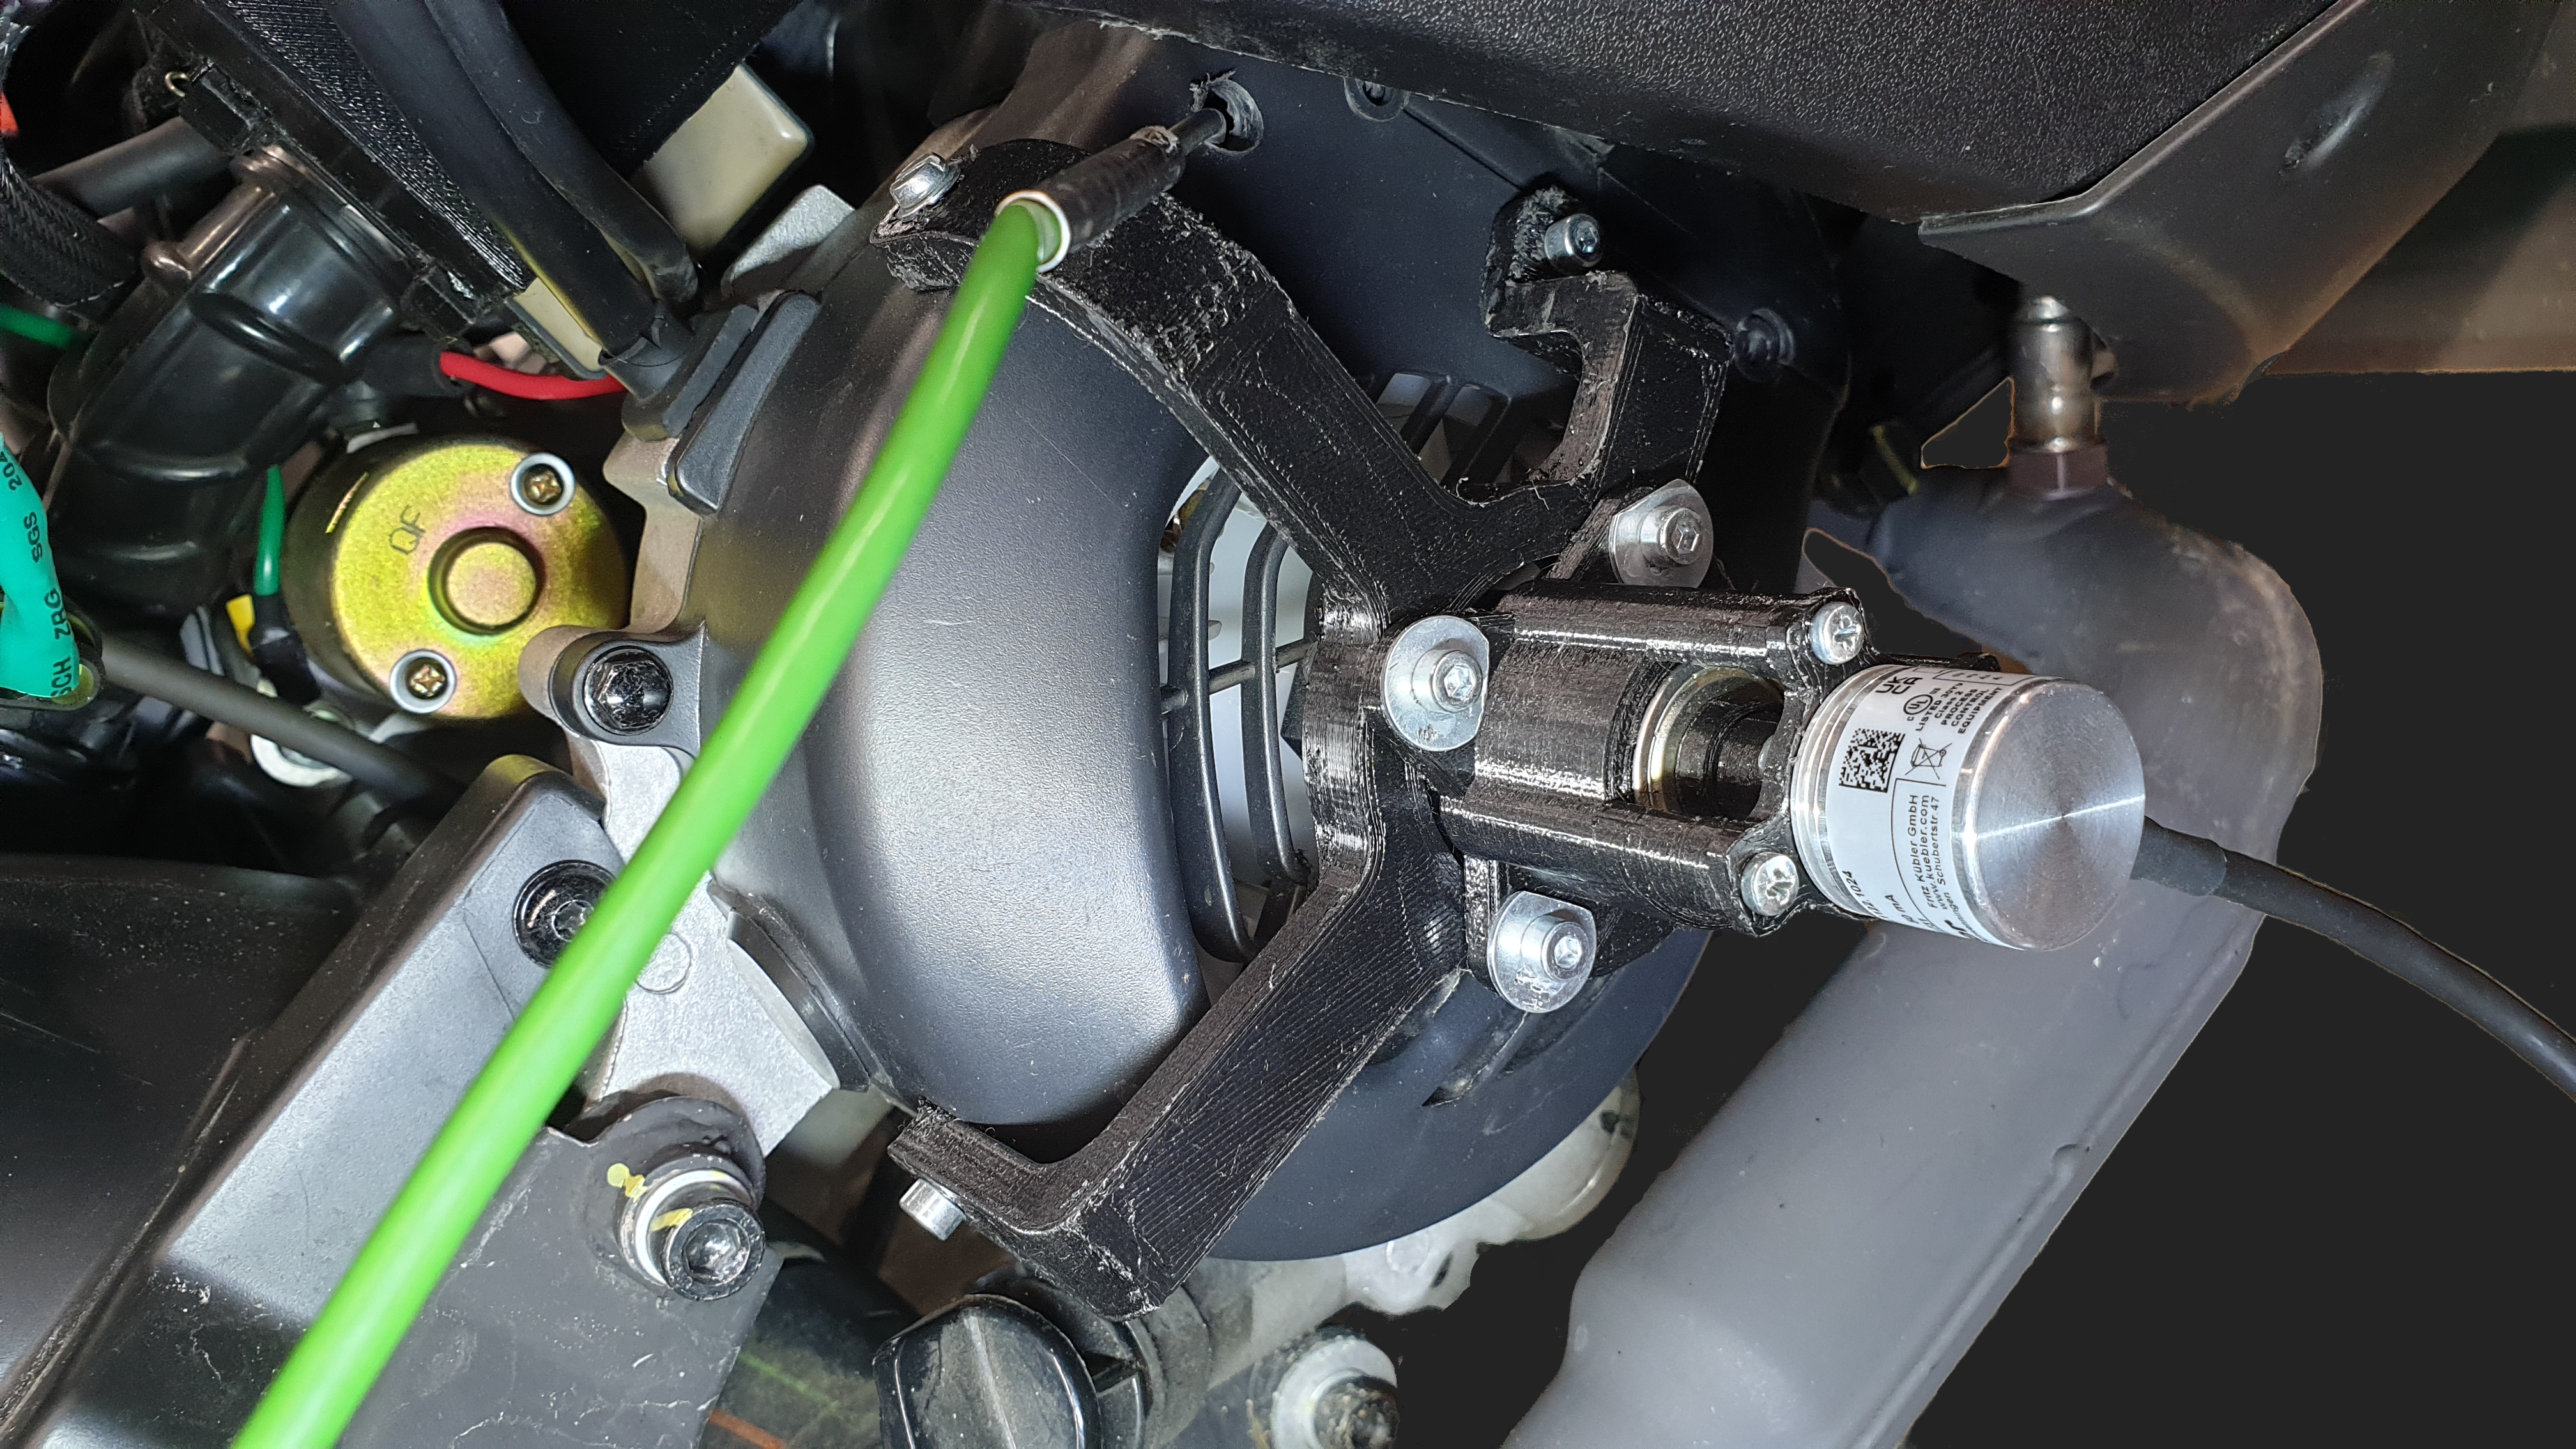
Encoder: The original crankshaft sensor has a resolution of 24 steps, which makes an exact assignment of the measured engine parameters impossible. For this reason, a high-resolution and speed-resistant encoder must be adapted to the crankshaft. The decision was made for a Kübler 05.2400.1122.1024 encoder with a resolution of 1024 steps and a max. speed of 12000 rpm (Kübler, 2023). The motor speed reaches a maximum of 8000 rpm, but the small-volume single cylinder produces plenty of vibrations and therefore requires an adequate bearing/adaptation of the encoder. A torsionally rigid shaft-coupling combination made from a nylon carbon fiber (3D print) was placed on the fan wheel, which connects to the encoder. A dual bearing carrier made from PETG supports on the fan housing and allows alignment in radial and tumbling motion. The assembly is shown in Figure 2.
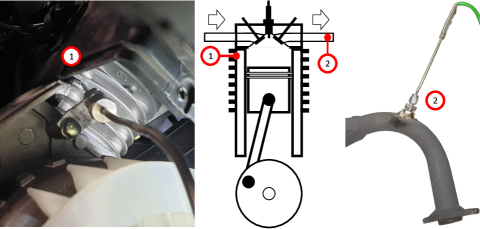
Temperature probes: Temperatures at the cylinder and in the exhaust manifold can allow conclusions to be drawn about combustion. Excess energy is converted into thermal energy in the OR range. Thus, the temperature behavior depends on the ignition timing and the resulting combustion process. Two mineral-insulated thermocouples (Type K) are used, which have a temperature resistance of 1200°C (JUMO GmbH & Co. KG, 2023). Figure 3 shows the placements of both thermocouples. Probe 1 is positioned in a 2 mm deep hole in the cylinder wall and is guided past the fan wheel (left figure). Probe 2 has been welded directly into the exhaust manifold and is thus in the middle of the exhaust gas flow (right figure).
Indicating spark-plug: Statements about the engine’s operating cycle can only be made if ignition timing and in-cylinder pressure is measured. The ignition timing is tapped on the high-voltage ignition cable by using a measuring clamp. An indicating sparkplug (AVL ZI22 1_U5D) fitted with a piezo element is installed to measure the internal pressure (AVL List GmbH, 2016). Pressures of up to 200 bar can thus be measured without having to modify the combustion chamber.
2.3 Exhaust gas measurement
Apart from the actual exhaust gas composition, the mass flow of the entire exhaust gas stream is of interest. For this purpose, so-called Exhaust Flow Meters are used, which can determine the magnitude of the mass flow via a pressure difference. The selected AVL M.O.V.E EFM is equipped with a 2.5” exhaust pipe and has a measuring range of approx. 12.5-900 kg/h (AVL List GmbH, 2023). The exhaust flow of a 50 cc four-stroke engine is very low despite high engine speeds due to the small displacement. Measurements on motorcycles have already been carried out using this method, but exhaust gases are usually collected for exhaust gas determination of such small engines. To estimate the mass flow of the test vehicle, a reverse calculation was performed based on the road tested fuel consumption ( = 1.00 l/h) (Kreß et al., 2024). With OR the expected exhaust mass flow () at top speed is determined to 12 kg/h by Equation 2. An investigation of measurements showed plausible mass flows at min. 7.9 kg/h. No valid measurements could be made at lower flow rates due to the inherent noise of the EFM.
| (2) |
The exhaust gas composition is determined with the portable emission measuring device AVL M.O.V.E Gas Pems. The HC concentration is measured using the flame ionization detector principle. NOx is detected by a UV analyzer and CO/CO2 by a non-dispersive infrared gas analyzer (AVL List GmbH, 2010). Before measuring, the system was calibrated and warmed up. Zero drifts were compensated periodically with zero gas.
2.4 Data processing
Engine related signals from the encoder, the ignition clamp and the measuring spark plug must be sampled at high rates. At max. engine speed, one crankshaft revolution takes approx. 8 ms. In order to use the full resolution of the crankshaft encoder (1024), the sampling rate would have to be at least 286 kHz according to the sampling theorem. The Sirius high speed interface from ZSE Electronic achieves a max. sampling rate of 1 MHz (ZSE Electronic GmbH, 2010). In order to compensate for fluctuating ignition times and mean pressures during measurement, 60 cycles are recorded and standardized afterwards. Data acquisition from the vehicle’s internal CAN bus is carried at a sampling rate of 20 Hz. The processes are comparatively slow and static for the measurements to be carried out. The exhaust gas analysis generates standardized measurement data every second, based on a 10 Hz raw data sample rate.
2.5 Test strategy
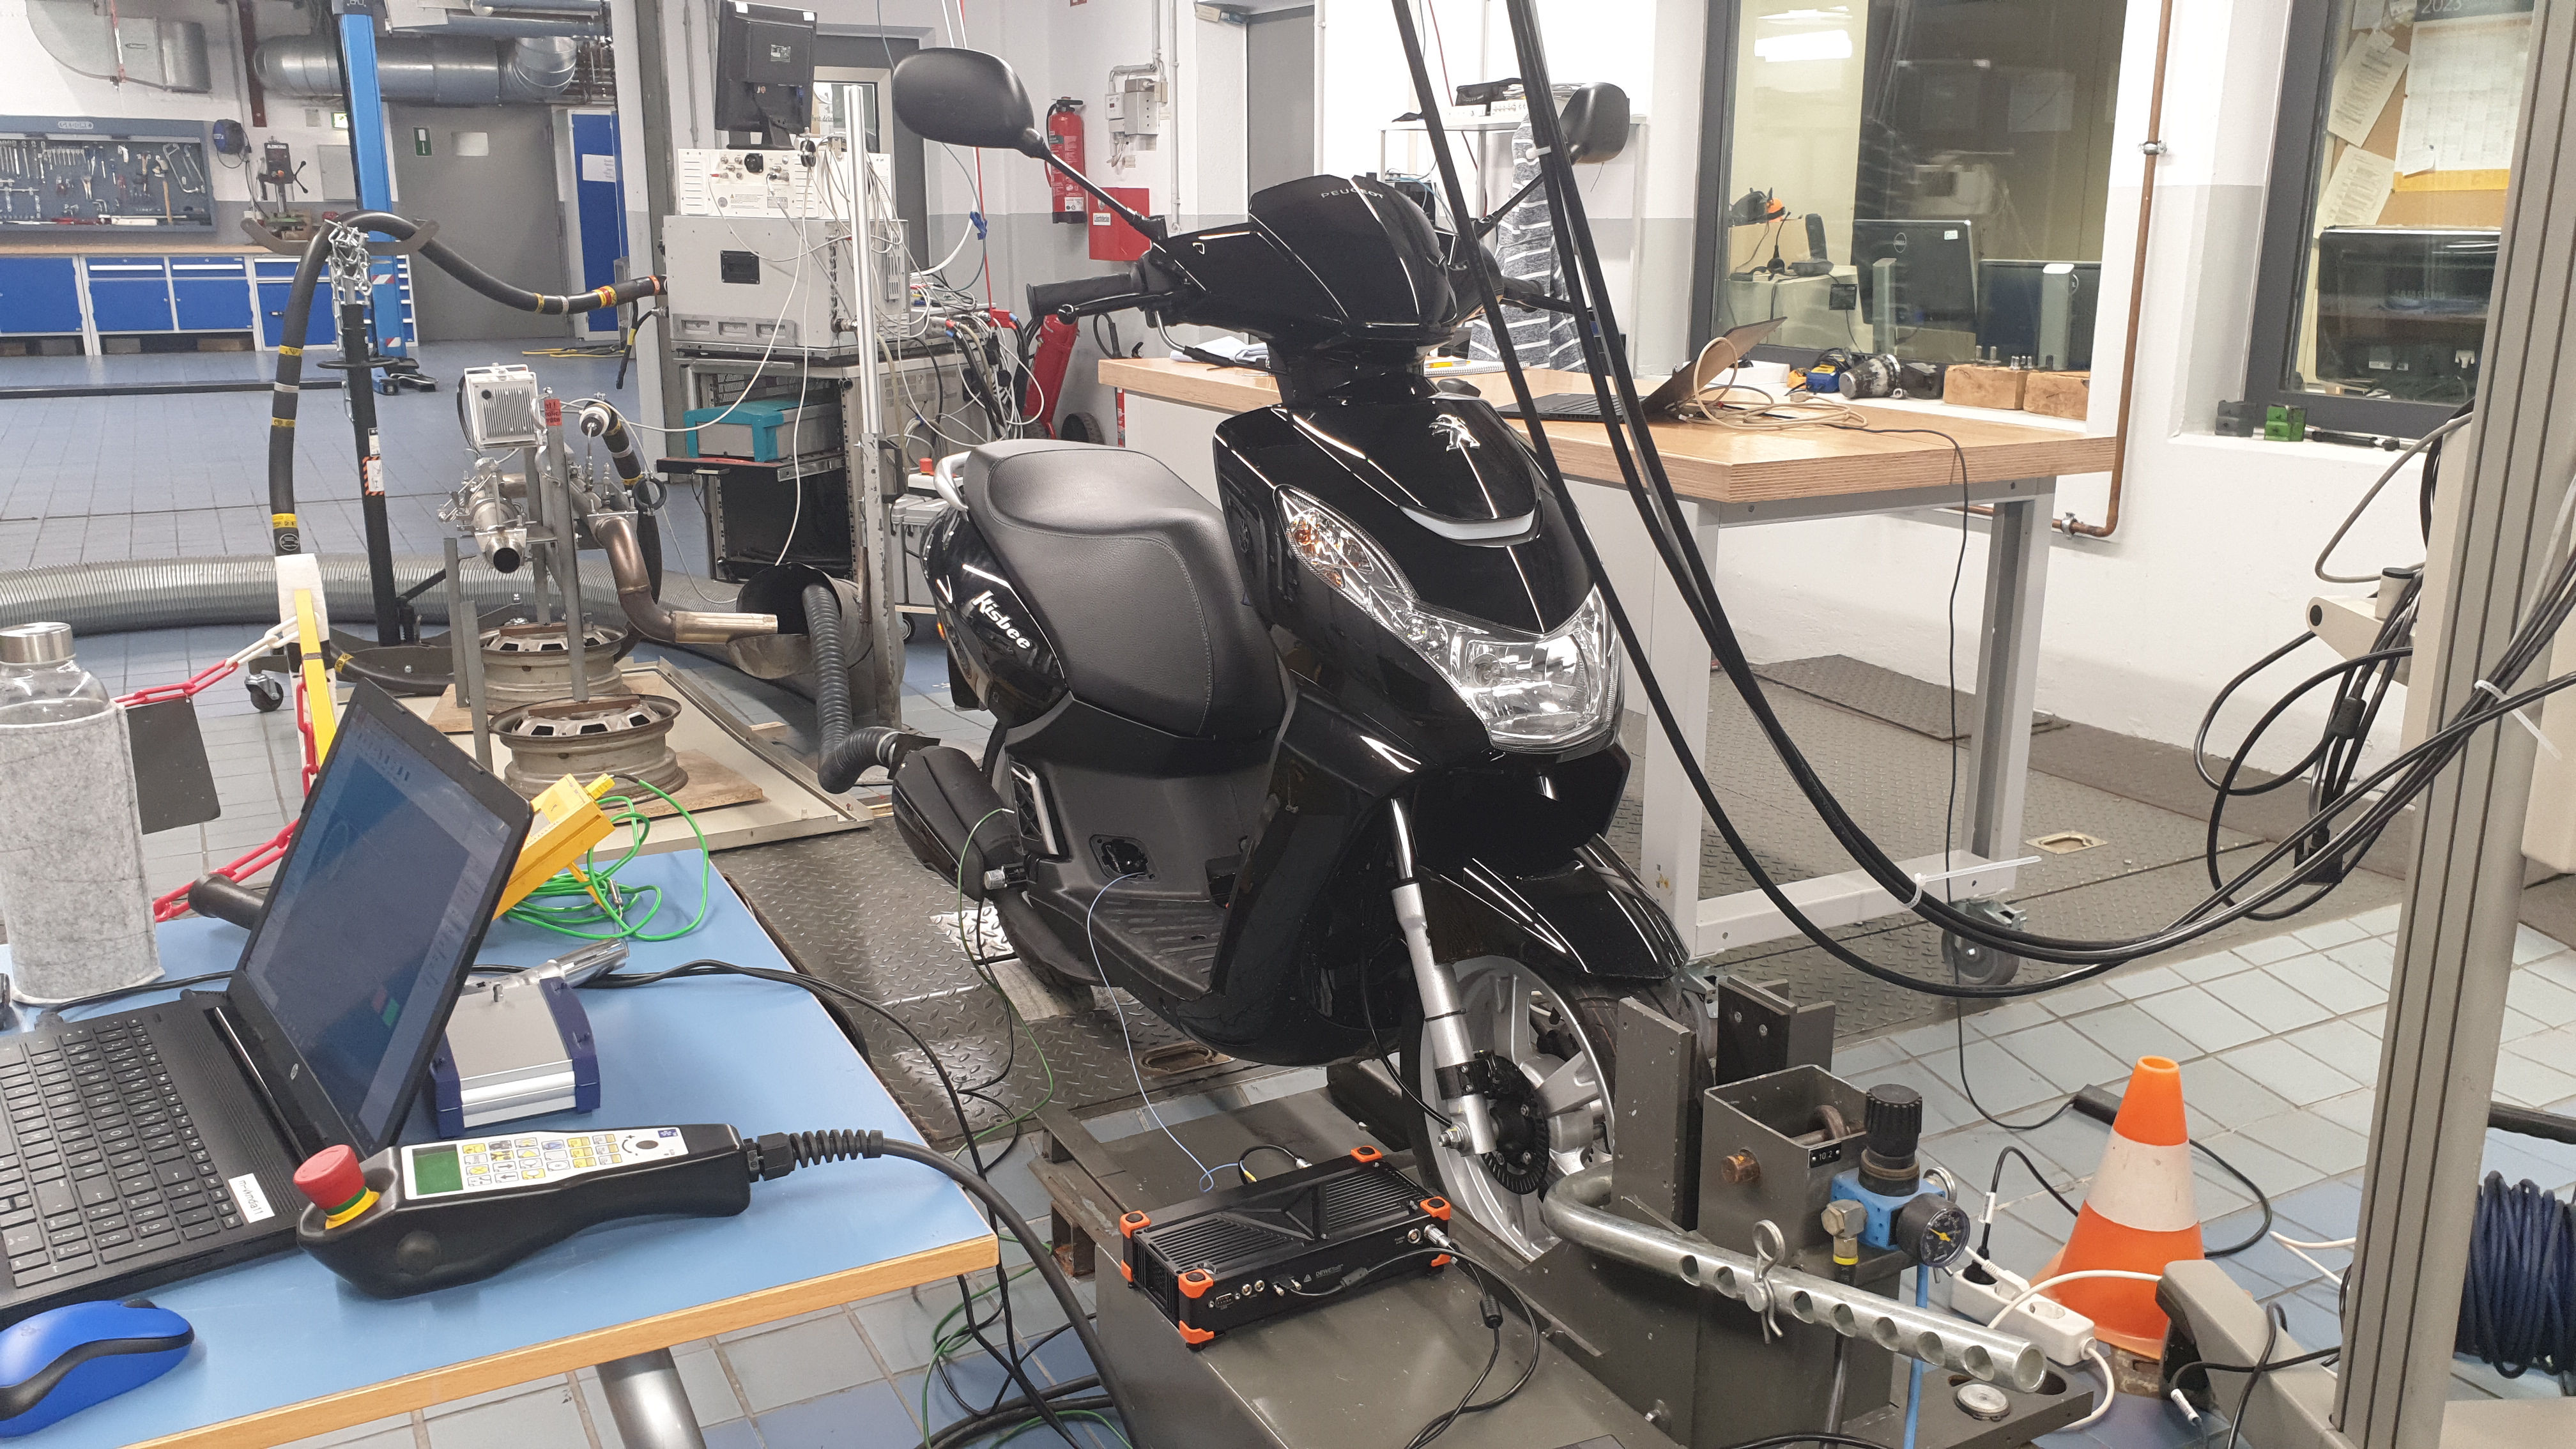
Restriction by shifting the ignition timing only occurs when the max. permitted speed is reached. The measured top speed of the test vehicle (OR) is 48.7 km/h in factory condition. In the remaining speed range, the driver manually adjusts the throttle valve position to achieve the optimum air supply. However, due to the low max. permitted speed of this vehicle class, it is usually driven at max. speed. For this reason, only operating points at 48.7 km/h are examined below. To obtain a load-dependent statement about the effect of the VC compared to the OR, a gradient is simulated using the roller dynamometer. Vehicle parameters and rider weight (80 kg) remain unchanged during all test runs, while the gradient is varied in 1% steps in the range -8% to 0% and in 0.5% steps between 0% and 2%. With a gradient of -8%, the downhill force and the driving force are balanced. Due to the low engine power, the top speed can no longer be reached on gradients exceeding 2%, which also prevents ignition timing manipulation. In order to obtain valid, reproducible and comparable measurements, the specified operating points are approached statically. The measurements are started once the top speed has been reached with the corresponding load (gradients) and the velocity control has been settled. Figure 4 shows the final setup on the roller dynamometer.
3 Results
The results are divided into vehicle CAN data, engine and exhaust gas according to the measurement data acquisition. Contrary to the test strategy described, only gradients down to -5% could be taken into account. The mass flow could not be plausibilized for steeper gradients with activated VC due to its small exhaust gas volume. Despite clustering, all the measurement data shown, relates to the same measurement run and was recorded simultaneously.
3.1 Vehicle CAN bus data
Figure 5 shows the logged vehicle data recorded by the measurement box. The Vehicle velocity of the OR and VC differs in behavior. The VC adjusts the top speed precisely until the engine power is no longer sufficient on gradients overcoming 1.5%. With the OR, the speed fluctuates slightly, with clear deviations on downhill gradients greater than 6% (0.4 km/h) and uphill gradients (up to 1.6 km/h). Further, the Throttle valve behavior is demonstrated. Contrary to the original throttle cable actuation (fully open at top speed), the system controls the throttle valve position load-dependent instead of the ignition timing. A difference of 50% can already be observed on a level road. In addition, the Engine speed shows the effects of changing load conditions. Small deviations depend on the differences in vehicle velocity caused by inaccurate OR. In order to make a statement about the fuel-air mixture with regard to the ignition timing shift, the Oxygen sensor’s measurement data was recorded. The oxygen concentration increases minimally with decreasing road gradient for VC operation. In accordance to the stoichiometric ratio ( 1), the Injector opening must also be adjusted in proportion to the lowered air supply.
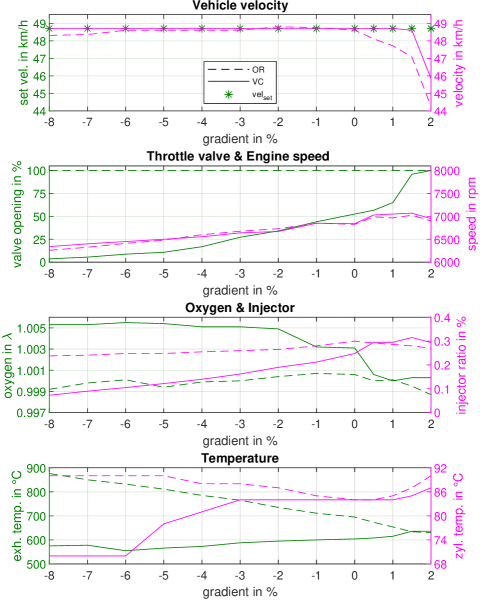
During activated VC, the injection quantity increases in proportion to the engine load and throttle valve opening. With OR, the injection quantity also increases slightly until a gradient of 0 %. When driving uphill, the injection quantity decreases in line with the decreasing velocity, although the powertrain still offers power reserves. On level ground, the VC achieved an improvement of 17%. The Temperatures of the VC show a proportional relation to the injection quantity, which in turn, depends on the throttle valve position. The cylinder temperature only differs on steeper gradients and improves by a max. of 22% (20°C). The exhaust gas temperature is reduced by max. 34% (301°C), thus drastically minimizing the thermal load on the exhaust system, even on level ground. Despite the reduction, the temperature remains within the optimum operating range for three-way catalytic converters. The temperature reduction can be explained by more efficient combustion. Instead of burning excess fuel in the exhaust gas, it is not injected at all. Tests of the engine parameters will confirm this in the following.
3.2 Effect on engine operation
A measurement of the engine parameters was made for each operating point. As parameters vary slightly with each operating cycle due to the control and combustion processes, a measurement consists of 60 cycles. To illustrate the measurement methodology, an entire series of measurements for a gradient of 0% is shown in Figure 6. All other operating points are evaluated summarized.
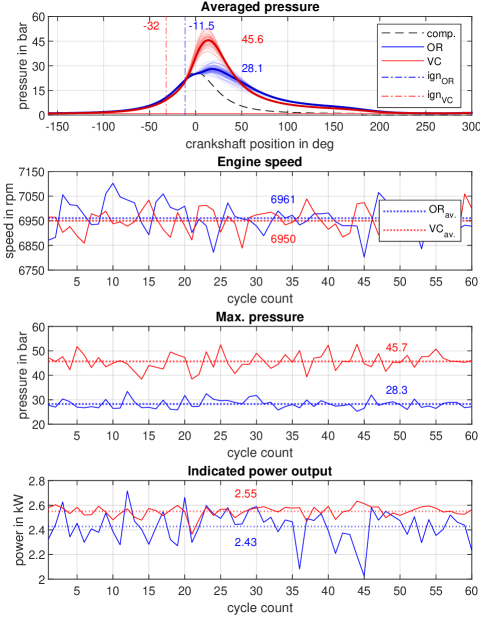
Differences in the indicated cylinder Pressure can be seen clearly. Forces acting on the piston, result directly from the cylinder pressure. Accordingly, the amount and duration of the existing pressure is decisive. The max. Averaged pressure shows an 63% increase and the peak is slightly brought forward by VC, which can be explained by an optimum ignition timing. Even on a level ground, the ignition timing is shifted forward by 20.5 degrees. The Engine speed does not differ noticeably, as the vehicle velocity is the same in both cases (see Fig. 5). The Max. pressure measured differs minimally from the max. averaged pressure, which can be justified by the averaging. An Indicated power output can be calculated by the measured mean pressure and engine speed based on the engine’s displacement. Sustained and increased mean pressures result in an improved power output.
Figure 7 shows the results of all gradient variations. The pressure curves of the VC are more compressed and higher, while the OR pressure drops slower. Consequently, the combustion process is much faster when VC is enabled. Comparing the pressures only at max. load (2%), the curves are almost identical in magnitude and progression, even if the vehicle velocity comes with a deviation (1.6 km/h). Major differences can be seen in the ignition timings. While the OR shifts the ignition timing towards or slightly after the TDC, the engine controller initiates the mixture ignition up to 29.75 degrees earlier with VC.
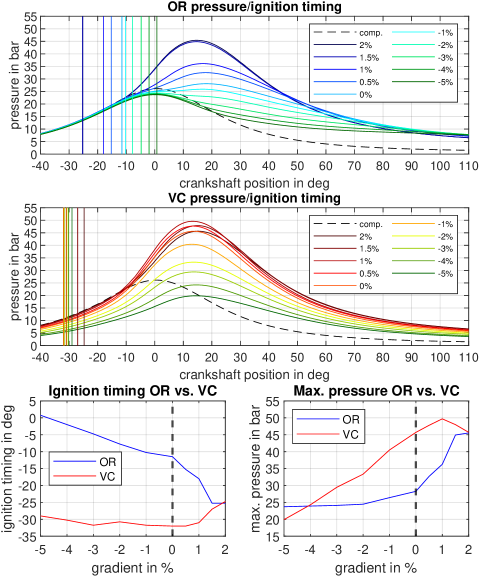
According to the injection quantity in Figure 5, a distinction must be made between the gradient-dependent pressure curves. All pressures of the OR result from the combustion of the max. injected fuel quantity. By shifting the pressure maximum (combustion) to expansion (downward movement of the piston), the energy is converted less effectively. The VC, in contrast, achieves higher pressures using considerably less fuel. The ignition timing and max. pressure graphs illustrate the effect for driving on level ground. The steeper the gradient with OR, the less of the energy provided is required and the more energy is burned in the exhaust. When VC is activated, the ignition timing remains almost constant and is only adapted to the engine speed (see Fig. 5). Even on level ground, the timing differs by 20.5 degrees and the mean pressure by 17.4 bar.
3.3 Exhaust optimization
In addition to performance, all the engine parameters described have an influence on the exhaust composition. Figure 8 shows the results of the exhaust gas measurement.
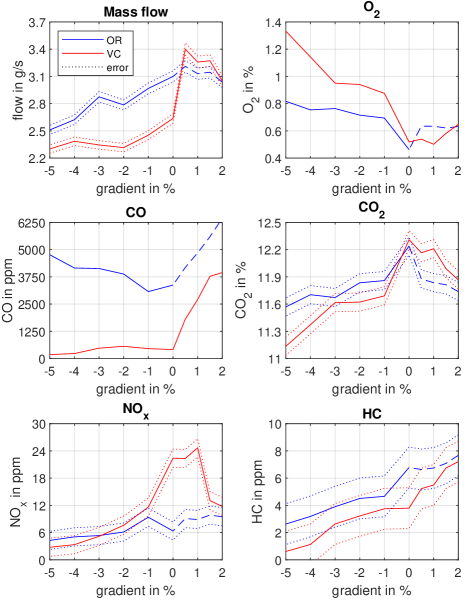
Relative results are directly related to the Mass flow and mass flow improvements reduce the emitted emissions accordingly. Despite identical conditions for the measurement of both restriction methods, the results are only partially comparable. When evaluating the recorded vehicle velocity (see Fig. 5), a deviation was noticed when driving uphill. This is due to a reduced injection quantity with OR, although the engine would be able to maintain higher vehicle velocities. As a result, the mass flow is reduced, leading to different operating points (dashed line) that are not qualitatively comparable. No changes were made to the injection control as part of the VC implementation. The given behavior can already be seen in the original state. The mass flow composes of the aspirated air and the injected fuel. When using the VC, the throttle valve is not permanently open, less air is drawn in and less fuel is injected. Consequently, the exhaust mass flow is reduced. The optimized combustion within the cylinder (see Fig. 7) reduces the combustion in the exhaust, which is caused by the overlapping of the already opened exhaust valve. Only minor changes can be seen in the CO2 concentration.
The stoichiometric ratio and the combustion temperature have a major influence on the exhaust gas composition. Since only small variations of the oxygen concentration () were detected during operation of both systems (see Fig. 5), it can be assumed that stoichiometric changes will only have minor influence on the engine’s raw exhaust gases. The catalytic converter, by contrast, reacts more sensitively to changes of the oxygen concentration (optimum: ). For lean mixture, the catalyst’s conversion rate of nitrogen oxides decreases in particular. Due to the faster combustion (see Fig. 7), the combustion temperature increases significantly, as the same amount of energy is converted in a shorter time. As a result, decreasing CO/HC and increasing NOx emissions are to be expected. The measurement actually shows extreme relative improvements in CO emissions by a max. factor of 26. The HC concentration also falls by a max. factor of 1.8. However, the increased temperatures favor the formation of NOx emissions. NOx emissions increase under load by a max. factor of 3.5. The slight increase in O2 concentration can be attributed to the minimally increased lambda value and the catalytic reduction of NOx.
If the OR would exploit the powertrain’s performance potential as the load increases, the exhaust gas emissions would equal those of the VC when driving uphill. At an incline of 2%, both operating points would be identical, as no restriction would limit the vehicle’s velocity. The mass flow would grow due to the higher injection quantity. CO and HC emissions would decrease with rising temperature and the NOx emission would increase accordingly. When driving downhill, all emissions fall drastically below those of OR operation. This would demonstrate emission improvements over all investigated load points. 50 cc scooters are mainly used in urban areas/on flat terrain. Table 3 shows the relative improvements of the exhaust gas composition when driving on level ground. The resulting emissions are discussed subsequently.
| Property | OR | VC | Improvement | |
|---|---|---|---|---|
| 1 | Mass flow in g/s | 3.1 | 2.64 | 1.17 |
| 2 | CO in ppm | 3373 | 412.7 | 8.17 |
| 3 | CO2 in % | 12.24 | 12.3 | 1.00 |
| 4 | NOx in ppm | 6.35 | 22.4 | -3.53 |
| 6 | HC in ppm | 6.8 | 3.8 | 1.79 |
4 Discussion
Classification of the absolute emission values is not directly feasible on the basis of the European emission standards. Here, the effects of the VC were compared in relation to the OR. Emission limits refer to measurements from standardized driving cycles (e.g. ECE R47, WMTC). Comparing emissions at a certain operating point can not be made with official emission data of other scooters. In addition, the WMCT cycle includes numerous accelerations and braking maneuvers between which the top speed is not reached (United Nations, 2004). During testing, the scooter predominantly reached the top speed, even in inner cities with high traffic density. Consequently, the exhaust measurements shown have a very clear effect in real-life use. The effect is maximized in non-urban use.
In order to place the measured emissions in the context of the European emission standard, the measurements were converted approximately. For the following evaluation, the measurement is assessed on level ground. To allow the measured emissions to be classified, a conversion to mass per kilometer driven (g/km) must be performed. As the measurements describe volumetric proportions, the exhaust gas volume must be approximated by use of the general gas equation. As pollutants (CO, HC, NOx) only represent 1% of the exhaust gas, variations in relation to the total volume flow can be neglected. Its main components N2 (71%), CO2 (14%) and H2O (13%) remain mainly constant (Reif, 2014). Further, ambient pressure (101325 Pa) and gas temperature (see Fig. 8) must be taken into account. By inserting the parameters previously measured, an exhaust gas volume () of 0.321 m3/min when using the OR and 0.248 m3/min with VC results. Based on the volumetric pollutant proportions, the respective mass flow rate can be calculated using the general gas equation. By taking into account the top speed, the pollutant’s volumes can be specified as masses in relation to a driven distance of one kilometer. Table 4 shows the converted emissions.
| Param. | OR | VC | Euro 5 |
|---|---|---|---|
| 15.63 m3/h | 12.09 m3/h | / | |
| 0.321 m3/km | 0.248 m3/km | / | |
| CO2 | 43.1 g/km | 36.81 g/km | / |
| CO | 642.14 mg/km | 76.48 mg/km | 1000 mg/km |
| HC | 8.06 mg/km | 3.84 mg/km | 100 mg/km |
| NOx | 2.33 mg/km | 7.04 mg/km | 60 mg/km |
The comparison with the Euro 5 emissions standard (valid from 2020) demonstrates that although the vehicle can comply with all limit values for this operating point, the OR CO emissions in particular are relatively high. By using the VC, CO emissions can be reduced by a factor of 8.4. As CO is a dangerous respiratory toxin for humans, the improvements are crucial. HC emissions are also reduced by a factor of 2.1, although these are far below the limit. Despite the 3-fold increase in NOx emissions, they are still low compared to the Euro 5 limit. CO2 emissions are not taken into account by the exhaust gas standards, even though they are largely responsible for the greenhouse effect. An improvement by a factor of 1.17 can be observed. For gradients from -1% to -8%, the emissions would further improve significantly. For gradients 0%, the emissions of both systems would equalize with increasing gradient.
5 Conclusion
A velocity-controlled Throttle-by-Wire-System was developed in the preliminary stages, which serves as an eco-friendly restriction for 50 cc scooters and significantly reduces fuel economy. In order to evaluate the influence on the mixture preparation, the combustion process and exhaust gas formation, the vehicle was equipped with measurement technology. A measurement box logged all system-relevant CAN data. The engine was fitted with a crankshaft encoder, an indicating spark plug for pressure indication and an ignition clamp. Cylinder and exhaust gas temperature were measured by attaching two temperature probes. The exhaust gas composition was examined with regard to mass flow, CO, CO2, NOx, O2 and HC concentration.
A coast down test was performed to determine the vehicle’s resistance parameters. These were used to approach load points by varying the road gradient on a roller dynamometer at top speed. A considerable improvement in exhaust gas emissions was demonstrated caused by the velocity-controlled Throttle-by-Wire-System. The exhaust mass flow was reduced across all operating points (17% on the level). Toxic CO emissions were also reduced by a factor of 8.4. Clear reductions (max. 54%) in carcinogenic HC emissions were detected over the entire measurement range. NOx emissions increased for gradients between -1% and 1% by a max. factor of 3. CO2 emissions, which are largely responsible for the greenhouse effect, were minimized by 17%. These improvements are achieved, as demonstrated by measuring the engine parameters, by suppressing the ignition timing shift and regulating the air supply. The measurements show a max. ignition offset of 29.5 degrees between original restriction and velocity control. The internal cylinder pressures increase with velocity control operation and combustion is more efficient and faster. As a result, the combustion temperatures increase, which leads to the observed optimization of CO and HC emissions.
Acknowledgements
The herein presented research was funded and supported by the University of Cadiz and Frankfurt University of Applied Sciences. The authors acknowledge the valuable support of Peugeot Motocycles Deutschland GmbH.
References
- AVL List GmbH (2010) AVL List GmbH, 2010. AVL M.O.V.E Gas Pems 493.
- AVL List GmbH (2016) AVL List GmbH, 2016. AVL Pressure Sensors for Combustion Analysis.
- AVL List GmbH (2023) AVL List GmbH, 2023. AVL M.O.V.E EFM Exhaust Flow Meter.
- Basshuysen and Schäfer (2015) Basshuysen, R., Schäfer, F., 2015. Handbuch Verbrennungsmotor. 7 ed.. Springer Singapore, Wiesbaden, Germany. pp. 638–643. doi:https://doi.org/10.1007/978-3-658-04678-1.
- Corno et al. (2008) Corno, M., Ranelli, M., Savaresi, S.M., Fabbri, L., Nardo, L., 2008. Electronic throttle control for ride-by-wire in sport motorcycles, in: Proc. 17th IEEE International Conference on Control Applications, pp. 223–238. doi:https://doi.org/10.1109/CCA.2008.4629640.
- European Parliament (2002) European Parliament, 2002. Directive 2002/24/ec relating to the type-approval of two or three-wheel motor vehicles and repealing council directive 92/61/eec. Official Journal of the European Communities 2002/24/EC.
- European Parliament (2007) European Parliament, 2007. Regulation on type approval of motor vehicles with respect to emissions from light passenger and commercial vehicles (euro 5 and euro 6) and on access to vehicle repair and maintenance information. Official Journal of the European Union No 715/2007.
- European Parliament (2021) European Parliament, 2021. Establishing the framework for achieving climate neutrality and amending regulations (‘european climate law’). Official Journal of the European Union (EC) No 401/2009 and (EU) 2018/1999.
- Favre et al. (2011) Favre, C., May, J., Bosteels, D., Tromayer, J., Neumann, G., Kirchberger, R., Eichsleder, H., 2011. A demonstration of the emission behaviour of 50cm3 mopeds in europe including unregulated components and particulate matter. SAE International doi:https://doi.org/10.4271/2011-32-0572.
- Görgen et al. (2018) Görgen, M., Balazs, A., Böhmer, M., Nijs, M., Lehn, H., Scharf, J., Thewes, M., Müller, A., Alt, N., Claßen, J., Sterlepper, S., 2018. All lambda 1 gasoline powertrains, in: Internationaler Motorenkongress, pp. 93–111. doi:https://doi.org/10.1007/978-3-658-21015-1\_7.
- Hirz et al. (2004) Hirz, M., Korman, M., Eichlseder, H., Kirchberger, R., 2004. Potential of the 50cc two wheeler motor vehicle class in respect of future exhaust emission targets. SAE International doi:https://doi.org/10.4271/2004-32-0050.
- JUMO GmbH & Co. KG (2023) JUMO GmbH & Co. KG, 2023. Mineral-insulated thermocouples to DIN 43 710 and EN 60 584, Data Sheet 90.1210 (90.1221).
- Koltsakis and Stamatelos (1997) Koltsakis, G., Stamatelos, A., 1997. Catalytic automotive exhaust aftertreatment. Elsevier Science doi:https://doi.org/10.1016/S0360-1285(97)00003-8.
- Kreß et al. (2021) Kreß, J., Morgado-Estévez, A., Perez-Peña, F., Schmidt, K., Hebert, H., 2021. Development of single-axis wheel speed sensor hil test bench for vehicle velocity control, in: Proc. 3rd International Congress on Human-Computer Interaction, Optimization and Robotic Applications (HORA), pp. 1–5. doi:https://doi.org/10.1109/HORA52670.2021.9461305.
- Kreß et al. (2023) Kreß, J., Rau, J., Hebert, H., Perez-Peña, F., Schmidt, K., Morgado-Estévez, A., 2023. Low-cost throttle-by-wire-system architecture for two-wheeler vehicles. arXiv 2304.14875. doi:https://doi.org/10.48550/arXiv.2304.14875.
- Kreß et al. (2024) Kreß, J., Rau, J., Hebert, H., Perez-Peña, F., Schmidt, K., Morgado-Estévez, A., 2024. Fuel saving effect and performance of velocity control for modern combustion-powered scooters. Control Engineering Practice 145. doi:https://doi.org/10.1016/j.conengprac.2024.105849.
- Kumar et al. (2023) Kumar, G., Badulla, S., Nagaraju, J., Venkatesh, O., Narasimhulu, G., Rao, V., 2023. Design and analysis of 3-way catalytic converter using cfd. Materials Today: Proceedings doi:https://doi.org/10.1016/j.matpr.2023.07.215.
- Kübler (2023) Kübler, 2023. Kübler, Incremental encoders, Miniature optical.
- Leyda and Wos (2012) Leyda, K., Wos, P., 2012. Internal Combustion Engines. 1 ed.. IntechOpen, Croatia. pp. 71–72. doi:https://doi.org/10.5772/2806.
- Merker and Teichmann (2019) Merker, G., Teichmann, R., 2019. Grundlagen Verbrennungsmotor. 9 ed.. Springer Vieweg, Wiesbaden, Germany. p. 989. doi:https://doi.org/10.1007/978-3-658-23557-4.
- Miritsch et al. (2021) Miritsch, J., Graf, H., Böck, K., Deuschle, R., 2021. Big boxer - the engine in the new bmw r18. MTZ worldwide 82, 48–54. doi:https://doi.org/10.1007/s38313-021-0688-1.
- Poschner et al. (2010) Poschner, M., Vogt, J., Wösle, G., Wagner, H., 2010. The new bmw s 1000 rr. ATZ worldwide 112, 4–10. doi:https://doi.org/10.1007/BF03225247.
- Reif (2014) Reif, K., 2014. Ottomotor-Management. 4 ed.. Springer Vieweg, Wiesbaden, Germany. p. 175. doi:https://doi.org/10.1007/978-3-8348-2102-7.
- Smither et al. (2011) Smither, B., Allen, J., Ravenhill, P., Farmer, G., Grosch, P., Demesse, E., 2011. Development of electronic throttle actuation for a 50cc 2-stroke scooter application. SAE International doi:https://doi.org/10.4271/2011-32-0581.
- Smither et al. (2008) Smither, B., McFarlane, I., Drake, T., Ravenhill, P., Allen, J., Boak, J., 2008. Engine management system for fuel injection system specifically designed for small engines. SAE International doi:https://doi.org/10.4271/2008-32-0052.
- Stoffregen (2018) Stoffregen, J., 2018. Motorradtechnik. 9 ed.. Springer Vieweg, Olching, Germany. p. 43. doi:https://doi.org/10.1007/978-3-658-07446-3.
- United Nations (2004) United Nations, 2004. Worldwide harmonised motorcycle emissions certification procedure (wmtc). Economical and Social Council TRANS/WP.29/GRPE/2004/10.
- ZSE Electronic GmbH (2010) ZSE Electronic GmbH, 2010. Sirius Technical Reference Manual, Version 1.5.5.