Controlling Moisture for Enhanced Ozone Decomposition: A Study of Water Effects on CeO2 Surfaces and Catalytic Activity
Abstract
This study investigates the catalytic degradation of ground-level ozone on low-index stoichiometric and reduced CeO2 surfaces using first-principles calculations. The presence of oxygen vacancies on the surface enhances the interaction between ozone and catalyst by serving as active sites for adsorption and decomposition. Our results suggest that the {111} surface has superior ozone decomposition performance due to unstable oxygen species resulting from reaction with catalysts. However, when water is present, it competes with ozone molecules for these active sites, resulting in reduced catalytic activity or water poisoning. A possible solution could be heat treatment that reduces the vacancy concentration, thereby increasing the available adsorption sites for ozone molecules while minimizing competitive adsorption by water molecules. These results suggest that controlling moisture content during operation is crucial for the efficient use of CeO2-based catalysts in industrial applications to reduce ground-level ozone pollution.
keywords:
Ozone decomposition, water poisoning, chemisorption, first-principles calculations1 Introduction
Ozone exhibits antibacterial and antiviral properties and has a redox potential of 2.08 eV, making it a powerful oxidizing agent. These properties pave the way for applications such as water purification, pollutant degradation and inhibition of nitric acid production by fully oxidizing exhaust gases 1, 2, 3, 4. This leads to the release of residual ozone in the atmosphere at ground level, which can negatively impact human health and damage crops. 2, 5, 6, 7, 8, 9, 10. In the interests of human and environmental safety, reducing ozone pollution in industrial processes and in the atmosphere is of the utmost importance. Activated carbon adsorption, chemical absorption, and catalytic decomposition are the existing processes to remove the ground level ozone 11, 12, 13, 14. Among which catalytic decomposition of ozone into O2 at low temperatures is the promising method of ozone elimination as it gives better efficiency and is also environment friendly process. Transition metal oxides and noble metal catalysts are the commonly used catalysts for ozone decomposition. Owing to the high cost of noble metals, transition metal oxides have attracted greater interest in the past. It has been found that p-type oxides like MnO2, NiO, Co3O4, Fe2O3, Ag2O, and CeO2 shows greater catalytic efficiency as compared to the n-type oxides which include V2O5, CuO, MoO3 etc. 15.
Ozone can be adsorbed on metal oxide surfaces and dissociate into the reactive oxygen species, however, the oxide surfaces have a high affinity for water molecules 16, 17. The oxide surface is hydroxylated by the chemical adsorption and dissociation of water. Depending on the surface structure, isolated hydroxyl groups, hydrogen-bonded hydroxyl groups, and bridged hydroxyl groups can be formed on different oxides 18, 19. This can greatly affect the catalytic decomposition of ozone on oxides. Previous studies claim that surface hydroxyl groups are the site of ozone depletion, however, not all hydroxyl groups are catalytically active 20, 21. The presence of water has a major impact on the catalyst efficiency for ozone decomposition in transition metal oxides 17, 22, 23, 24.
In this work, using first-principles calculation we have studied the interaction of ozone on {111}, {110}, and {100} surfaces of CeO2. Due to differences in the atomic arrangement, these surfaces exhibit different catalytic performances. As oxygen vacancies are the adsorption sites for ozone decomposition and their presence has also improved the rate of ozone elimination in oxides. In the presence of oxygen vacancies, ozone behavior on the considered surfaces was also analyzed. It has already been pointed out that the presence of water interferes with the catalytic activity of the catalyst, we have looked into the effect of water on ozone adsorption on stoichiometric and oxygen-deficient CeO2{111} surface. We have also shown the effect of oxygen vacancies concentration on the adsorption of ozone in the presence of water. Furthermore, we investigate the competitive co-adsorption of H2O and O3 on CeO2 surfaces, examining their binding properties and potential interference with ozone decomposition. We find that heat treatment may help optimize the performance of CeO2-based catalysts in the dissociation of ground-level ozone. Heat treatment can reduce the number of oxygen vacancies on CeO2 surfaces, making the surface more similar to a stoichiometric surface with no defects. However, as H2O has larger adsorption energy on reduced {111} surfaces compared to its adsorption energies on stoichiometric {111}, {110}, and {100} surfaces, therefore, by reducing oxygen vacancies, the surface becomes not only more stable, it also becomes less reactive towards H2O, which can improve the selectivity of ozone dissociation in the presence of water.
2 Computational Details
Our first-principles calculations are based on density functional theory as implemented in the Vienna Ab initio Simulation Package (VASP) 25. The exchange- correlation energy is implemented by the Perdew-Burke-Ernzerhof (PBE) 26, and the core-valence electron interaction is described using the projected augmented wave (PAW) method 27. For Ce f orbitals we have chosen U value of 5 eV throughout the calculations in consistent with the values recommended in previous theoretical studies 28, 29, 30, 31. The {111}, {110}, and {100} slabs are constructed using (), (), and () conventional unit cells consisting of 12 (16 CeO2 units), 4 (16 CeO2 units), and 7 atomic layers (24 CeO2 units) respectively. A vacuum gap of at least 12 Å is included along the z-direction to minimize the interaction between periodic images. The energy cut-off of 520 eV is used to truncate the plane wave basis sets and the entire Brillouin zone is sampled using k-points mesh. The spin-polarized calculations are carried out for a reduced system consisting of oxygen vacancies. The bottom layers are kept fixed, and the uppermost layers are allowed to relax until the maximum forces on each atom are less than 0.03 eV/Å. The dipole correction is applied along the z-direction to treat the artificial electric field arising due to the asymmetry (resulting due to adsorbate adsorption and introduction of oxygen vacancies) and periodicity of the slab.
3 Results and Discussion
CeO2 crystallizes in the cubic fluorite structure with Fm3m symmetry, and the slabs are modelled using the lattice constant of 5.49 Å obtained theoretically which is in close agreement with the experimental value of 5.41 Å 32 and previous theoretical results 29, 33, 34, 35. We have investigated the {111}, {110}, and {100} surfaces of CeO2, among which {100} surface is type III according to Tasker classification i.e. it is polar 36. For the simulation of {100} surface, we have moved the half of surface oxygen atoms to the other side of the slab to quench the dipole moment normal to the surface. CeO2{111} surface is most stable of all followed by {110}, and {100} surfaces 37, 38. O atoms of ozone, water, and surfaces are represented by , , and O respectively.
In the following sections, we explore the adsorption and decomposition of ozone (O3) on CeO2 surfaces and the influence of surface structure and moisture on the catalytic activity of CeO2-based catalysts. We find that O3 adsorbed in a dissociative form is more thermodynamically favorable on the {111} surface compared to {110} and {100} surfaces. Oxygen vacancies on the reduced surfaces of CeO2 serve as active sites for O3 adsorption and decomposition, facilitating the process more efficiently than on stoichiometric surfaces. Additionally, the presence of water interferes with O3 adsorption on reduced {111} surfaces by blocking the oxygen-deficient site, which is crucial for ozone adsorption and decomposition. These findings contribute to our understanding of ozone decomposition on CeO2 catalysts and offer insights for optimizing their performance in various industrial applications.
3.1 O3 adsorption on stoichiometric {111}, {110}, and {100} surfaces
We have considered the adsorption of O3 on the stoichiometric CeO2 surfaces and calculated the adsorption energy (Eads.) using the following relation:
| (1) |
where, Eslab+molecule is the energy of slab with molecule adsorbed on it, Eslab and Emolecule are the energies of clean slab and molecule in the gaseous phase respectively.
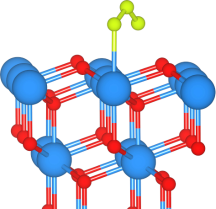
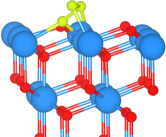
O3 gets adsorbed at Ce site of {111} surface forming a Ce-Oozone bond of length 2.66 Å with an adsorption energy of -0.40 eV (Figure 1LABEL:sub@fig:_Figure_1a). As a result of interaction, we notice an elongation in the bond length from 1.28 Å in the gaseous phase to 1.32 Å in the adsorbed state. The oxygen atom not bound to the surface atoms has bond length of 1.29 Å. Whereas, on {110} surface O3 binds with an adsorption energy of -0.91 eV and forms a bond with two Ce atoms of length 2.60 Å resulting in an elongation of O bond to 1.33 Å (Figure 1LABEL:sub@fig:_Figure_1b). On {100} surface, O3 binds to the surface through Ce atoms forming a Ce-Oozone bond of lengths 2.61-2.63 Å and the corresponding adsorption energy is -1.04 eV (Figure 1LABEL:sub@fig:_Figure_1c). Interestingly, compared to other surfaces elongation in Oozone-Oozone bond is maximum on {100}, the bond length is 1.36 Å after interaction with the surface. There is a decrease in the bond angle of O3 upon interaction with the CeO2 {111} and {100} surfaces and it slightly increases for {110} surface (see Table 1). The reduction in the bond angle of ozone is more prominent in {100} and can be attributed to the increased Oozone-Oozone bond length which leads to the weaker repulsion. Also, the increase in the bond length of ozone will reduce the bond dissociation energy and facilitate further reactions.
The charge density difference () is calculated using the following relation:
| (2) |
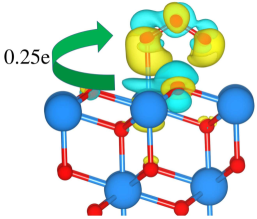
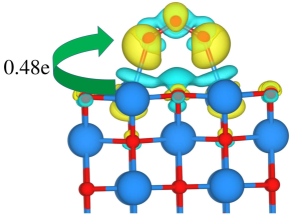
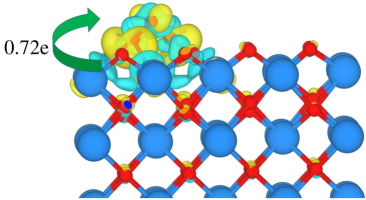
where, , , and are the charge density of slab with O3 adsorbed on it, the CeO2 surface and the isolated O3 molecule in its adsorbed configuration respectively. The charge density difference analysis shows the accumulation of electrons in Ce-O bond and depletion on the surface Ce atoms which indicate the electron transfer from the surface to O3 (see Figure 1LABEL:sub@fig:_Figure_1d-LABEL:sub@fig:_Figure_1f). Also, we notice a charge depletion around one of the oxygen atoms of ozone indicating that it donates electrons to the other two oxygen atoms of ozone as well. The Bader charge analysis shows the transfer of electrons from the surface to the molecule. The electron transfer is maximum on {100} surface followed by {110} and {111} surface indicating that O3 interacts strongly with {100} surface which is also reflected in the adsorption energy values. In a nutshell, O3 becomes negatively charged with the changed bond angle and elongated Oozone-Oozone bond length upon adsorption on CeO2 surfaces. The structural parameters and adsorption energies are summarised in Table 1.
3.2 O3 dissociation on stoichiometric {111}, {110}, and {100} surfaces
The adsorption energies of dissociative adsorption of O3 on stoichiometric CeO2 surfaces are -0.15 eV, -1.31 eV, and -1.46 eV for the {111}, {110}, and {100} surfaces respectively. The lowest energy geometries of dissociative O3 on CeO2 surfaces are shown in Figure S1 of supplementary information. O3 dissociates into O2-O and the dissociation occurs during minimization. On {111} surface, O2 gets attached to the surface Ce atom forming two Ce-Oozone bonds of length 2.54 Å and 2.47 Å and other Oozone atom binds with the surface O and Ce atoms, the corresponding bond lengths are 1.40 Å and 2.55 Å respectively (Figure S1(a) of supplementary information). At {110} surface, O2 (of O3) forms a single Ce-Oozone bond of length 2.37 Å and O gets attached to the surface Ce and O atoms forming a bond of length 2.46 Å and 1.37 Å respectively (Figure S1(b) of supplementary information). Whereas, on {100} surface O2 (of O3) forms Ce-O bond of lengths 2.48-2.68 Å. O (of O3) gets attached to two Ce atoms and the surface oxygen atom (Figure S1(c) of supplementary information). The structural parameters and binding energies are given in Table S1 of supplementary information.
O3 dissociation is thermodynamically more favorable on {110} and {100} surfaces as compared to the {111} surface. However, the oxygen species formed as a result of ozone decomposition should not get stabilised on the surface. This will make it difficult for the species to leave the surface and the adsorption sites won’t be available to carry out further reaction. As per the adsorption energy, oxygen species formed as a result of ozone decomposition is quite stable on {110} and {100} surfaces as compared to {111} which makes {111} surface more suitable for ozone decomposition.
3.3 O3 adsorption on reduced {111}, {110}, and {100} surfaces
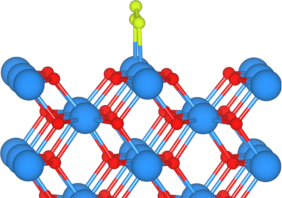
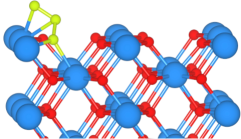
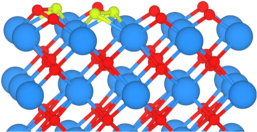
As oxygen vacancies act as an active site for ozone adsorption and decomposition, we have introduced the oxygen vacancies of concentrations 0.25, 0.125, and 0.125 on {111}, {110}, and {100} surfaces respectively. At {111} and {110} surfaces, O3 occupy the oxygen deficient site with an adsorption energy of -3.24 eV and -2.65 eV respectively (Figure 2LABEL:sub@fig:_Figure_2a and LABEL:sub@fig:_Figure_2b). Whereas, on {100} surface O3 binds to Ce atoms slightly away from the oxygen-deficient site, its adsorption energy is -2.71 eV (Figure 2LABEL:sub@fig:_Figure_2c). The binding energies and structural parameters are tabulated in Table 2. We notice a significant elongation in Oozone-Oozone bond length on reduced surfaces as compared to the stoichiometric. This indicates that the presence of oxygen vacancies facilitate the decomposition more efficiently as compared to the stoichiometric surfaces.
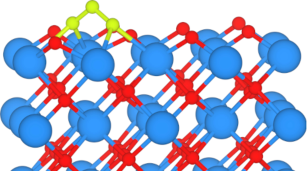
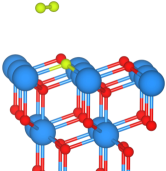
Considering the dissociative adsorption of O3 on reduced CeO2 surfaces we find that O3 adsorbed in dissociative form is thermodynamically more favorable on {111} surface as compared to {110} and {100} surfaces (see Table S2 of supplementary information). O3 dissociates into O2-O on {111} surface with Oozone atom occupying the oxygen-deficient site and O2 (of O3) gets stabilized at 3.04 Å from the surface (Figure 3LABEL:sub@fig:_Figure_3a). It clearly shows the release of oxygen gas after O3 dissociation. Contrary to {111} surface, O2 of O3 occupies the oxygen deficient site and Oozone binds with the surface O and Ce atoms on both {110} and {100} surfaces (Figure 3LABEL:sub@fig:_Figure_3b and LABEL:sub@fig:_Figure_3c). The adsorption energies of O3 on reduced CeO2 surfaces reveal that the binding becomes stronger in the presence of oxygen vacancies. On {111} surface of reduced CeO2, oxygen gas is released spontaneously after dissociation which make it a good candidate for ozone decomposition as compared to {110} and {100} surfaces in the presence of oxygen vacancies.
3.4 H2O adsorption on stoichiometric {111}, {110}, and {100} surfaces
The presence of H2O affect the catalytic activity of O3 decomposition on the oxide surfaces. We have obtained the most stable adsorption site of H2O both in associative and dissociative state on {111}, {110}, and {100} surfaces. The adsorption energies and structural geometries are tabulated in Table S3 of supplementary information. The adsorption energies of H2O adsorbed in the associative form are -0.54 eV, -0.77 eV, and -0.92 eV on {111}, {110}, and {100} surfaces respectively. H2O interacts strongly with {100} surface and weakly with {111} surface, similar trend was also observed for O3 adsorption. The interaction of H2O with {111} surface is slightly stronger in comparison to O3 whereas, on {110} and {100} surfaces O3 interaction is stronger than the H2O. H2O prefers to adsorb at Ce site forming a Ce-O bond of length 2.61 Å and 2.65 Å on {111} and {110} surfaces respectively (Figure S2(a) and (b) of supplementary information). We notice the formation of one hydrogen bond of length 1.74 Å on {111} surface, whereas H2O forms two hydrogen bonds of length 2.00 Å on {110} surface. Contrary to {111} and {110} surface, H2O is shared between two Ce atoms forming a Ce-O bond of length 2.65 Å on {100} surface (Figure S2(c) of supplementary information).
The adsorption energies of H2O adsorbed in dissociative form on {111}, {110}, and {100} surfaces are -0.52 eV, -1.07 eV, and -1.69 eV respectively. OH binds to the Ce atom and H gets attached to the adjacent surface oxygen atom in the most stable configuration on {111} and {110} surfaces (Figure S2(d) and (e) of supplementary information). The adsorption energy difference between H2O adsorbed in associative and dissociative form on {111} surface is 0.02 eV suggesting the co-existence of H2O in both associative and dissociative state on {111} surface. At {100} surface, OH occupies the vacant site created as a result of the removal of half of the surface oxygen atoms and H gets attached to the surface oxygen atom (Figure S2(f) of supplementary information). The adsorption energies and structural parameters are given in Table S3 of supplementary information. Our adsorption energies and geometrical parameters are in close agreement with the previous theoretical studies done by Molinari et al.31.
3.5 H2O adsorption on reduced {111}, {110}, and {100} surfaces
The adsorption energies of H2O adsorbed in associative form on reduced CeO2 {111}, {110}, and {100} surfaces are -1.21 eV, -1.20 eV, and -1.00 eV respectively. H2O forming bond with the surface Ce atom is the most stable binding configuration and there is a hydrogen bond formation on all the considered surfaces (see Figure S3(a)-(c) of supplementary information). In case of H2O adsorbed in dissociative form, OH prefers to occupy the oxygen-deficient site and Owater gets attached to the surface oxygen atom. On {110} surface, OH forms a hydrogen bond of length 1.81 Å, there is no hydrogen bond formation on any other surfaces as shown in Figure S3(d)-(f) of supplementary information. The adsorption energies of both O3 and H2O are more negative on reduced CeO2 surfaces indicating the strong interaction between vacancies and adsorbates. The results are in agreement with the previous work done by Molinari et al. 31, Fronzi et al. 39, and Watkins et al. 40. However, the presence of oxygen vacancies favors the binding of O3 as compared to that of H2O. The adsorption energies and geometrical parameter are summarised in Table S4 of supplementary information.
3.6 Competition between H2O and O3 on CeO2 {111} surface: Coadsorption study
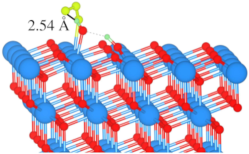
From our previous results, it is clear that both O3 and H2O are strongly attracted to the surface and prefers same binding sites for adsorption. There will be competitive adsorption between O3 and H2O on the CeO2 surfaces. As CeO2{111} surface is the most stable surface of all, we have investigated the coadsorption of O3 and H2O on stoichiometric CeO2{111} surface. We have looked into the effect of H2O and H-OH on the adsorption of ozone as both H2O and H-OH are equally probable on {111} surface. We have considered conventional unit cells for the coadsorption of H2O and O3 on stoichiometric {111} surface. For a better comparison of O3 adsorption energy in the presence and absence of H2O, we have obtained the adsorption energy of O3 on conventional unit cells and got the adsorption energy of O3 to be -0.43 eV. The adsorption energy is changed by 0.03 eV when the coverage of O3 is reduced indicating that the O3 coverage has a little effect on its binding on stoichiometric {111} surface of CeO2. For the same coverage, the adsorption energy of H-OH is -0.64 eV, it is changed by 0.07 eV indicating that H-OH adsorption energy is coverage dependent as reported by Molinari et al. 31. To look into the effect of H-OH on the adsorption energy of O3 we varied the distance between O3 and H-OH (see Figure 4LABEL:sub@fig:_Figure_4a-LABEL:sub@fig:_Figure_4c) and calculated the adsorption energy of O3 using the following relation:
| (3) |
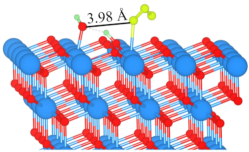
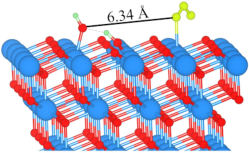
Where, E, is the energy of H-OH/ and O3 adsorbed on slab, E is the energy of H-OH and H2O adsorbed on slab and E is the energy of isolated O3 in the gaseous phase. The adsorption energy of O3 in the presence of H-OH is -0.26 eV when kept at a distance of 2.54 Å and its -0.43 eV in the absence of H-OH. Also, O3 moves further away from the surface and binds at a distance of 2.75 Å (Ce-Oozone bond length) from the surface in the presence of H-OH indicating weaker interaction between O3 and surface (Table 3). This suggests that the presence of H-OH weakens the binding of O3 on stoichiometric {111} surface. However, when O3 is moved away from H-OH i.e. at a distance of 6.34 Å, there is a negligible interaction between H-OH and O3, its adsorption energy is -0.38 eV which is close to its adsorption energy value of -0.43 eV in the absence of H-OH. At an intermediate distance of 3.98 Å, the binding energy of ozone is -0.27 eV indicating there is still an interaction between O3 and H-OH. Charges and other structural parameters of O3 are similar to that in the absence of H-OH at 6.34 Å (see Table 3). O3 becomes negatively charged and H-OH becomes slightly positively charged as a result of coadsorption.
We further calculated the charge density difference ( plot of two configurations in which O3 is at distance of 2.54 Å and 6.34 Å from H-OH using the following relation:
| (4) |
where , , and are the charge density of slab with H-OH/H2O and O3 adsorbed on it, the slab with H-OH/H2O adsorbed on it, and the isolated O3 molecule in its adsorbed configuration. We notice an electron accumulation along Ce-Oozone bond and electron depletion on surface atoms suggesting the electron transfer from the surface to O3. Also, there is a charge re-distribution on the H-OH when it is close to O3 (at a distance of 2.54 Å), whereas it remains unaffected when it is moved further away from O3 as shown in Figure 5LABEL:sub@fig:_Figure_5a and LABEL:sub@fig:_Figure_5b. Our analysis confirms that there is an interaction between H-OH and O3 when placed close to each other which clearly affects the binding and geometry of O3 (see Table 3).
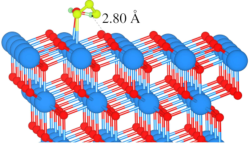
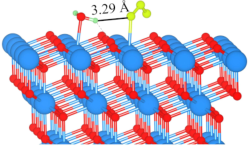
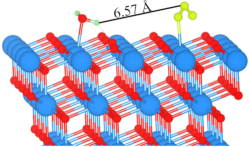
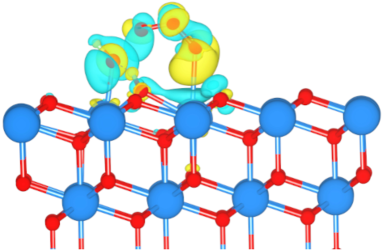
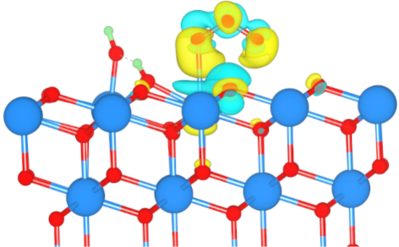
We also performed the analysis of H2O and O3 co-adsorption on {111} surface of CeO2. The adsorption energy of H2O for the same coverage is -0.57 eV. In the presence of H2O, the binding energies of ozone obtained using equation 3 are -0.36 eV, -0.36 eV, and -0.39 eV when kept at a distance of 2.80 Å, 3.29 Å, and 6.57 Å respectively from H2O (Figure 4LABEL:sub@fig:_Figure_4d-LABEL:sub@fig:_Figure_4f). There is a smaller change in the binding energies of ozone with its distance from H2O suggesting that there is a negligible interaction between H2O and O3. We performed the Bader charge analysis for the two cases: one in which O3 is at a distance of 2.80 Å and other at 6.57 Å from H2O. There is an electron transfer from surface to O3 molecule as per the Bader charge analysis (Table 4). Also, the charge density difference obtained using equation 4 reveals the electron accumulation along Ce-Oozone bond and depletion along the surface Ce atom. There is no charge re-distribution on the H2O irrespective of its distance from H2O molecule which further confirms the negligible interaction between H2O and O3 (Figure 5LABEL:sub@fig:_Figure_5c and LABEL:sub@fig:_Figure_5d).
The effect of H-OH on O3 adsorption energy is much more as compared to H2O. This can be attributed to the strong interaction of H-OH with the surface as compared to the surface-H2O interaction. As a result of which competitive adsorption between H-OH and O3 weakens its interaction with the surface and hence the adsorption energy of O3 becomes more positive in the presence of H-OH.
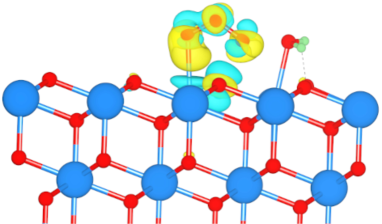
As per the adsorption energy, the H-OH is more favorable on reduced {111} surface as compared to H2O and so we consider the coadsorption of O3 and OH on reduced CeO2 surface. In this case we are considering the effect of isolated hydroxyl group on ozone adsorption. For simulation of reduced CeO2{111} surface we have considered conventional unit cells and removed one oxygen atom introducing an oxygen vacancy of concentration 0.0625. Also, the adsorption energy of O3 on {111} surface with vacancy concentration of 0.0625 in the absence of H2O is -2.85 eV. O3 prefers to occupy the oxygen deficient site in the absence of H2O. In case of co-adsorption, there is one oxygen deficient site which gets occupied by OH. Since there is no available oxygen deficient site, O3 binds to the surface Ce atom forming a Ce-O bond of length 2.45 Å (Figure 6LABEL:sub@fig:_Figure_6a). There is a hydrogen bond formation between OH and O3 of length 1.92 Å. The adsorption energy of O3 in the presence of OH is calculated using the following relation:
| (5) |
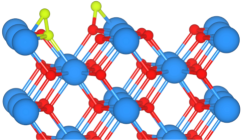
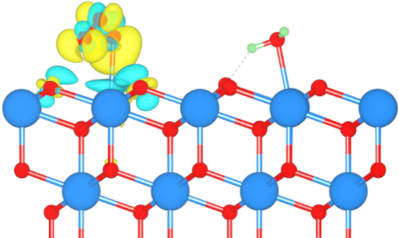
Where, E, is the energy of OH and O3 adsorbed on a slab, Eslab+OH is the energy of OH adsorbed on slab, and E is the energy of O3 in the isolated gaseous phase. The adsorption energy of O3 in the presence of OH is -1.58 eV i.e., its binding becomes less negative compared to its adsorption energy of -2.85 eV in the absence of H2O. The stable binding geometry and geometrical parameters obtained because of coadsorption of O3 and OH is shown in Figure 6LABEL:sub@fig:_Figure_6a and tabulated in Table 5. We increased the concentration of oxygen vacancies to 0.125 on the surface by removing two surface oxygen atoms. In this case the adsorption energy of ozone in the absence of OH is -2.98 eV. OH occupies the oxygen deficient site and O3 also has one deficient site for adsorption. O3 fills the vacancy site created as a result oxygen vacancy formation (see Figure 6LABEL:sub@fig:_Figure_6b), its binding energy is -2.69 eV obtained using equation 5. In this case also, we do notice that the presence of OH weakens the interaction between O3 and surface.
On the basis of above result we looked into the effects of hydroxylated surface on ozone adsorption. The adsorption energy of O3 is calculated using the following relation:
| (6) |
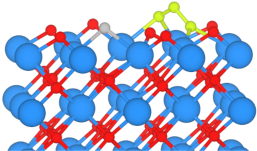
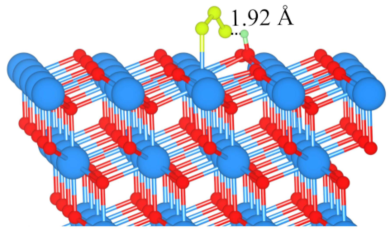
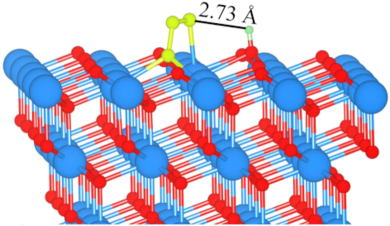
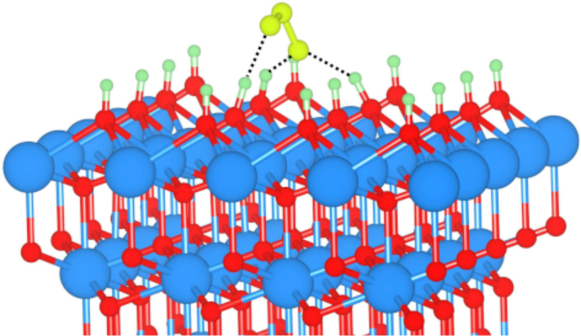
Where, E is the energy of O3 adsorbed on hydroxylated slab, Eslab+H is the energy of hydroxylated slab, and E is the energy of O3 in the isolated gaseous phase. On the hydroxylated surface, O3 stays at the top of surface forming three hydrogen bonds of lengths 1.92, 1.86, and 1.78 Å (shown in Figure 7). Our results suggest that O3 can not come closer to surface and forms chemical bond but the presence of hydrogen bonds are strengthening the interaction between surface and O3 leading to its adsorption energy of -1.74 eV. We find that the presence of OH interfers with the adsorption of ozone on reduced {111} surfaces by blocking the oxygen-deficient site which is considered to be the active site for ozone adsorption and decomposition.
4 Conclusions
This study explores the adsorption of H2O and O3 on various surfaces of CeO2 and investigates their stability and binding properties. The results show that the stoichiometric {110} and {100} surfaces exhibits stronger binding with O3 and weaker binding with H2O, whereas the stable {111} surface demonstrates slightly stronger binding with H2O compared to O3. On the other hand, the {111}, {110} and {100} surfaces show strong binding with O3, particularly in the presence of oxygen vacancies. The preferred adsorption site on the stoichiometric CeO2 surface is the Ce site, but on the reduced surface, the adsorbate either binds near an oxygen-deficient site or occupies it.
The presence of H-OH weakens the binding of O3, indicating water poisoning, and modifies its structure. O3 forms a longer Ce-O bond when bound to the surface Ce atom, indicating a weaker interaction and reduced electron transfer. The adsorption energy and geometrical parameters of O3 remain unchanged when placed farther away from H-OH. There is minimal interaction between H2O and O3, meaning the presence of H2O does not affect ozone adsorption.
The presence of OH reduces the negative adsorption energy of O3, especially when oxygen vacancies are increased, leading to weaker ozone interaction. A fully hydroxylated surface prevents O3 from forming chemical bonds with surface atoms, but hydrogen bonding between O3 and hydrogen atoms provides stability.
In conclusion, this research highlights the importance of moisture control to prevent water poisoning and optimize the performance of CeO2-based catalysts in industrial applications aimed at reducing ground-level ozone pollution. Heat treatment can be employed to reduce vacancy concentration, increase available adsorption sites for O3, and minimize competitive adsorption by H2O.
Acknowledgments
This work was supported financially by the Fundamental Research Program (PNK9400) of the Korea Institute of Materials Science (KIMS). The authors also acknowledge the support by the Korea Institute of Science and Technology, GKP (Global Knowledge Platform, Grant number 2V6760) project of the Ministry of Science, ICT and Future Planning.
References
- Vatankhah et al. 2019 Vatankhah, H.; Szczuka, A.; Mitch, W. A.; Almaraz, N.; Brannum, J.; Bellona, C. Evaluation of Enhanced Ozone–Biologically Active Filtration Treatment for the Removal of 1,4-Dioxane and Disinfection Byproduct Precursors from Wastewater Effluent. Environ. Sci. Technol. 2019, 53, 2720
- Camel and Bermond 1998 Camel, V.; Bermond, A. The use of ozone and associated oxidation processes in drinking water treatment. Water Research 1998, 32, 3208
- Kim et al. 2019 Kim, J.; Choe, Y. J.; Kim, S. H.; Lee, S.-C.; Bhattacharjee, S. Grasping periodic trend and rate-determining step for S-modified metals of metal sulfides deployable to produce OH via H2O2 cleavage. Applied Catalysis B: Environmental 2019, 253, 60–68
- Pak et al. 2016 Pak, G.; Salcedo, D. E.; Lee, H.; Oh, J.; Maeng, S. K.; Song, K. G.; Hong, S. W.; Kim, H.-C.; Chandran, K.; Kim, S. Comparison of Antibiotic Resistance Removal Efficiencies Using Ozone Disinfection under Different pH and Suspended Solids and Humic Substance Concentrations. Environ. Sci. Technol. 2016, 50, 7590
- Felzer et al. 2007 Felzer, B. S.; Cronin, T.; Reilly, J. M.; Melillo, J. M.; Wang, X. Impacts of ozone on trees and crops. Comptes Rendus Geoscience 2007, 339, 784
- J. Weschler 2000 J. Weschler, C. Indoor Air 2000, 10, 269
- Sillman 1999 Sillman, S. The relation between ozone, NOx and hydrocarbons in urban and polluted rural environments. Atmospheric Environment 1999, 33, 1821–1845
- R. Solomon 2008 R. Solomon, K. Effects of ozone depletion and UV‐B radiation on humans and the environment. Atmosphere-Ocean 2008, 46, 185
- J. Hubbell et al. 2005 J. Hubbell, B.; Hallberg, A.; R. McCubbin, D.; Post, E. Health-Related Benefits of Attaining the 8-Hr Ozone Standard. Environmental Health Perspectives 2005, 113, 73
- Turner et al. 2016 Turner, M. C.; Jerrett, M.; Pope, C. A.; Krewski, D.; Gapstur, S. M.; Diver, W. R.; Beckerman, B. S.; Marshall, J. D.; Su, J.; Crouse, D. L.; Burnett, R. T. Long-Term Ozone Exposure and Mortality in a Large Prospective Study. American Journal of Respiratory and Critical Care Medicine 2016, 193, 1134
- Li et al. 1998 Li, W.; Gibbs, G. V.; Oyama, S. T. Mechanism of Ozone Decomposition on a Manganese Oxide Catalyst. 1. In Situ Raman Spectroscopy and Ab Initio Molecular Orbital Calculations. J. Am. Chem. Soc. 1998, 120, 9041
- Mathew et al. 2011 Mathew, T.; Suzuki, K.; Ikuta, Y.; Nagai, Y.; Takahashi, N.; Shinjoh, H. Mesoporous Ferrihydrite-Based Iron Oxide Nanoparticles as Highly Promising Materials for Ozone Removal. Angewandte Chemie International Edition 2011, 50, 7381
- Gong et al. 2017 Gong, S.; Li, W.; Xie, Z.; Ma, X.; Liu, H.; Han, N.; Chen, Y. Low temperature decomposition of ozone by facilely synthesized cuprous oxide catalyst. New J. Chem. 2017, 41, 4828–4834
- Dong et al. 2022 Dong, C.; Yang, J.-J.; Xie, L.-H.; Cui, G.; Fang, W.-H.; Li, J.-R. Catalytic ozone decomposition and adsorptive VOCs removal in bimetallic metal-organic frameworks. Nature Communications 2022, 13, 4991
- Dhandapani and Oyama 1997 Dhandapani, B.; Oyama, S. Gas phase ozone decomposition catalysts. Applied Catalysis B: Environmental 1997, 11, 129
- Chen et al. 2011 Chen, H.; Stanier, C. O.; Young, C. A.; Grassian, V. H. A Kinetic Study of Ozone Decomposition on Illuminated Oxide Surfaces. J. Phys. Chem. A 2011, 115, 11979
- Roscoe and Abbatt 2005 Roscoe, J. M.; Abbatt, J. P. D. Diffuse Reflectance FTIR Study of the Interaction of Alumina Surfaces with Ozone and Water Vapor. J. Phys. Chem. A 2005, 109, 9028
- Noei et al. 2008 Noei, H.; Qiu, H.; Wang, Y.; Löffler, E.; Wöll, C.; Muhler, M. The identification of hydroxyl groups on ZnO nanoparticles by infrared spectroscopy. Phys. Chem. Chem. Phys. 2008, 10, 7092
- Nanayakkara et al. 2014 Nanayakkara, C. E.; Larish, W. A.; Grassian, V. H. Titanium Dioxide Nanoparticle Surface Reactivity with Atmospheric Gases, CO2, SO2, and NO2: Roles of Surface Hydroxyl Groups and Adsorbed Water in the Formation and Stability of Adsorbed Products. J. Phys. Chem. C 2014, 118, 23011
- Zhang et al. 2008 Zhang, T.; Li, C.; Ma, J.; Tian, H.; Qiang, Z. Surface hydroxyl groups of synthetic α-FeOOH in promoting OH generation from aqueous ozone: Property and activity relationship. Applied Catalysis B: Environmental 2008, 82, 131
- Zhao et al. 2009 Zhao, L.; Sun, Z.; Ma, J. Novel Relationship between Hydroxyl Radical Initiation and Surface Group of Ceramic Honeycomb Supported Metals for the Catalytic Ozonation of Nitrobenzene in Aqueous Solution. Environ. Sci. Technol. 2009, 43, 4157
- Wang et al. 2014 Wang, M.; Zhang, P.; Li, J.; Jiang, C. The effects of Mn loading on the structure and ozone decomposition activity of MnOx supported on activated carbon. Chinese Journal of Catalysis 2014, 35, 335
- Liu et al. 2019 Liu, Y.; Zhang, P.; Zhan, J.; Liu, L. Heat treatment of MnCO3: An easy way to obtain efficient and stable MnO2 for humid O3 decomposition. Applied Surface Science 2019, 463, 374–385
- Yan et al. 2019 Yan, L.; Bing, J.; Wu, H. The behavior of ozone on different iron oxides surface sites in water. Scientific Reports 2019, 9, 14752
- Kresse and Hafner 1994 Kresse, G.; Hafner, J. Ab initio molecular-dynamics simulation of the liquid-metal–amorphous-semiconductor transition in germanium. Phys. Rev. B 1994, 49, 14251
- Perdew et al. 1996 Perdew, J. P.; Burke, K.; Ernzerhof, M. Generalized Gradient Approximation Made Simple. Phys. Rev. Lett. 1996, 77, 3865
- Blöchl 1994 Blöchl, P. E. Projector augmented-wave method. Phys. Rev. B 1994, 50, 17953
- Nolan et al. 2005 Nolan, M.; Parker, S. C.; Watson, G. W. The electronic structure of oxygen vacancy defects at the low index surfaces of ceria. Surface Science 2005, 595, 223
- Nolan et al. 2005 Nolan, M.; Grigoleit, S.; Sayle, D. C.; Parker, S. C.; Watson, G. W. Density functional theory studies of the structure and electronic structure of pure and defective low index surfaces of ceria. Surface Science 2005, 576, 217
- Zhou et al. 2019 Zhou, C.-Y.; Wang, D.; Gong, X.-Q. A DFT+U revisit of reconstructed CeO2(100) surfaces: structures, thermostabilities and reactivities. Phys. Chem. Chem. Phys. 2019, 21, 19987
- Molinari et al. 2012 Molinari, M.; Parker, S. C.; Sayle, D. C.; Islam, M. S. Water Adsorption and Its Effect on the Stability of Low Index Stoichiometric and Reduced Surfaces of Ceria. J. Phys. Chem. C 2012, 116, 7073
- Sims and Blumenthal 1976 Sims, J. R.; Blumenthal, R. N. High Temp. Sci. 1976, 8, 99
- Loschen et al. 2007 Loschen, C.; Carrasco, J.; Neyman, K. M.; Illas, F. First-principles and study of cerium oxides: Dependence on the effective U parameter. Phys. Rev. B 2007, 75, 035115
- Shi et al. 2016 Shi, L.; Vathonne, E.; Oison, V.; Freyss, M.; Hayn, R. First-principles DFT+ investigation of charged states of defects and fission gas atoms in . Phys. Rev. B 2016, 94, 115132
- Skorodumova et al. 2004 Skorodumova, N. V.; Baudin, M.; Hermansson, K. Surface properties of from first principles. Phys. Rev. B 2004, 69, 075401
- Tasker 1979 Tasker, P. W. The stability of ionic crystal surfaces. Journal of Physics C: Solid State Physics 1979, 12, 4977
- Sayle et al. 1994 Sayle, T. X. T.; Parker, S. C.; Catlow, C. R. A. Surface Segregation of Metal Ions in Cerium Dioxide. J. Phys. Chem. 1994, 98, 13625
- Balducci et al. 1998 Balducci, G.; Kašpar, J.; Fornasiero, P.; Graziani, M.; Islam, M. S. Surface and Reduction Energetics of the CeO2-ZrO2 Catalysts. J. Phys. Chem. B 1998, 102, 557
- Fronzi et al. 2009 Fronzi, M.; Piccinin, S.; Delley, B.; Traversa, E.; Stampfl, C. Water adsorption on the stoichiometric and reduced CeO2(111) surface: a first-principles investigation. Phys. Chem. Chem. Phys. 2009, 11, 9188–9199
- Watkins et al. 2007 Watkins, M. B.; Foster, A. S.; Shluger, A. L. Hydrogen Cycle on CeO2 (111) Surfaces: Density Functional Theory Calculations. J. Phys. Chem. C 2007, 111, 15337
5 Tables and Graphics
| Parameters | Free O3 | CeO2{111} | CeO2{110} | CeO2{100} |
|---|---|---|---|---|
| (eV) | - | -0.40 | -0.91 | -1.04 |
| Q(O3)() | 0 | -0.25 | -0.48 | -0.72 |
| Oozone-Oozone (in Å) | 1.28, 1.28 | 1.32, 1.29 | 1.33, 1.33 | 1.36, 1.36 |
| O3 bond angle (∘) | 118.2 | 116.4 | 118.4 | 113.9 |
| Ce-Oozone (Å) | - | 2.66 | 2.60 | 2.61-2.63 |
| Parameters | Free O3 | CeO2{111} | CeO2{110} | CeO2{100} |
|---|---|---|---|---|
| (eV) | - | -3.24 | -2.65 | -2.71 |
| Oozone-Oozone (Å) | 1.28, 1.28 | 1.54, 1.39 | 1.56, 1.39 | 1.44, 1.46 |
| O3 bond angle (∘) | 118.2 | 109.0 | 110 | 110.2 |
| Ce-Oozone (Å) | - | 2.29-2.51 | 2.33-2.77 | 2.40-2.54 |
| Parameters | H-OH | |
|---|---|---|
| d = 2.54 Å | d = 6.34 Å | |
| (eV) | -0.26 | -0.38 |
| Q(O3)() | -0.20 | -0.25 |
| Q(H-OH)() | 0.097 | 0.01 |
| Oozone-Oozone (Å) | 1.33, 1.28 | 1.32, 1.29 |
| O3 bond angle (∘) | 118.16 | 116.5 |
| Ce-Oozone (Å) | 2.75 | 2.66 |
| Parameters | H2O | |
|---|---|---|
| d = 2.80 Å | d = 6.57 Å | |
| (eV) | -0.36 | -0.39 |
| Q(O3)() | -0.25 | -0.26 |
| Q(H2O)() | 0.01 | 0.001 |
| Oozone-Oozone (Å) | 1.32, 1.29 | 1.32, 1.29 |
| O3 bond angle (∘) | 115.4 | 116.40 |
| Ce-Oozone (Å) | 2.70 | 2.66 |
| Parameters | x=0.0625 | x=0.125 |
|---|---|---|
| (eV) | -0.58 | -2.69 |
| Oozone-Oozone (Å) | 1.36, 1.36 | 1.47, 1.32 |
| O3 bond angle (∘) | 114.24 | 111.4 |
| Ce-Oozone (Å) | 2.45 | 2.58-2.83 |