First detection of polarization in X-rays for PSR B0540–69 and its nebula
Abstract
We report on X-ray polarization measurements of the extra-galactic Crab-like PSR B0540-69 and its Pulsar Wind Nebula (PWN) in the Large Magellanic Cloud (LMC), using a 850 ks Imaging X-ray Polarimetry Explorer (IXPE) exposure. The PWN is unresolved by IXPE. No statistically significant polarization is detected for the image-averaged data, giving a 99% confidence polarization upper limit (MDP99) of 5.3% in 2–8 keV energy range. However, a phase-resolved analysis detects polarization for both the nebula and pulsar in the 4–6 keV energy range. For the PWN defined as the off-pulse phases, the polarization degree (PD) of and polarization angle (PA) of is detected at 4.6 significance level, consistent with the PA observed in the optical band. In a single on-pulse window, a hint of polarization is measured at 3.8 with polarization degree of and polarization angle of . A ‘simultaneous’ PSR/PWN analysis finds two bins at the edges of the pulse exceeding 3 PD significance, with PD of and ; intervening bins at 2–3 significance have lower PD, hinting at additional polarization structure.
1 Introduction
PSR B0540-69 (also known as PSR J0540-6919) is a young Crab-like pulsar located inside the supernova remnant SNR B0540-69.3 in the Large Magellanic Cloud (LMC) satellite galaxy of the Milky Way at a distance of 50 kpc. It was discovered in the early 1980s by the Einstein X-ray Observatory (Seward et al., 1984). It is the first extragalactic pulsar observed to emit giant radio pulses (Johnston & Romani, 2003) and the first gamma-ray pulsar detected in another galaxy (Fermi LAT Collaboration et al., 2015).
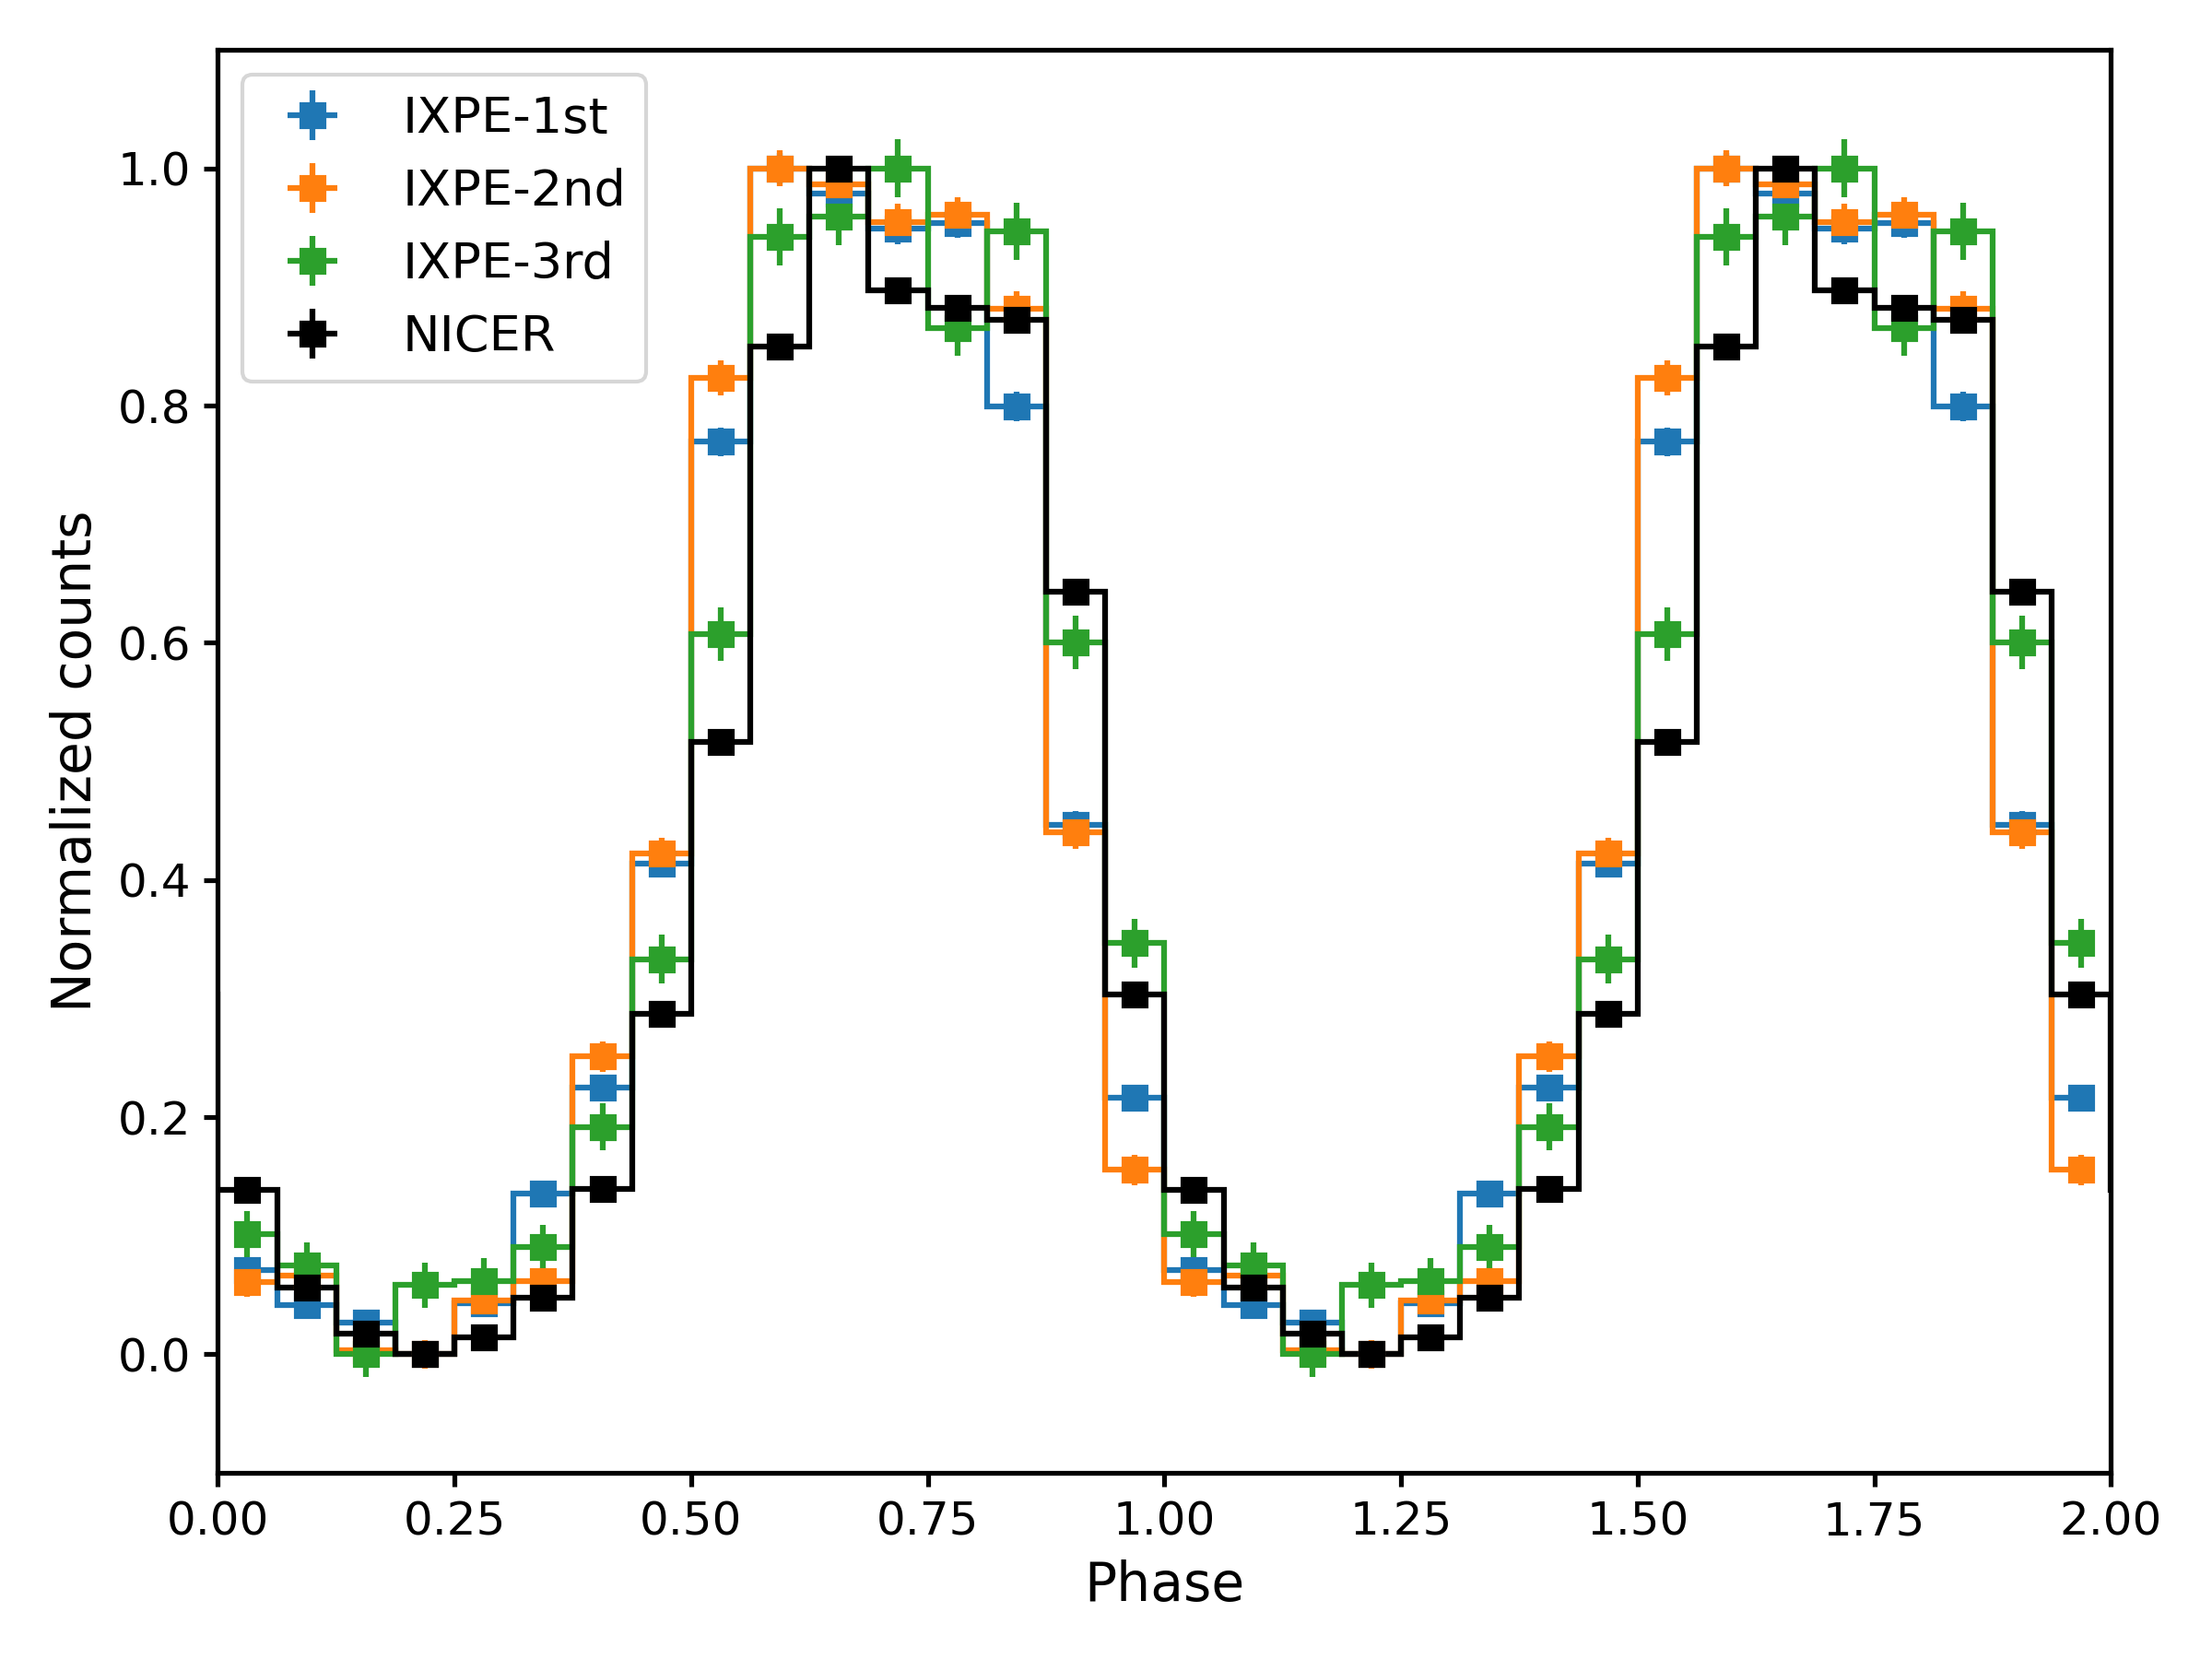
PSR B0540-69 has a short rotation period of 50 ms, a characteristic age of 1500 yr, and a rotational energy loss of 1038 erg s-1. The X-ray pulse profile is double-peaked and asymmetric, with a component separation of 0.2 in phase (de Plaa et al., 2003), consistent with that in the optical band. Like the Crab, PSR B0540-69 is also embedded in a bright pulsar wind nebula (PWN) visible at wavelengths from the radio to the X-rays. The optical nebula has a half-power diameter of 4′′ (Chanan et al., 1984), and the X-ray nebula has an angular diameter of (Kaaret et al., 2001). The PWN morphology resembles the Crab, having a torus and jets (Gotthelf & Wang, 2000), and is extended along a northeast-southwest axis. The overall X-ray spectrum of PSR B0540-69 and its nebula is well characterized by a power law with a photon index of (Kaaret et al., 2001), as expected if the emission is predominately non-thermal. The pulsar has an index of , harder than that of the nebula only (Kaaret et al., 2001).
Limited polarization results have been reported for PSR B0540-69 and its nebula. For the pulsar, we have only optical polarization values. Mignani et al. (2010) report a pulsar phase-averaged polarization PD= with an orientation of PA=, consistent with the semi-major axis of the PWN. While Lundqvist et al. (2011) report that the pulsar itself had a lower polarization of , and the difference of the pulsar PD values could originate from nebular contamination. The source is faint enough that phase-resolved optical polarimetry has not been obtained. For the nebula, Chanan & Helfand (1990) report the linear polarization in the optical (V band) integrated over the nebula (within ) of PD=, oriented at an angle of east of north. In the radio band, Dickel et al. (2002) reported a PD of 20% at 3.5 cm, 8% at 6 cm, and 4.5% at 20 cm with position angle of about 80∘, consistent with the Chanan & Helfand (1990) optical PA.
PSR B0540-69 is the fourth PWN observed by IXPE, after the Crab (Bucciantini et al., 2023), Vela (Xie et al., 2022), and MSH 15-52 (Romani et al., 2023a) and it is the first extra-galactic example. With the PWN unresolved by the 30′′ half-power diameter (HPD) IXPE resolution (Weisskopf et al., 2022), careful phase-resolved analysis is important for PSR B0540-69. Here, we report on the first measurements of X-ray polarization from PSR B0540-69, with significant detections for both PSR and PWN.
2 X-ray observations and data reduction
2.1 IXPE data
The Imaging X-ray Polarimetry Explorer (IXPE) is a NASA mission in partnership with the Italian Space Agency launched on 2021 December 9 (Weisskopf et al., 2022). The spacecraft hosts three identical grazing incidence telescopes, providing imaging, timing, and spectral polarimetry in the 2–8 keV nominal energy band. Each telescope has a polarization-sensitive detector unit (DU) equipped with a gas-pixel detector (GPD) (Costa et al., 2001; Soffitta et al., 2021) placed in the focal plane of an X-ray mirror assembly module (MMA). PSR B0540-69 has been observed by IXPE in three different periods: (1) December 29 2022 to January 5 2023, (2) January 21–27 2023, and (3) May 10–12 2023, for a total exposure of 850 ks. PSR B0540-69 observations were released into two data sets at the HEASARC, with the first two observations integrated into OBSID 02001299 and the observation in May as OBSID 02008801.
Data were extracted and analyzed with the IXPE-dedicated software ixpeobssim (Baldini et al., 2022) (v.30.3.0) and HEASOFT 6.31.1 using the Calibration database released on November 17, 2022. Data cuts were used to reduce background events, following the procedure reported in Di Marco et al. (2023), and we filtered the good time intervals (GTI) to reduce particle events due to solar activity. This removed 2–3% of the events in each of the three DUs. For faint sources, such as PSR B0540-69, the remaining background is still a substantial fraction of the source flux, especially at high energy, and must still be subtracted in the analysis (Di Marco et al., 2023), as detailed below.
2.2 NICER data
In December 2022, IXPE experienced a timing anomaly. This affected only the first observation of PSR B0540-69; timing was restored to normal after a restart. To help define a high accuracy ephemeris for phase-resolved analysis, we also have simultaneous Neutron star Interior Composition Explorer (NICER) observations. Observations using NICER were made between January 19, 2023 at 20:46:20 and May 3, 2023 at 19:35:50. These observations spanned the 2023 IXPE observation interval. To enhance the precision of the ephemeris, we included long-term NICER data observed back to April 2019. For our NICER analysis, we utilized Level 2 data retrieved from the HEASARC data archive. The total exposure time for the cleaned event file from 7 MPU detectors amounted to 27.5 ks.
3 Timing analysis of PSR B0540-69
Timing analysis of PSR B0540-69 was performed including NICER data, relying on NICER’s exceptional timing accuracy and good coverage during 2023. Barycentric corrections for both the IXPE and NICER events were made using the barycorr tool in HEASoft v6.31.1. The JPL-DE430 solar-system ephemeris was utilized, with the position of the source set at and (J2000) according to SIMBAD Astronomical Database 111https://simbad.u-strasbg.fr/simbad/. To identify the pulsar signal, we employed the statistic search implemented in Stingray (Huppenkothen et al., 2019). For each individual observation, we selected the period that produced the most significant folded pulse profile. To obtain a timing solution for PSR B0540-69’s 2023 observations, we employed a phase-coherent timing analysis. The time of arrivals (ToAs) for the observed pulse profiles were determined by measuring the peak phase in the folded profile. This was accomplished by cross-correlating each profile with the standard profile obtained during NICER’s long-term monitoring of PSR B0540-69. The same procedures were applied to the IXPE data. To obtain the timing solution, we used the TEMPO2 software (Hobbs et al., 2006), fitting both the NICER and IXPE TOAs.
To compensate for the 2022 IXPE timing anomaly, we incorporated a time delay parameter (referred to as ‘JUMP’ in TEMPO2) as a freely fitted TOA offset for the first IXPE observation. The results of the best fit are presented in Table 1 as Ephemeris 1. In addition to the timing anomaly jump, we see time delays of a few milliseconds compared to NICER in the second and third IXPE observations. These were modeled with additional ‘JUMP’ parameters, resulting in the timing solution shown in Table 1 as Ephemeris 2.
We used Ephemeris 2 in our phase-resolved data analysis. The resulting combined NICER profile and profiles from the three IXPE observations are shown in Fig. 1.
| Parameters | Ephemeris 1 | Ephemeris 2 |
|---|---|---|
| PEPOCH (MJD) | 58920 (fixed) | 58920 (fixed) |
| 19.660547(3) | 19.660545(3) | |
| -2.5287(6) | -2.5281(6) | |
| 7.1(7) | 6.5(6) | |
| JUMP1 (s)222the three JUMP parameters are the time delay of three IXPE observations relative to NICER | -0.029(1) | -0.0283(8) |
| JUMP2 (s) | - | 0.0027(3) |
| JUMP3 (s) | - | 0.0024(8) |
4 Polarimetric analysis
4.1 Phase-averaged analysis
As noted, the angular extent of the PSR B0540-69 X-ray nebula is much smaller than the 30′′ IXPE resolution. The surrounding X-ray SNR extends to 60′′, but is fainter and softer and contributes only weakly to the IXPE flux. We therefore start by analyzing the polarized properties of the integrated PSR B0540-69 complex.
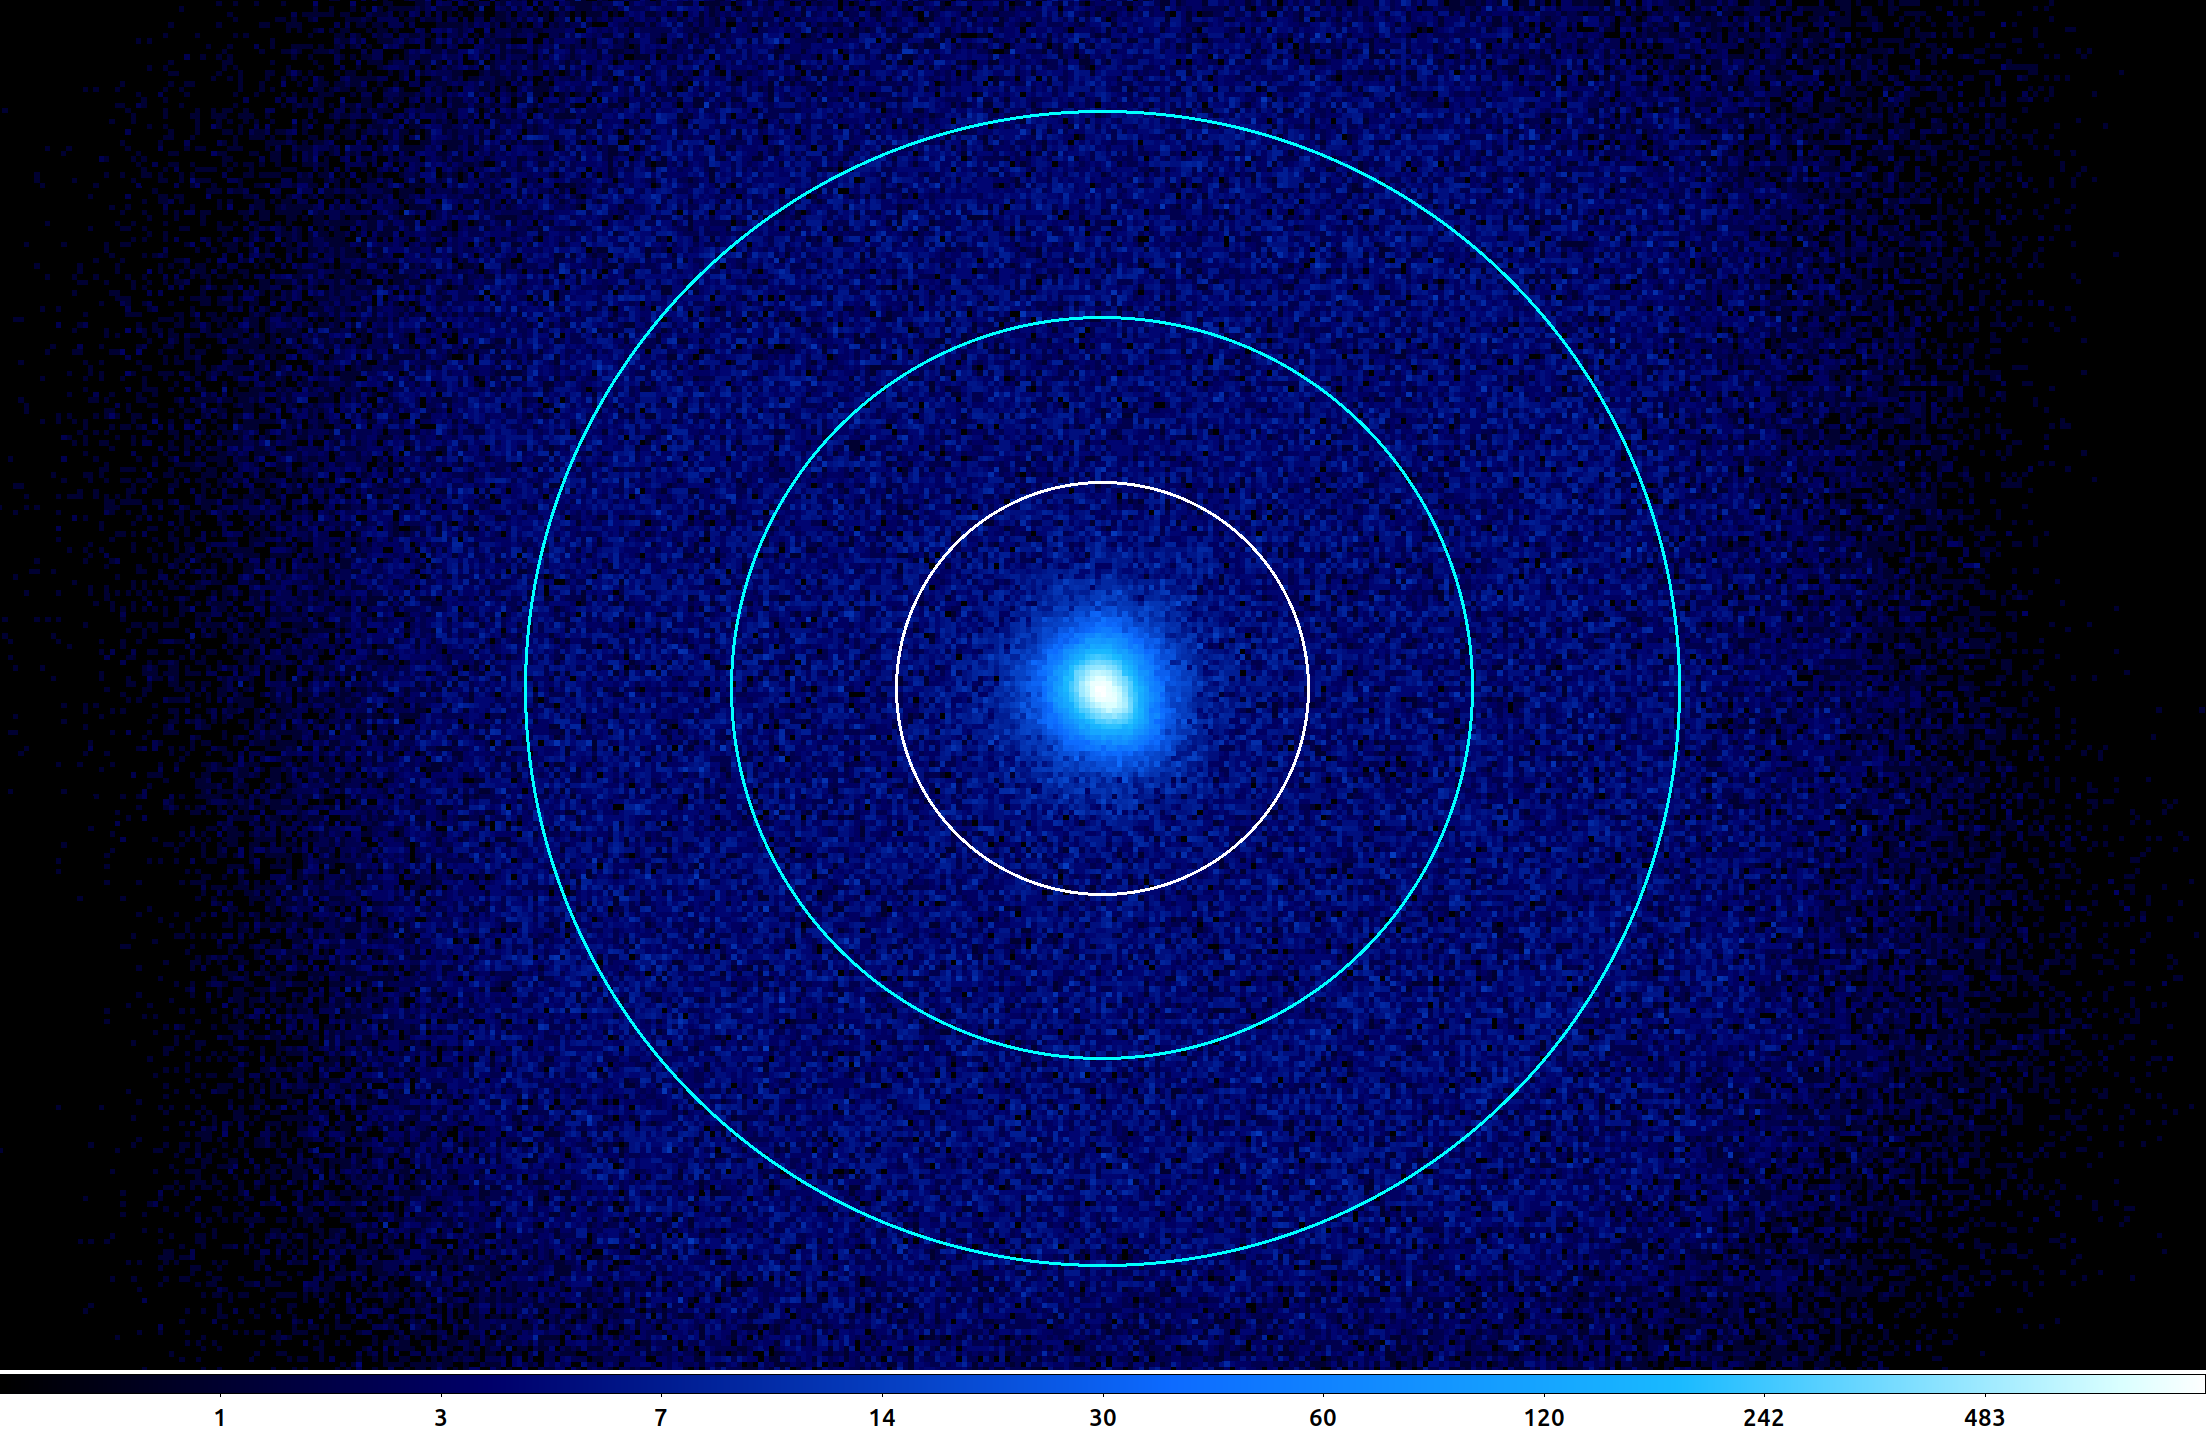
The source photons were extracted from a circular region with a radius of 100′′, and the background photons from an annular region with inner and outer radii of 180′′ and 280′′ respectively, both centered on the pulsar, as shown in Fig. 2. The background region was chosen to avoid the edge of the instrument field of view (see Di Marco et al., 2023). This analysis is performed both with the model-independent PCUBE algorithm in ixpeobssim software (Baldini et al., 2022) and with xspec (v.12.13.0c) spectro-polarimetric forward fitting (Arnaud, 1996). No significant polarization is detected in the full 2–8 keV IXPE band. With the PCUBE analysis, we have the normalized Stokes parameters and combining the three DUs, giving an upper limit of 5.3% for MDP99.
Spectro-polarimetric analysis is performed using xspec to jointly fit the three DUs in a two-step procedure. In the first step, the energy distribution is fitted with a spectral model. In the second step, the spectral model is fixed, while and are fitted. This method thus does a joint forward folded fit of the Stokes fluxes to the binned , , spectra with the fixed spectral model. We applied a constant energy binning of 200 eV for the , , and data.
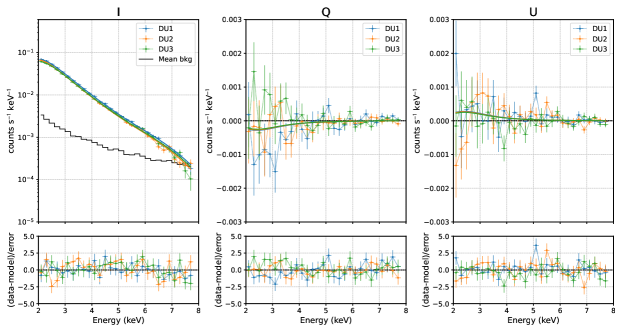
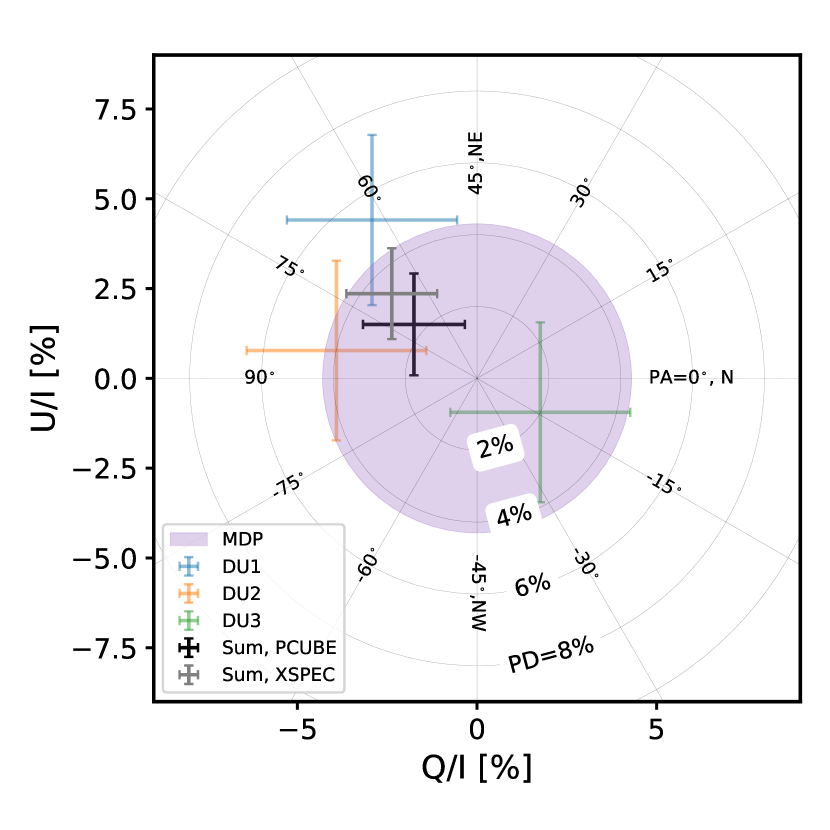
The PSR B0540-69 PWN binned spectra from the three DUs were fitted with the model const*tbabs*powerlaw, where const accounts for uncertainties in the absolute effective area of the three DUs, and tbabs takes into account the interstellar absorption. Here, we fixed the column density to cm-2 as measured by Chandra (Kaaret et al., 2001). The best-fit spectra and models for the three DUs are shown in the left panel of Fig. 3; best-fit values are reported in Table 2. These spectral fit values are in agreement with those of Kaaret et al. (2001). Fixing spectral parameters from and fitting with polconst of xspec provides the 2–8 keV and spectra (Fig. 3, right panels). These 2–8 keV band-averaged, aperture-averaged (100′′ radius) polarization degree and angle measurements are summarized in Fig. 4. The results are consistent between the three DUs and the two different analysis methods.
| constant*TBabs*powerlaw | ||
| Model | Parameter | Value |
| TBabs | NH [1022 cm-2] | 0.46 (frozen) |
| powerlaw | 2.081 | |
| norm [photon keV-1 cm-2 s-1] | 0.01594 | |
| Cross normalization factors | ||
| 1.0 (frozen) | ||
| 0.953 | ||
| 0.871 | ||
| /dof = 449.5/439 = 1.06 | ||
| polconst *constant*TBabs*powerlaw | ||
| polconst | pd [] | 3.3 |
| pa [∘] | 68 | |
| /dof = 248.6/259 = 0.96 | ||
4.2 Phase-resolved analysis
4.2.1 Off-pulse
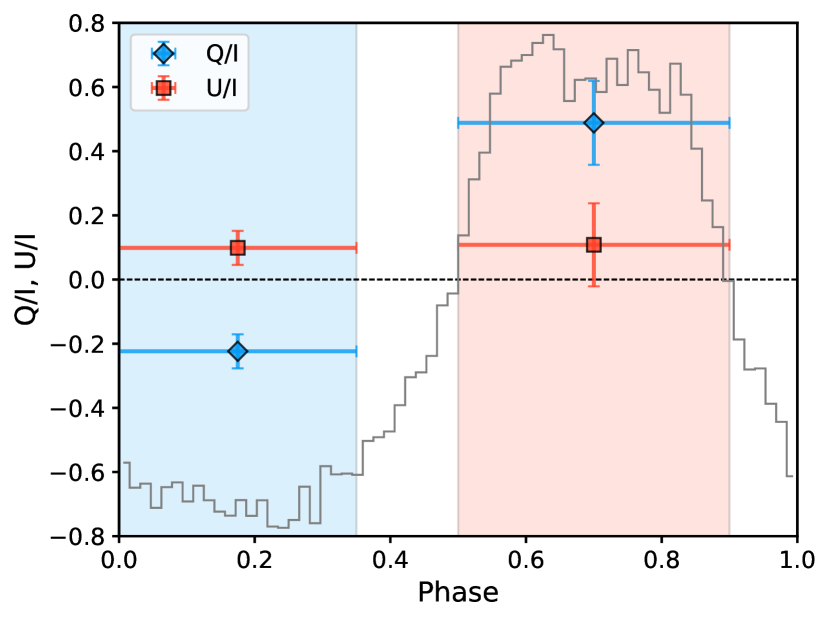
We can use phase-resolved analysis to decompose the PWN X-ray emission from that of the pulsar. For this analysis, the source and background regions are the same as for the phase-averaged treatment. We define the phase range =0–0.35 as the off-pulse (Fig. 5). From prior IXPE Crab analysis, we have seen that the wide PSF wings place some photons in the background aperture. Therefore we take the nebula background from the same 0–0.35 phase window to minimize pulsar contamination. We do not detect a significant off-pulse (PWN) polarization in the full 2–8 keV IXPE range, with , , and a PD below the MDP99 of 7.6%.
Then we performed an energy-dependent analysis by dividing the data into three energy ranges: 2–4 keV, 4–6 keV, and 6–8 keV. Results of the normalized Stokes parameters and are listed in Table 3. In the 4–6 keV range, the polarization degree at PA = is detected at 4.6 significance. The angle is consistent with the optical PA (Chanan & Helfand, 1990).
| 2–4 keV | 4–6 keV | 6–8 keV | 2–8 keV | |
| off-pulse | ||||
| Q/I | -0.032 0.028 | -0.224 0.053 | 0.191 0.163 | -0.049 0.025 |
| U/I | 0.015 0.028 | 0.099 0.053 | -0.245 0.163 | 0.020 0.025 |
| on-pulse | ||||
| Q/I | 0.018 0.072 | 0.488 0.131 | -0.157 0.329 | 0.112 0.076 |
| U/I | 0.076 0.072 | 0.108 0.129 | 0.707 0.338 | 0.148 0.076 |
4.2.2 On-pulse
In a first analysis of the pulse phase polarization, we collected photons from phase range =0.5–0.9 in a simple 60′′ aperture. For background, including nebula emission, we used photons from phase 0–0.35 (Fig 5). While no polarization is detected in the full 2–8 keV range, we do find a 3.8 detection in the 4–6 keV band, with results of the normalized Stokes parameters listed in Table 3. In the 4–6 keV band, the and before background subtraction are 0.070 0.037 and 0.074 0.037, and after background subtraction they are 0.488 0.131 and 0.108 0.129, resulting in a PD = and PA = . Since the PWN is softer than the PSR and since residual particle background increasingly dominates at high energy, detection in an intermediate energy band is not unexpected.
Pulsar radio polarization often follows a rotating vector model (RVM) sweep, which could reduce the average PD in the broad on-pulse window. We attempted an RVM fit, but this did not significantly enhance the PD signal.
As a second analysis, we employed “simultaneous” fitting as described in Wong et al. (2023). This method uses external, Chandra-derived models for the spatial and spectral flux of the PWN and the phase-dependent PSR emission to assign weights to the PWN and PSR components in each of the several spatial and phase data bins. In this case, the 4–6 keV data were binned into ten 0.1-width phase windows and a 99 grid of 10′′ pixels centered on the pulsar. The spatial binning helps separate the PSF-like PSR emission from the slightly broadened distribution from the PWN component. A simultaneous fit extracts the PWN and PSR contributions.
To generate the energy-resolved nebula model, we passed an archival Chandra ACIS observation (ObsID 119) through ixpeobssim v30.1 to account for the IXPE instrument response. Since we will add in a PSF-broadened phase-resolved pulsar component, we avoid double counting by removing the PSR point source from the image, excising a ′′ region around the pulsar and replacing it with a sample of events from two regions, each ′′ on either side of the excised region, using the average count rate.
The PSR B0540-69 light curve model was constructed from IXPE itself, by taking 2–8 keV photons within a 100′′ radius aperture, subtracting a background estimated from the 0.1–0.3 phase window, and binning into 50 equal-spaced phase bins. These counts were converted to specific flux () using the pulsed photon index measured by Kaaret et al. (2001) , assumed to be constant with phase. This power-law flux model along with the ephemeris described above was passed through ixpeobssim to build the phase-resolved pulsar count model. A modest scaling was applied to both PSR and PWN components to match the total observed IXPE flux. We then made a least-squares fit to obtain the best-fit polarization parameters.
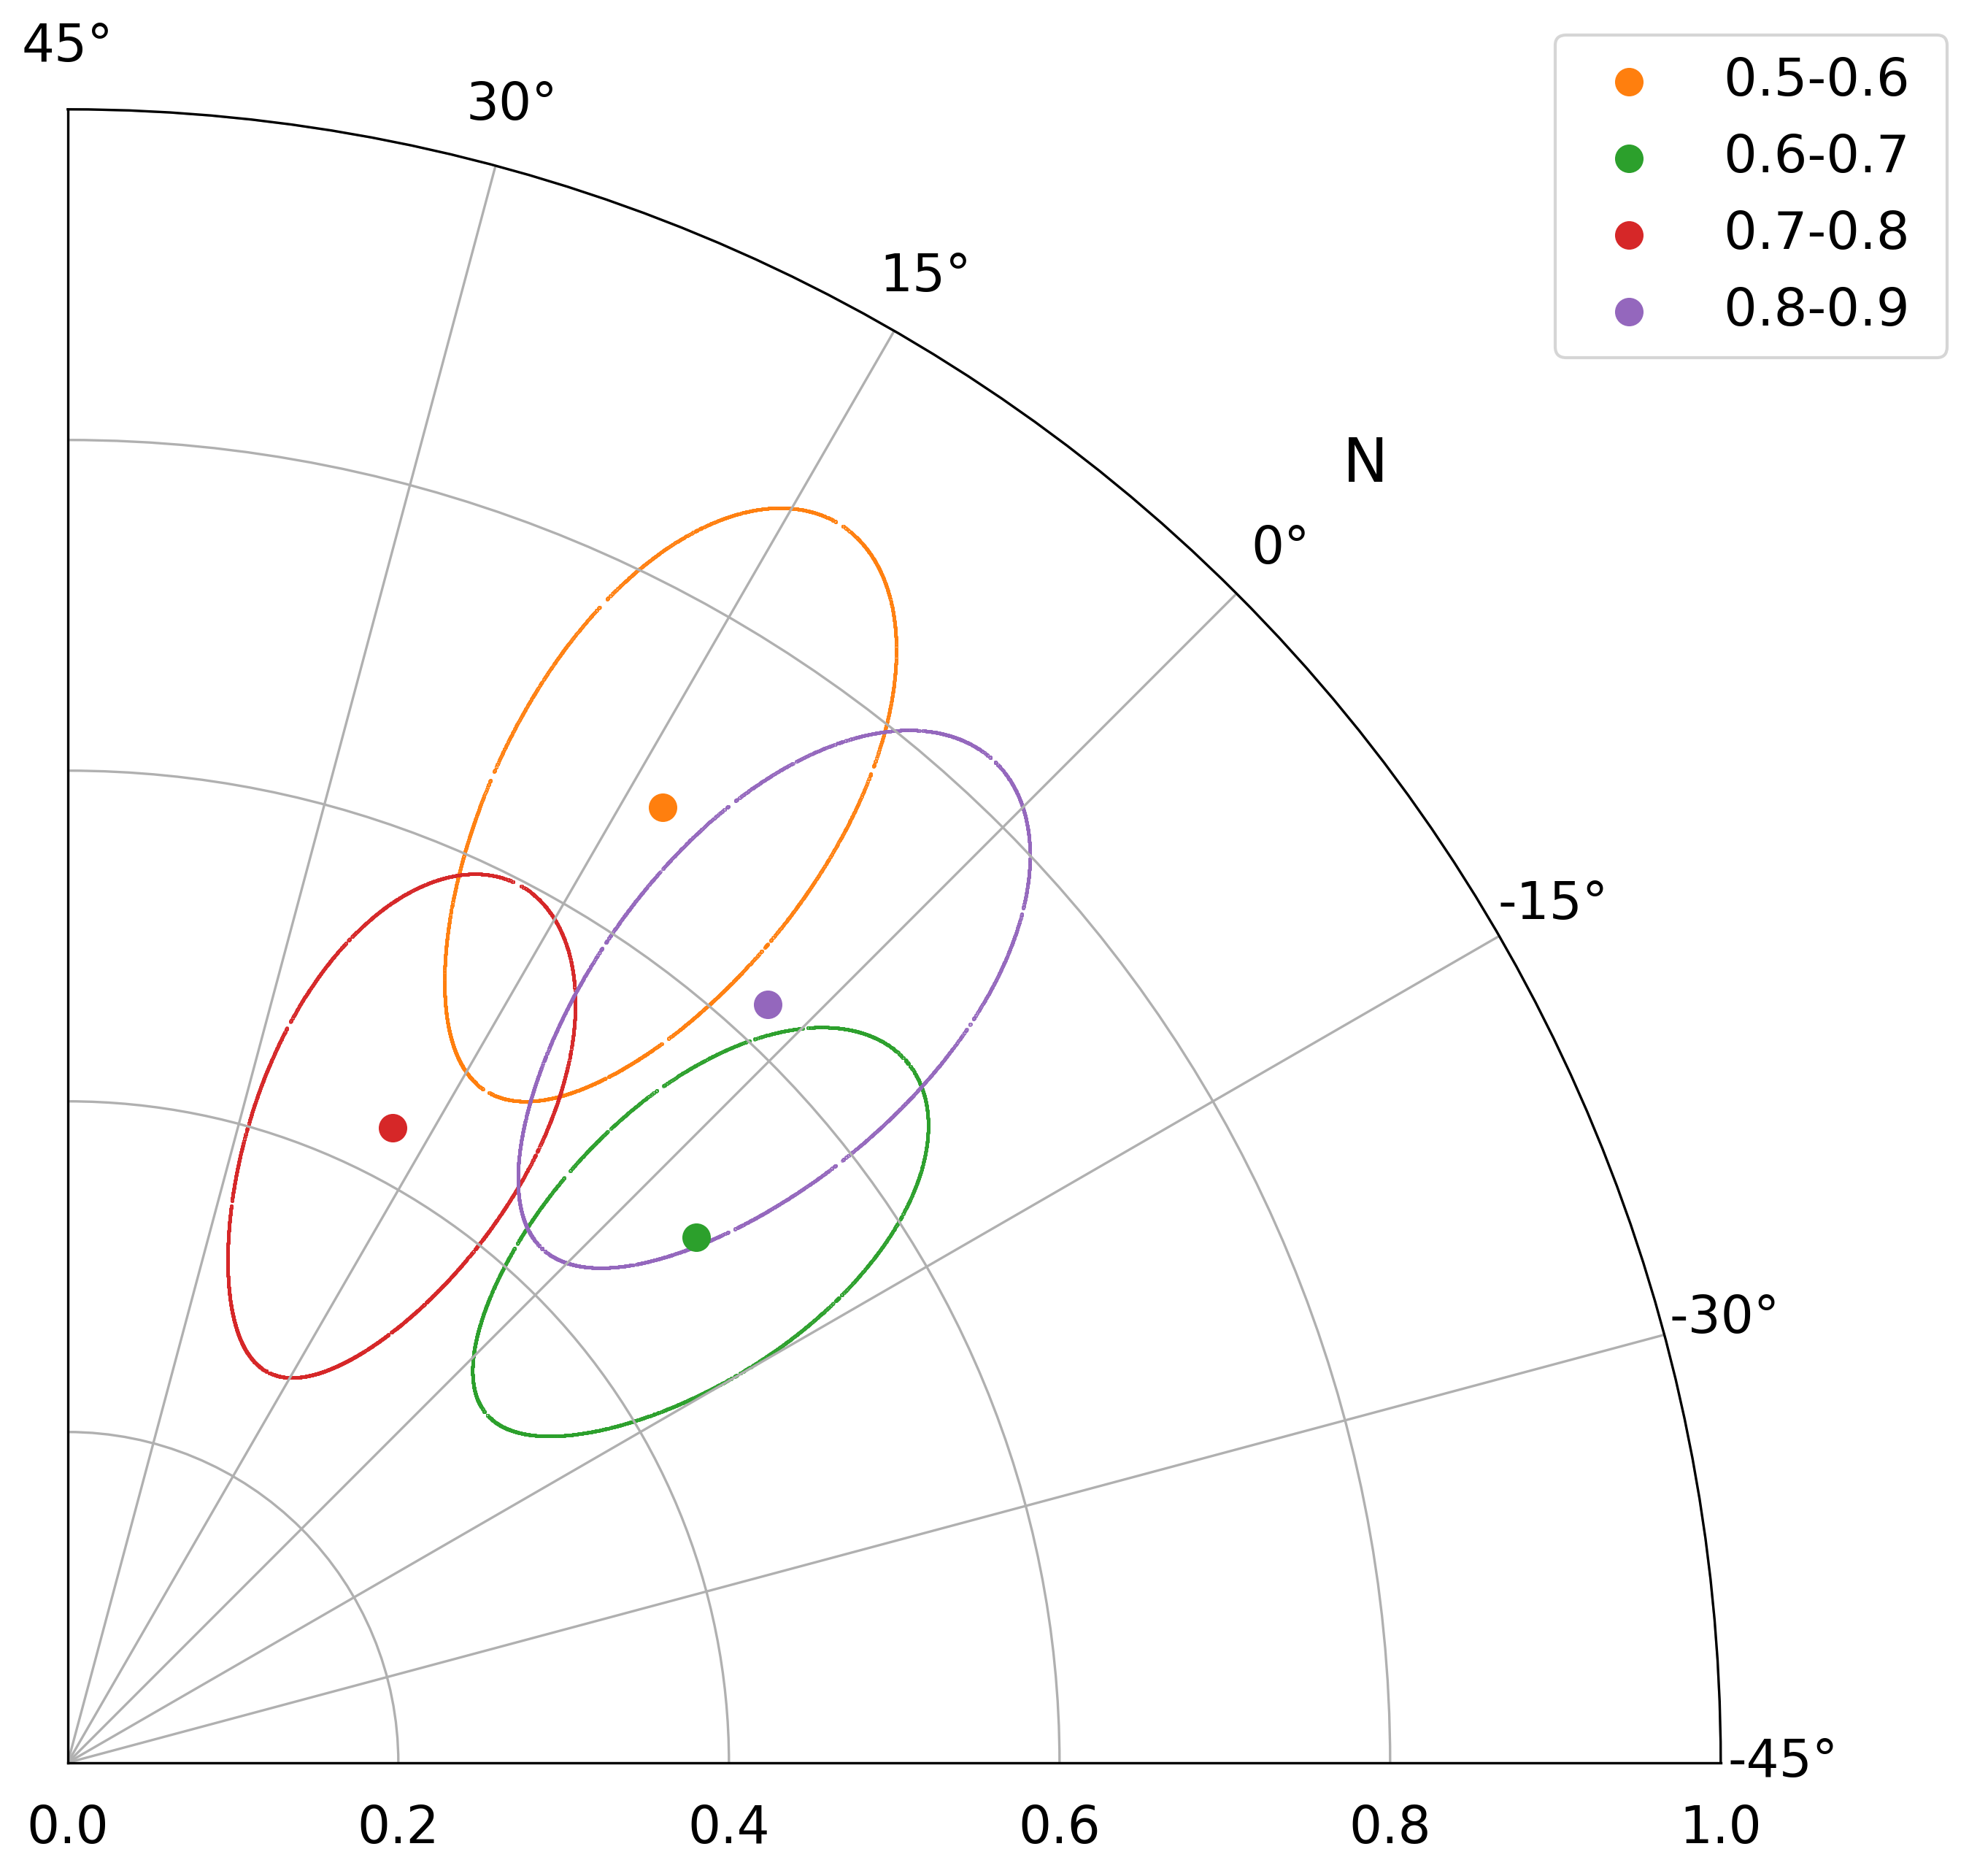
Figs. 6 and 7 and Table 4 display the pulsar polarization fit. We detect polarization at =0.5–0.6 with PD= and =0.8–0.9 with PD=. These two phase bins are located at the boundaries of the broad peak, bracketing two 2 significance bins at lower () PD. One of these is at 2.99 significance with PD=. This polarization pattern has an interesting correspondence with the bifurcation of the peak, which de Plaa et al. (2003) describe as a superposition of two Gaussian components with a separation of 0.2 for energies 2–20 keV. If these components are overlapping cones of emission with differing position angles, this could explain our PD results - mixing could cause the PD dip in the center of the broad peak. With significant measurements in only two phase bins, we cannot yet identify a definitive sweep. Additional exposure could measure the intervening bins, allowing useful model constraints.
For the nebula, we did not find significant detection in any individual spatial pixel. However, we do find a significant polarization of the integrated nebula component, with PD=% and PA=. This is consistent with the values found using the 60′′ aperture and has a higher significance of , in part because all phases can contribute to the nebula flux estimates.
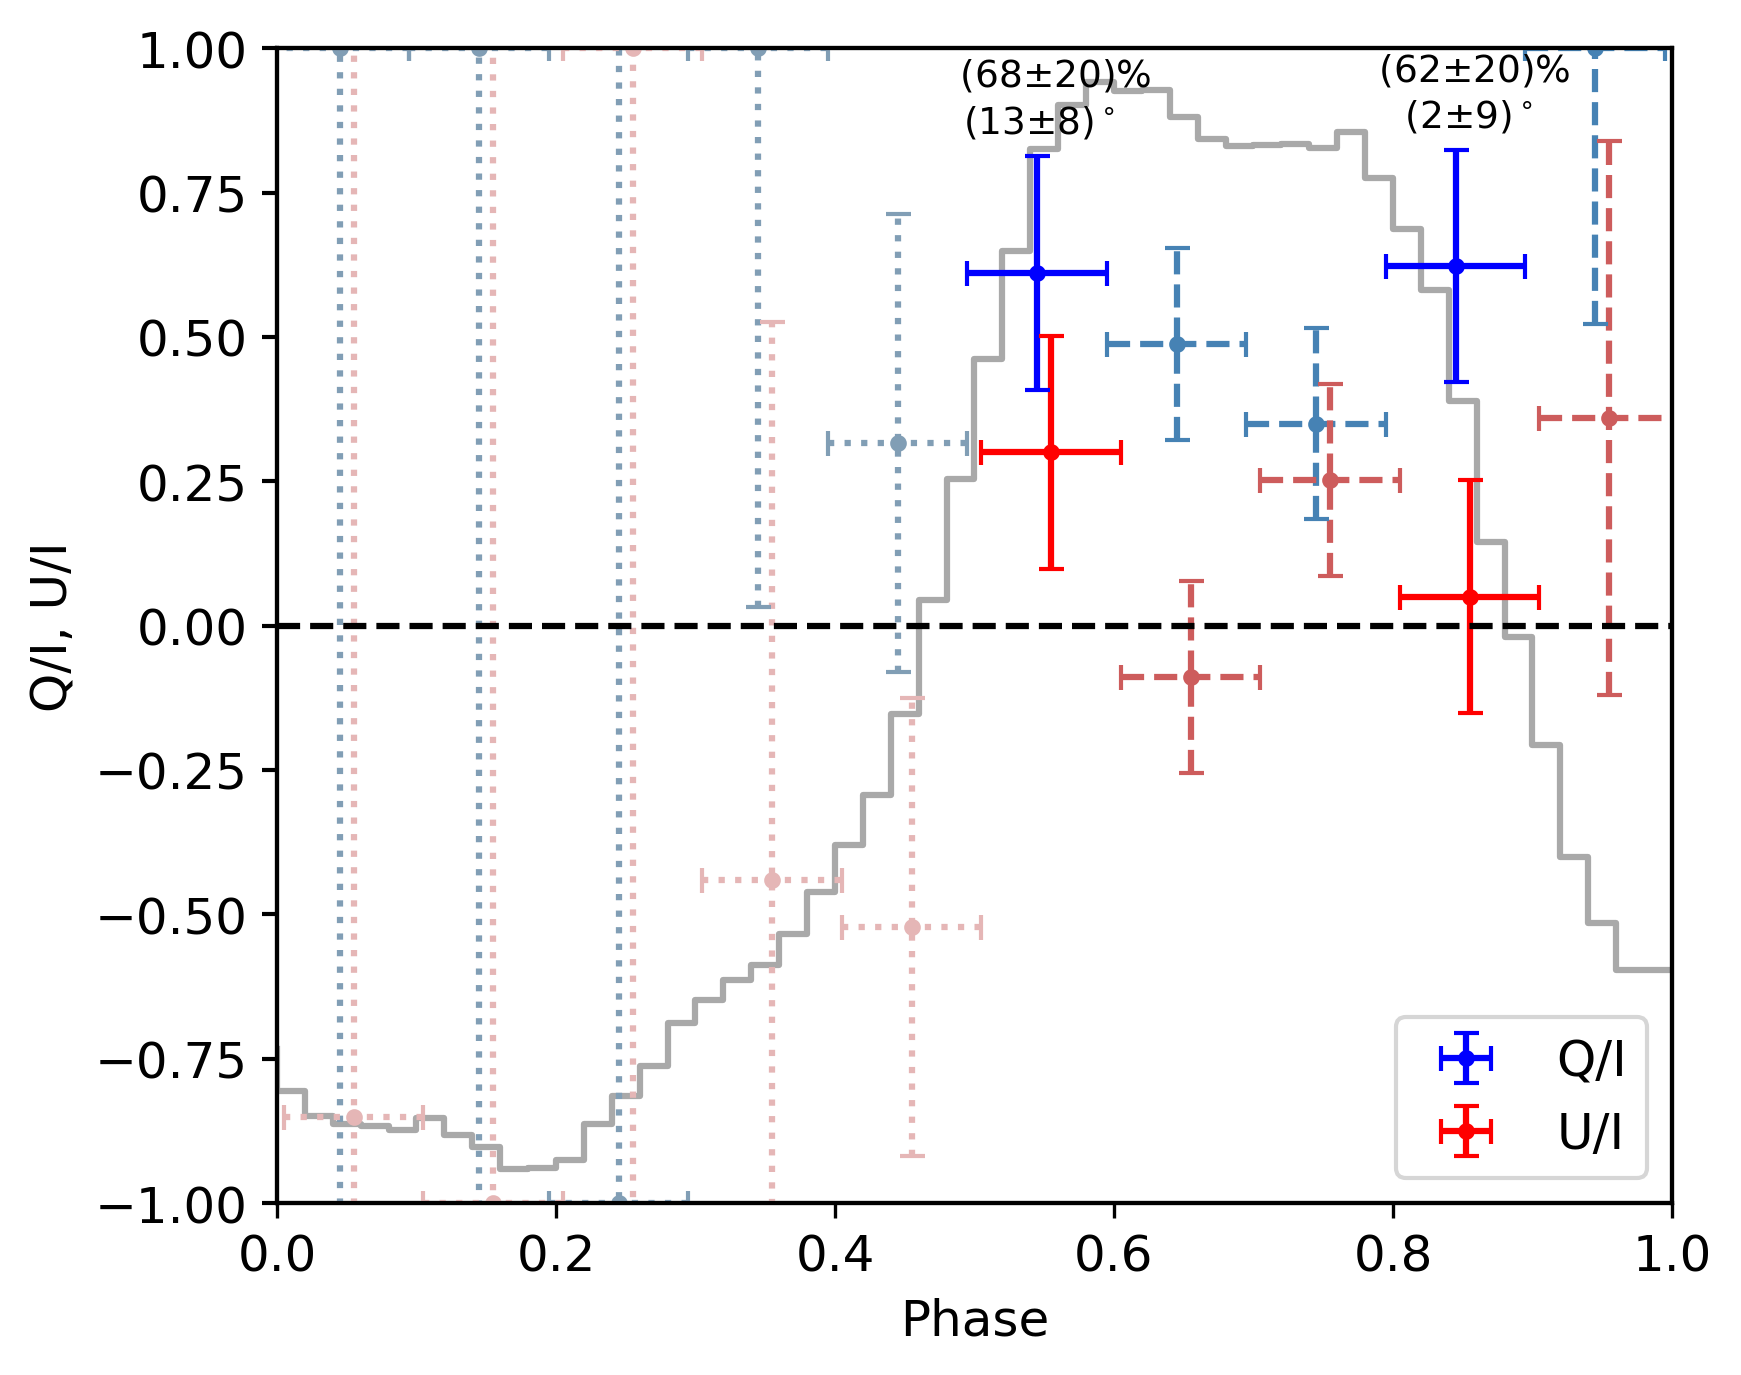
| Phase | Q/I | Q/I err | U/I | U/I err | PD | PD err | PA (∘) | Sig |
|---|---|---|---|---|---|---|---|---|
| 0.5–0.6 | 0.61 | 0.20 | 0.30 | 0.20 | 0.68 | 0.20 | 13.1 | 3.37 |
| 0.6–0.7 | 0.49 | 0.17 | -0.09 | 0.17 | 0.50 | 0.16 | -5.13 | 2.99 |
| 0.7–0.8 | 0.35 | 0.17 | 0.25 | 0.17 | 0.43 | 0.16 | 17.9 | 2.60 |
| 0.8–0.9 | 0.62 | 0.20 | 0.05 | 0.20 | 0.62 | 0.20 | 2.29 | 3.10 |
5 Discussion and conclusion
PSR B0540-69 is the fourth PWN observed by IXPE, after the Crab (Bucciantini et al., 2023), Vela (Xie et al., 2022) and MSH 15-52 (Romani et al., 2023b). All three PWNe are highly polarized, with local polarization degree reaching %. PSR B0540-69’s PWN is unresolved by IXPE, with a net phase-average polarization for the complex (PWN and PSR) below 5.3% in 2–8 keV band. To separate the PWN and PSR components, we performed a phase-resolved analysis using two techniques. A simple on-off analysis allows us to get a statistically significant polarization detection from both the PWN and PSR in an optimized energy range 4–6 keV.
For the PWN (=0–0.35, Fig. 5), we measured PD= and PA=, detected at the 4.6 confidence level. This PD is slightly higher than that of the Crab nebula. This may be due to PSR B0540-69’s nearly edge-on PWN view (spin axis inclined to the line of sight versus 63∘ for the Crab). For such a toroidal field projected to the sky has nearly constant position angle, reducing the de-polarization both due to line of sight integration, and spatial averaging over the PWN, with respect to the Crab. Indeed, local PD in the Crab PWN is found to be as high as 42%, and locally higher values in the PSR B0540-69 PWN are reported by Lundqvist et al. (2011) in spatially resolved optical polarimetry. The measured PA of the PWN is consistent with the optical (Chanan & Helfand, 1990) and radio (Dickel et al., 2002) values. By fitting the Chandra X-ray PWN morphology, (Ng & Romani, 2008) reported a PSR B0540-69 spin axis position angle of 144.1∘. Surprisingly, the off-pulse PA is at large angle to this axis; one expects it to align well with the PWN symmetry axis, as for Crab and Vela. However, previous results on Crab and Vela, have shown that the most polarized regions are typically not close to the pulsar, where the magnetic field is generally oriented perpendicular to the PSR spin axis, but at the edge of the X-ray bright torus/rings, where environmental effects due to the interaction with the SNR ejecta, can lead to sizable deviations of the PA (about 20∘ in Crab). Alternatively, the large deviation of 90∘ (78∘ vs. 144∘) in PSR B0540-69 leads to a possibility that the brighter axis in the Chandra image selected as the torus in Ng & Romani (2008) is the jet. PSR B0540-69 could be a jet dominated system, like MSH 15-52, instead of a torus dominated one, like Crab or Vela.
For the pulsar (=0.5–0.9, Fig. 5), we measured PD= and PA= at 3.8 confidence level, treating the broad pulse emission as a single phase bin. This result is improved by using the “simultaneous” fitting method (Wong et al., 2023), with which we detected polarization in the two 0.1-width phase bins bracketing the pulse, as shown in Fig. 6. These bins had PD= at =0.5–0.6 and PD= at =0.8–0.9. The intervening bins are at lower PD and 2–3 significance. This has an interesting correlation with the analysis done by de Plaa et al. (2003), which purports that the pulse emission is the sum of two Gaussian components. More phase bins are needed to fully resolve the polarization structure in the pulse, but these two observations already hint at two distinct radiation components, perhaps at separate sites in the magnetosphere with different polarization, combining to make the main pulse emission. Within striped wind emission models (Pétri, 2013), a single large pulse, can be achieved only if the inclination of the spin axis with respect to the line of sight is close to the magnetic axis inclination. In this case, the core of the pulse is expected to be unpolarized, with polarization present only at the leading and trailing edges. The “simultaneous” fitting technique also recovers a consistent measurement of the nebula polarization at higher significance.
PSR B0540-69 is similar to Crab in many respects, but the pulse profile is very different. Here, we see a broad pulse while the Crab profile shows two sharp peaks. Bucciantini et al. (2023) reported a pulsed Crab PD detection in a very narrow phase range ( = 0.02) at the main peak, while Wong et al. (2023) found significant polarization in several near-peak bins. Many models have been proposed for the high energy pulsar emission, but the radiation site is still not fully understood. Polarization could be a powerful tool to study this radiation by measuring the change of polarization angle with phase. At present, with polarization in only a few phase bins for PSR B0540-69, the Crab pulsar (Wong et al., 2023) and PSR B1509-58 (Romani et al., 2023b), it is difficult to test the models. Additional IXPE observations of these interesting sources could enable model discrimination.
Acknowledgments
The Imaging X-ray Polarimetry Explorer (IXPE) is a joint US and Italian mission. The US contribution is supported by the National Aeronautics and Space Administration (NASA) and led and managed by its Marshall Space Flight Center (MSFC), with industry partner Ball Aerospace (contract NNM15AA18C). The Italian contribution is supported by the Italian Space Agency (Agenzia Spaziale Italiana, ASI) through contract ASI-OHBI-2022-13-I.0, agreements ASI-INAF-2022-19-HH.0 and ASI-INFN-2017.13-H0, and its Space Science Data Center (SSDC) with agreements ASI-INAF-2022-14-HH.0 and ASI-INFN 2021-43-HH.0, and by the Istituto Nazionale di Astrofisica (INAF) and the Istituto Nazionale di Fisica Nucleare (INFN) in Italy. This research used data products provided by the IXPE Team (MSFC, SSDC, INAF, and INFN) and distributed with additional software tools by the High-Energy Astrophysics Science Archive Research Center (HEASARC), at NASA Goddard Space Flight Center (GSFC).
This work is supported by National Key R&D Program of China (grant No. 2023YFE0117200) and National Natural Science Foundation of China (grant No. 12373041 and grant No. 12133003). C.Y.N. and Y.J.Y. are supported by a GRF grant of the Hong Kong Government under HKU 17305419. Funding for this work was provided in part by contract NNM17AA26C from the MSFC to Stanford and 80MSFC17C0012 to MIT in support of the IXPE project. N.B. is supported by the INAF MiniGrant “PWNnumpol - Numerical Studies of Pulsar Wind Nebulae in The Light of IXPE”. I.L. is supported by the NASA Postdoctoral Program at the Marshall Space Flight Center, administered by Oak Ridge Associated Universities under contract with NASA. W.C.G.H. acknowledges support through grant 80NSSC23K0078 from NASA. This research has made use of NICER data. We thank NICER staff for the scheduling of these observations. This paper employs a list of Chandra datasets, obtained by the Chandra X-ray Observatory, contained in https://doi.org/10.25574/cdc.177 (catalog DOI: https://doi.org/10.25574/cdc.177).
References
- Arnaud (1996) Arnaud, K. A. 1996, in ASP Conf. Ser., Vol. 101, Astronomical Data Analysis Software and Systems V, ed. G. H. Jacoby & J. Barnes (San Francisco: Astron. Soc. Pac.), 17–20
- Baldini et al. (2022) Baldini, L., Bucciantini, N., Lalla, N. D., et al. 2022, SoftwareX, 19, 101194, doi: 10.1016/j.softx.2022.101194
- Bucciantini et al. (2023) Bucciantini, N., Ferrazzoli, R., Bachetti, M., et al. 2023, Nature Astronomy, 7, 602, doi: 10.1038/s41550-023-01936-8
- Chanan & Helfand (1990) Chanan, G. A., & Helfand, D. J. 1990, ApJ, 352, 167, doi: 10.1086/168524
- Chanan et al. (1984) Chanan, G. A., Helfand, D. J., & Reynolds, S. P. 1984, ApJ, 287, L23, doi: 10.1086/184389
- Costa et al. (2001) Costa, E., Soffitta, P., Bellazzini, R., et al. 2001, Nature, 411, 662, doi: 10.1038/35079508
- de Plaa et al. (2003) de Plaa, J., Kuiper, L., & Hermsen, W. 2003, A&A, 400, 1013, doi: 10.1051/0004-6361:20030039
- Di Marco et al. (2023) Di Marco, A., Soffitta, P., Costa, E., et al. 2023, AJ, 165, 143, doi: 10.3847/1538-3881/acba0f
- Dickel et al. (2002) Dickel, J. R., Mulligan, M. C., Klinger, R. J., et al. 2002, in Astronomical Society of the Pacific Conference Series, Vol. 271, Neutron Stars in Supernova Remnants, ed. P. O. Slane & B. M. Gaensler, 195
- Fermi LAT Collaboration et al. (2015) Fermi LAT Collaboration, Ackermann, M., Albert, A., et al. 2015, Science, 350, 801, doi: 10.1126/science.aac7400
- Gotthelf & Wang (2000) Gotthelf, E. V., & Wang, Q. D. 2000, ApJ, 532, L117, doi: 10.1086/312568
- Hobbs et al. (2006) Hobbs, G., Edwards, R., & Manchester, R. 2006, Monthly Notices of the Royal Astronomical Society, 369, 655
- Huppenkothen et al. (2019) Huppenkothen, D., Bachetti, M., Stevens, A. L., et al. 2019, The Astrophysical Journal, 881, 39
- Johnston & Romani (2003) Johnston, S., & Romani, R. W. 2003, ApJ, 590, L95, doi: 10.1086/376826
- Kaaret et al. (2001) Kaaret, P., Marshall, H. L., Aldcroft, T. L., et al. 2001, ApJ, 546, 1159, doi: 10.1086/318287
- Lundqvist et al. (2011) Lundqvist, N., Lundqvist, P., Björnsson, C. I., et al. 2011, MNRAS, 413, 611, doi: 10.1111/j.1365-2966.2010.18159.x
- Mignani et al. (2010) Mignani, R. P., Sartori, A., de Luca, A., et al. 2010, A&A, 515, A110, doi: 10.1051/0004-6361/200913870
- Ng & Romani (2008) Ng, C. Y., & Romani, R. W. 2008, ApJ, 673, 411, doi: 10.1086/523935
- Pétri (2013) Pétri, J. 2013, MNRAS, 434, 2636, doi: 10.1093/mnras/stt1214
- Romani et al. (2023a) Romani, R. W., Wong, J., Di Lalla, N., et al. 2023a, arXiv e-prints, arXiv:2309.16067. https://arxiv.org/abs/2309.16067
- Romani et al. (2023b) —. 2023b, arXiv e-prints, arXiv:2309.16067. https://arxiv.org/abs/2309.16067
- Seward et al. (1984) Seward, F. D., Harnden, F. R., J., & Helfand, D. J. 1984, ApJ, 287, L19, doi: 10.1086/184388
- Soffitta et al. (2021) Soffitta, P., Baldini, L., Bellazzini, R., et al. 2021, AJ, 162, 208, doi: 10.3847/1538-3881/ac19b0
- Weisskopf et al. (2022) Weisskopf, M. C., Soffitta, P., Baldini, L., et al. 2022, JATIS, 8, 026002, doi: 10.1117/1.JATIS.8.2.026002
- Wong et al. (2023) Wong, J., Romani, R. W., & Dinsmore, J. T. 2023, ApJ, 953, 28, doi: 10.3847/1538-4357/acdc1d
- Xie et al. (2022) Xie, F., Di Marco, A., La Monaca, F., et al. 2022, Nature, 612, 658, doi: 10.1038/s41586-022-05476-5