High-resolution Pan-STARRS and SMA observations of IRAS 23077+6707: A giant edge-on protoplanetary disk
Abstract
We present resolved images of IRAS 23077+6707 in / thermal dust and CO gas emission with the Submillimeter Array (SMA) and optical scattered light with the Panoramic Survey Telescope and Rapid Response System (Pan-STARRS). The Pan-STARRS data show a bipolar distribution of optically scattering dust that is characteristic for disks observed at high inclinations. Its radial extent in scattered light emission spans , with two highly asymmetric filaments extending along the upper bounds of each nebula by . The SMA data measure continuum dust as well as 12CO, 13CO and C18O =21 line emission over – extents, with the gas presenting the typical morphology of a disk in Keplerian rotation, in both position-velocity space and in each CO line spectra. IRAS 23077+6707 has no reported distance estimate, but if it is located in the Cepheus star-forming region (180–800 pc), it would have a radius spanning thousands of au. Taken together, we infer IRAS 23077+6707 to be a giant and gas-rich edge-on protoplanetary disk, which to our knowledge is the largest in extent so far discovered.
1 Introduction
Protoplanetary disks provide the physical and thermo-chemical resources for planet formation, and are a natural, ubiquitous by-product of the star formation process (see Williams & Cieza, 2011; Andrews, 2020, for reviews). The vast majority have been discovered in surveys of relatively nearby star-forming regions (see e.g. the review of Manara et al., 2023), and specifically in star-forming regions such as Taurus (Andrews et al., 2013), Ophiuchus (Cieza et al., 2019), Lupus (Ansdell et al., 2016, 2018; Lovell et al., 2021) and Upper Scorpius (Carpenter et al., 2014; Barenfeld et al., 2016), enabling the detailed structural mapping of disk morphologies and substructures (e.g. Andrews et al., 2018; Long et al., 2018). Such detailed studies allow for connections to be made between these planetary birth-sites and the observed population of planets that are now readily detected around mature stars (e.g. Manara et al., 2018; Mulders et al., 2021).
Measuring the internal structures of protoplanetary disks via different observational tracers is crucial for gaining a comprehensive understanding of protoplanetary disks and the intricate processes driving the birth of planetary systems. Protoplanetary disks that are observed at high inclinations offer a unique opportunity to study their physical properties, as the bright emission of the central star is obscured entirely by the dust and gas of the surrounding disk, resulting in the disk being seen as a central dark lane flanked by scattered light emission (e.g. Burrows et al., 1996; Padgett et al., 1999; Wolf et al., 2003; Watson & Stapelfeldt, 2004; Stapelfeldt et al., 2014). Consequently, these so-called ‘edge-on disks’ (EODs) are special laboratories to study the environment in which planets are forming. They allow us to directly observe the vertical disk structure that is needed in order to determine the degree of dust settling towards the midplane, but also to measure other key properties of planet-forming disks, such as their radii or their radial flaring. Comparison of scattered light images with extensive radiative transfer models further allows determining the physical properties of the scattering dust grains in the upper atmosphere of the disk.
The combination of scattered light imaging with interferometric observations in the millimeter (mm) regime has proven to be especially successful in characterizing EODs in detail (e.g. Wolf et al., 2003; Bujarrabal et al., 2008, 2009; Sauter et al., 2009; Wolff et al., 2021), as both types of observations trace different regions of a system and thus unique physical processes. On one hand, (sub-)mm observations are sensitive to the longer wavelength radiation being re-emitted from larger (mm- to cm-sized) dust grains close to the disk midplane, and thus typically appear in extended line (or ‘needle-like’) morphologies. On the other hand, optical and near-infrared (NIR) observations trace smaller, micron-sized dust grains in the hotter, outer envelope and the disk surface layers that scatter the light of the central star, and thus create two bright, highly-flared lobes. Thanks to the Karl G. Jansky Very Large Array (VLA), the Atacama Large Millimeter Array (ALMA), the Hubble Space Telescope (HST), and most recently the James Webb Space Telescope (JWST), scattered light and (sub-)mm observations of EODs at high spatial resolution have now become routine (e.g. Melis et al., 2011; Stapelfeldt et al., 2014; Villenave et al., 2020, 2023; Flores et al., 2021; Duchene et al., 2023). However, the angular extents of these EODs are generally only a few arcseconds at most, with IRAS 18059-3211 (“Gomez’s Hamburger”) presenting the largest yet, with dust and gas extents of and respectively (Ruiz et al., 1987; Bujarrabal et al., 2008, 2009; Teague et al., 2020).
In this letter, we present the first resolved observations of IRAS 23077+6707 (termed “Dracula’s Chivito”, or DraChi by Berghea et al., subm.) with the Submillimeter Array (SMA) and the Panoramic Survey Telescope and Rapid Response System (Pan-STARRS). IRAS 23077+6707 is located in the Cepheus star-forming region and was serendipitously discovered in 2016 by Dr. Ciprian Berghea in the Pan-STARRS data. Here we report IRAS 23077+6707 as the largest protoplanetary disk on the sky, with dust and CO gas extents of –, and CO in Keplerian rotation.
2 Observations and analysis
2.1 Panoramic Survey Telescope and Rapid Response System
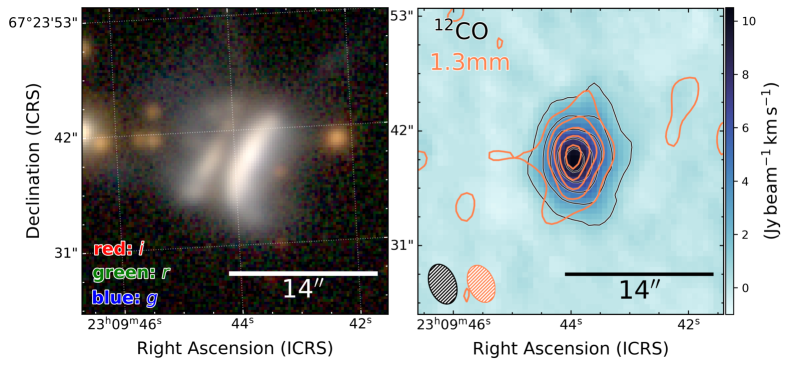
Pan-STARRS (Chambers et al., 2016) is a system of two optical m telescopes (PS1 and PS2) and the observations of IRAS 23077+6707 presented here were performed with the PS1 Gigapixel Camera (GPC1), covering a field of view of , a pixel scale of and median seeing values of – for the broadband filters (spanning –). Stacked images of IRAS 23077+6707 ( and ), were retrieved from the first data release of PS1111https://outerspace.stsci.edu/display/PANSTARRS/ (Flewelling et al., 2020). These were then used to produce the RGB-composite image shown in Fig. 1 (left) where the -, - and -bands (, and ) are represented by red, green and blue colors respectively, and with equal image intensity weighting.
IRAS 23077+6707 shows the typical morphological features of an edge-on protoplanetary disk, namely two elongated bright reflection nebulae (tracing the upper layers of the disk atmosphere), separated by a dark lane (tracing the disk midplane) which obscures the light emitted by the central star. The scattered light emission of the disk dark lane has an angular extent of , which we measure from a line profile across the disk with a position angle of (from north, counter-clockwise). Further, two faint filaments that likely trace the arcs of the disk’s flared upper layers, extend northwards by almost . We see no evidence of a jet nor any obvious signatures of envelope material, which are both typically associated with early-stage Class 0 and Class I young stellar objects (YSOs; see Williams & Cieza, 2011, for a review), thus likely suggesting a more evolved evolutionary stage for IRAS 23077+6707.
IRAS 23077+6707 exhibits three prominent asymmetries. First, its western lobe is brighter than its eastern lobe by a factor of 5, typical for disks with sky-projected inclinations that are not perfectly edge-on (due to preferential grain scattering), for which a simple comparison with the models of (see e.g. Watson et al., 2007) imply the disk is likely inclined to the plane of the sky by . Second, in the eastern (fainter) lobe, the southern region is brighter than the northern region by a factor of 2, whereas in the western (brighter) lobe the northern and southern region brightnesses are within 1 %. These values were measured by averaging the flux per pixel in four quadrants centered on the disk, at a position angle of . Such an asymmetry could be a result of foreground extinction preferentially dimming the north-east of the disk. However, it could also imply a misaligned, inner disk or a warp that would cast shadows on the observed disk (see Sect. 3.3). Third, whilst the northern extent has two prominent filaments, the southern side hosts none. The filaments extend northwards beyond the edge of the dark lane by .
The publicly available Digitized Sky Survey images of IRAS 23077+6707 also resolve the disk, and likewise demonstrate similar asymmetries (in DSS1, DSS2-blue, DSS2-red, and DSS2-infrared), which we thus deem a physical feature of the disk (Minkowski & Abell, 1963; Lasker et al., 1996). The presence of such a filament-asymmetry could imply that the outermost disk layers (or possibly a disk wind) are truncated, or perhaps angled backwards, plausibly due to interactions with a nearby star and/or the ISM, or from asymmetric ionization/wind launching from the central star.
2.2 Submillimeter Array
2.2.1 Data reduction and calibration
IRAS 23077+6707 was observed on 25 April 2023 by the SMA (Ho et al., 2004) in project 2022B-S054 (PI: K. Monsch), for 228 min on-source. The SMA was in the compact configuration with 6 antennas (1, 3, 4, 5, 6 and 8) spanning baselines of 6–67 m. The observations were conducted with the SMA SWARM correlator, consisting of bands with 140 kHz channel resolution tuned to a central local oscillator (LO) frequency of 225.538 GHz (), spanning 209.538–221.538 GHz and 229.538–241.538 GHz. J0019+734 and J2005+778 were observed for gain calibration, 3c279 for bandpass calibration and Ceres for flux calibration. We converted the raw SMA data to the Common Astronomy Software Applications (CASA) measurement set format with pyuvdata (Hazelton et al., 2017), using the SMA reduction pipeline in CASA version 6.4.1222The SMA CASA reduction pipeline can be accessed via: https://github.com/Smithsonian/sma-data-reduction with a channel re-binning factor of 2 (to reduce the data volume, whilst maintaining high spectral resolution during calibration, appropriate for both continuum and spectral line analyses). Prior to any calibration solutions being applied, we manually flagged all narrow interference spurs (that appeared in a small number of individual channels), and trimmed away 2.5 % of the overlapping “guard-band” regions between individual 2 GHz SWARM correlator segments.
2.2.2 Visibility modeling and imaging
‘Corrected’ data for IRAS 23077+6707 were extracted using the CASA mstransform task, in which we time-averaged our data by . For the continuum emission, we re-binned these corrected data to 4 channels per spectral window (appropriate for continuum analysis), whereas for line emission analysis, we split these corrected data into the 12 separate SMA spectral windows (with no channel averaging) and transformed these to the local standard of rest frame (LSRK).
We measure the total 1.3 mm flux of IRAS 23077+6707 as mJy by fitting a Gaussian model to IRAS 23077+6707’s calibrated visibilities with the CASA package uvmodelfit (with 10 iterations to ensure model convergence, where the error incorporates a standard SMA 5 % flux calibration error in quadrature with the fitting uncertainty). This fit derives a position angle of 342∘ and a small phase offset ( in RA, and in Dec). By instead fitting the same visibility model to the upper and lower side bands of the continuum visibilities independently (between 209.5–221.5 GHz and 229.5–241.5 GHz) we found best-fit fluxes of mJy and mJy. This results in a spectral index of (for ), which is at the upper end of the measured mm spectral indices for the disks compiled by Ribas et al. (2017) and thus hints towards optically thin dust, which is unusual given the disk is so large and edge-on.
Standard imaging of the continuum data was conducted with the tclean algorithm to a threshold ( mJy), using an image-centered elliptical mask (fully covering the disk), and a Briggs robust parameter of . The right panel of Fig. 1 shows the resulting continuum emission overlaid as contours on the 12CO integrated intensity map (or ‘moment 0 map’, which we will discuss further below), presenting an elongated morphology with a consistent position angle of with the scattered light emission, typical for an EOD imaged at relatively low-resolution where the emission traces the cooler mid-plane dust. We deem the low axis ratio of the continuum extent (major/minor axis disk extent) to be dominated by the beam roughly aligned along the disk minor axis with a BPA.
We subtract the continuum emission from each channel in our CO line measurement sets (for the spectral windows containing the 12CO, 13CO and C18O) using the CASA package uvcontsub with a linear fit to all regions excluding the channels with CO emission (MHz). We apply standard imaging on each CO line separately with the tclean algorithm (to a clean threshold of ) using an image-centered elliptical mask, and a Briggs robust parameter of ) to produce 60-channel wide LSRK-frame data cubes, with the line emission spanning the central 10–20 channels. All cubes present spatially and spectrally resolved line emission at IRAS 23077+6707’s location, with the resulting cubes having beams with sizes and position angles , BPA= (12CO), , BPA= (13CO), and , BPA= (C18O).
In the right panel of Fig. 1, we present the velocity-integrated intensity (or ‘moment 0’) map for the 12CO =21 emission line, generated with bettermoments (Teague & Foreman-Mackey, 2018) using a emission clip that is integrated only from those channels of the data cube that span the full line width (which ranges from 5.6 to km s-1). All three gas lines are clearly detected, with disk emission (detected at a level) covering more than for both 12CO and 13CO and for C18O (i.e. 3–4 beams across the radial disk extent). Notably, while being significantly less abundant than 12CO, the extents of both the 13CO and C18O emission along the radial and vertical directions are comparable to the 12CO emission, revealing this as a highly gas-rich system.
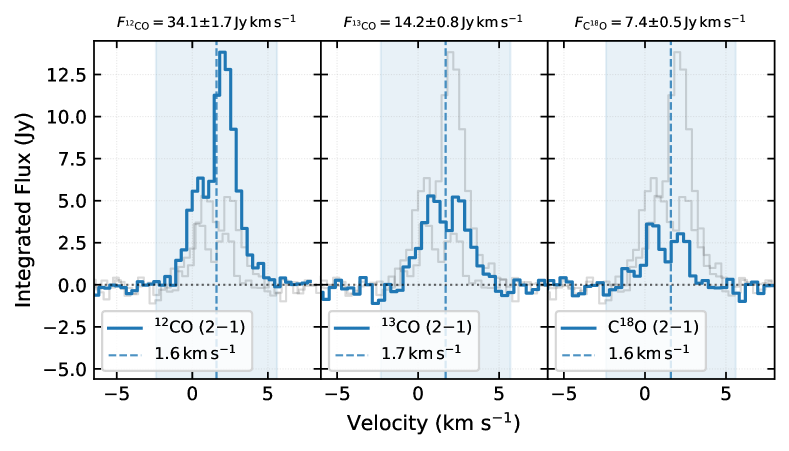
With GoFish (Teague, 2019) and a simple field of view cut centred on the respective line emission, we extract integrated line fluxes for the CO lines of , and (which we report here and in Table 1 with an additional 5% flux uncertainty in quadrature with the GoFish fitting error). As expected for disks in Keplerian rotation, the line profiles for all three CO isotopologues as shown in Fig. 2 are double-peaked, with velocity centroids of 1.6, 1.7 and 1.6 km s-1 respectively. Out of these, the 12CO line profile is the only observed as asymmetric, with its redshifted (western) component being brighter than its blueshifted (eastern) component, which is most likely a consequence of the 12CO emission being optically thick, preventing us from observing as much CO on the disk rear side.
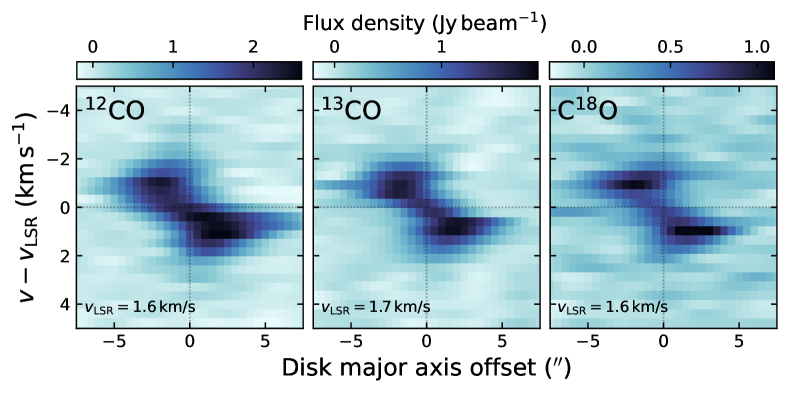
In Fig. 3, we further show position-velocity (PV) diagrams for all three CO =21 lines, extracted with pvextractor (Ginsburg et al., 2016) using long and wide cuts, oriented along a position angle of and referenced to each of their respective line velocity centers, as well as the center of each cut. All of these PV diagrams present the expected double-peaked (‘dumb-bell’-like) emission morphology of an inclined disk in Keplerian rotation.
3 Results and discussion
3.1 IRAS 23077+6707: a young, edge-on disk
Our observations present compelling evidence that the giant bipolar reflection nebula, IRAS 23077+6707, is a protoplanetary disk that is viewed nearly edge-on. Whilst its size is extreme, with IRAS 23077+6707 hosting a protoplanetary disk that subtends the largest known angular scale on the sky, what is perhaps most remarkable is that this source has until now gone unreported in the scientific literature. We note that in the recent work of Angelo et al. (2023) it was reported that the number count of edge-on protoplanetary disks falls far short of simulated disk populations in the Galaxy; IRAS 23077+6707 therefore suggests that there may be many more edge-on disks awaiting discovery.
Nevertheless, decades of all-sky mapping, alongside detailed local Galaxy studies have reported unresolved detections of dust and gas associated with IRAS 23077+6707 (for example, at moderate angular resolution with IRAM, WISE and 2MASS, see Wouterloot & Brand, 1989; Wouterloot et al., 1993; Skrutskie et al., 2006; Cutri et al., 2021). Using these all-sky data, as well as employing the spectral slope expression (pioneered by Lada, 1987; Adams et al., 1987),
| (1) |
we determine IRAS 23077+6707 to have mid-IR spectral slopes of , and , between the 2MASS -band data point (m, mJy) and either the WISE W3 (m, mJy) or WISE W4 (m, mJy) photometry. While these values would ordinarily place a disk in the spectral slope range defining a class F YSO (i.e. an intermediate class I–II source, cf. Greene et al., 1994; Williams & Cieza, 2011), IRAS 23077+6707’s edge-on morphology may suggest it is instead more evolved due to the emission being highly self-extincted at these near- and mid-infrared wavelengths (cf. Chiang & Goldreich, 1999; Robitaille et al., 2006). Indeed, since class II YSOs viewed edge-on present SEDs more consistent with class I and F sources, we deem IRAS 23077+6707’s photometry as evidence for it instead being a class II YSO, and thus host to a mature protoplanetary disk, which is consistent with the scattered light imaging that is clearly dominated by disk emission.
3.2 IRAS 23077+6707: a giant, gas-rich disk in Cepheus
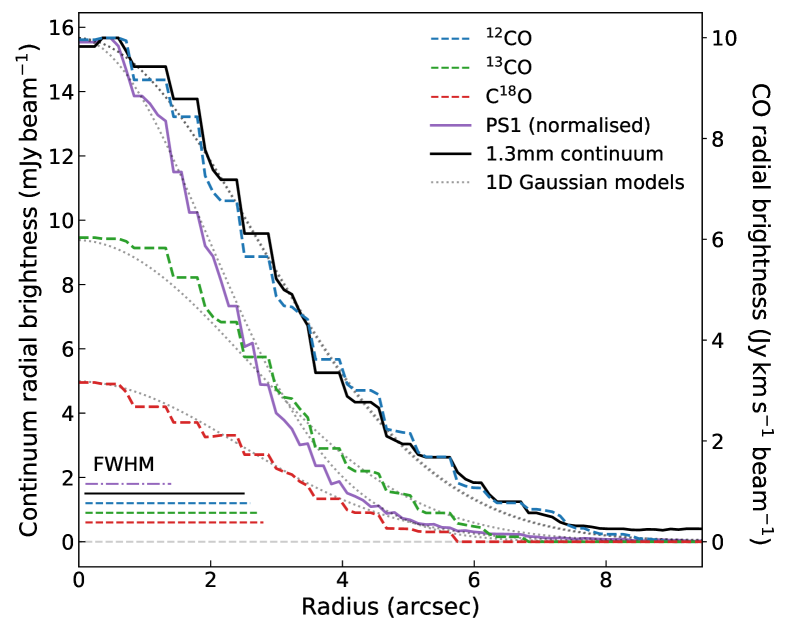
Fig. 4 shows the radial brightness profiles of the scattered light, mm continuum and the CO =21 moment 0 maps , as well as their respective FWHM resolution scales, and 1D Gaussian profiles convolved at each respective instrumental resolution. The left axis shows the radial brightness in continuum emission, whereas the right axis represents the radial brightness of CO. To show the scattered light emission on the same radial scale as the mm emission, we normalized the scattered light peak to the peak of the continuum profile. The profiles show the radially averaged (in the north and south directions) emission across the midplane axis for each image, assuming a position angle of , and in the case of the mm emission, and (consistent with the phase center offset of the emission).
Whilst the first approximate radii at which these profiles are consistent with 0 emission (within ) are , , , , and (for the scattered light, mm continuum, and progressively fainter CO lines respectively), convolution with either the PS1 PSF or interferometric SMA clean beams are likely over-estimating the disk’s true physical size. As such, we overplot 1D Gaussian profiles for each of the five emission profiles, which have been convolved to the same resolution of our observations (see the FWHMs shown in the lower left of Fig. 4) to provide an estimate for the scale on which dust and gas is plausibly present in the disk. The Gaussian FWHMs presented are , , , and respectively, and therefore we anticipate much higher angular resolution imaging will yield very little material beyond (i.e., a radius of the largest of these). These 1D Gaussian profiles thus offer a simple, but reasonable approximation of the disk emission, and thus allow us to estimate where the physical disk emission plausibly extends to, with these having - to -percentile radii of –, –, –, – and – respectively (see Table 1 for a summary of all measured values). We nevertheless note that in the case of the scattered light emission, this hosts a long tail that is not well-fitted by a simple Gaussian model, and thus in particular this Gaussian width approximation likely underestimates the true physical size of the scattered light disk.
In summary, we find it highly plausible that the emission extent spanning – is likely tracing dust and gas out to radii of at least –, far larger than any other reported protoplanetary disks. At the distance to the Cepheus star-forming region (see e.g., Kun et al., 2008, 2009; Szilágyi et al., 2021; Kerr et al., 2023, , spanning a range of 180–800 pc) to which IRAS 23077+6707 is likely associated, such large radii would suggest that IRAS 23077+6707’s disk thus spans 1000s of au in size.
What presents an interesting finding is that at the resolution of our observations, both IRAS 23077+6707’s dust continuum and gas emission span very similar spatial scales. In other young planet-forming disks, the difference in gas-to-disk radii ratio is typically on the order of at least factor 2 or more (cf. Birnstiel & Andrews, 2014; Ansdell et al., 2018; Facchini et al., 2019; Boyden & Eisner, 2020; Trapman et al., 2023). In addition, IRAS 23077+6707’s gas-to-dust emission ratio is , which is a factor 6 larger than observed for instance for IRAS 23077+6707’s (apparent) counterpart edge-on disk, Gomez’s Hamburger, which is only (cf. Bujarrabal et al., 2008, 2009; Teague et al., 2020). It remains unclear what is driving these features in the dust and gas properties of IRAS 23077+6707, but these two aspects in particular require further analysis with observations comparable in resolution and sensitivity to previous disk studies.
3.3 IRAS 23077+6707: an active planet-forming disk?
The flux asymmetries that are observed in the PS1 image of IRAS 23077+6707, with the western lobe being brighter than its eastern one, may be produced through different physical processes. For instance, the formation of such brightness asymmetries may happen in the very earliest stages of a YSO during the late infall of gas after the initial collapse phase of the forming star (Kuffmeier et al., 2021). However, there is growing evidence that brightness asymmetries may also have a planetary origin, either due to localized gravitational instabilities as a result of ongoing giant planet formation (e.g., Morales et al., 2019) or misaligned inner disks casting time-variable shadows on the outer disk due to warps created by super Jupiters (e.g. Nealon et al., 2018; Debes et al., 2023). Indeed, in the Pan-STARRS data, IRAS 23077+6707 shows striking similarity with the simulated scattered light images presented by Nealon et al. (2019, see their Fig. 6). These authors found that when a planet is massive enough to carve a gap and separate the inner from the outer disk (which is naturally the case for giant planets, cf. Lin & Papaloizou, 1986), warps will form across the planetary orbit, resulting in a misalignment between the inner and outer disk (Xiang-Gruess & Papaloizou, 2013; Nealon et al., 2018). Inner–outer disk misalignments of less then a degree are already able to cast shadows at larger stellocentric radii, resulting in additional brightness asymmetries between the upper and lower disk surfaces that can be readily observed in scattered light emission (i.e., in addition to the brightness asymmetry induced simply by the nearly edge-on orientations). The presence of such an asymmetry in IRAS 23077+6707’s disk thus hints at the presence of ongoing planet formation. Regardless, whichever precise mechanism is driving the asymmetry in IRAS 23077+6707’s disk, without access to high-angular resolution follow-up observations in near- and mid-IR, as well as (sub-)mm wavelengths, constraints on this asymmetry remain too weak to probe their origins.
| Flux | Asymmetries | ||||
| () | () | (′′) | (′′) | ||
| Scattered light | – | – | 1) East-West brightness asymmetry () | ||
| – | – | – | – | – | 2) North-South brightness asymmetry in left lobe () |
| – | – | – | – | – | 3) Two filaments extending northwards by |
| cont. | – | – | |||
| 12CO | – | 4) West–East (blue–red shifted) brightness asymmetry () | |||
| 13CO | – | – | |||
| C18O | – | – | |||
4 Summary and conclusions
In this work, we present the first resolved images of the giant edge-on protoplanetary disk IRAS 23077+6707 of thermal dust and gas emission with the Submillimeter Array (SMA) in direct comparison to optical scattered light with Pan-STARRS (PS1). Our main results can be summarized as follows:
-
1.
IRAS 23077+6707 shows a bright bipolar nebula, with a dark, optically obscured midplane indicative of a planet-forming disk that is observed nearly edge-on ().
-
2.
IRAS 23077+6707’s extent in optical scattered light emission spans at least on the sky, with a pair of asymmetric flared filaments additionally extending by northwards.
-
3.
Coincident with the scattered light disk traced by PS1, the SMA observations of IRAS 23077+6707 measure dust at and 12CO, 13CO and C18O =21 line emission out to – extents, with the gas being in Keplerian rotation.
-
4.
Finally, IRAS 23077+6707’s scattered light asymmetries open up the possibility that planets are currently forming within the disk.
Overall, the discovery of IRAS 23077+6707 presents us with a golden opportunity to investigate planet formation in one of the largest planet-forming disks ever discovered. The here presented observations provide the first joint optical and (sub-)mm analysis of this system.
Acknowledgments: KM was supported by NASA Chandra grants GO8-19015X, TM9-20001X, GO7-18017X, and HST-GO-15326. JBL acknowledges the Smithsonian Institute for funding via a Submillimeter Array (SMA) Fellowship. GE acknowledges the support of the German Academic Scholarship Foundation in the form of a PhD scholarship (“Promotionsstipendium der Studienstiftung des Deutschen Volkes”). JJD was funded by NASA contract NAS8-03060 to the Chandra X-ray Center and thanks the Director, Pat Slane, for continuing advice and support. The Submillimeter Array is a joint project between the Smithsonian Astrophysical Observatory and the Academia Sinica Institute of Astronomy and Astrophysics and is funded by the Smithsonian Institution and the Academia Sinica. The authors wish to recognize and acknowledge the very significant cultural role and reverence that the summit of Maunakea has always had within the indigenous Hawaiian community, where the Submillimeter Array (SMA) is located. We are most fortunate to have the opportunity to conduct observations from this mountain. We further acknowledge the operational staff and scientists involved in the collection of data presented here. The SMA data used here is from project 2022B-S054 and can be accessed via the Radio Telescope Data Center (RTDC) at https://lweb.cfa.harvard.edu/cgi-bin/sma/smaarch.pl after these have elapsed their proprietary access periods. The Pan-STARRS1 Surveys (PS1) and the PS1 public science archive have been made possible through contributions by the Institute for Astronomy, the University of Hawaii, the Pan-STARRS Project Office, the Max-Planck Society and its participating institutes, the Max Planck Institute for Astronomy, Heidelberg and the Max Planck Institute for Extraterrestrial Physics, Garching, The Johns Hopkins University, Durham University, the University of Edinburgh, the Queen’s University Belfast, the Harvard-Smithsonian Center for Astrophysics, the Las Cumbres Observatory Global Telescope Network Incorporated, the National Central University of Taiwan, the Space Telescope Science Institute, the National Aeronautics and Space Administration under Grant No. NNX08AR22G issued through the Planetary Science Division of the NASA Science Mission Directorate, the National Science Foundation Grant No. AST-1238877, the University of Maryland, Eotvos Lorand University (ELTE), the Los Alamos National Laboratory, and the Gordon and Betty Moore Foundation. This publication makes use of data products from the Wide-field Infrared Survey Explorer, which is a joint project of the University of California, Los Angeles, and the Jet Propulsion Laboratory/California Institute of Technology, funded by the National Aeronautics and Space Administration. This publication makes use of data products from the Two Micron All Sky Survey, which is a joint project of the University of Massachusetts and the Infrared Processing and Analysis Center/California Institute of Technology, funded by the National Aeronautics and Space Administration and the National Science Foundation.
References
- Adams et al. (1987) Adams, F. C., Lada, C. J., & Shu, F. H. 1987, ApJ, 312, 788, doi: 10.1086/164924
- Andrews (2020) Andrews, S. M. 2020, ARA&A, 58, 483, doi: 10.1146/annurev-astro-031220-010302
- Andrews et al. (2013) Andrews, S. M., Rosenfeld, K. A., Kraus, A. L., & Wilner, D. J. 2013, ApJ, 771, 129, doi: 10.1088/0004-637X/771/2/129
- Andrews et al. (2018) Andrews, S. M., Huang, J., Pérez, L. M., et al. 2018, ApJ, 869, L41, doi: 10.3847/2041-8213/aaf741
- Angelo et al. (2023) Angelo, I., Duchene, G., Stapelfeldt, K., et al. 2023, ApJ, 945, 130, doi: 10.3847/1538-4357/acbb01
- Ansdell et al. (2016) Ansdell, M., Williams, J. P., van der Marel, N., et al. 2016, ApJ, 828, 46, doi: 10.3847/0004-637X/828/1/46
- Ansdell et al. (2018) Ansdell, M., Williams, J. P., Trapman, L., et al. 2018, ApJ, 859, 21, doi: 10.3847/1538-4357/aab890
- Astropy Collaboration et al. (2013) Astropy Collaboration, Robitaille, T. P., Tollerud, E. J., et al. 2013, A&A, 558, A33, doi: 10.1051/0004-6361/201322068
- Astropy Collaboration et al. (2018) Astropy Collaboration, Price-Whelan, A. M., Sipőcz, B. M., et al. 2018, AJ, 156, 123, doi: 10.3847/1538-3881/aabc4f
- Astropy Collaboration et al. (2022) Astropy Collaboration, Price-Whelan, A. M., Lim, P. L., et al. 2022, apj, 935, 167, doi: 10.3847/1538-4357/ac7c74
- Barenfeld et al. (2016) Barenfeld, S. A., Carpenter, J. M., Ricci, L., & Isella, A. 2016, ApJ, 827, 142, doi: 10.3847/0004-637X/827/2/142
- Birnstiel & Andrews (2014) Birnstiel, T., & Andrews, S. M. 2014, ApJ, 780, 153, doi: 10.1088/0004-637X/780/2/153
- Boyden & Eisner (2020) Boyden, R. D., & Eisner, J. A. 2020, ApJ, 894, 74, doi: 10.3847/1538-4357/ab86b7
- Bujarrabal et al. (2009) Bujarrabal, V., Young, K., & Castro-Carrizo, A. 2009, A&A, 500, 1077, doi: 10.1051/0004-6361/200811233
- Bujarrabal et al. (2008) Bujarrabal, V., Young, K., & Fong, D. 2008, A&A, 483, 839, doi: 10.1051/0004-6361:20079273
- Burrows et al. (1996) Burrows, C. J., Stapelfeldt, K. R., Watson, A. M., et al. 1996, ApJ, 473, 437, doi: 10.1086/178156
- Carpenter et al. (2014) Carpenter, J. M., Ricci, L., & Isella, A. 2014, ApJ, 787, 42, doi: 10.1088/0004-637X/787/1/42
- Chambers et al. (2016) Chambers, K. C., Magnier, E. A., Metcalfe, N., et al. 2016, arXiv e-prints, arXiv:1612.05560, doi: 10.48550/arXiv.1612.05560
- Chiang & Goldreich (1999) Chiang, E. I., & Goldreich, P. 1999, ApJ, 519, 279, doi: 10.1086/307351
- Cieza et al. (2019) Cieza, L. A., Ruíz-Rodríguez, D., Hales, A., et al. 2019, MNRAS, 482, 698, doi: 10.1093/mnras/sty2653
- Cutri et al. (2021) Cutri, R. M., Wright, E. L., Conrow, T., et al. 2021, VizieR Online Data Catalog, II/328
- Debes et al. (2023) Debes, J., Nealon, R., Alexander, R., et al. 2023, ApJ, 948, 36, doi: 10.3847/1538-4357/acbdf1
- Duchene et al. (2023) Duchene, G., Menard, F., Stapelfeldt, K., et al. 2023, arXiv e-prints, arXiv:2309.07040, doi: 10.48550/arXiv.2309.07040
- Facchini et al. (2019) Facchini, S., van Dishoeck, E. F., Manara, C. F., et al. 2019, A&A, 626, L2, doi: 10.1051/0004-6361/201935496
- Flewelling et al. (2020) Flewelling, H. A., Magnier, E. A., Chambers, K. C., et al. 2020, ApJS, 251, 7, doi: 10.3847/1538-4365/abb82d
- Flores et al. (2021) Flores, C., Duchêne, G., Wolff, S., et al. 2021, AJ, 161, 239, doi: 10.3847/1538-3881/abeb1e
- Ginsburg et al. (2016) Ginsburg, A., Robitaille, T., & Beaumont, C. 2016, pvextractor: Position-Velocity Diagram Extractor, Astrophysics Source Code Library, record ascl:1608.010. http://ascl.net/1608.010
- Green (2018) Green, G. M. 2018, Journal of Open Source Software, 3, 695, doi: 10.21105/joss.00695
- Greene et al. (1994) Greene, T. P., Wilking, B. A., Andre, P., Young, E. T., & Lada, C. J. 1994, ApJ, 434, 614, doi: 10.1086/174763
- Harris et al. (2020) Harris, C. R., Millman, K. J., van der Walt, S. J., et al. 2020, Nature, 585, 357, doi: 10.1038/s41586-020-2649-2
- Hazelton et al. (2017) Hazelton, B. J., Jacobs, D. C., Pober, J. C., & Beardsley, A. P. 2017, The Journal of Open Source Software, 2, 140, doi: 10.21105/joss.00140
- Ho et al. (2004) Ho, P. T. P., Moran, J. M., & Lo, K. Y. 2004, ApJ, 616, L1, doi: 10.1086/423245
- Hunter (2007) Hunter, J. D. 2007, Computing in Science & Engineering, 9, 90, doi: 10.1109/MCSE.2007.55
- Kerr et al. (2023) Kerr, R., Kraus, A. L., & Rizzuto, A. C. 2023, ApJ, 954, 134, doi: 10.3847/1538-4357/ace5b3
- Kuffmeier et al. (2021) Kuffmeier, M., Dullemond, C. P., Reissl, S., & Goicovic, F. G. 2021, A&A, 656, A161, doi: 10.1051/0004-6361/202039614
- Kun et al. (2009) Kun, M., Balog, Z., Kenyon, S. J., Mamajek, E. E., & Gutermuth, R. A. 2009, ApJS, 185, 451, doi: 10.1088/0067-0049/185/2/451
- Kun et al. (2008) Kun, M., Kiss, Z. T., & Balog, Z. 2008, in Handbook of Star Forming Regions, Volume I, ed. B. Reipurth, Vol. 4, 136, doi: 10.48550/arXiv.0809.4761
- Lada (1987) Lada, C. J. 1987, in Star Forming Regions, ed. M. Peimbert & J. Jugaku, Vol. 115, 1
- Lasker et al. (1996) Lasker, B. M., Doggett, J., McLean, B., et al. 1996, in Astronomical Society of the Pacific Conference Series, Vol. 101, Astronomical Data Analysis Software and Systems V, ed. G. H. Jacoby & J. Barnes, 88
- Lin & Papaloizou (1986) Lin, D. N. C., & Papaloizou, J. 1986, ApJ, 307, 395, doi: 10.1086/164426
- Long et al. (2018) Long, F., Pinilla, P., Herczeg, G. J., et al. 2018, ApJ, 869, 17, doi: 10.3847/1538-4357/aae8e1
- Lovell et al. (2021) Lovell, J. B., Wyatt, M. C., Ansdell, M., et al. 2021, MNRAS, 500, 4878, doi: 10.1093/mnras/staa3335
- Manara et al. (2023) Manara, C. F., Ansdell, M., Rosotti, G. P., et al. 2023, in Astronomical Society of the Pacific Conference Series, Vol. 534, Protostars and Planets VII, ed. S. Inutsuka, Y. Aikawa, T. Muto, K. Tomida, & M. Tamura, 539, doi: 10.48550/arXiv.2203.09930
- Manara et al. (2018) Manara, C. F., Morbidelli, A., & Guillot, T. 2018, A&A, 618, L3, doi: 10.1051/0004-6361/201834076
- McMullin et al. (2007) McMullin, J. P., Waters, B., Schiebel, D., Young, W., & Golap, K. 2007, in Astronomical Society of the Pacific Conference Series, Vol. 376, Astronomical Data Analysis Software and Systems XVI, ed. R. A. Shaw, F. Hill, & D. J. Bell, 127
- Melis et al. (2011) Melis, C., Duchêne, G., Chomiuk, L., et al. 2011, ApJ, 739, L7, doi: 10.1088/2041-8205/739/1/L7
- Minkowski & Abell (1963) Minkowski, R. L., & Abell, G. O. 1963, in Basic Astronomical Data: Stars and Stellar Systems, ed. K. A. Strand, 481
- Morales et al. (2019) Morales, J. C., Mustill, A. J., Ribas, I., et al. 2019, Science, 365, 1441, doi: 10.1126/science.aax3198
- Mulders et al. (2021) Mulders, G. D., Pascucci, I., Ciesla, F. J., & Fernandes, R. B. 2021, ApJ, 920, 66, doi: 10.3847/1538-4357/ac178e
- Nealon et al. (2018) Nealon, R., Dipierro, G., Alexander, R., Martin, R. G., & Nixon, C. 2018, MNRAS, 481, 20, doi: 10.1093/mnras/sty2267
- Nealon et al. (2019) Nealon, R., Pinte, C., Alexander, R., Mentiplay, D., & Dipierro, G. 2019, MNRAS, 484, 4951, doi: 10.1093/mnras/stz346
- Padgett et al. (1999) Padgett, D. L., Brandner, W., Stapelfeldt, K. R., et al. 1999, AJ, 117, 1490, doi: 10.1086/300781
- Ribas et al. (2017) Ribas, Á., Espaillat, C. C., Macías, E., et al. 2017, ApJ, 849, 63, doi: 10.3847/1538-4357/aa8e99
- Robitaille & Bressert (2012) Robitaille, T., & Bressert, E. 2012, APLpy: Astronomical Plotting Library in Python, Astrophysics Source Code Library, record ascl:1208.017. http://ascl.net/1208.017
- Robitaille et al. (2006) Robitaille, T. P., Whitney, B. A., Indebetouw, R., Wood, K., & Denzmore, P. 2006, ApJS, 167, 256, doi: 10.1086/508424
- Ruiz et al. (1987) Ruiz, M. T., Blanco, V., Maza, J., et al. 1987, ApJ, 316, L21, doi: 10.1086/184884
- Sauter et al. (2009) Sauter, J., Wolf, S., Launhardt, R., et al. 2009, A&A, 505, 1167, doi: 10.1051/0004-6361/200912397
- Skrutskie et al. (2006) Skrutskie, M. F., Cutri, R. M., Stiening, R., et al. 2006, AJ, 131, 1163, doi: 10.1086/498708
- Stapelfeldt et al. (2014) Stapelfeldt, K. R., Duchêne, G., Perrin, M., et al. 2014, in Exploring the Formation and Evolution of Planetary Systems, ed. M. Booth, B. C. Matthews, & J. R. Graham, Vol. 299, 99–103, doi: 10.1017/S1743921313008004
- Szilágyi et al. (2021) Szilágyi, M., Kun, M., & Ábrahám, P. 2021, MNRAS, 505, 5164, doi: 10.1093/mnras/stab1496
- Teague (2019) Teague, R. 2019, The Journal of Open Source Software, 4, 1632, doi: 10.21105/joss.01632
- Teague & Foreman-Mackey (2018) Teague, R., & Foreman-Mackey, D. 2018, Research Notes of the American Astronomical Society, 2, 173, doi: 10.3847/2515-5172/aae265
- Teague et al. (2020) Teague, R., Jankovic, M. R., Haworth, T. J., Qi, C., & Ilee, J. D. 2020, MNRAS, 495, 451, doi: 10.1093/mnras/staa1167
- Trapman et al. (2023) Trapman, L., Rosotti, G., Zhang, K., & Tabone, B. 2023, ApJ, 954, 41, doi: 10.3847/1538-4357/ace7d1
- Villenave et al. (2020) Villenave, M., Ménard, F., Dent, W. R. F., et al. 2020, A&A, 642, A164, doi: 10.1051/0004-6361/202038087
- Villenave et al. (2023) Villenave, M., Stapelfeldt, K. R., Duchene, G., et al. 2023, arXiv e-prints, arXiv:2311.07668, doi: 10.48550/arXiv.2311.07668
- Watson & Stapelfeldt (2004) Watson, A. M., & Stapelfeldt, K. R. 2004, ApJ, 602, 860, doi: 10.1086/381142
- Watson et al. (2007) Watson, A. M., Stapelfeldt, K. R., Wood, K., & Ménard, F. 2007, in Protostars and Planets V, ed. B. Reipurth, D. Jewitt, & K. Keil, 523, doi: 10.48550/arXiv.0707.2608
- Williams & Cieza (2011) Williams, J. P., & Cieza, L. A. 2011, ARA&A, 49, 67, doi: 10.1146/annurev-astro-081710-102548
- Wolf et al. (2003) Wolf, S., Padgett, D. L., & Stapelfeldt, K. R. 2003, ApJ, 588, 373, doi: 10.1086/374041
- Wolff et al. (2021) Wolff, S. G., Duchêne, G., Stapelfeldt, K. R., et al. 2021, AJ, 161, 238, doi: 10.3847/1538-3881/abeb1d
- Wouterloot & Brand (1989) Wouterloot, J. G. A., & Brand, J. 1989, A&AS, 80, 149
- Wouterloot et al. (1993) Wouterloot, J. G. A., Brand, J., & Fiegle, K. 1993, A&AS, 98, 589
- Xiang-Gruess & Papaloizou (2013) Xiang-Gruess, M., & Papaloizou, J. C. B. 2013, MNRAS, 431, 1320, doi: 10.1093/mnras/stt254