Demonstration of a high-volume tunable axion haloscope above 7 GHz
Abstract
We present results from the first experimental demonstration of a tunable thin-shell axion haloscope. This novel geometry decouples the overall volume of the cavity-based resonator from its resonant frequency, thereby evading the steep sensitivity degradation at high-frequencies. An aluminum 2.6 L () prototype which tunes from 7.1 to 8.0 GHz was fabricated and characterized at room temperature. An axion-sensitive, straightforwardly tunable TM010 mode is clearly identified with a room temperature quality factor, , of 5,000. The on-resonance -field distribution is mapped and found to agree with numerical calculations. Anticipating future cryogenic operation, we develop an alignment protocol relying only on rf measurements of the cavity, maintaining a form factor of 0.57 across the full tuning range. These measurements demonstrate the feasibility of cavity-based haloscopes with operating volume . We discuss plans for future development and the parameters required for a thin-shell haloscope exploring the post-inflationary axion parameter space (4 to 30 GHz) at DFSZ sensitivity.
I Introduction
A range of astrophysical and cosmological observations point to the existence of dark matter (DM), but the particles of which it consists have remained elusive [1, 2, 3, 4]. One of the most promising candidates for DM is the axion [5, 6, 7], which also solves the long-standing strong CP problem in particle physics [8, 9, 10].
A well-established type of axion search experiment is the haloscope, which consists of a resonating cavity immersed in a strong magnetic field [11, 12, 13, 14]. The magnetic field interacts with putative ambient axions with coupling constant , converting them into a weak photon signal (e.g., [15]). This signal resonantly drives the cavity at a frequency equal (in natural units) to the axion’s mass, an unknown parameter. In this letter, we report an experimental validation of a novel axion haloscope design that can extend axion sensitivity to frequencies above GHz.
The axion parameter space is scanned by tuning the resonant frequency of the haloscope. Integrating for longer at a certain tightens the upper bound on the coupling constant for DM of mass . The rate at which a haloscope can scan across while reaching a given upper bound on the coupling is known as its scan rate, . Considering only properties of the haloscope’s resonator,
| (1) |
where is the resonator’s volume, is its quality factor, and is the form factor of the axion-sensitive resonating mode, defined as
| (2) |
where is the external magnetic field and is the electric field of the mode. The second equality in Eq. 2 holds for cavities placed in a solenoid where , so and is uniform. The mode most sensitive to axions is that with aligned with and with wavelength such that one half-cycle occupies the entire cavity. At frequencies around 1 GHz, haloscopes based on cylindrical cavities [12, 14] have reached sensitivity to Dine-Fischler-Srednicki-Zhitnitsky (DFSZ) models [16, 17]. However, the active volume of a proportionally scaled cylindrical haloscope decreases rapidly as increases. Since the scan rate scales as , it becomes prohibitive to cover the frequency range predicted for post-inflationary axion scenarios ( GHz) [18, 5, 19, 20, 21] down to the DFSZ limits.
In this work, we perform the first characterization of a prototype cavity implementing geometry proposed in [22] and [23] that alleviates the steep scaling of volume with frequency. Importantly, we show that the efficiency loss due to mode crossing in such an overmoded cavity is modest over a large frequency range. An overview of the novel geometry is presented in Sec. II. Details on the characterization of the prototype are given in Secs. III.1, III.2, and III.3, and results are presented in Sec. III.4. Finally, we discuss expansions to the design and the prospects for this high-frequency haloscope in Sec. IV.
II The Thin-Shell Geometry
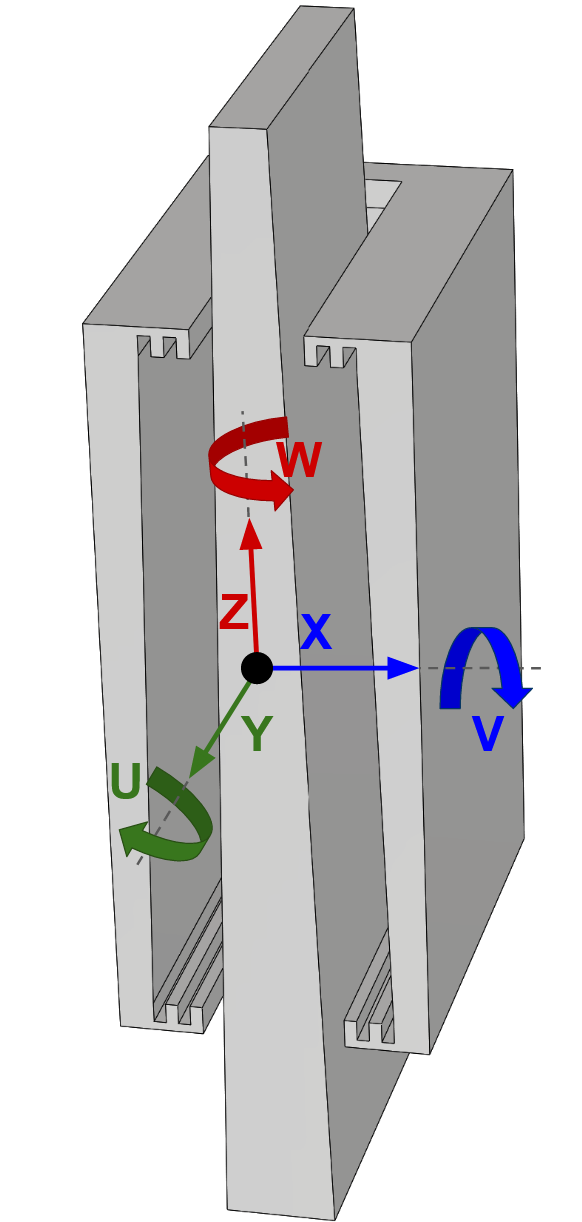
It is possible to decouple the scan rate from by departing from the conventional cavity geometry. Reference [23] provides a prescription to create tunable volume-filling thin-shell cavities with uniformly polarized eigenmodes. The simplest implementation of such a design consists of a rectangular wedge surrounded by a mechanically separate shell, shown in Fig. 1, where the coordinates used throughout this paper are also defined.
In the resulting cavity (a thin shell of vacuum space), standing waves in the X direction create a spatially uniform Z-polarized mode that maximizes . In keeping with the terminology from cylindrical resonators, we call this the TM010 mode. Its resonant frequency is set by the gap width. The volume, on the other hand, can be scaled up by increasing the other dimensions to the size of the magnet bore without affecting .
The cavity is tuned by moving the shell vertically along the wedge. Because the wedge and inner shell walls are tilted, such motion changes the width of the gap between them, thus tuning the TM010 mode. Note that the wedge must be longer than the shell to allow tuning. The shell also has corrugated end caps, thus reducing radiative losses and improving [22]. As described in the reference, these corrugations are deep and confine the fields to within the cavity. Note that for the TM010 mode to be supported with appreciable , the two parts of the resonator must be sufficiently well aligned.
III The Prototype Cavity
III.1 Experimental setup
An aluminum resonator with the geometry discussed in Sec. II was constructed and studied. The wedge measures 40 cm tall, and the shell is 24 cm tall by 24 cm wide and 7 cm deep. The shell consists of six flat plates and was assembled using precision parallels for alignment and spacing. Both the wedge and the inner surfaces of the shell were lapped down to a maximum deviation from the plane of 10 m to improve . The surface flatness is verified using a capacitive displacement sensor from Micro-Epsilon.
The rectangular wedge is mounted vertically on a Newport Hexapod (HXP100V6-MECA) six-axis positioner. The shell is mounted to a single-axis positioner colinear with the Z axis. Both positioners are mounted on a leveled, low-vibration optical table. The resonator was designed to tune from 6.8 to 8.3 GHz. However, the maximum travel of the Z-axis positioner is 10 cm, which limits the tuning range.
The rf response of the haloscope is probed with a 6.8 cm copper antenna mounted on an SMA feedthrough to the shell at the top on the Y side of the cavity. Cavity resonances are probed via reflection measurement of this antenna using a commercial vector network analyzer (VNA). The antenna is weakly coupled to the cavity (), probing the unloaded of the resonator.
III.2 Mode identification
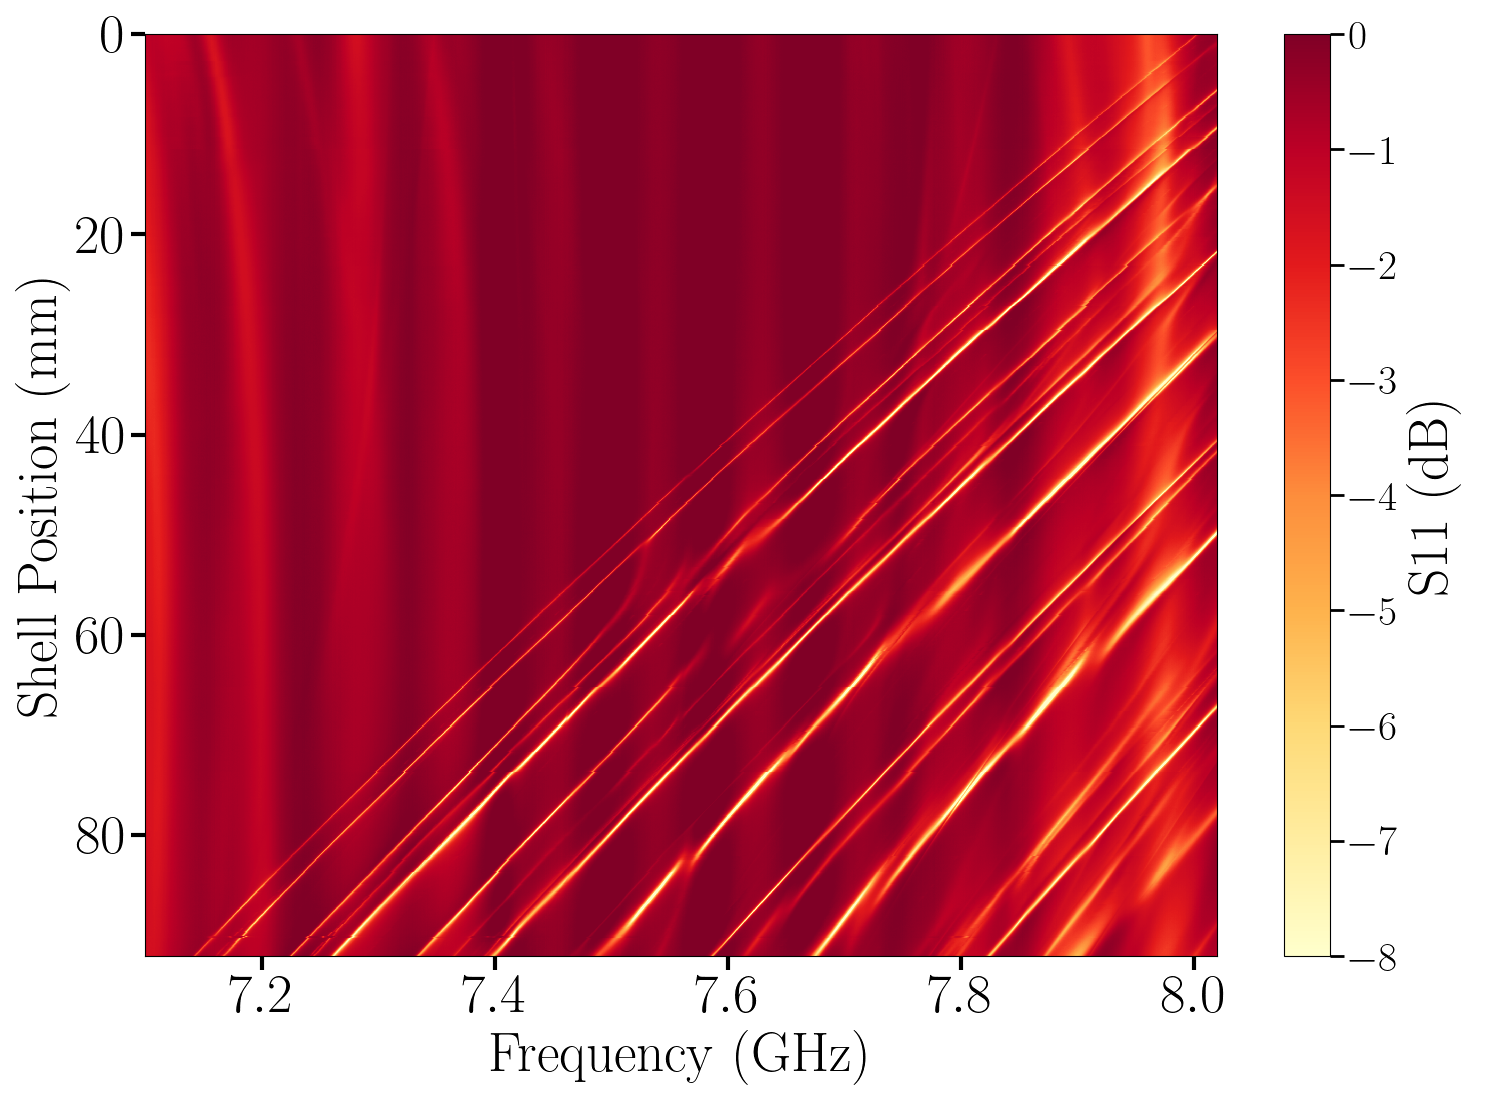
A simple alignment using caliper measurements was sufficient to produce a resonance with the expected tuning properties. The observed frequency is 15.2 MHz lower than predicted (0.2%), likely due to imperfect cavity construction. We proceed to verify that the detected mode is indeed the axion-sensitive TM010 mode against the background of spurious modes (see Fig. 2) by comparing its properties to those calculated using finite element analysis (FEA) by COMSOL-RF using two methods.
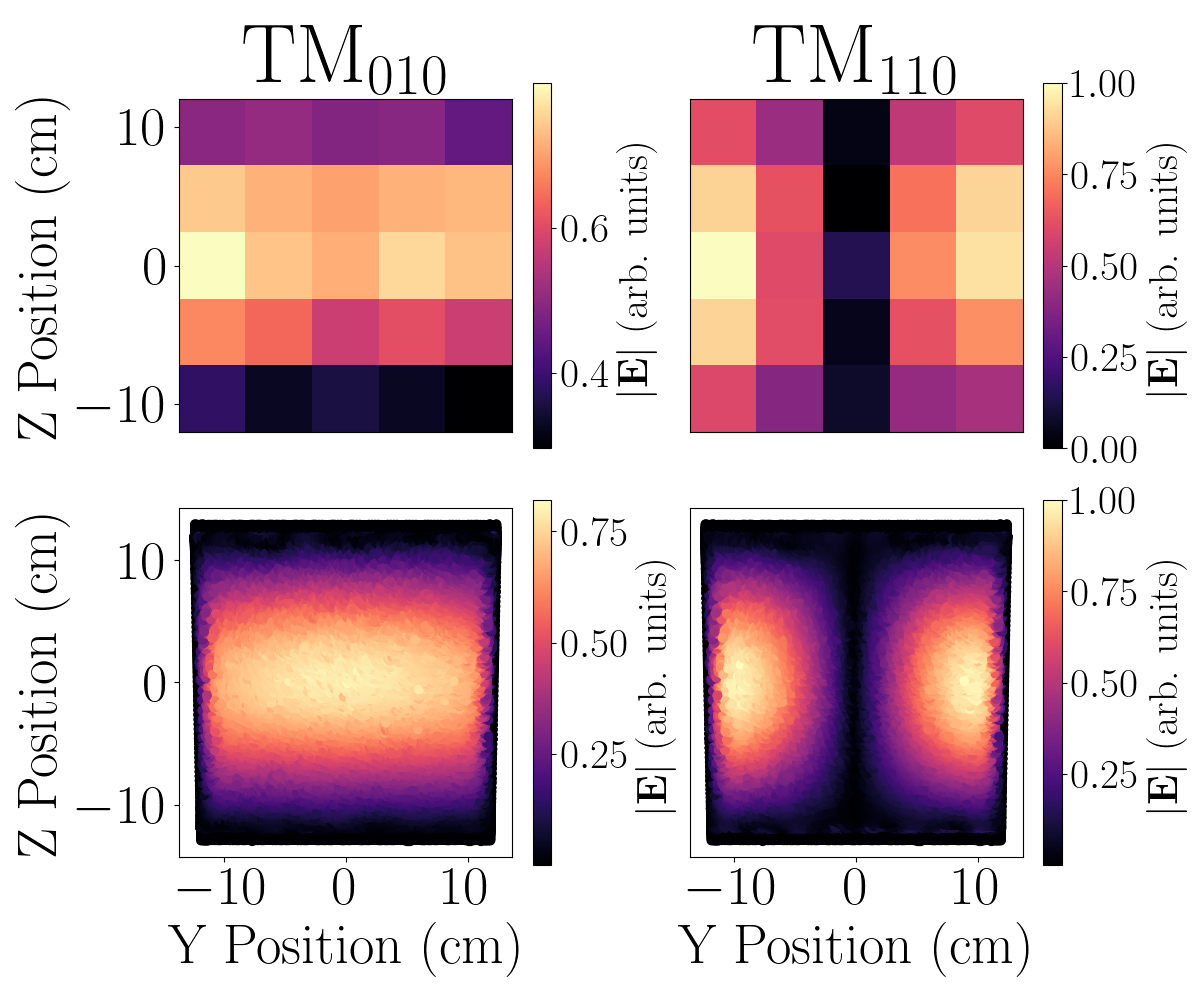
First, we measure the spatial distribution of the electric field inside the cavity using the “bead perturbation” technique [24]. When a dielectric probe is placed in a resonating cavity, the frequency of each mode shifts proportionally to the square of the electric field of that mode in the probe’s location. In our experiment, the probes are Zotefoam HD30 disks, 19 mm in diameter and 14.3 mm thick. The choice of a larger probe with a low dielectric constant (over a more conventional probe consisting of a small bead with high ) is motivated by the large survey volume and the low spatial resolution required. Maps of within the cavity were produced by placing the probe at 25 evenly spaced points in each of the front (X) and rear (X) half of the cavity. The first row of Fig. 3 shows the front field maps of the modes with the lowest and second lowest frequency, while the bottom row shows the matching field maps produced by FEA, that of the TM010 and TM110 modes.
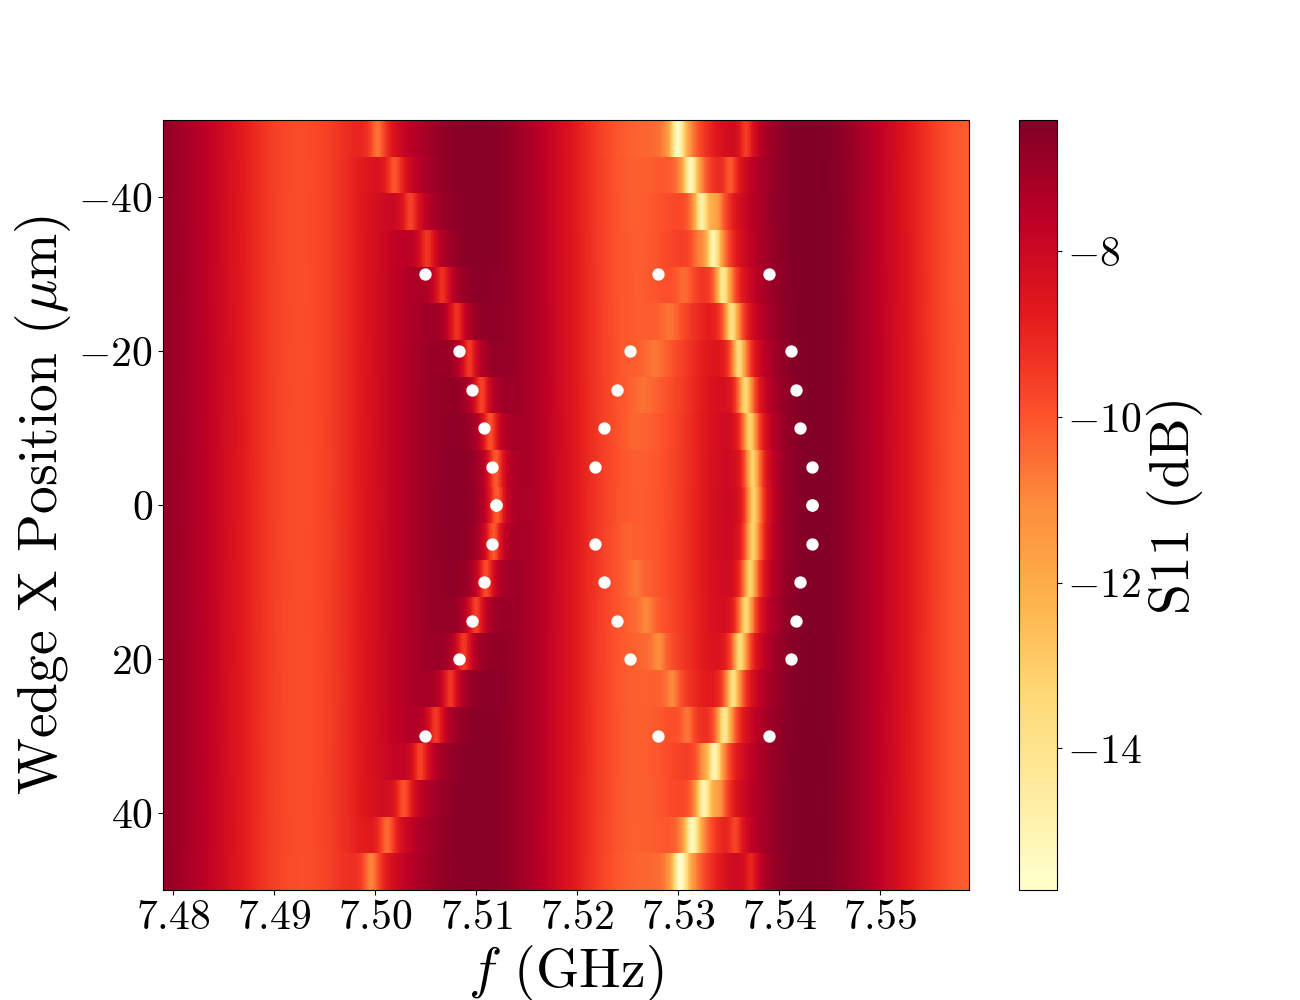
Next, we corroborated these results by observing the responses of the modes’ resonant frequencies to induced wedge misalignment. To do so, reflection measurements of the cavity were taken for several wedge positions along the X-axis, shown in Fig. 4. In this figure, the resonant frequency given by FEA for the lowest three modes at several X positions is overplotted in white, uniformly shifted by 15.23 MHz to match the TM010 mode’s frequency to the reflection measurements. We observe excellent agreements between the measured and simulated responses to misalignment for the first three resonances.
A feature of note in Fig. 4 is the avoided crossing between the two lowest modes. This behavior is consistent with the expectation of two coupled harmonic oscillators – the front (X) and rear (X) halves of the cavity. Furthermore, the next-lowest mode disappears when the wedge is aligned. This is expected because this mode corresponds to the anti-symmetric hybridization of the two halves. Since the antenna probe is located at the node, the coupling vanishes when the wedge is centered.
We have thus associated the physical modes in the cavity with those simulated in FEA and confirmed that the axion-sensitive mode is supported in the cavity.
III.3 Cavity alignment using rf measurements
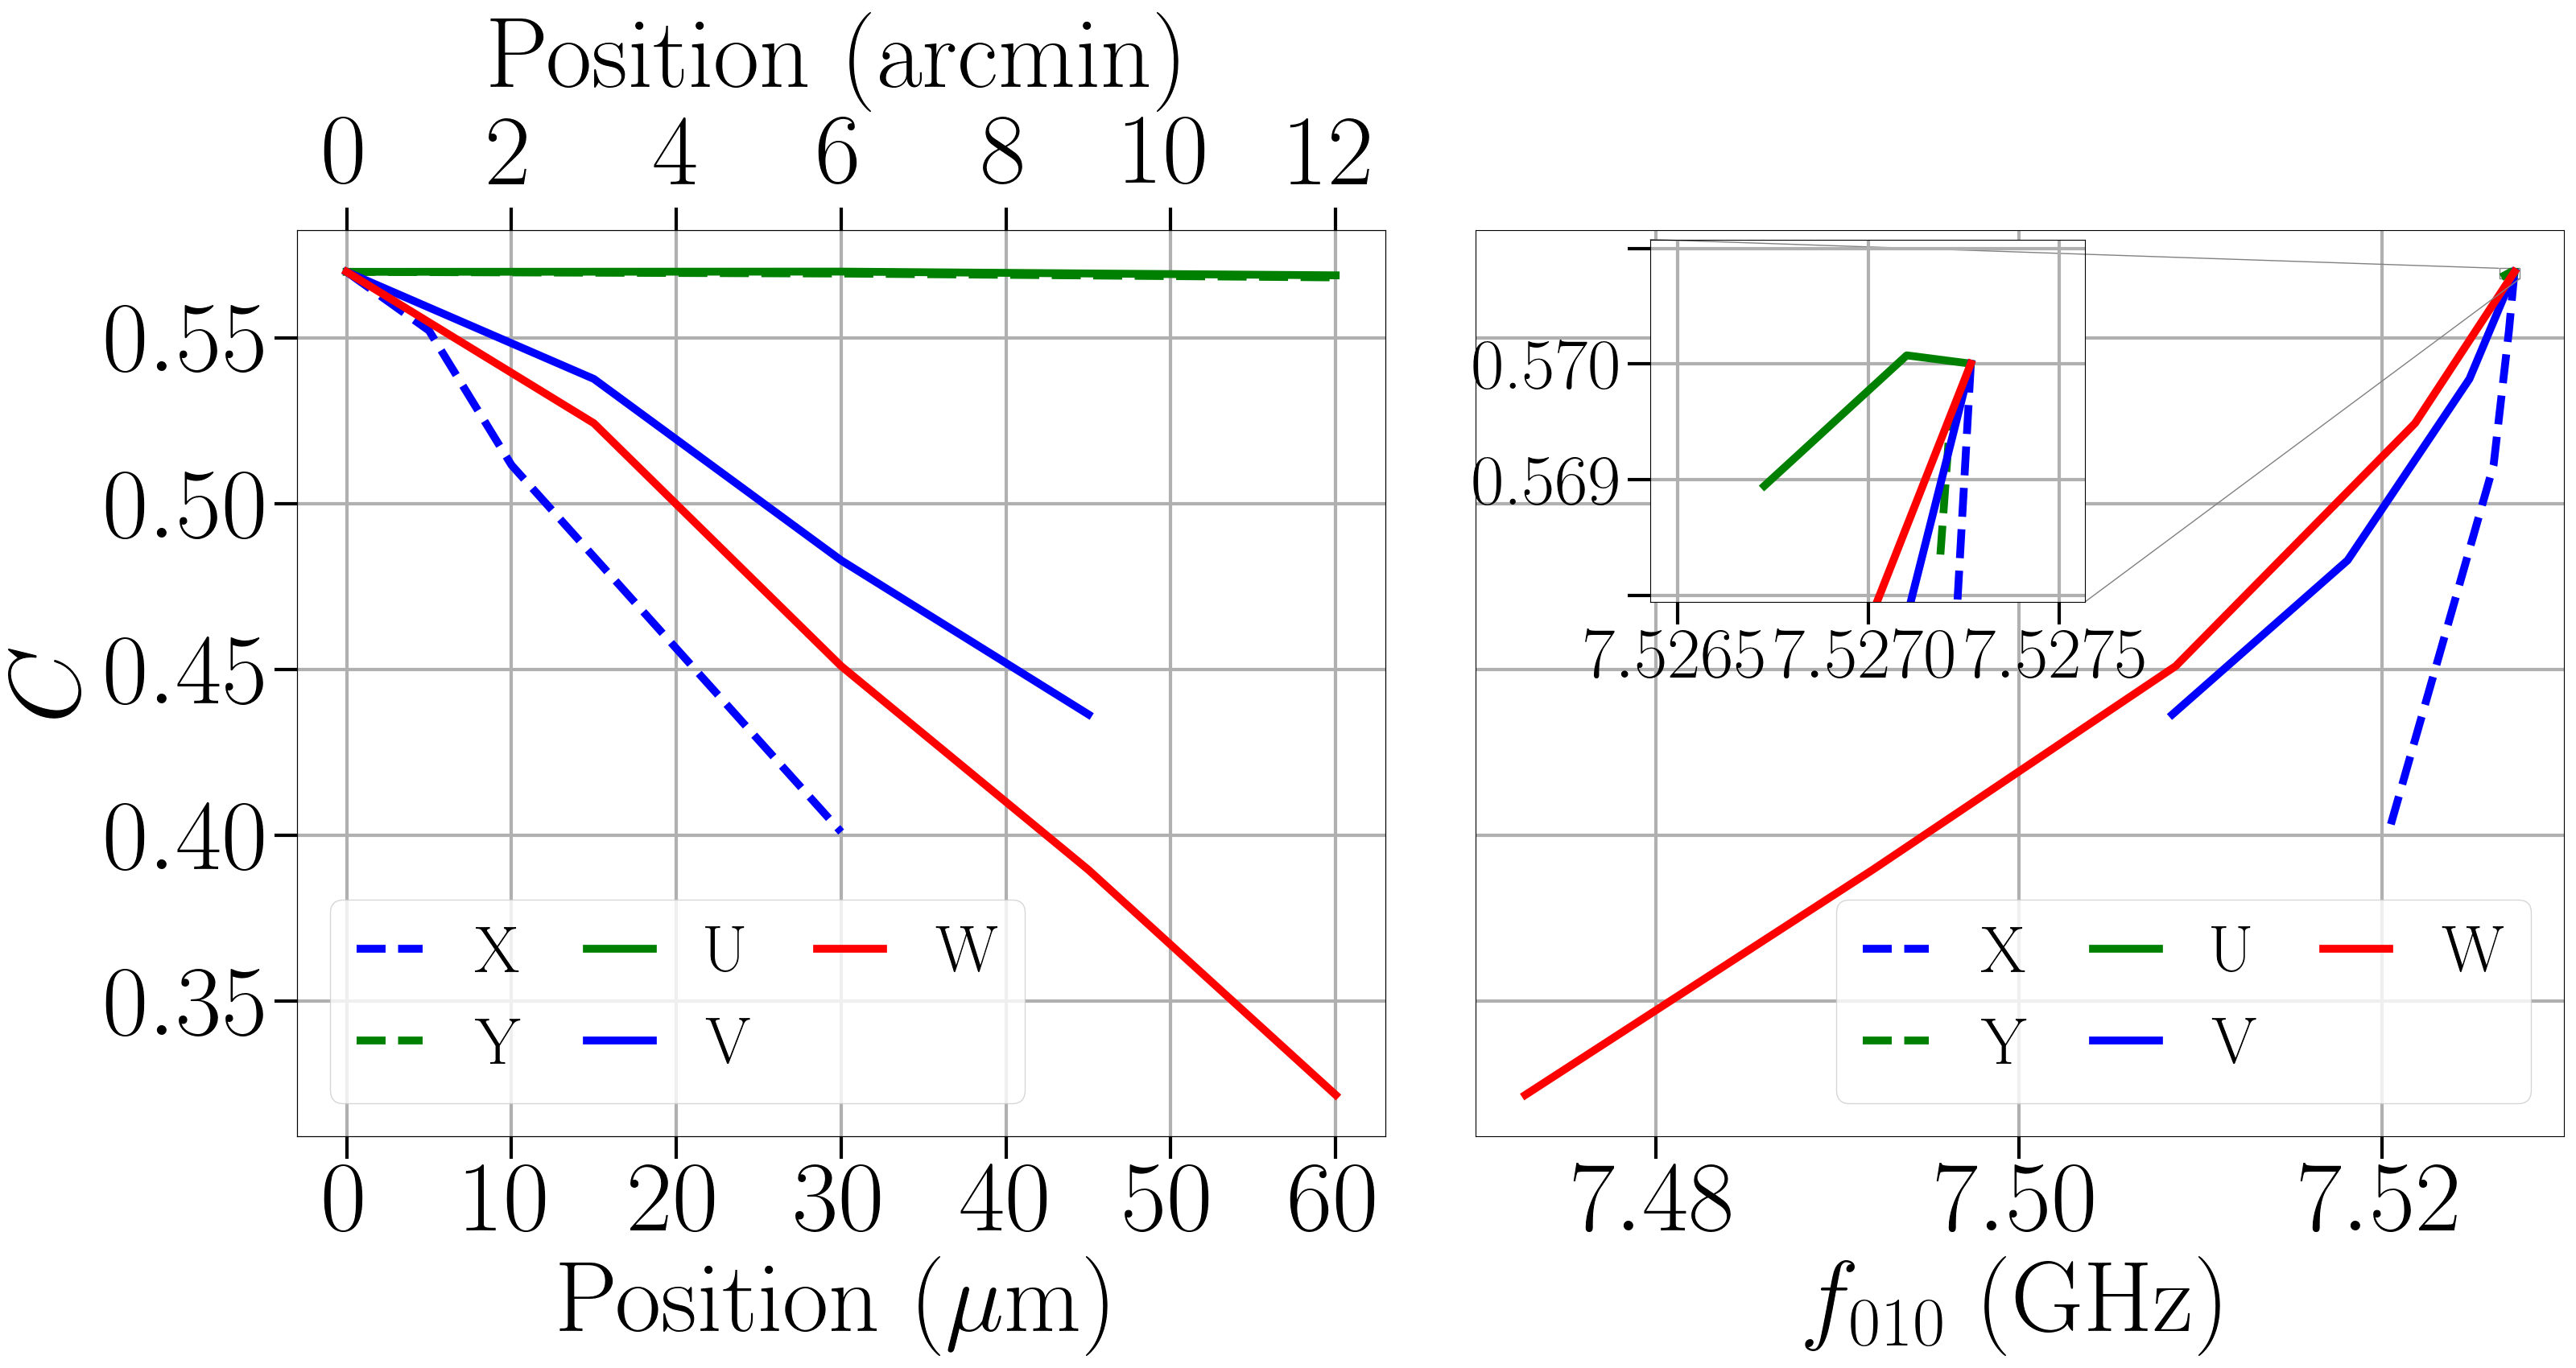
Precision alignment of the wedge to the shell is important for optimal for the TM010 mode. The simulated effects of wedge misalignment on are shown in the left panel of Fig. 5, while the right panel shows the effects of those same misalignments on and together. When the wedge is misaligned, and is thus decreased, some part of the cavity must widen, driving lower. This can also be seen in Fig. 4: the aligned position has the highest . Since decreases monotonically with , aligning the wedge by maximizing will also maximize . This correspondence enables alignment without measurements beyond the usual rf characterization of the cavity, which is indispensable in cryogenic environments where other measurements are impractical.
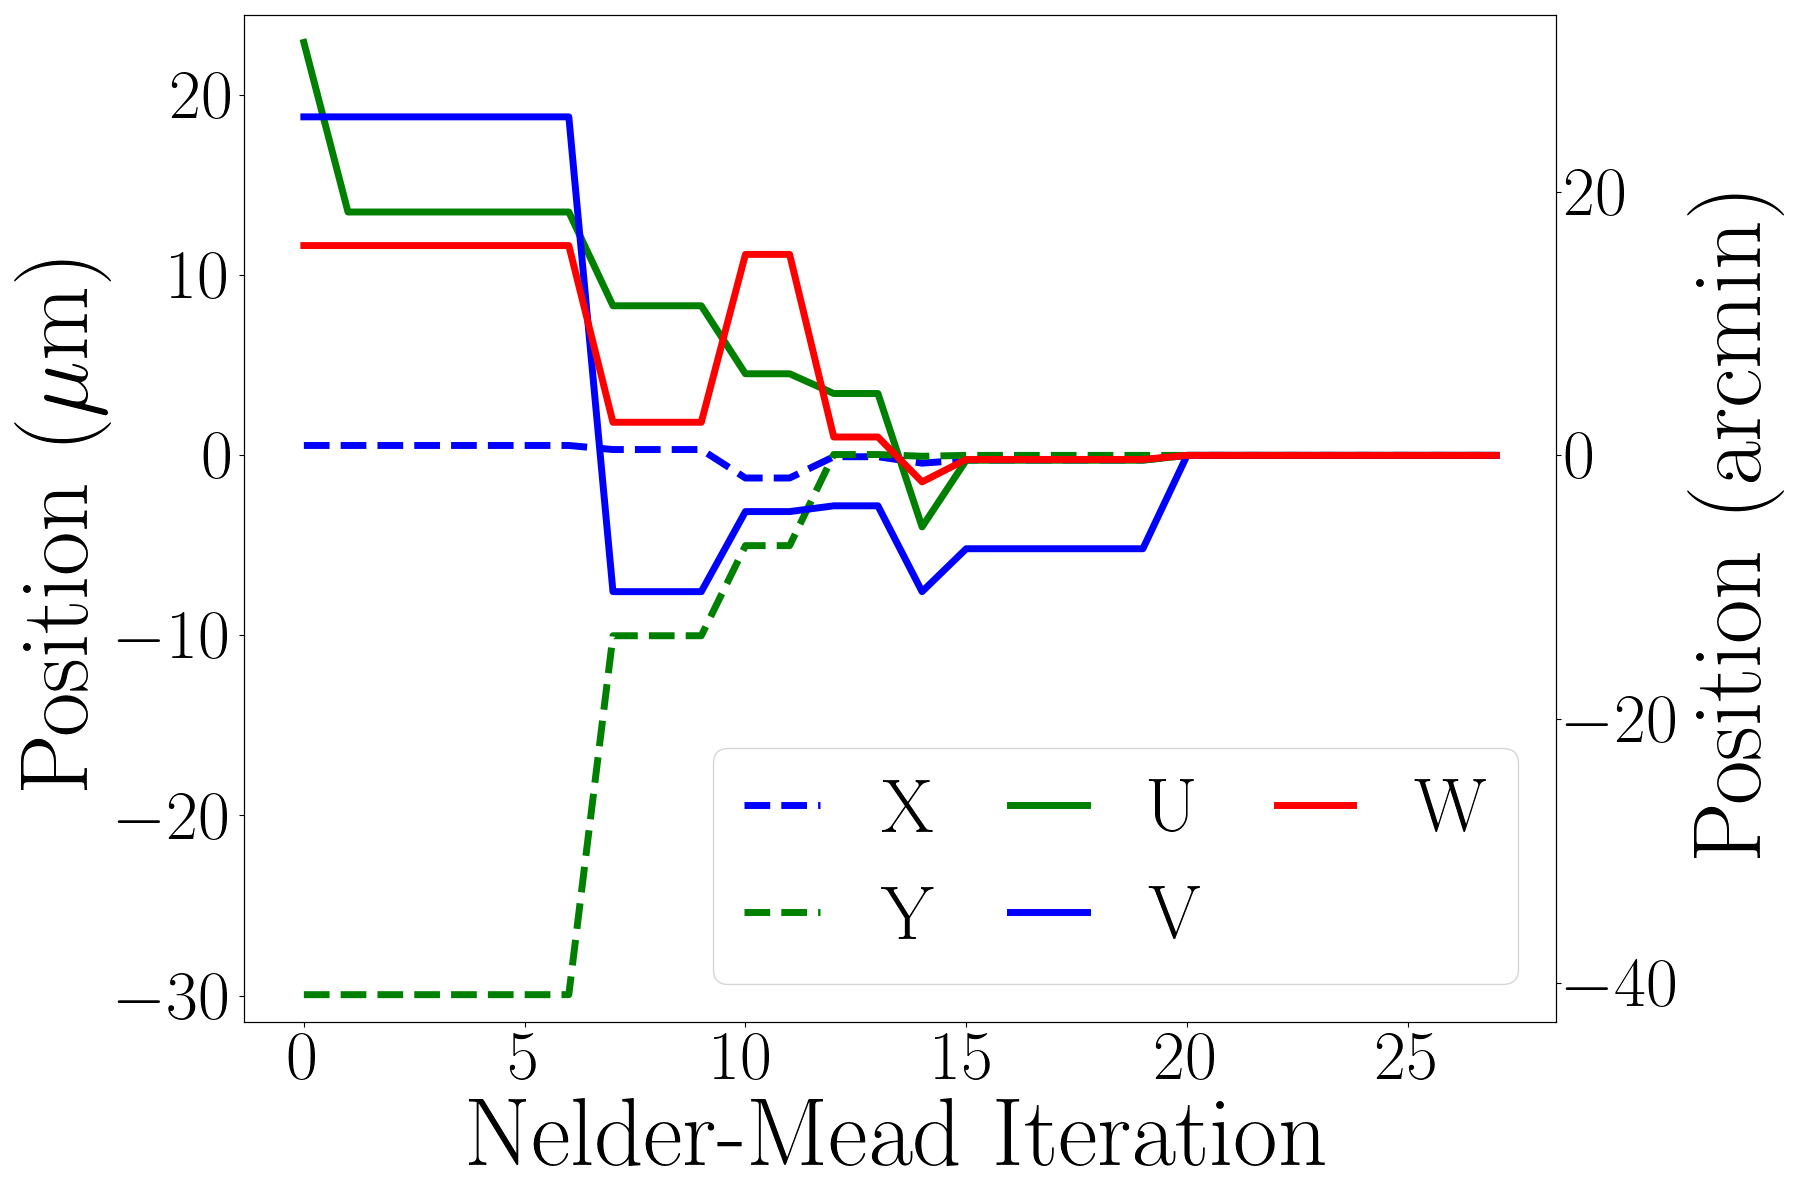
We developed an automated alignment algorithm to maximize (and thus ) as a function of wedge position in each direction except Z (the tuning direction), including rotations. Given a position, the 6-axis hexapod places the wedge there. Then, an rf reflection measurement of the cavity with a VNA produces the cavity spectrum, from which can be extracted. The above process is iterated, optimizing for maximum , until the optimization algorithm converges. A standard Nelder-Mead (NM) optimization algorithm was chosen to minimize the 5-dimensional function. The optimization is set to converge when all vertices of the parameter simplex are separated by no more than 1 m for the linear dimensions and 3.6 arcseconds for the angular dimensions. As can be seen in Fig. 4, there are no false local maxima near the aligned position. The wedge’s position during a representative alignment can be seen in Fig. 6. Each function evaluation takes 1 s, and each alignment requires evaluations ( NM iterations). The successful implementation of the automated alignment was crucial in obtaining the data shown in Fig. 2, a key result of this letter.
The error on the aligned position of the wedge is estimated by aligning it 100 times, starting from uniformly random wedge positions. The error on the alignment position in each direction is then taken to be the standard deviation of the final aligned positions, and are recorded in Table 1.
| Axis |
|
|
|
|
|
||||||||||
|---|---|---|---|---|---|---|---|---|---|---|---|---|---|---|---|
| 2 | 10 | 0.4 | 0.2 | 0.1 |
III.4 Haloscope figures of merit
Here we summarize the cavity’s relevant parameters for use as a haloscope, taking into account the alignment technique discussed above.
Since requires information about the direction of inside the cavity, it cannot be measured directly. Instead, we calculate it from the FEA, which predicts that the fully aligned cavity has . The positioning error of the wedge around the aligned position after alignment (Table 1) results in negligible degradation of , see Fig. 5, left panel.
The cavity tunes linearly from 7.10 to 8.02 GHz, with no observed mode crossings (see Fig. 2). Alignments were performed every 0.4 mm to keep throughout. Over this tuning range, four hours were spent on alignment, which is small compared to the expected data collection time during a future axion search. The demonstrated tuning range of is smaller than the design range of due to limitations in the mechanical setup and the coupling strength with the given antenna probe.
At room temperature, the aluminum cavity’s TM010 mode has a median of 4,700 throughout the full tuning range shown in Fig. 2. FEA indicates that plating the cavity with copper and cooling to 100 mK will increase to , as radiative loss through the top and bottom gaps starts to become important.
The cavity has volume L, or 41 , at 7.5 GHz. For a comparison with other experiments targeting a similar frequency range, see Table 2.
| Experiment | (GHz) | (L2) | |
| This work (cryogenic) | 7.5 | 41 | 15,000 |
| HAYSTAC [25] | 4.7 | 6.0 | 2,600 |
| CAPP quad-cell [26] | 5.89 | 8.2 | 3,100 |
| HAYSTAC 7-rod [27] | 6.5 | 17 | 5,800 |
| QUAX [28] | 10.35 | 44 | 1,200 |
| GigaBREAD [29] | 11.6 | 390 | 110 |
| ORGAN [30] | 26.5 | 11 | 0.23 |
IV Discussion
The axion scan rate can be further improved by copper-plating, cooling the haloscope to cryogenic temperatures, and stacking multiple wedge cavities (in the X direction) to form a larger volume. In the multi-wedge design, the sub-cavities are left open to each other, so a single axion-sensitive mode occupies the entire space.
Efforts are being made to develop a meter-scale cavity for cryogenic operations to verify the expected improvements to at low temperatures and tackle challenges relating to cryogenic positional control of the wedge. A three-wedge prototype is being developed to demonstrate the alignment of all wedges simultaneously. Additionally, an antenna scheme capable of coupling more strongly ( to ) to thin-shell cavities is under development. We baseline a science-grade 5–8 GHz haloscope on a copper-plated three-wedge design.
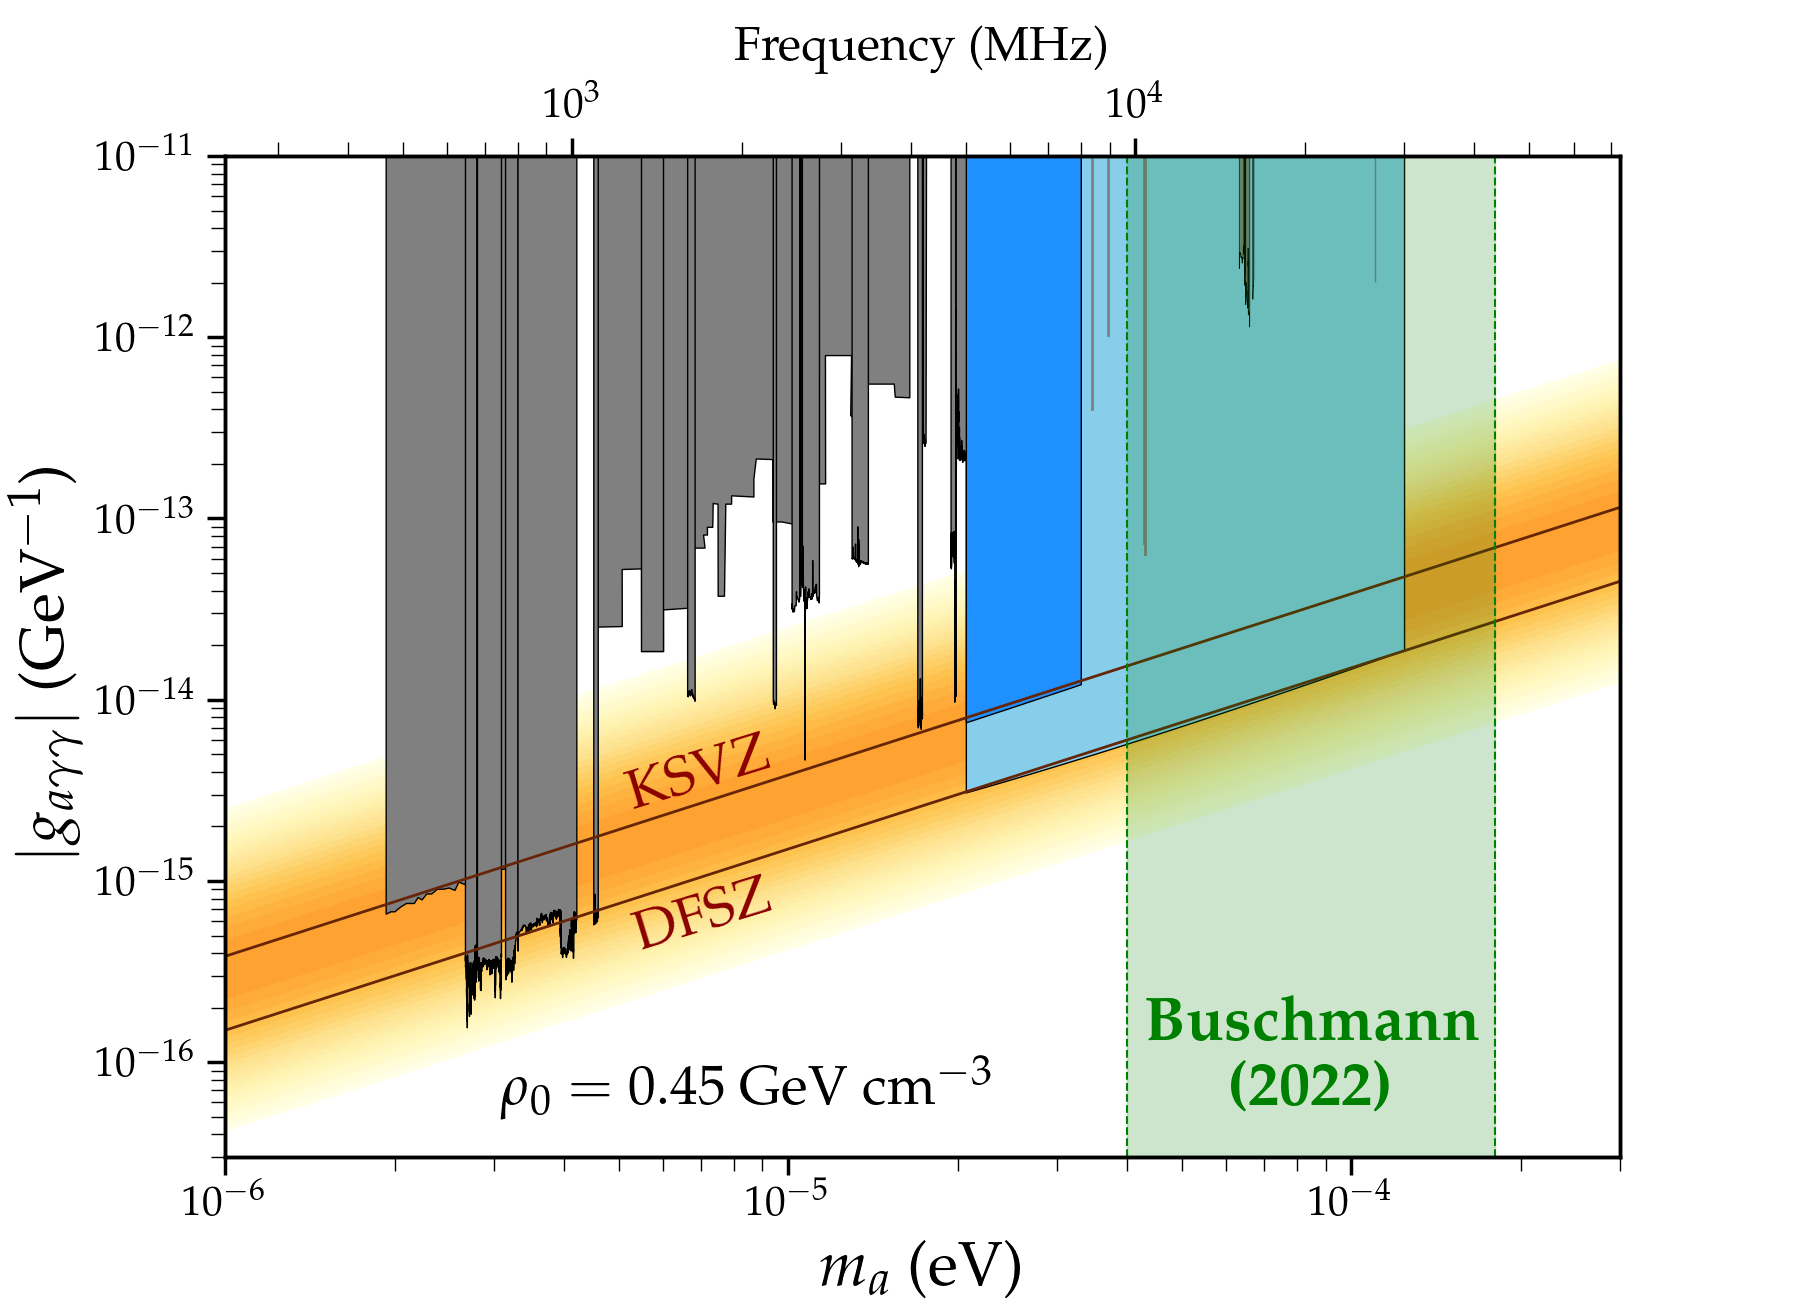
The discovery potential of such a cavity is shown in Fig. 7, along with existing haloscopes’ exclusions and the Kim-Shifman-Vainshtein-Zakharov (KSVZ) [32, 33] and DFSZ [16, 17] limits. In the following description, the frequency-dependent values and are quoted at a fiducial frequency GHz, and scales as while scales according to the geometry of the cavity. The dark blue region is the parameter space excluded by an optimally coupled ( [34]) three-wedge cavity, scaled to fit in a 1 m solenoid with a 0.6 m inner bore ( L) obtaining and , cooled to 100 mK with a 300 mK first-stage amplifier (such as a Josephson parametric amplifier), immersed in an 8 T magnetic field, with 2 months of data collection time. The light blue region is a futuristic haloscope making use of a larger 10 T solenoid that is 2 m in length with a 0.8 m inner bore, containing a L cavity achieving (again with and cooled to 100 mK), using an amplifier with added noise at 1/2 of the standard quantum limit (achievable through squeezing [25]), and 3.5 years of data collection time.
V Conclusion
In this paper, we characterized a prototype thin-shell resonator, as proposed in [22, 23], and found that it supports an axion-sensitive mode with appreciable form factor and while achieving a many times that of other experiments targeting a similar frequency range (see Table 2). Furthermore, the resonator is tunable from 7.1-8 GHz via single-axis motion. The resonator consists of a thin shell of vacuum space in between a central wedge and its surrounding shell (see Fig. 1), and its is maximized when those two pieces are aligned. An automated alignment procedure was developed using only rf measurements of the mode and requiring only a modest amount of time to complete.
The prototype characterization demonstrates that the thin-shell haloscope design can have an operating volume while retaining many desirable features of the successful cavity haloscope programs: mechanically robust high- resonators, geometry compatible with a solenoid magnet, and a simple antenna readout. The wide frequency range covered shows that any efficiency loss due to mode crossing in such an overmoded cavity will be modest. Since for a haloscope , the thin-shell cavity is a very promising approach to cover the important post-inflationary axion mass region. Compared to other innovative proposals to cover this range [35, 36], a straightforward extension to this successful prototype is a particularly low-risk approach that should be considered seriously. Forecasts on the discovery potential of thin-shell haloscopes, both in the near and long term, are shown in Fig. 7.
Acknowledgements
This material is based upon work supported by the National Science Foundation under Grant No. 2209576 and a KIPAC Innovation Award. We acknowledge the support of the Natural Sciences and Engineering Research Council of Canada (NSERC), 521528828. Chelsea Bartram and simulations and data acquisition advising were supported by the Department of Energy, Laboratory Directed Research and Development program at SLAC National Accelerator Laboratory, under contract DE-AC02-76SF00515 and as part of the Panofsky Fellowship awarded to Chelsea Bartram.
References
- Rubin and Ford [1970] V. C. Rubin and J. Ford, W. Kent, Rotation of the Andromeda Nebula from a Spectroscopic Survey of Emission Regions, Astrophys. J. 159, 379 (1970).
- Aghanim et al. [2020] N. Aghanim et al. (Planck), Planck 2018 results. VI. Cosmological parameters, Astron. Astrophys. 641, A6 (2020), [Erratum: Astron.Astrophys. 652, C4 (2021)], arXiv:1807.06209 [astro-ph.CO] .
- Bertone et al. [2005] G. Bertone, D. Hooper, and J. Silk, Particle dark matter: evidence, candidates and constraints, Physics Reports 405, 279 (2005).
- Clowe et al. [2006] D. Clowe et al., A direct empirical proof of the existence of dark matter, The Astrophysical Journal 648, L109 (2006).
- Abbott and Sikivie [1983] L. F. Abbott and P. Sikivie, A cosmological bound on the invisible axion, Physics Letters B 120, 133 (1983).
- Preskill et al. [1983] J. Preskill, M. B. Wise, and F. Wilczek, Cosmology of the invisible axion, Physics Letters B 120, 127 (1983).
- Dine and Fischler [1983] M. Dine and W. Fischler, The not-so-harmless axion, Physics Letters B 120, 137 (1983).
- Peccei and Quinn [1977] R. D. Peccei and H. R. Quinn, conservation in the presence of pseudoparticles, Phys. Rev. Lett. 38, 1440 (1977).
- Wilczek [1978] F. Wilczek, Problem of strong and invariance in the presence of instantons, Phys. Rev. Lett. 40, 279 (1978).
- Weinberg [1978] S. Weinberg, A new light boson?, Phys. Rev. Lett. 40, 223 (1978).
- Sikivie [1983] P. Sikivie, Experimental tests of the “invisible” axion, Phys. Rev. Lett. 51, 1415 (1983).
- Bartram et al. [2021] C. Bartram et al. (ADMX), Search for Invisible Axion Dark Matter in the 3.3–4.2 eV Mass Range, Phys. Rev. Lett. 127, 261803 (2021), arXiv:2110.06096 [hep-ex] .
- Backes et al. [2021] K. M. Backes et al. (HAYSTAC), A quantum enhanced search for dark matter axions, Nature 590, 238 (2021), arXiv:2008.01853 [quant-ph] .
- Yi et al. [2023] A. K. Yi et al. (CAPP), Axion dark matter search around with dine-fischler-srednicki-zhitnitskii sensitivity, Phys. Rev. Lett. 130, 071002 (2023).
- Marsh [2016] D. J. Marsh, Axion cosmology, Physics Reports 643, 1 (2016), axion cosmology.
- Dine et al. [1981] M. Dine, W. Fischler, and M. Srednicki, A simple solution to the strong cp problem with a harmless axion, Physics Letters B 104, 199 (1981).
- Zhitnitsky [1980] A. R. Zhitnitsky, On Possible Suppression of the Axion Hadron Interactions. (In Russian), Sov. J. Nucl. Phys. 31, 260 (1980).
- Borsanyi et al. [2016] S. Borsanyi et al., Calculation of the axion mass based on high-temperature lattice quantum chromodynamics, Nature 539, 69 (2016).
- Buschmann et al. [2022] M. Buschmann et al., Dark matter from axion strings with adaptive mesh refinement, Nature Communications 13, 1049 (2022).
- Klaer and Moore [2017] V. B. Klaer and G. D. Moore, The dark-matter axion mass, Journal of Cosmology and Astroparticle Physics 11, 049.
- Kawasaki et al. [2015] M. Kawasaki, K. Saikawa, and T. Sekiguchi, Axion dark matter from topological defects, Phys. Rev. D 91, 065014 (2015).
- Kuo [2020] C.-L. Kuo, Large-volume centimeter-wave cavities for axion searches, Journal of Cosmology and Astroparticle Physics 2020 (06), 010.
- Kuo [2021] C.-L. Kuo, Symmetrically tuned large-volume conic shell-cavities for axion searches, Journal of Cosmology and Astroparticle Physics 2021 (02), 018.
- Maier and Slater [1952] J. Maier, L. C. and J. C. Slater, Field Strength Measurements in Resonant Cavities, Journal of Applied Physics 23, 68 (1952).
- Jewell et al. [2023] M. J. Jewell et al. (HAYSTAC), New results from HAYSTAC’s phase II operation with a squeezed state receiver, Phys. Rev. D 107, 072007 (2023), arXiv:2301.09721 [hep-ex] .
- Jeong et al. [2018] J. Jeong et al., Concept of multiple-cell cavity for axion dark matter search, Physics Letters B 777, 412 (2018).
- Simanovskaia et al. [2021] M. Simanovskaia et al., A symmetric multi-rod tunable microwave cavity for a microwave cavity dark matter axion search, Review of Scientific Instruments 92, 033305 (2021), arXiv:2006.01248 [astro-ph.IM] .
- Di Vora et al. [2022] R. Di Vora et al., High- microwave dielectric resonator for axion dark-matter haloscopes, Phys. Rev. Appl. 17, 054013 (2022).
- Knirck et al. [2023] S. Knirck et al., First Results from a Broadband Search for Dark Photon Dark Matter in the to eV range with a coaxial dish antenna, arXiv e-prints (2023), arXiv:2310.13891 [hep-ex] .
- Quiskamp et al. [2024] A. Quiskamp et al., Exclusion of axionlike-particle cogenesis dark matter in a mass window above , Phys. Rev. Lett. 132, 031601 (2024).
- O’Hare [2020] C. O’Hare, cajohare/axionlimits: Axionlimits (2020).
- Kim [1979] J. E. Kim, Weak-interaction singlet and strong invariance, Phys. Rev. Lett. 43, 103 (1979).
- Shifman et al. [1980] M. Shifman, A. Vainshtein, and V. Zakharov, Can confinement ensure natural cp invariance of strong interactions?, Nuclear Physics B 166, 493 (1980).
- Al Kenany et al. [2017] S. Al Kenany et al. (HAYSTAC), Design and operational experience of a microwave cavity axion detector for the 20–100ev range, Nuclear Instruments and Methods in Physics Research Section A: Accelerators, Spectrometers, Detectors and Associated Equipment 854, 11 (2017).
- Beurthey et al. [2020] S. Beurthey et al. (MADMAX Working Group), MADMAX Status Report, arXiv e-print (2020), arXiv:2003.10894 [physics.ins-det] .
- Millar et al. [2023] A. J. Millar et al. (Endorsers), Searching for dark matter with plasma haloscopes, Phys. Rev. D 107, 055013 (2023).