JWST-MIRI Spectroscopy of Warm Molecular Emission and Variability in the AS 209 Disk
Abstract
We present MIRI MRS observations of the large, multi-gapped protoplanetary disk around the T-Tauri star AS 209. The observations reveal hundreds of water vapor lines from 4.9 to 25.5 m towards the inner au in the disk, including the first detection of ro-vibrational water emission in this disk. The spectrum is dominated by hot ( K) water vapor and OH gas, with only marginal detections of CO2, HCN, and a possible colder water vapor component. Using slab models with a detailed treatment of opacities and line overlap, we retrieve the column density, emitting area, and excitation temperature of water vapor and OH, and provide upper limits for the observable mass of other molecules. Compared to MIRI spectra of other T-Tauri disks, the inner disk of AS 209 does not appear to be atypically depleted in CO2 nor HCN. Based on Spitzer IRS observations, we further find evidence for molecular emission variability over a 10-year baseline. Water, OH, and CO2 line luminosities have decreased by factors 2-4 in the new MIRI epoch, yet there are minimal continuum emission variations. The origin of this variability is yet to be understood.
1 Introduction
The presence of water in circumstellar disks plays a fundamental role in the outcome of planet formation. Water is expected to be a major oxygen carrier in disks—therefore key to set the local gas-phase and solid C/O and N/O ratios in different disk regions (e.g. Herbst & van Dishoeck, 2009; van Dishoeck et al., 2014; Öberg & Bergin, 2021)—and undeniably an essential ingredient for setting planetary habitability. In the outer disk, beyond the water snowline, the stickiness of water ice (among other factors) is thought to facilitate the growth of pebbles and planetesimals (Dominik & Tielens, 1997; Birnstiel et al., 2010; Gundlach & Blum, 2015). Moreover, the migration efficiency of these bodies might be regulated by the local concentration of water ice (Stevenson & Lunine, 1988; Ciesla & Cuzzi, 2006). This solid water reservoir, however, is not observable in most disks. Instead, water can be most readily characterized via its gas-phase emission spectrum, which arises from the warm, innermost disk regions (within 10 au) in the mid-IR (Pontoppidan & Blevins, 2014), and from the outer disk at far-IR wavelengths (Hogerheijde et al., 2011; Du et al., 2017).
Our current view of inner-disk water comes primarily from the Infrared Spectrograph onboard the Spitzer Space Telescope (Spitzer IRS) (Houck et al., 2004), which revealed that bright, mid-IR rotational water emission is ubiquitous among low-mass T Tauri stars (Carr & Najita, 2008; Pontoppidan et al., 2010b). In general, the intensity of mid-IR water emission lines in these sources is best reproduced by column densities of order cm-2, warm excitation temperatures ranging from to K, and emitting areas in the disk of around 10 au2, corresponding to outer circular radii of au (Carr & Najita, 2011; Salyk et al., 2011; Najita et al., 2011; Antonellini et al., 2015). These emitting areas tend to be consistent with line kinematic information inferred from high-resolution ground-based spectra (Pontoppidan et al., 2010a; Banzatti et al., 2014; Najita et al., 2018; Salyk et al., 2019; Banzatti et al., 2023a). Mid-IR observations have further revealed that the intensity of water emission is anti-correlated to the mass and evolutionary stage of the central star (Pontoppidan et al., 2010b; Salyk et al., 2011; Fedele et al., 2011). Determining the abundance and distribution of water vapor in disks can thus provide substantial insights regarding the disk’s dynamical and thermal evolution.
The characterization of water vapor and the trends described above have so far encountered two critical constraints. First, due to the low spectral resolution and sensitivity of Spitzer IRS, most of the water lines observed with this instrument are blended, and model fits were dominated by the brightest, most optically thick water lines that emit near the disk surface (e.g. Salyk et al., 2011; Carr & Najita, 2011). The end result is that slab models infer lower abundances relative to the total water column predicted by thermochemical simulations that account for chemical heating and H2O self-shielding (Meijerink et al., 2009; Blevins et al., 2016; Woitke et al., 2019; Bosman et al., 2022).
Second, a complete understanding of water vapor in disks has been precluded by the limited wavelength coverage of Spitzer IRS (Banzatti et al., 2023a). While Spitzer IRS could readily detect bright rotational lines tracing lukewarm (400-600 K) water vapor in disks, a hotter ( K), more compact water reservoir is only revealed by ro-vibrational water emission within 2-8 m (Carr et al., 2004; Salyk et al., 2008; Mandell et al., 2012), which had been only accessible to ground-based spectrographs. Similarly, a cold water reservoir ( K) associated with sublimation near the snowline and photochemistry in the outer regions of some disks was mainly observable with far-IR facilities like Herschel (Zhang et al., 2013; Du et al., 2017). No single instrument until now has enabled a comprehensive analysis of distinct water emission reservoirs with sufficient sensitivity and spectral resolution.
Thanks to its unparalleled capabilities, the James Webb Space Telescope (JWST) has the potential to overcome the difficulties mentioned above and accurately characterize excitation conditions of water vapor in disks. In particular, the Mid-Infrared Instrument (MIRI; Rieke et al., 2015) Medium-resolution Spectrometer (MRS; Wells et al., 2015) offers medium spectral resolution () from 4.9 to 28 m, allowing the simultaneous analysis of ro-vibrational (bending mode) and rotational water lines spanning a vast range of upper energy levels ( K) for the first time. Similarly, the sensitivity of MIRI provides the opportunity to identify and characterize multiple optically thin water lines, and hence trace water closer to the planet-forming disk midplane. Indeed, JWST MIRI has already started to provide robust evidence for a low-energy water line excess in compact disks (Banzatti et al., 2023b) as well as the first detections of weak isotopologue lines (Grant et al., 2022), small organics (Kóspál et al., 2023), and ionization tracers (Berné et al., 2023) in the terrestrial-planet forming region of disks.
In this paper, we model the emission of H2O, OH radical (hereafter OH), CO2, C2H2, and HCN—with particular focus on water vapor and OH—using MIRI MRS data of the inner disk of AS 209. The disk of AS 209 is the first of four targets observed as part of the JWST follow-up to the ALMA MAPS Large Program (Öberg et al., 2021), and the only one with prior inner-disk chemistry constraints from Spitzer IRS in this sample. In Section 2, we describe the observations and data reduction process. The spectral modeling technique and retrieval framework are detailed in Section 3, and Section 4 presents the excitation analysis results. In Section 5 we explore whether the mid-IR spectrum of AS 209 differs from other T-Tauri disks, and compare our findings with prior Spitzer IRS observations. We find evidence for significant variability in molecular emission features, and present some possible explanations for this anomaly.
2 Observations
2.1 The Disk of AS 209
The low-mass (; Fang et al., 2018) T Tauri star AS 209, located at 121 pc (Gaia Collaboration et al., 2018), hosts an unusually bright and extended protoplanetary disk, with a mm-dust radius of au and a CO gas disk that extends out to 272 au (Andrews et al., 2018; Huang et al., 2018; Guzmán et al., 2018). Based on ALMA observations, the disk exhibits a least seven deep dust gaps from 9 out to 137 au (Huang et al., 2018; Sierra et al., 2021). Many molecules have been detected in the AS 209 outer disk (beyond 10 au) at sub-millimiter wavelengths (e.g. Öberg et al., 2011; Huang et al., 2017; Bergner et al., 2018; Öberg & Bergin, 2021), with most exhibiting multiple ring-like emission substructures when observed at high spatial resolution (Law et al., 2021).
There is evidence that at least one of the dust gaps is associated with ongoing planet formation at 100 au (Favre et al., 2019), and a candidate circumplanetary disk has been detected in molecular gas at au (Bae et al., 2022). The possibility that additional planets may be forming within the innermost au makes AS 209 an attractive target for IR follow-up observations. Previous Spitzer IRS observations of this disk suggested that water vapor is abundant in the innermost 2 au of the disk, while OH, CO2, and HCN gas were only tentatively identified (Salyk et al., 2011). Far-IR observations with Herschel, on the other hand, have only placed an upper limit of 75.3 mK km/s for the integrated flux of the water vapor line in the far-IR, and ro-vibrational lines were not detected either (Banzatti et al., 2023a).
2.2 Data Acquisition and Reduction
The observations presented in this paper were obtained using MIRI MRS as part of the JWST Cycle 1 program GO-2025 (P.I. Karin Öberg). AS 209 was observed starting on UTC August 2, 2022 01:19 adopting a point-source setting centered on (R.A. (J2000) = 16:49:15.2956, Decl. (J2000) = -14:22:09.01), with an integration time of 42 minutes in each of the three SHORT, MEDIUM, and LONG instrument sub-bands. The observations consist of six groups per integration, corresponding to the maximum possible before saturation due to the source brightness. Together, the four Integral Field Units (IFUs)—if observed in the three sub-bands—provide uninterrupted coverage from 4.9 to 28.1m, with a resolving power of in channel 1 ( m), in channel 2 ( m), in channel 3 ( m), and in channel 4 ( m).
The data was reduced using version 1.11.0 (CRDS context jwst_1105.pmap) of the JWST pipeline (Bushouse et al., 2023). For further details regarding the data reduction and 1D spectra extraction, we refer the reader to Pontoppidan et al. (2023). Being an atypically bright point-source as observed by MIRI MRS, the spectrum of AS 209 is severely affected by residual fringes, even after applying the fringe correction procedure ResidualFringeStep built into the JWST pipeline. We observe broad, quasi-periodic artifacts in all channels, and significant high-frequency variations in brightness versus wavelength around m and in all of channel 4. These artifacts complicate the detection of real emission lines considerably, as well as the location of the true continuum baseline in each channel. We thus apply an empirical fringe correction using two asteroid calibrators from JWST GO program 1549 (P.I. Klaus Pontoppidan), which is also fully described by Pontoppidan et al. (2023).
The top panel of Figure 1 shows the full MIRI MRS spectrum of the AS 209 disk, and the bottom panel shows the continuum-subtracted spectrum. To subtract the continuum, we developed an iterative Gaussian Processes decomposition technique that allows us to fit a baseline to the data without having to identify all line-free regions amid the noisy background. The details are presented in Appendix A. Even after the correction for residual fringes, some regions of the spectrum, including most of channel 4, still exhibit multiple artifacts, bad pixels, and overall low SNR. We decide to exclude the 8.5 – 12.3, 17.5 – 20.0, and 25.5 – 28.1 m wavelength ranges (shaded regions in Figure 1) from our analysis.
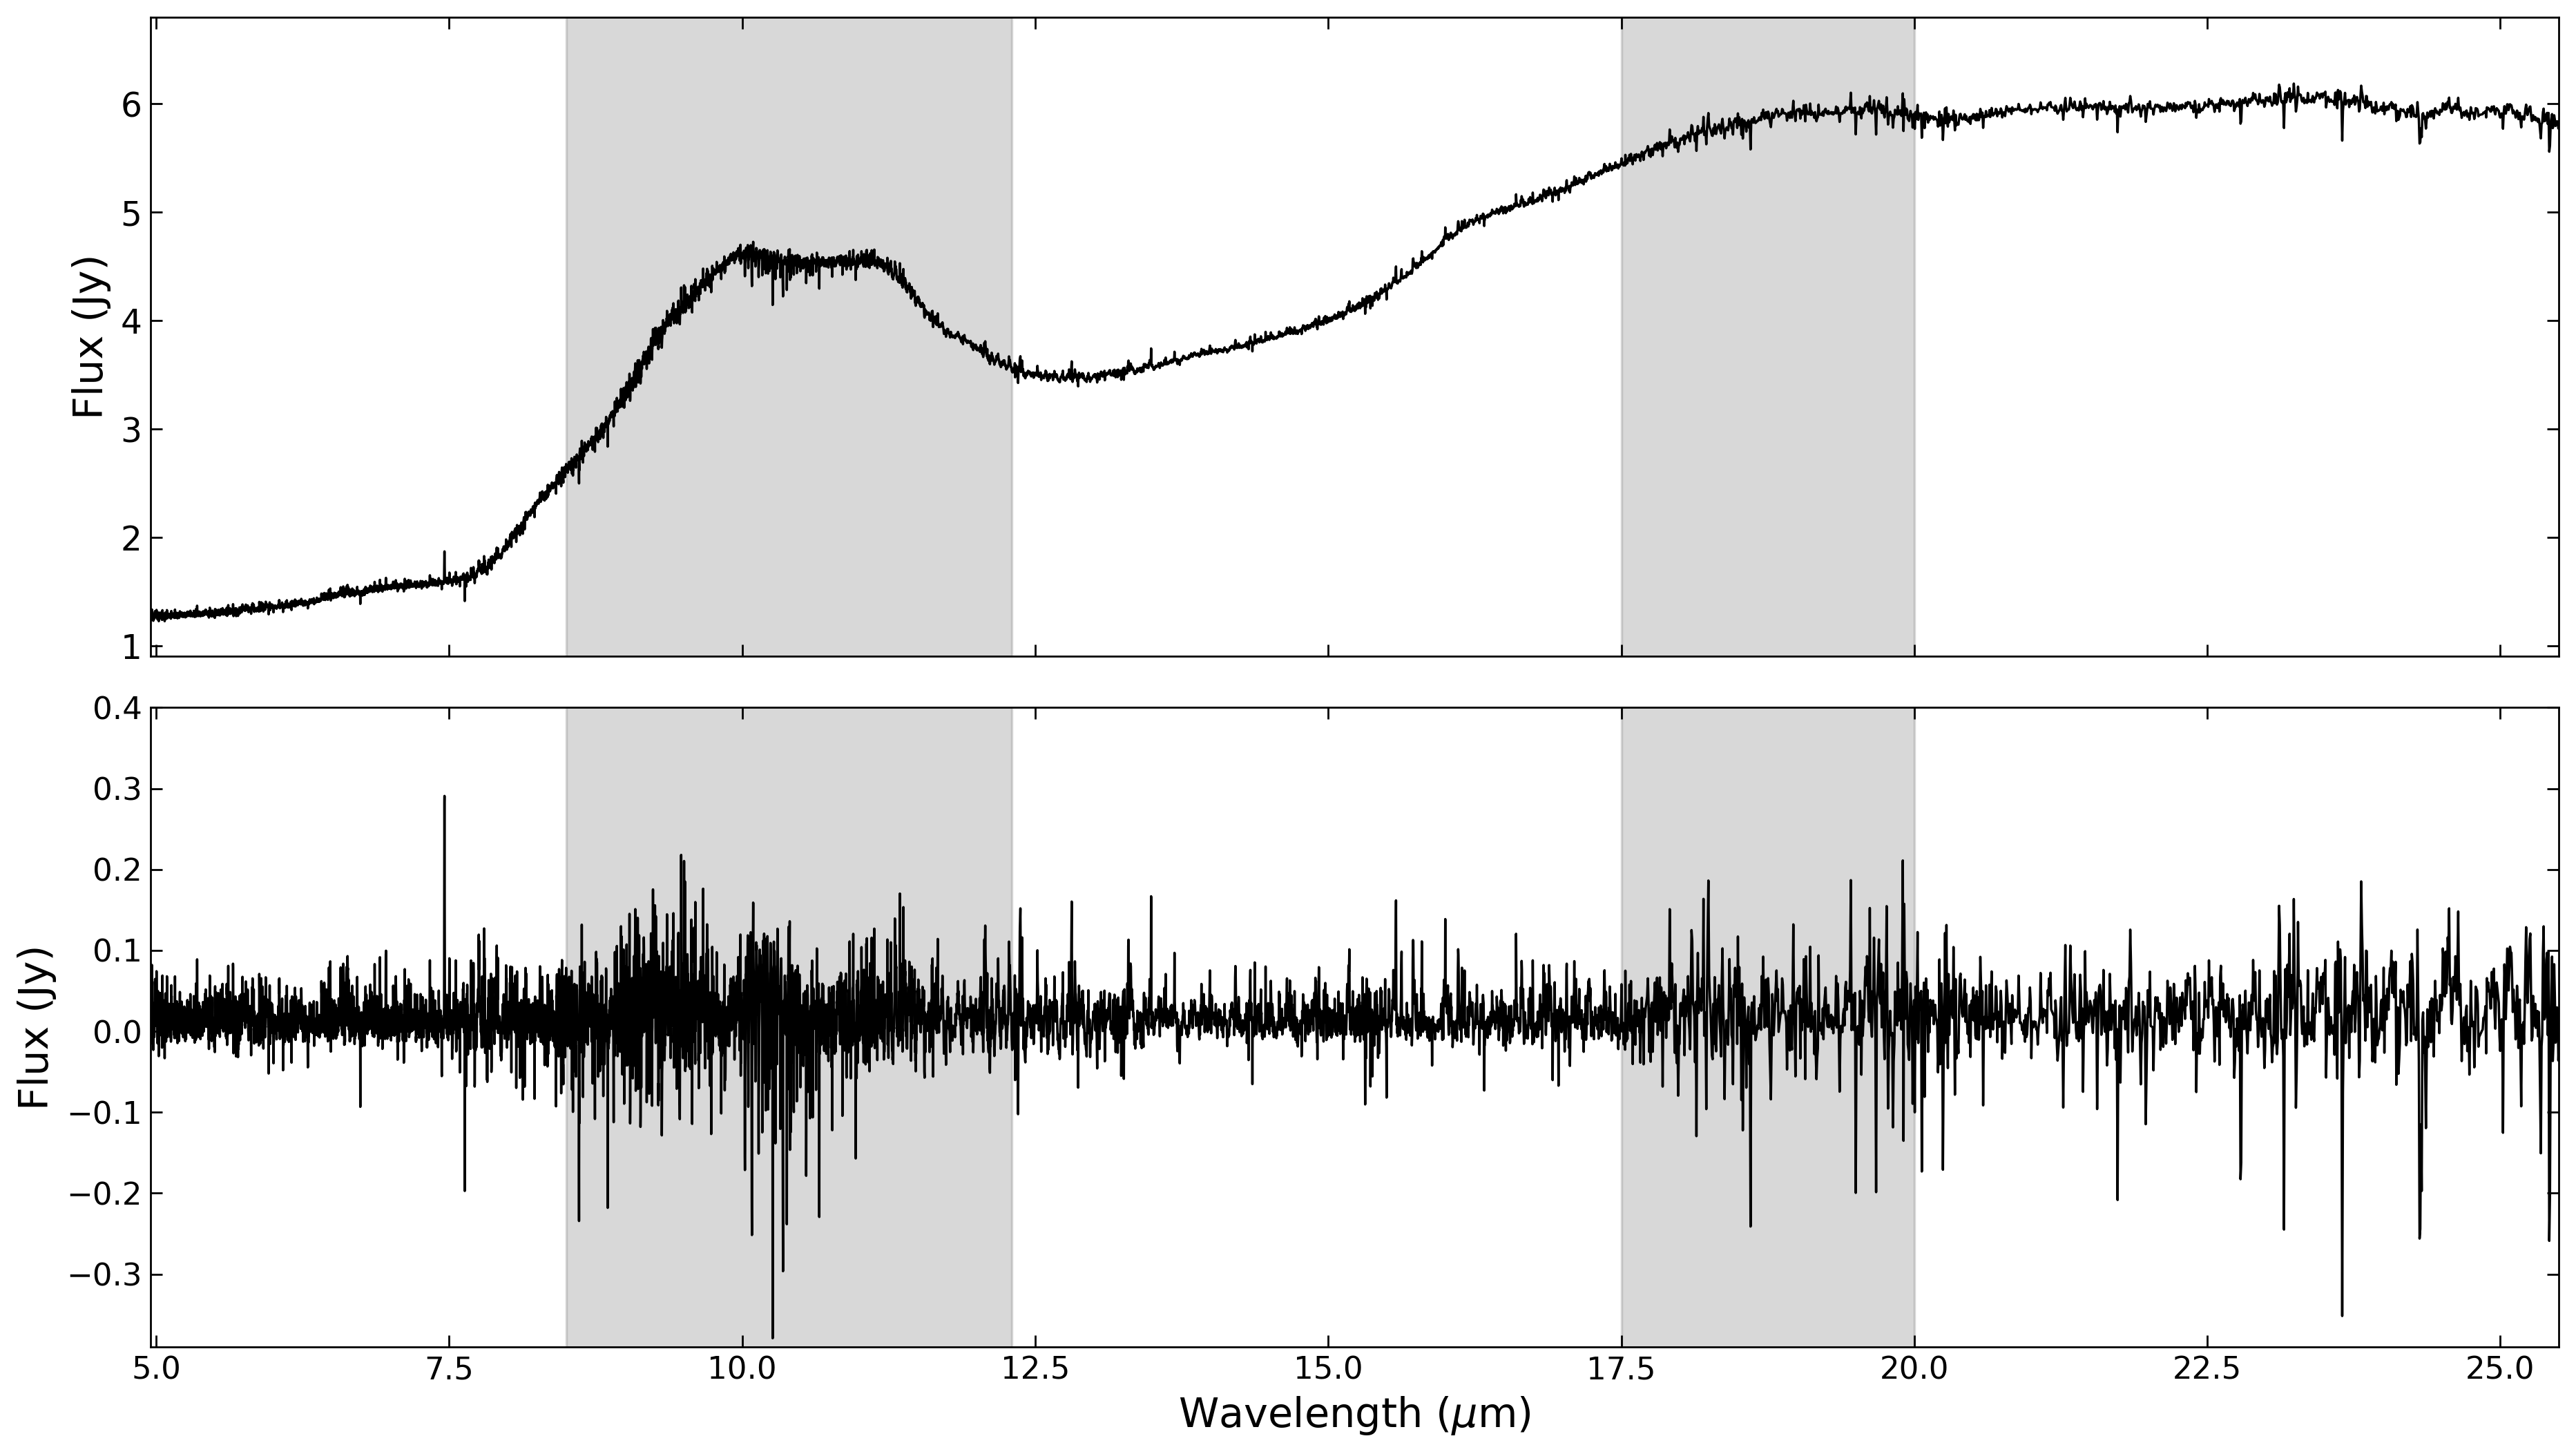
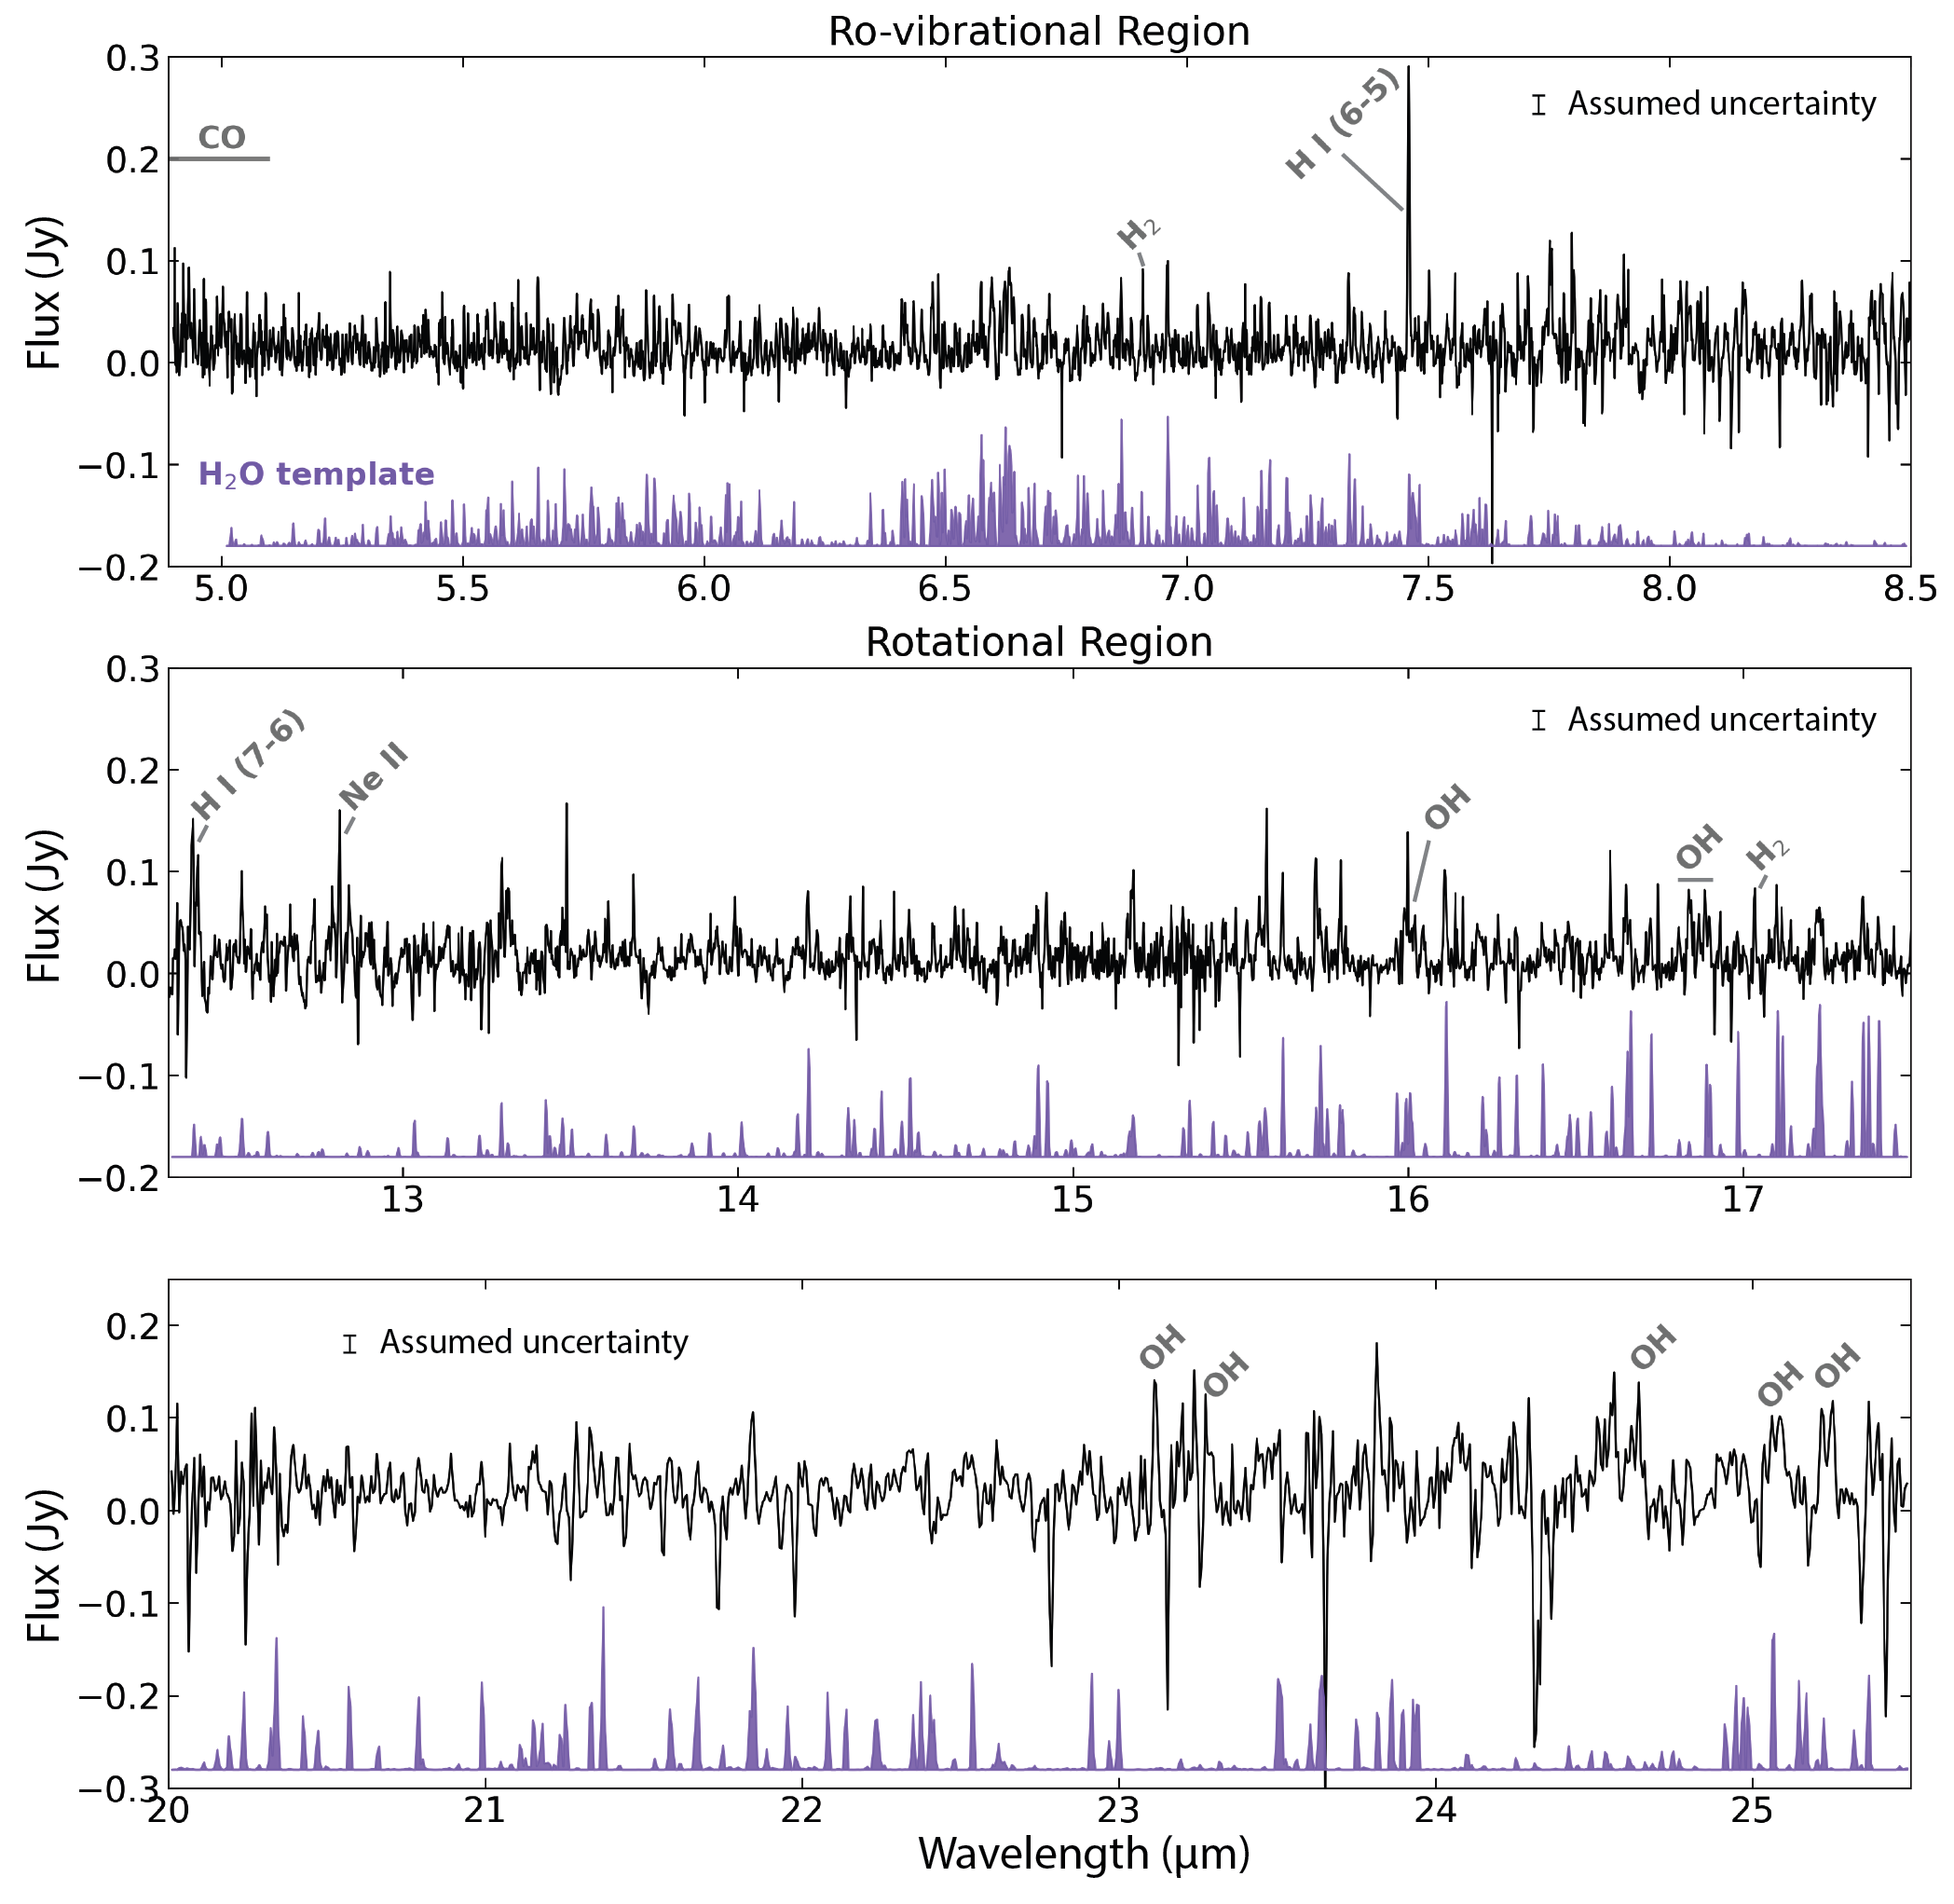
Figure 2 provides a closer view at the regions of the MIRI MRS spectrum analyzed in this paper. In each panel, we include a template water vapor model (in violet) with an excitation temperature of 700 K and column density of 1018 cm-2, scaled ‘by-eye’ to match the data. These values were chosen based on fits to high-energy water lines in other disks observed with MIRI MRS (Banzatti et al., 2023b). As shown in the top panel, MIRI MRS reveals the presence of ro-vibrational water emission in the disk of AS 209 for the first time, which is too weak to be detected from the ground (Banzatti et al., 2023a). We label some of the most prominent emission lines from other species that could be visually identified, namely CO, H2, OH, and a few atomic lines. Based on visual inspection alone, we find no evidence of significant CO2, HCN, nor hydrocarbon emission lines in the spectrum, in line with the observations provided by Spitzer IRS. Since the 4.9 – 8.5 m region is dominated by the ro-vibrational bending mode of water, hereafter we refer to this wavelength range as the ro-vibrational region. The 12.3 – 17.5 and 20.0 – 25.5 m wavelength ranges are dominated by rotational water emission, and we refer to these as the rotational region.
3 Analysis
In the following we analyze the spectrum in detail to derive the column density , excitation temperature , and emitting area in the disk of the two species found based on visual inspection: H2O and OH. We then perform a deeper search for emission of other molecules of interest: H2, CO2, C2H2, and HCN, and estimate their column densities when possible.
3.1 Line Modeling
To simulate the molecular emission, we developed and deployed the GPU-accelerated LTE slab modeling Python package iris (Munoz-Romero et al., 2023). The line modeling prescription follows that presented by Tabone et al. (2023), adopting a detailed treatment of optical depth effects and line overlap and using spectroscopic information from the HITRAN database (Gordon et al., 2022). In brief, we generate a high-resolution () opacity-weighted flux model for each species, with an optical-depth grid described by
| (1) |
for each line , where is the line center wavelength and is the line full width at half maximum (FWHM). Here, is the line center optical depth
| (2) |
with
| (3) |
where is the transition Einstein coefficient, and are the upper- and lower-level populations, respectively, and and their degeneracies. The line FWHM is assumed to be the sum in quadrature of a fixed turbulent component and a thermal broadening component
| (4) |
where is the molecular weight of each species, is the Boltzmann constant, and the proton mass. As the observations are spectrally unresolved, the turbulent width cannot be directly determined, and we decide to use the same value assumed by Salyk et al. (2011) and Tabone et al. (2023), (2 km/s standard deviation of the Gaussian line profile). Since most of the lines are expected to be optically thick, we caution that the derived column densities scale roughly as . Finally, the flux model is calculated as
| (5) |
where is the full Planck function and the distance to AS 209, assumed to be 121 pc.
The above prescription is computationally expensive—each species adds hundreds to thousands of transitions, all of which are modeled at high-resolution as described above—yet necessary given the plethora of emission lines that overlap within their intrinsic line widths. Ignoring these effects results in a severe over-estimation of peak line intensities, even at moderately high column densities ( cm-2). We convolve the emission models with Gaussian kernels to approximate the resolving power of MIRI MRS ( 3400, 2300, 1700 for the 4.9 – 8.5, 12.3 – 17.5, and 20 – 25.5 m wavelength ranges, respectively) and downsample the resulting models to the MIRI MRS wavelength grid (while conserving the total flux) using the Python package SpectRes (Carnall, 2021) to compare with the data.
3.2 Bayesian Retrieval
We model the ro-vibrational and rotational regions independently and include different species in each wavelength range of interest. For the rotational region, we include H2O, OH, CO2, C2H2, and HCN in the 12.3 – 17.5 m range, and only H2O and OH in the 20 – 25.5 m range. Note that the contributions of H2O and OH in the 12.3 – 17.5 and 20 – 25.5 m ranges are fit together. For the ro-vibrational region, on the other hand, we only consider the contributions from H2O based on the rotational region results (see Section 4.1). We emphasize that when multiple species (or multiple components for a single species) are included, all of them are modeled simultaneously, as modeling and subtracting each one individually would not correctly account for line opacity overlap along the line of sight. The rest of this section elaborates on the specific fitting details.
We perform Bayesian inference in a hierarchical framework, using the Python Nested Sampling package dynesty (Speagle, 2020) to explore the posterior distribution of each parameter of interest. By iteratively adding molecules to the fit, we are able to better guide the sampler and avoid adding complexity to the model without sufficient evidence. To summarize the method described below, we add molecules to each emission model in succession, and each time a new molecule is included, we use the posterior distribution of the previous (simpler) fit to inform the prior distributions used in the new model.
3.2.1 Water Vapor
For the rotational region, we begin by fitting an H2O model using the following Uniform prior distributions:
| (6) |
with bounds informed by the previous observations and modeling efforts of water vapor emission in disks as discussed in Section 1. The same priors are used to model the H2O emission in the rotational region. Note that the temperature bounds above correspond to 150 and 2000 K, and the log area bounds correspond to equivalent radii of 0.017 – 17.8 au assuming circular emitting areas. The nested sampling is performed using multiple ellipsoid decomposition and random walk sampling with = chains (i.e. live points), where is the number of parameters in the model. We use a Normal likelihood assuming a constant 20 mJy uncertainty for all pixels111This is approximately 2 the standard deviation of pixels with negative flux values in the 20.0 – 25.5 m range, excluding bad pixels (see Appendix A). The run is terminated once the estimated change in the remaining evidence satisfies
3.2.2 OH
The next molecule added to the rotational region model is OH, which is also visually identified in the spectrum. To perform this fit, we begin by using the same Uniform prior distributions described by Equation 6 for OH, and Normal prior distributions for H2O. In particular, we take the median and the standard deviation of the posterior distribution of the previous H2O fit to construct the new Normal priors. We choose to use the standard deviation of the previous results to avoid under-estimating the parameter uncertainties in the new fits. The number of live points is increased and the run is terminated using the same criteria as described above.
We find that the above fit produces multi-modal posterior distributions for OH, with three main solutions: one with of K, one near 700 K, and a third one at approximately 1500 K. The first two solutions have similar emitting areas of au2 and column densities of order 1018 cm-2, while the third one requires a column density cm-2. This is not unexpected, since the gas responsible for inner disk OH emission is thought to be in non-LTE, and slab models with multiple excitation temperature components are typically required to reproduce the observed line ratios (e.g. Najita et al., 2010; Banzatti et al., 2012; Carr & Najita, 2014). Of the three solutions, we focus on the one with K (see Section 4) for two main reasons: First, this solution has the highest likelihood and can be considered to be the global minimum in the parameter space allowed by the priors. Second, we find that the low temperature solution misses the high-energy OH lines seen at 16.8 m, while the high temperature solution cannot reproduce the lower energy lines beyond 20 m. The K solution on the other hand provides the best overall fit to the data. We also experimented with fitting multiple OH components simultaneously, but the models did not converge.
Based on the findings described above we repeat the H2O + OH fit, this time using a Normal prior for OH centered at 700 K with standard deviation of 200 K, and the same and Uniform priors. With the more restrictive temperature prior we no longer recover the multi-modal solutions for OH, and thus the posterior distribution provides a better estimate of the uncertainty for the main solution.
3.2.3 A Cold Water Vapor Component
The fit described before results in a hot and compact water emission component, as further detailed in Section 4.1. After careful inspection of the residuals, we find minor excess emission features that may be associated with low-energy H2O lines around 21.2, 21.8, 23.8, and 25.5 m, which are not captured by the best fit water model. As mentioned in Section 1, mid-IR rotational water vapor spectra in disks tends to exhibit excitation temperature gradients, sometimes associated with multiple reservoirs produced by distinct water vapor formation mechanisms. We thus explore whether there could be a colder water reservoir contributing to the spectrum.
We fix the temperature of this second component to 400 K, as is observed in other T-Tauri systems (Banzatti et al., 2023b), and fit only for the emitting area and column density using the same uniform priors as described above. We also experiment by allowing the excitation temperature to vary, and get a solution with K. However, given the low quality of the data in channel 4, we decide not to derive any conclusions regarding the temperature of cold water vapor from the long wavelength emission, and only use the fit to obtain an upper limit for the amount of cold water vapor. Similarly, we caution against interpreting the best fit cold H2O emitting area as a snowline location tracer, given that it is strongly correlated to the choice of .
3.2.4 Other Molecules
For the rest of the species included in the 12.3 – 17.5 m range, CO2, C2H2, and HCN, we are unable to fit all , , , likely due to a mix of intrinsically low fluxes, few observable lines, and poor SNR. Specifically, their column densities and emitting areas are degenerate, and we cannot place any meaningful constraints on their excitation temperatures. Thus, we attempt to estimate only the column density of each species, using the following uniform prior:
We use the same area and excitation temperature obtained for the hot water vapor component to estimate for CO2, HCN, and C2H2, which are added to the model in that order. Note that when adding each of these species we no longer let the parameters of the previous models vary, but rather fix them using the median of their final posterior distribution. At the expected abundances, these species emit most prominently in non-overlapping wavelength regions (see Figure 4), and thus should not affect the retrieved properties of each other, nor those of H2O and OH.
4 Results
4.1 Rotational Region
As described in Section 3, we attempt to fit the emission of hot and cold H2O, OH, CO2, HCN, and C2H2. Since we can only visually confirm the presence of hot water vapor and OH in the spectrum, we emphasize that CO2, C2H2, HCN, and cold H2O can be considered, at best, marginally detected. As a way to decide whether a species is detected, marginally detected, or non-detected, we use the Bayesian Information Criterion (BIC), which penalizes the increased complexity of each model even if it has a higher likelihood:
where is the dimensionality of the problem, is the total number of observations, and the log-likelihood of the model evaluated using the median of the posterior distribution for each parameter. Specifically, hot water vapor is considered an unambiguous detection, and the rest of the molecules are:
-
1.
Detected: if we can identify multiple lines, the strongest component lies at the level after subtracting hot H2O from the data, and the BIC decreases by including the species in the model.
-
2.
Marginally detected: if it cannot be unambiguously identified in the data, but the BIC decreases by including it in the model.
-
3.
Non-detected: if it cannot be unambiguously identified in the data, and the BIC does not decrease by including it in the model.
Figure 3 shows how the BIC is modified by adding additional species to the model, starting from hot water vapor. OH is detected, CO2, HCN, and cold H2O are marginally detected, and C2H2 is not detected. CO and H2 are considered detections too, but are not included in the excitation analysis.
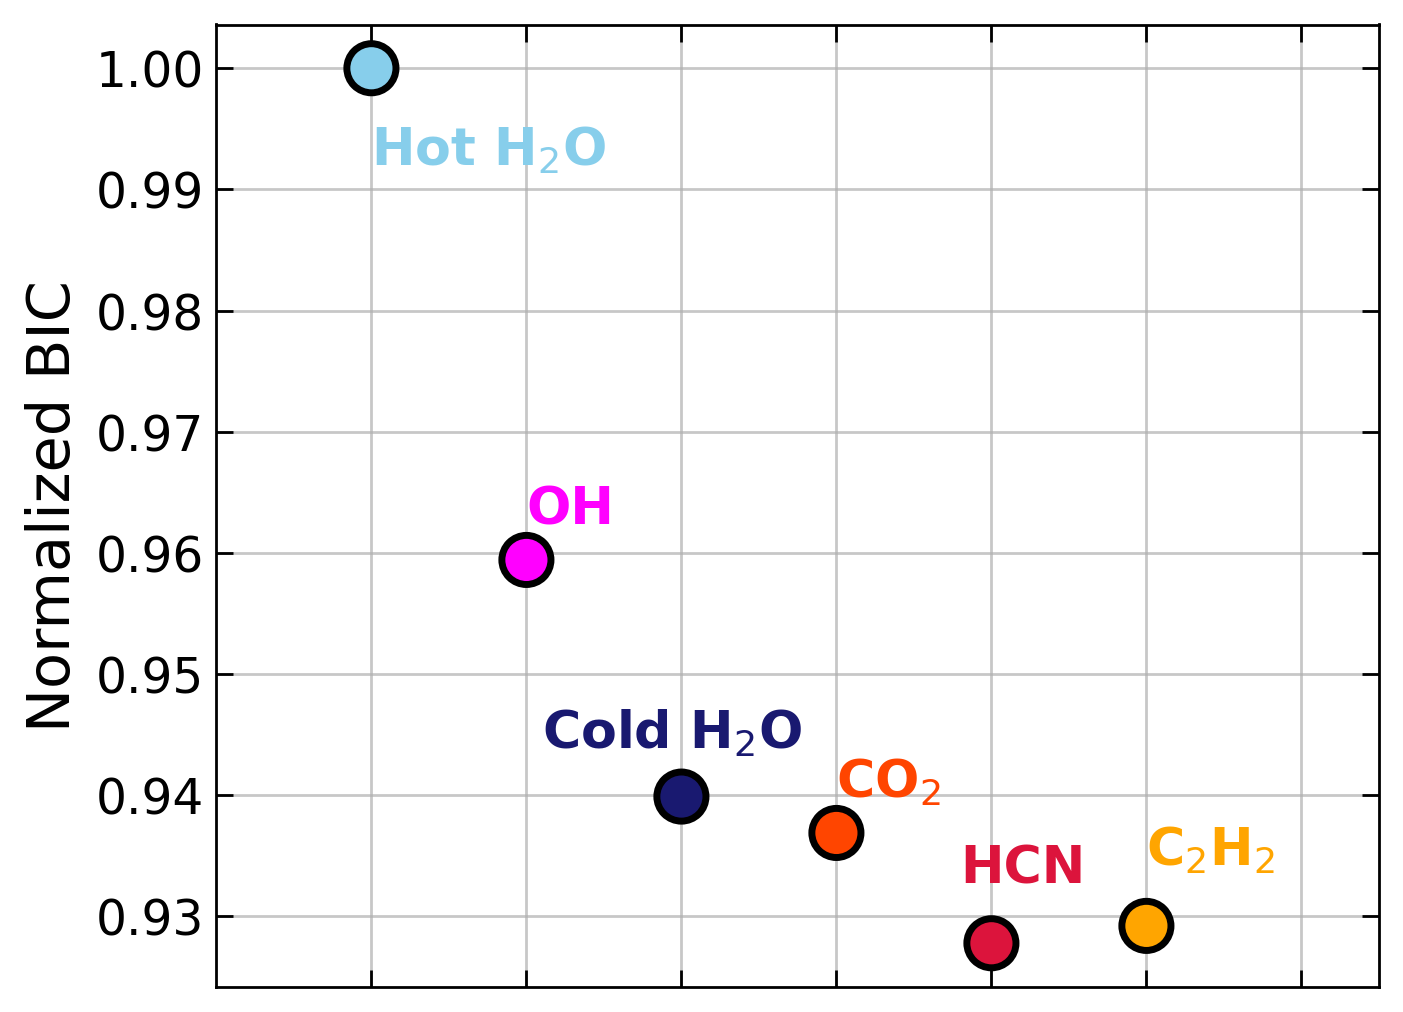
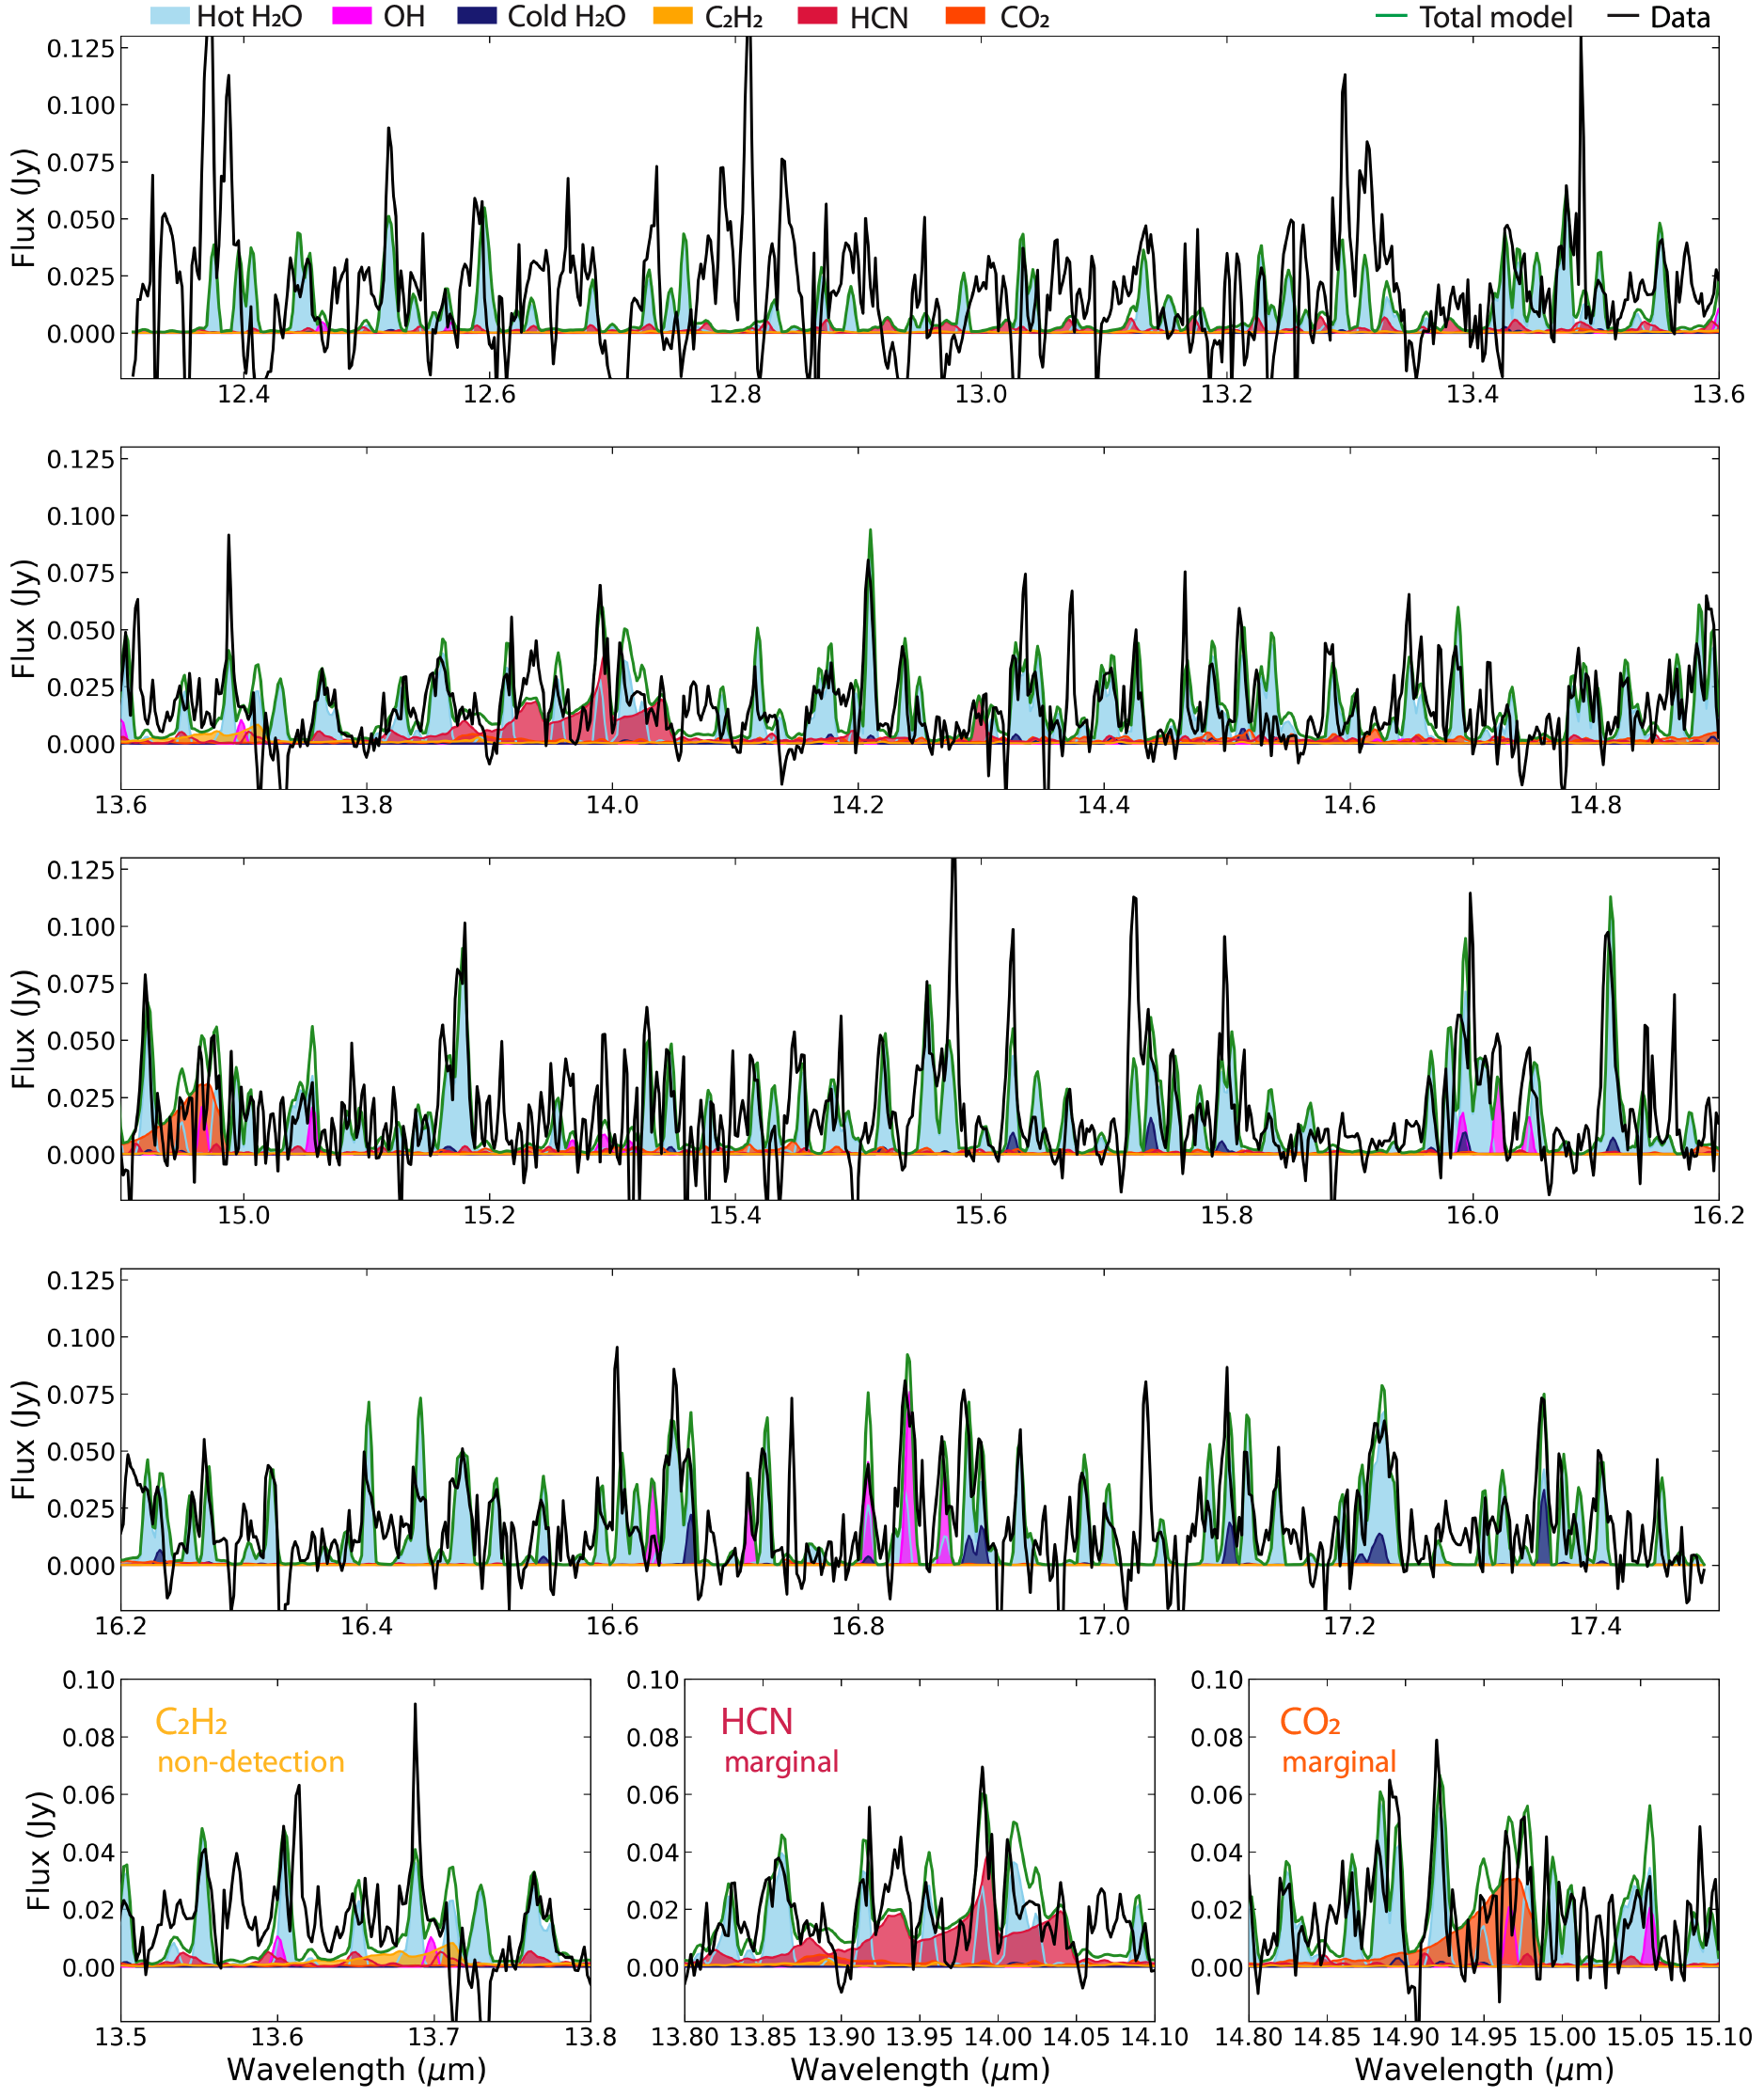
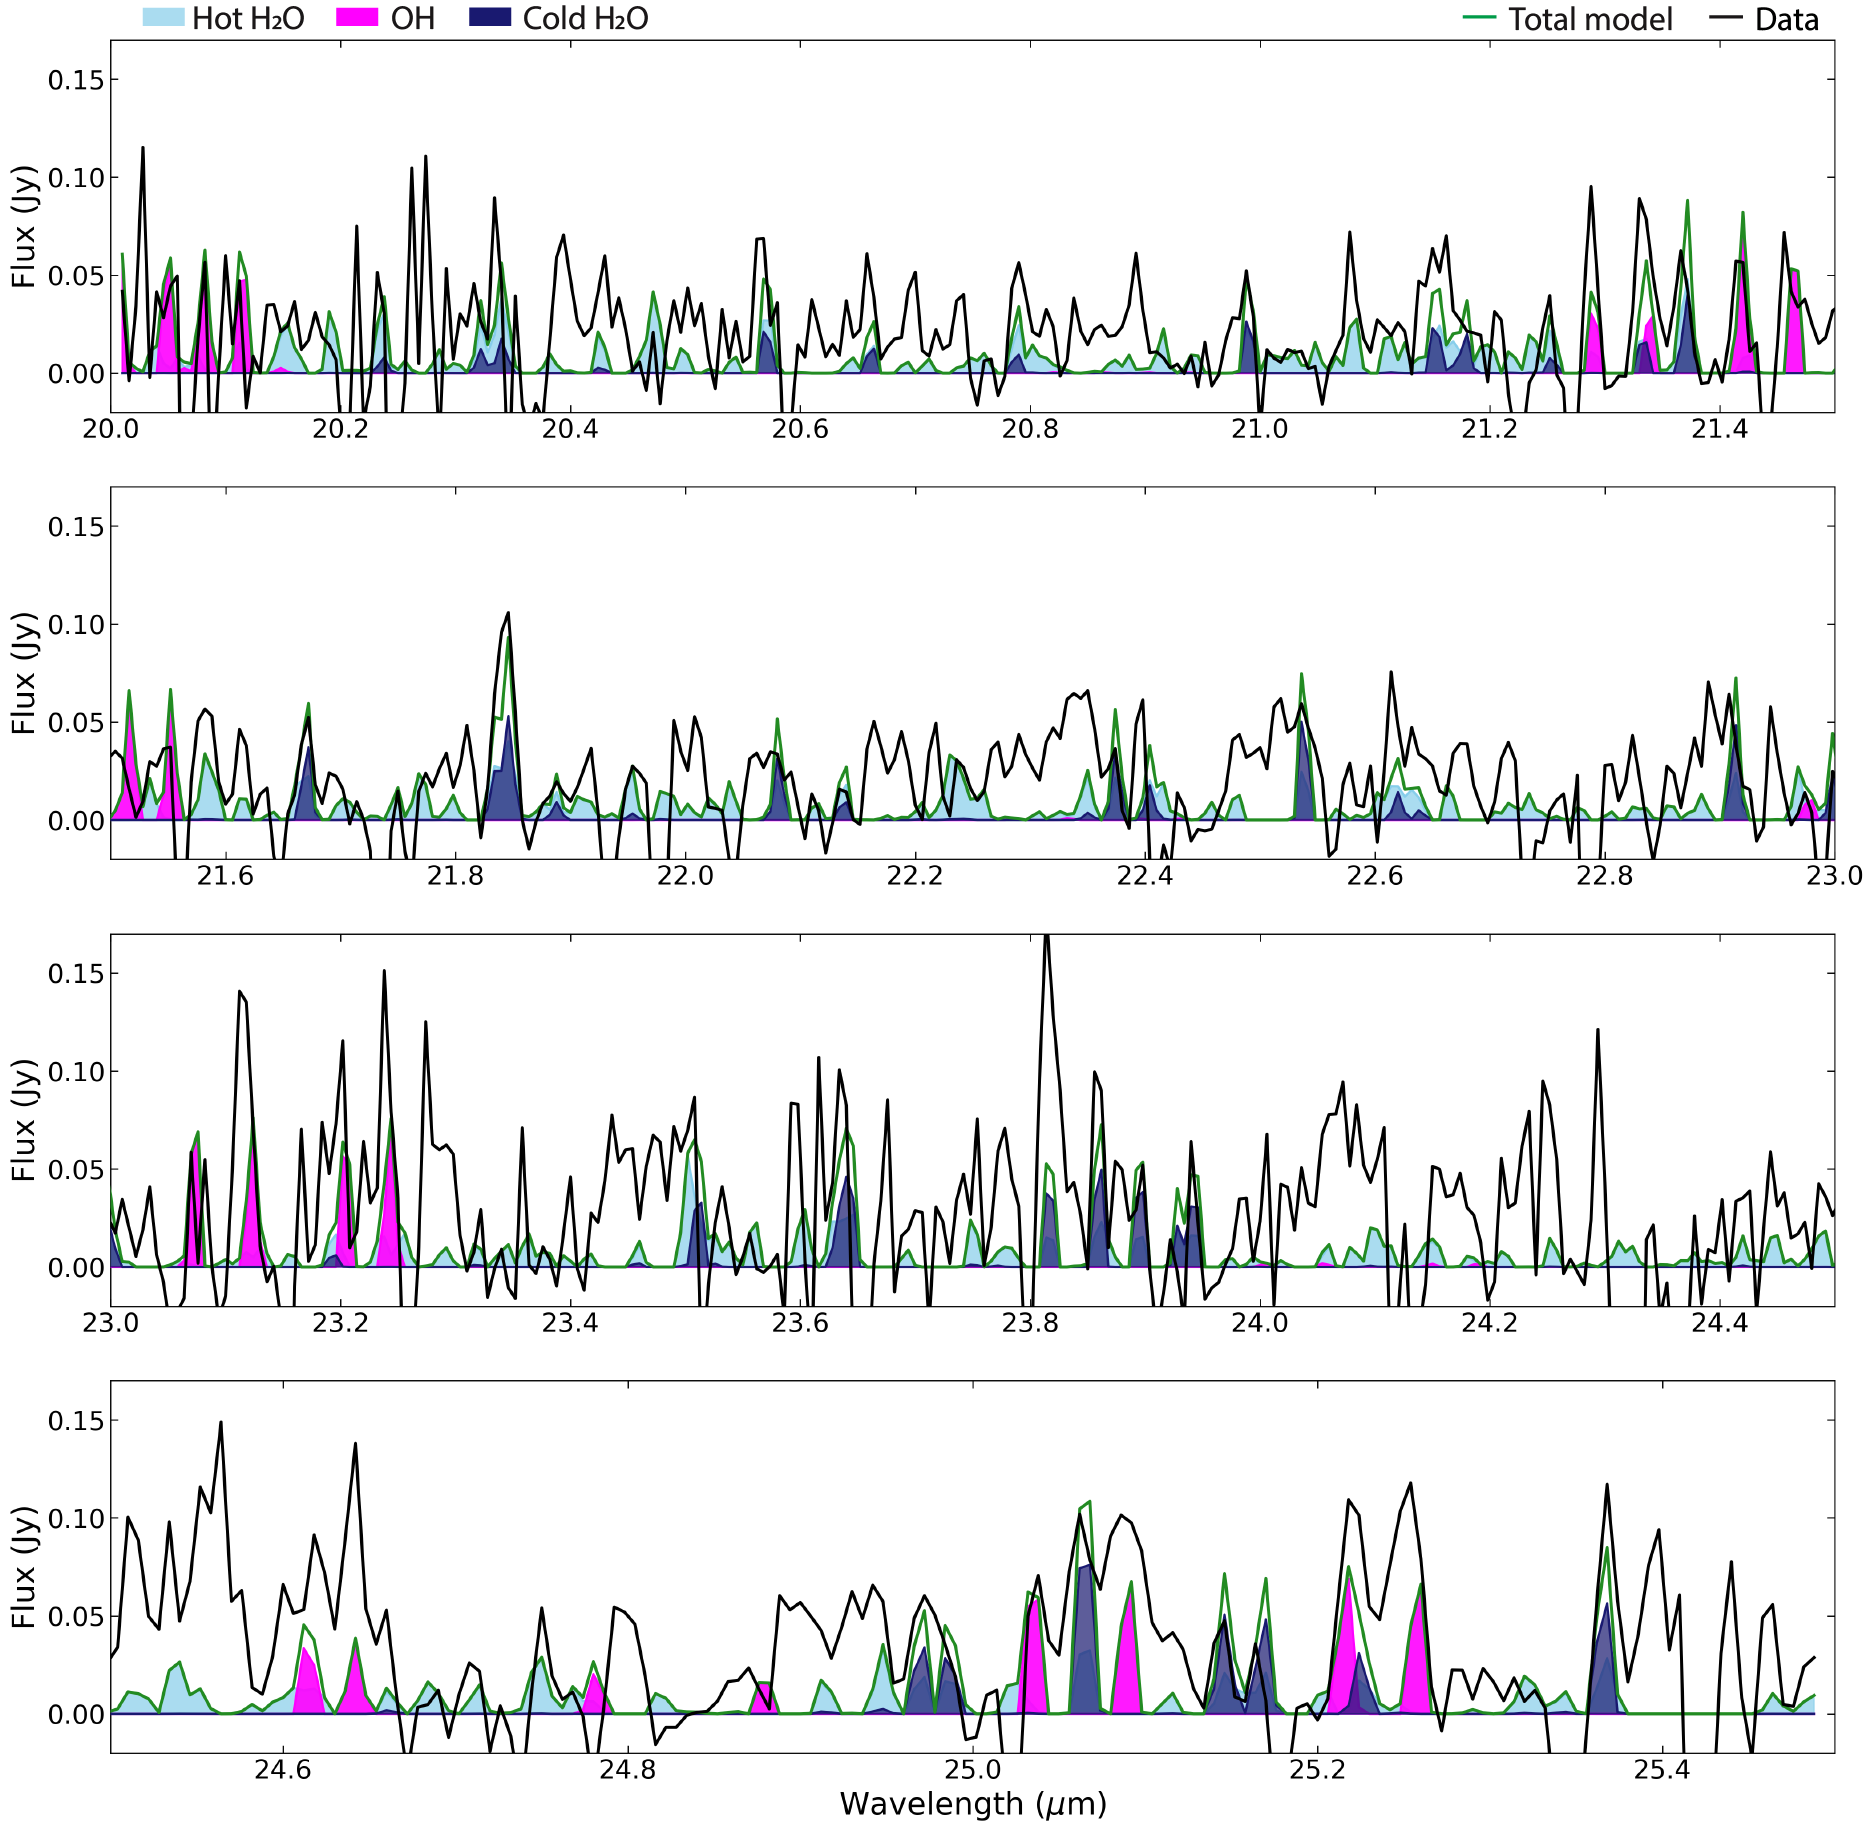
Table 1 lists the best-fitting values and confidence intervals for each parameter of interest in the final fit. The best-fit values are chosen to be the median of the posterior distributions, while the uncertainties correspond to the 0.0015 and 0.9985 percentiles ( confidence intervals). We caution that the reported uncertainties reflect the assumed flux uncertainty of 20 mJy, but likely under-estimate the true parameter uncertainties. This is because the likelihood function and retrieval framework used in this work can only include Normally-distributed noise, but does not account for correlated noise nor the uncertainty related to both the absolute flux calibration and continuum baseline. Based on visual inspection of the posteriors, we do not notice any strong correlations between parameters. From here onward, the emission models referred to as ‘best-fits’ correspond to those evaluated using the median of the posterior distribution for each parameter. Since CO2 and organics are only marginally/not detected, we consider their best-fit column density to be upper limits. In the case of cold H2O for which we can fit both emitting area and column density, we consider the observable mass (product of best-fit column density and emitting area) to be an upper limit as well. Table 1 further lists the inferred total observable mass of each molecule, and their ratio relative to hot H2O.
| Region | Species | Status | (K) | (cm-2) | (au2) | () | Hot H2O |
|---|---|---|---|---|---|---|---|
| Rotational | |||||||
| Hot H2O | Detected | – | |||||
| OH | Detected | 0.3 | |||||
| Cold H2O | Marginal | [400] | |||||
| CO2 | Marginal | [830] | [] | ||||
| HCN | Marginal | [830] | [] | ||||
| C2H2 | Not Detected | [830] | [] | ||||
| Ro-vibrational | |||||||
| Ro-vib H2O | Detected | – | – |
Note. — From left to right: Spectral region, species name, detection status, excitation temperature, column density, emitting area, observable mass, and mass ratio with respect to hot water vapor. Best-fit parameters correspond to the median of the posterior distributions. Confidence intervals correspond to the 0.0015 and 0.9985 percentiles. Brackets indicate parameters that were kept fixed during the fit. Observable masses are the product of the best-fit column density and emitting area, times the molecular weight of each species. We do not present a mass estimate for ro-vibrational H2O, since the emission is affected by non-LTE excitation effects.
Figure 4 shows the best-fit model in the 12.3 – 17.5 m region. For clarity, the spectrum and model have been broken up into four vertically-stacked panels. Besides the best fit model, we show the individual contribution from each species as shaded areas of different colors, and provide additional panels with a zoomed-in view of the main organic bands. We find that the best fit hot H2O model does an excellent job at reproducing most of the emission observed in this spectral region, except in the noisier 12.3 – 13.6 m region. Similarly, the 700 K OH model can reproduce the strongest high-energy OH lines near 16.8 m and even those blended with water near 16.0 m. CO2 and the organics, if present, are completely blended with water. Yet we note that adding HCN and CO2, which are marginally detected, improve the quality of the overall fit.
Finally, Figure 5 shows the best-fit model in the 20.0 – 25.5 m region. In this region, notice that hot H2O has only minor contributions, and the data is dominated by noise. We can yet observe that the OH model matches the brightest lines near 21.1 and 21.5 m well, but under-predicts the observed fluxes of lower-energy lines beyond 23 m by about 50. Even with the higher noise, we notice that several bright features can be partially reproduced by the marginally-detected cold H2O component, particularly at 21.4, 21.85, between 23.8 – 24.0, and between 25.0 – 25.4 m.
4.2 Ro-vibrational Region
Here we present the results from fitting the water vapor emission in the ro-vibrational region (4.9 – 8.5 m range). However, we emphasize that emission from the ro-vibrational bending mode of water is generally found to not be in local thermodynamic equilibrium (LTE)—hence why it is fit separately from the rest of the spectrum—and the derived properties using LTE slabs may not be good estimates of the true gas temperature, column density, and extent. In fact, it is likely that the ro-vibrational water emission traces a similar, perhaps slightly hotter water vapor reservoir seen in the rotational region—but is simply suppressed due to excitation effects (Banzatti et al., 2023a; Bosman et al., 2022).
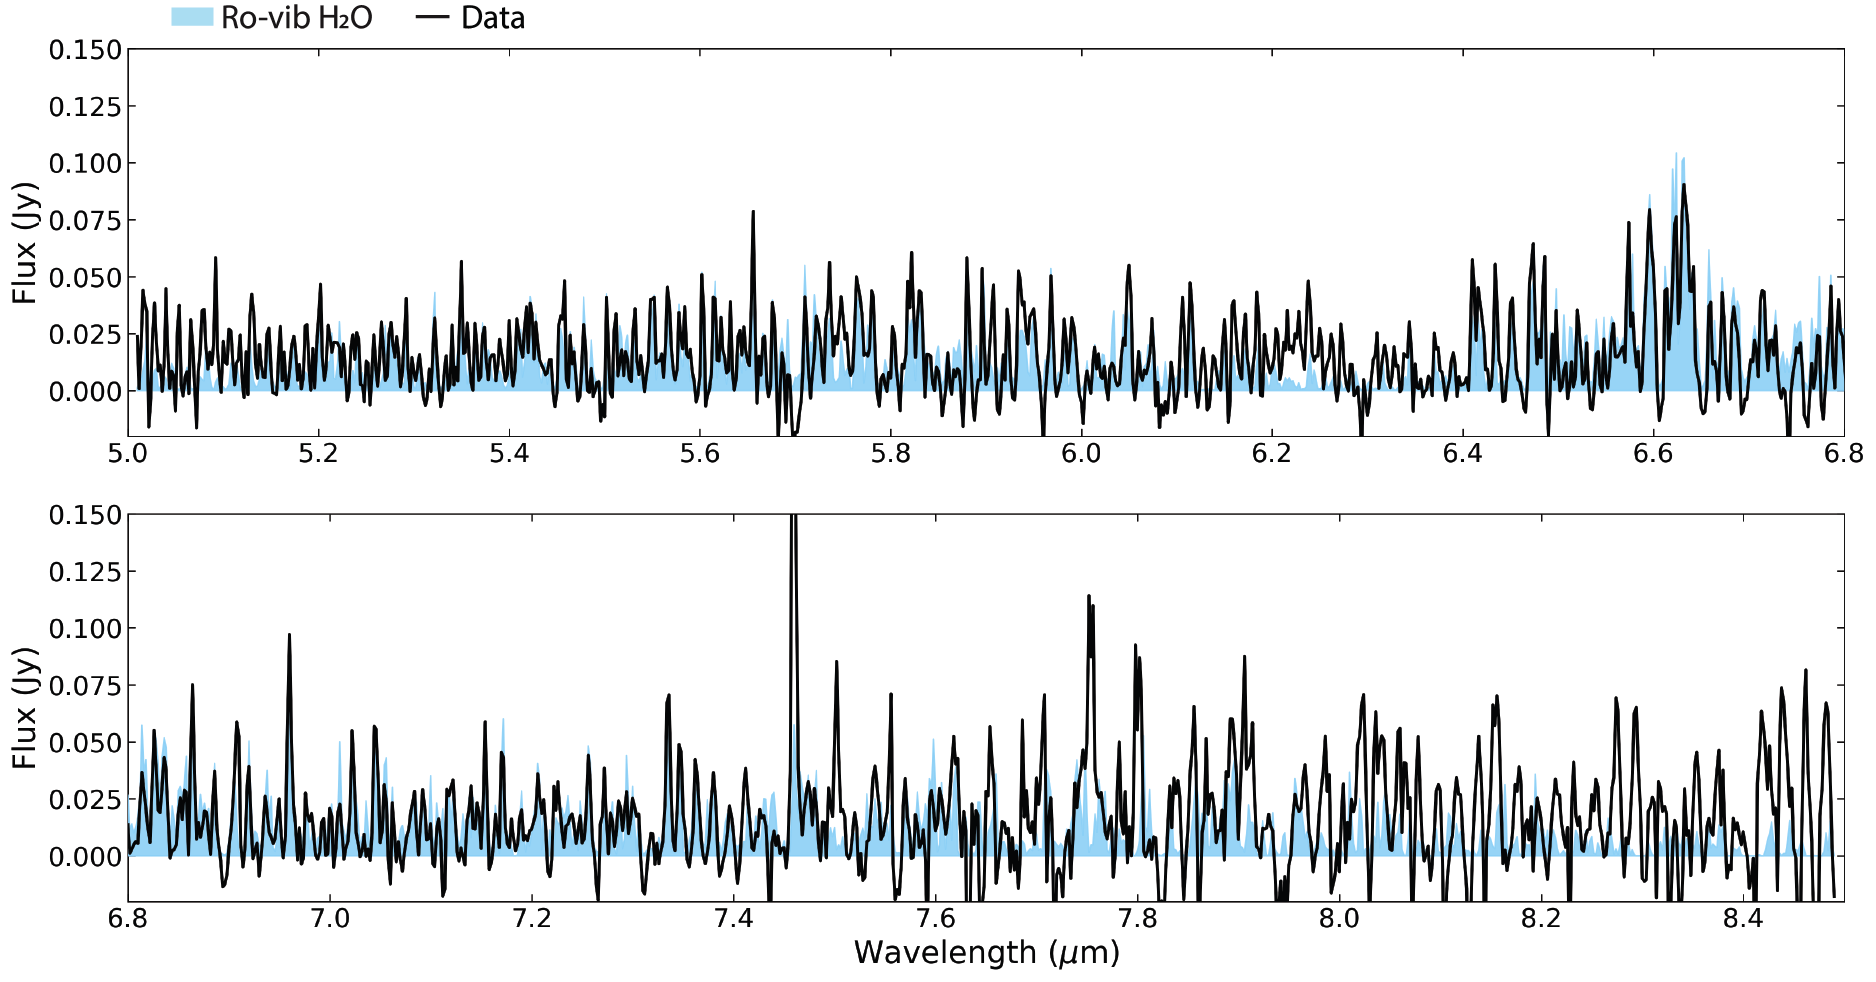
Figure 6 shows the best-fit model in the ro-vibrational region, both compared to the data and individually. We find that the ro-vibrational water vapor emission component is best modelled by a slab with area of au2, a higher excitation temperature of 1230 K, and a lower column density compared to that traced by the rotational component, of cm-2. Note that while this H2O model appears to be a good fit to the data, it severely under-predicts the observed water line fluxes in the rotational region. Similarly, the hot and cold water components fit to the rotational regions over-predict the observed water spectrum between 4.9 and 8.5 m. The two regions cannot be reproduced by a single slab or sum of slab models. Based on the best-fit column densities of the other species in the rotational region, we do not expect any of them to be detected between 4.9 and 8.5 m.
5 Discussion
5.1 The Mid-IR Spectrum of AS 209 in Context
To guide the interpretation of our results, we carry out a detailed comparison between the MIRI MRS spectrum of AS 209 and those of two other systems: CI Tau and GK Tau. These provide some of the highest quality MIRI MRS data published for T-Tauri systems to date, and let us explore 1) if the properties of the hot water vapor reservoir in AS 209 are atypical, and 2) whether the weaker molecular features tentatively found in the AS 209 spectrum are consistent, within the noise, with those detected in other disk spectra. Furthermore, we choose these two systems to contrast the H2O and OH excitation conditions in AS 209 to those of a similarly extended and structured disk (CI Tau, with sub-mm dust radius au) and a significantly more compact disk (GK Tau, au) (Long et al., 2019).
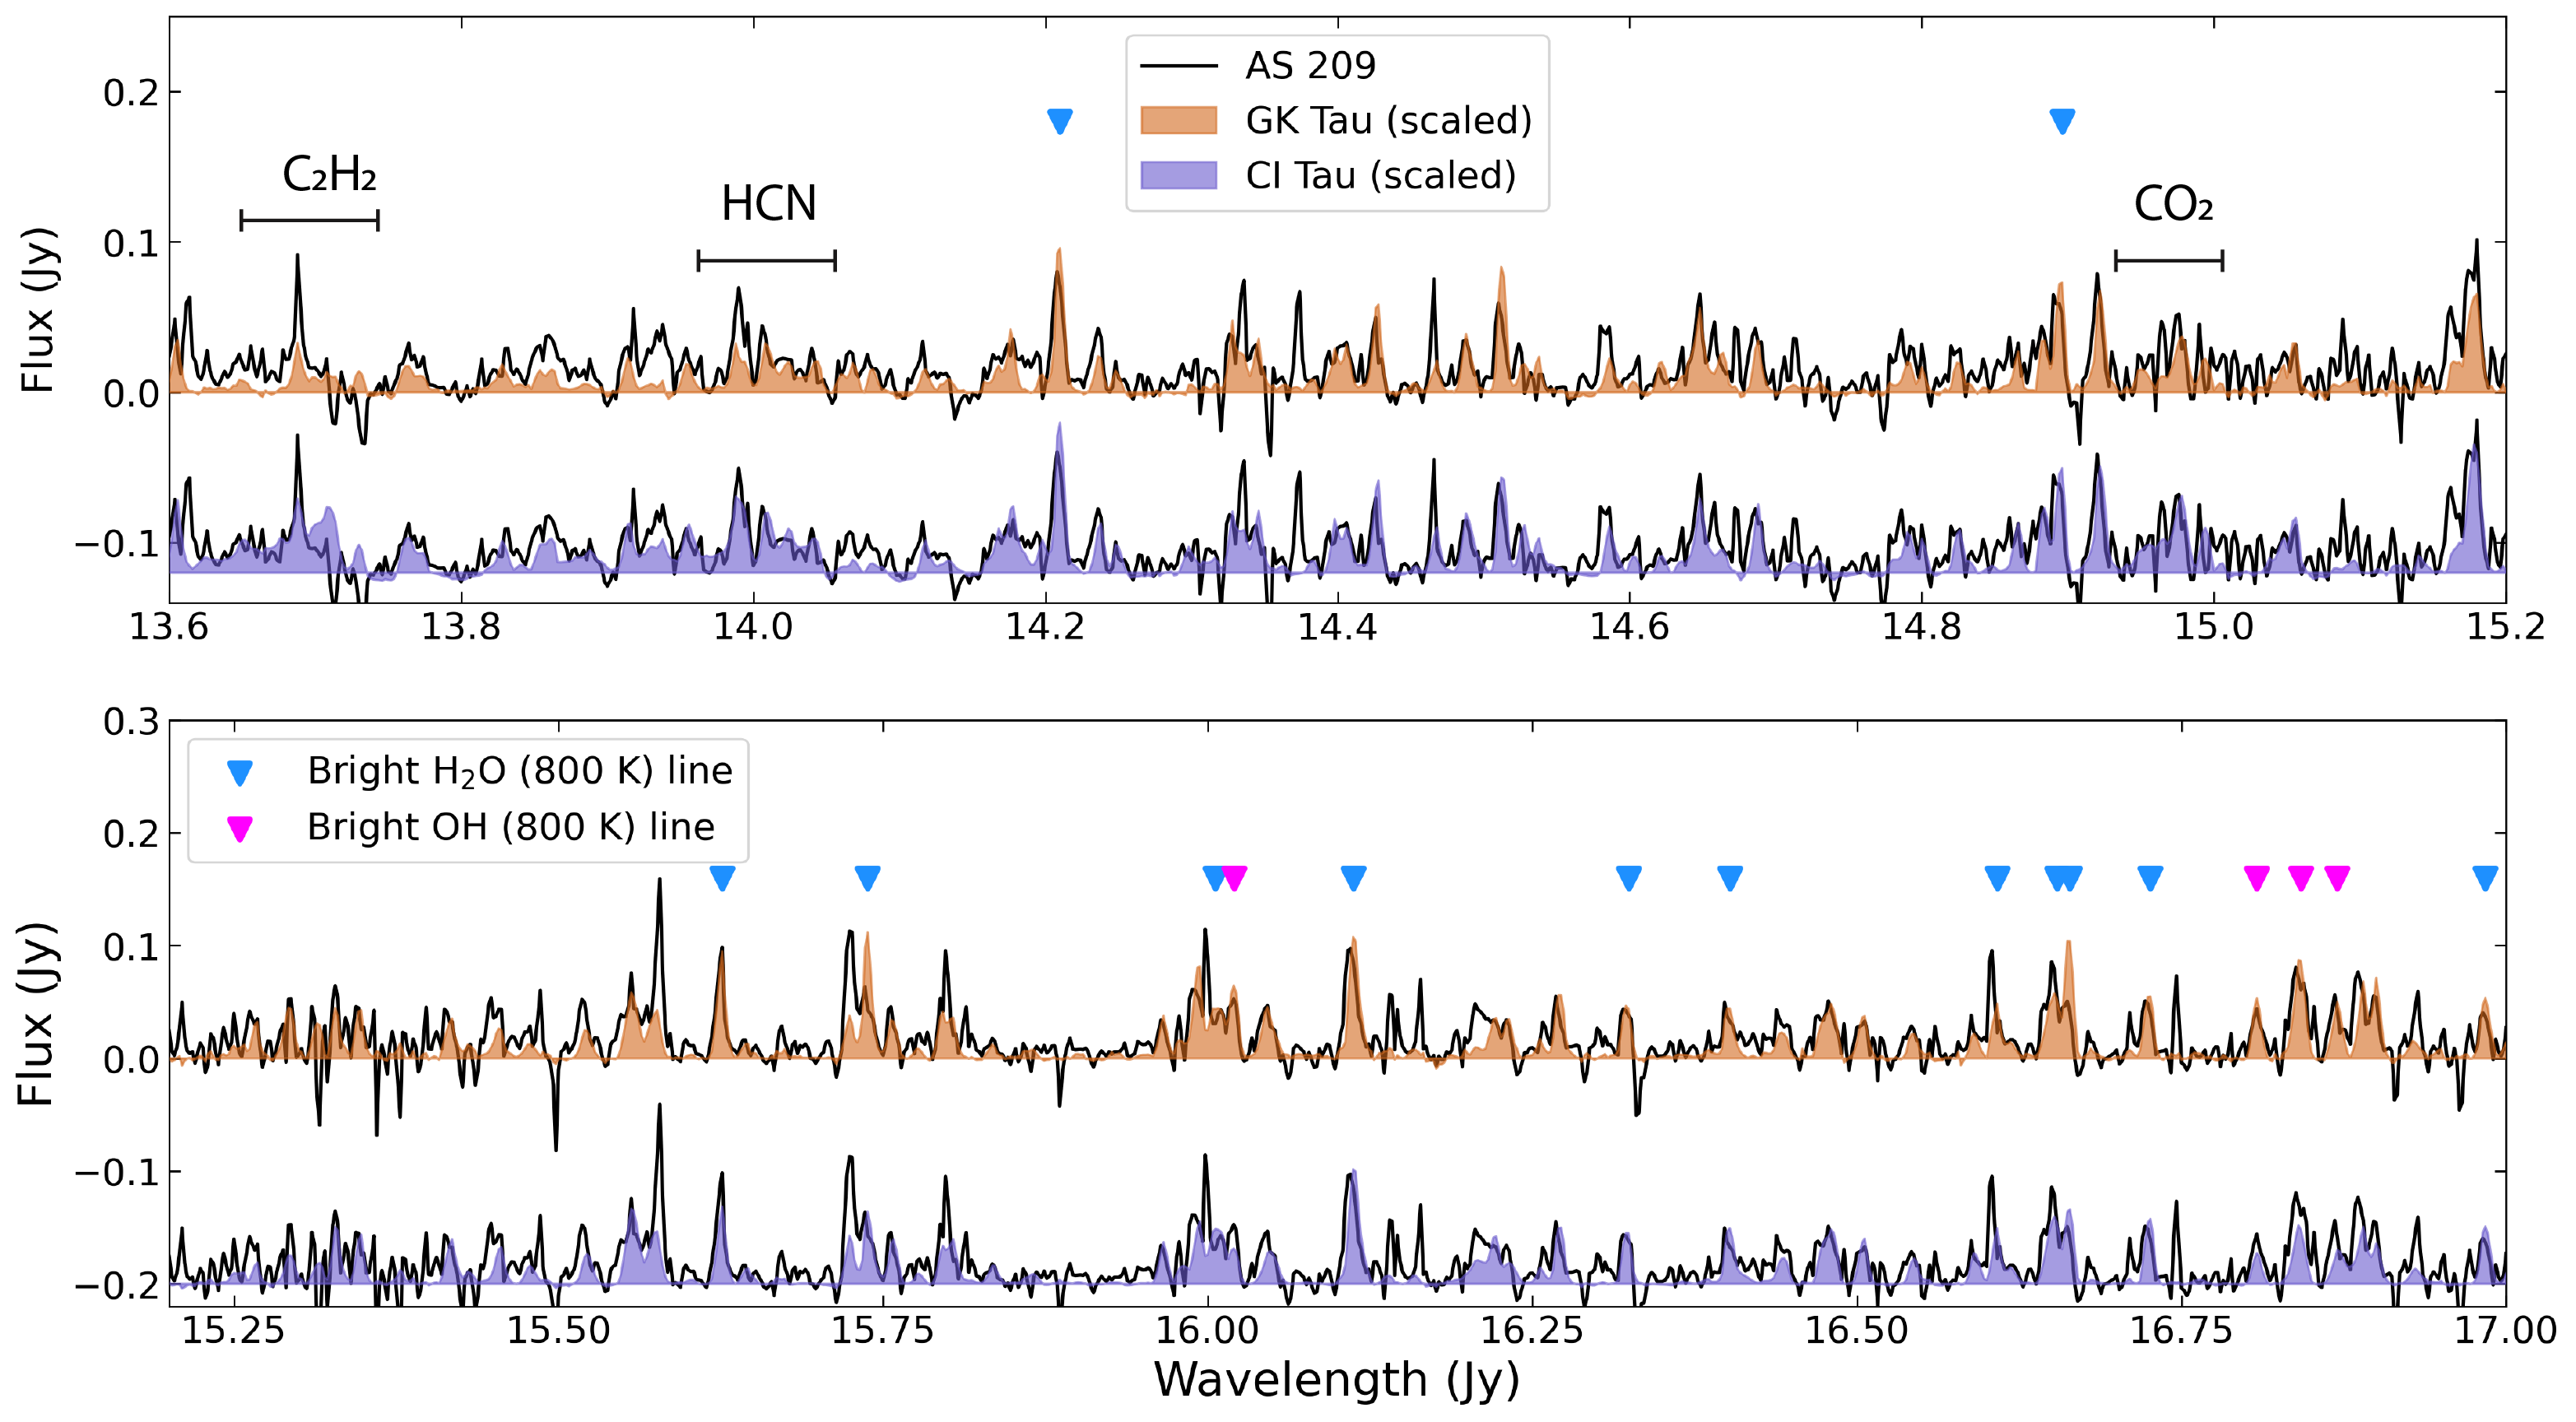
The GK Tau and CI Tau MIRI MRS spectra were obtained in program JWST Cycle 1 program GO-1640 (P.I. Andrea Banzatti), and were recently presented by Banzatti et al. (2023b) in the context of water delivery. The spectra were reduced and de-fringed using the same calibration pipeline applied in this work to AS 209 (Pontoppidan et al., 2023). To accurately compare all three spectra, we first scale the GK Tau and CI Tau data to the same distance as AS 209 (121 pc), assuming a distance of 160 pc for CI Tau and 129 pc for GK Tau (Gaia Collaboration et al., 2018). Next, we use the bright and optically-thick high-energy H2O lines near 16 m to remove the effects of differing line emitting areas (Banzatti et al., 2020). Specifically, we take the 16.05 – 16.6 and 17.0 – 17.3 m spectral ranges, and find the scaling factor that minimizes the sum of squared differences between each spectrum and that of AS 209. CI Tau is scaled by a factor of 0.44, while the GK Tau spectrum does not require any additional scaling.
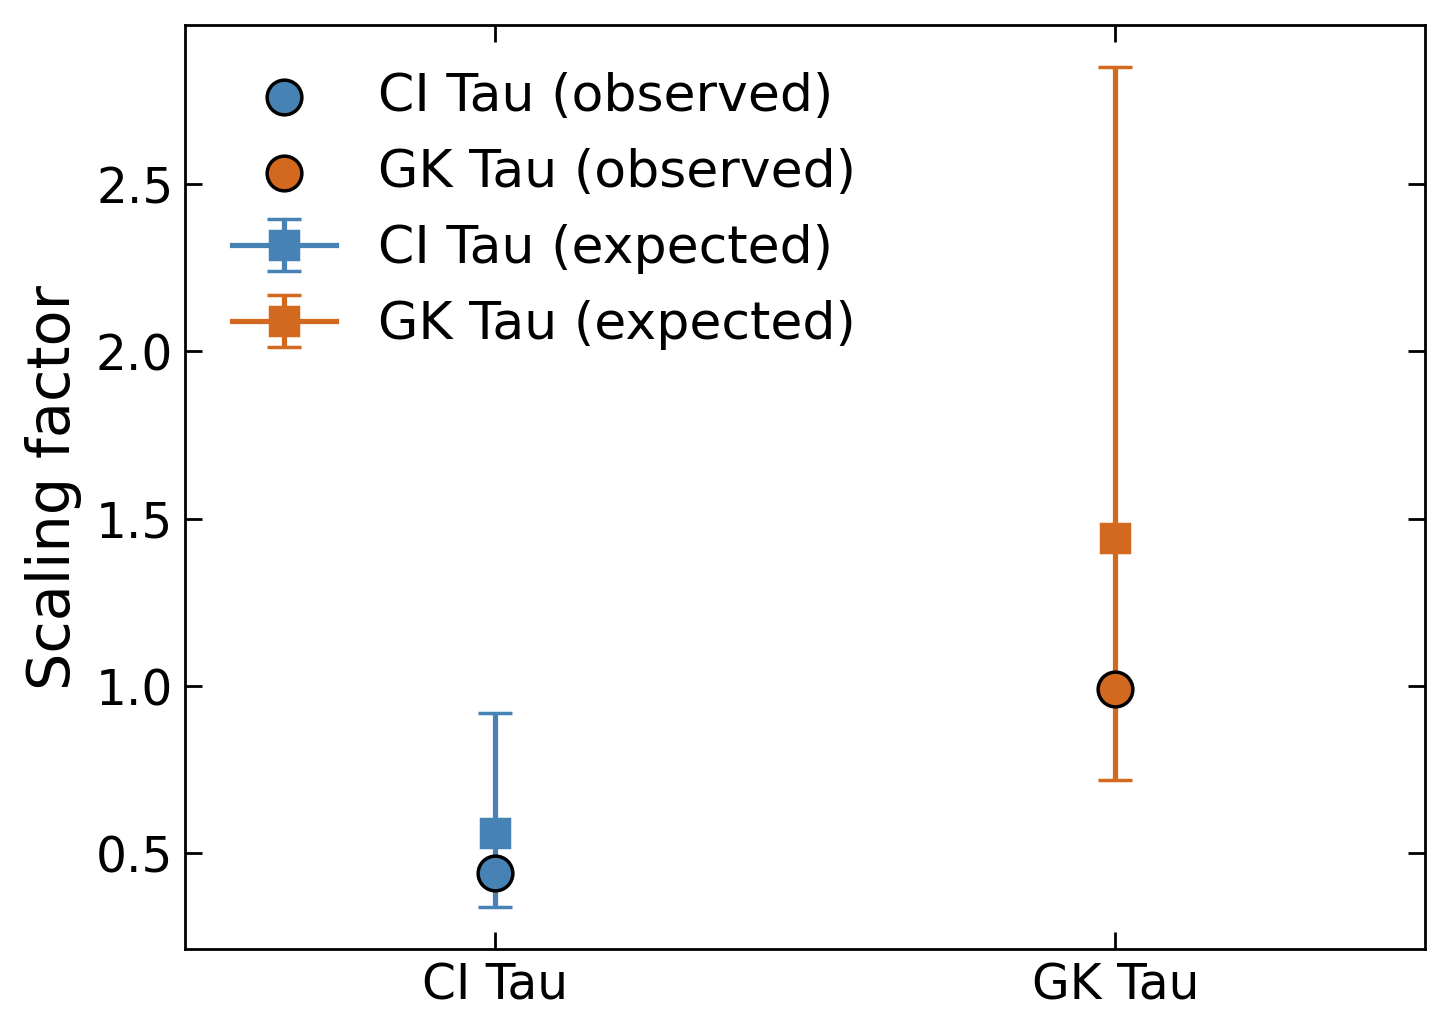
A first test is to determine whether the scaling factors necessary to match the optically-thick H2O line luminosities are consistent with the expectation based on the stellar accretion luminosity of each system. In particular, Banzatti et al. (2023b) find that the optically-thick H2O log line fluxes follow a relatively tight linear correlation with , with slope . Figure 7 shows the observed and expected scaling factors, assuming values of -1.12, -0.7, and -1.38 for AS 209, CI Tau, and GK Tau, respectively, and a typical uncertainty in (Fang et al., 2018). While the observed scaling factors are slightly lower than expected from effects alone, they are still fully consistent within the uncertainty. That is, we find no evidence that the hot water vapor reservoir of AS 209 is significantly more compact or diffuse relative to these CTTs.
Note however that the retrieved emitting area and column density of hot H2O in AS 209 are roughly an order of magnitude smaller and higher, respectively, compared to those reported for GK Tau and CI Tau by Banzatti et al. (2023b). We have reanalyzed the spectra of the latter two using the updated line modeling framework presented in this paper, and conclude that the difference does not reflect a real discrepancy in the water vapor distribution, but rather arises from a) a different intrinsic line FWHM used (1 km/s v. 4.7 km/s used in this work), and b) the distinct treatment of line overlap and opacities. These new water vapor retrievals will be presented in a forthcoming paper (Muñoz-Romero et al. in prep.).
Figure 8 shows the comparison between the MIRI MRS spectrum of AS 209 and the scaled spectra of CI Tau and GK Tau, from 13.6 to 17 m. For both disks, we find that their spectra are remarkably similar to that of AS 209. The OH, HCN and CO2 features detected in both CI Tau and GK Tau are consistent with the AS 209 data. In fact, based on visual inspection alone, the main HCN and CO2 branches seem to be slightly brighter in AS 209 compared to GK Tau. We surmise that neither species is atypically depleted in AS 209, but rather they are only marginally detected due to the lower data SNR. On the other hand, it appears that C2H2 may indeed be suppressed in AS 209, as indicated by our best fit model as well, but deeper observations will be necessary to confirm this and any possible implications regarding the gas phase C/O ratio in the inner disk.
5.2 Emission Variability
We conclude by comparing the MIRI MRS spectrum of AS 209 and best fit models to the previous observations of this disk with Spitzer IRS. AS 209 was observed as part of the cores to disks (c2d) Spitzer Legacy program (Evans et al., 2003), providing coverage from 9 to 37 m. The inner disk molecular emission was subsequently presented and characterized by Pontoppidan et al. (2010b) and Salyk et al. (2011). In particular, Salyk et al. (2011) reported the detection of water vapor and CO gas in AS 209, as well as a tentative detection of CO2. For H2O, Salyk et al. (2011) reported a best-fit column density of cm-2, an excitation temperature of 250 K, and an emitting area of 9 au2, which was obtained by fitting the integrated fluxes of 65 individual water lines. We find that this model strongly over-predicts the water line emission seen in the MIRI MRS spectrum. Previous observations and modeling thus missed the hot water reservoir that dominates the new observations and inferred a much larger and colder water reservoir than we find using JWST.
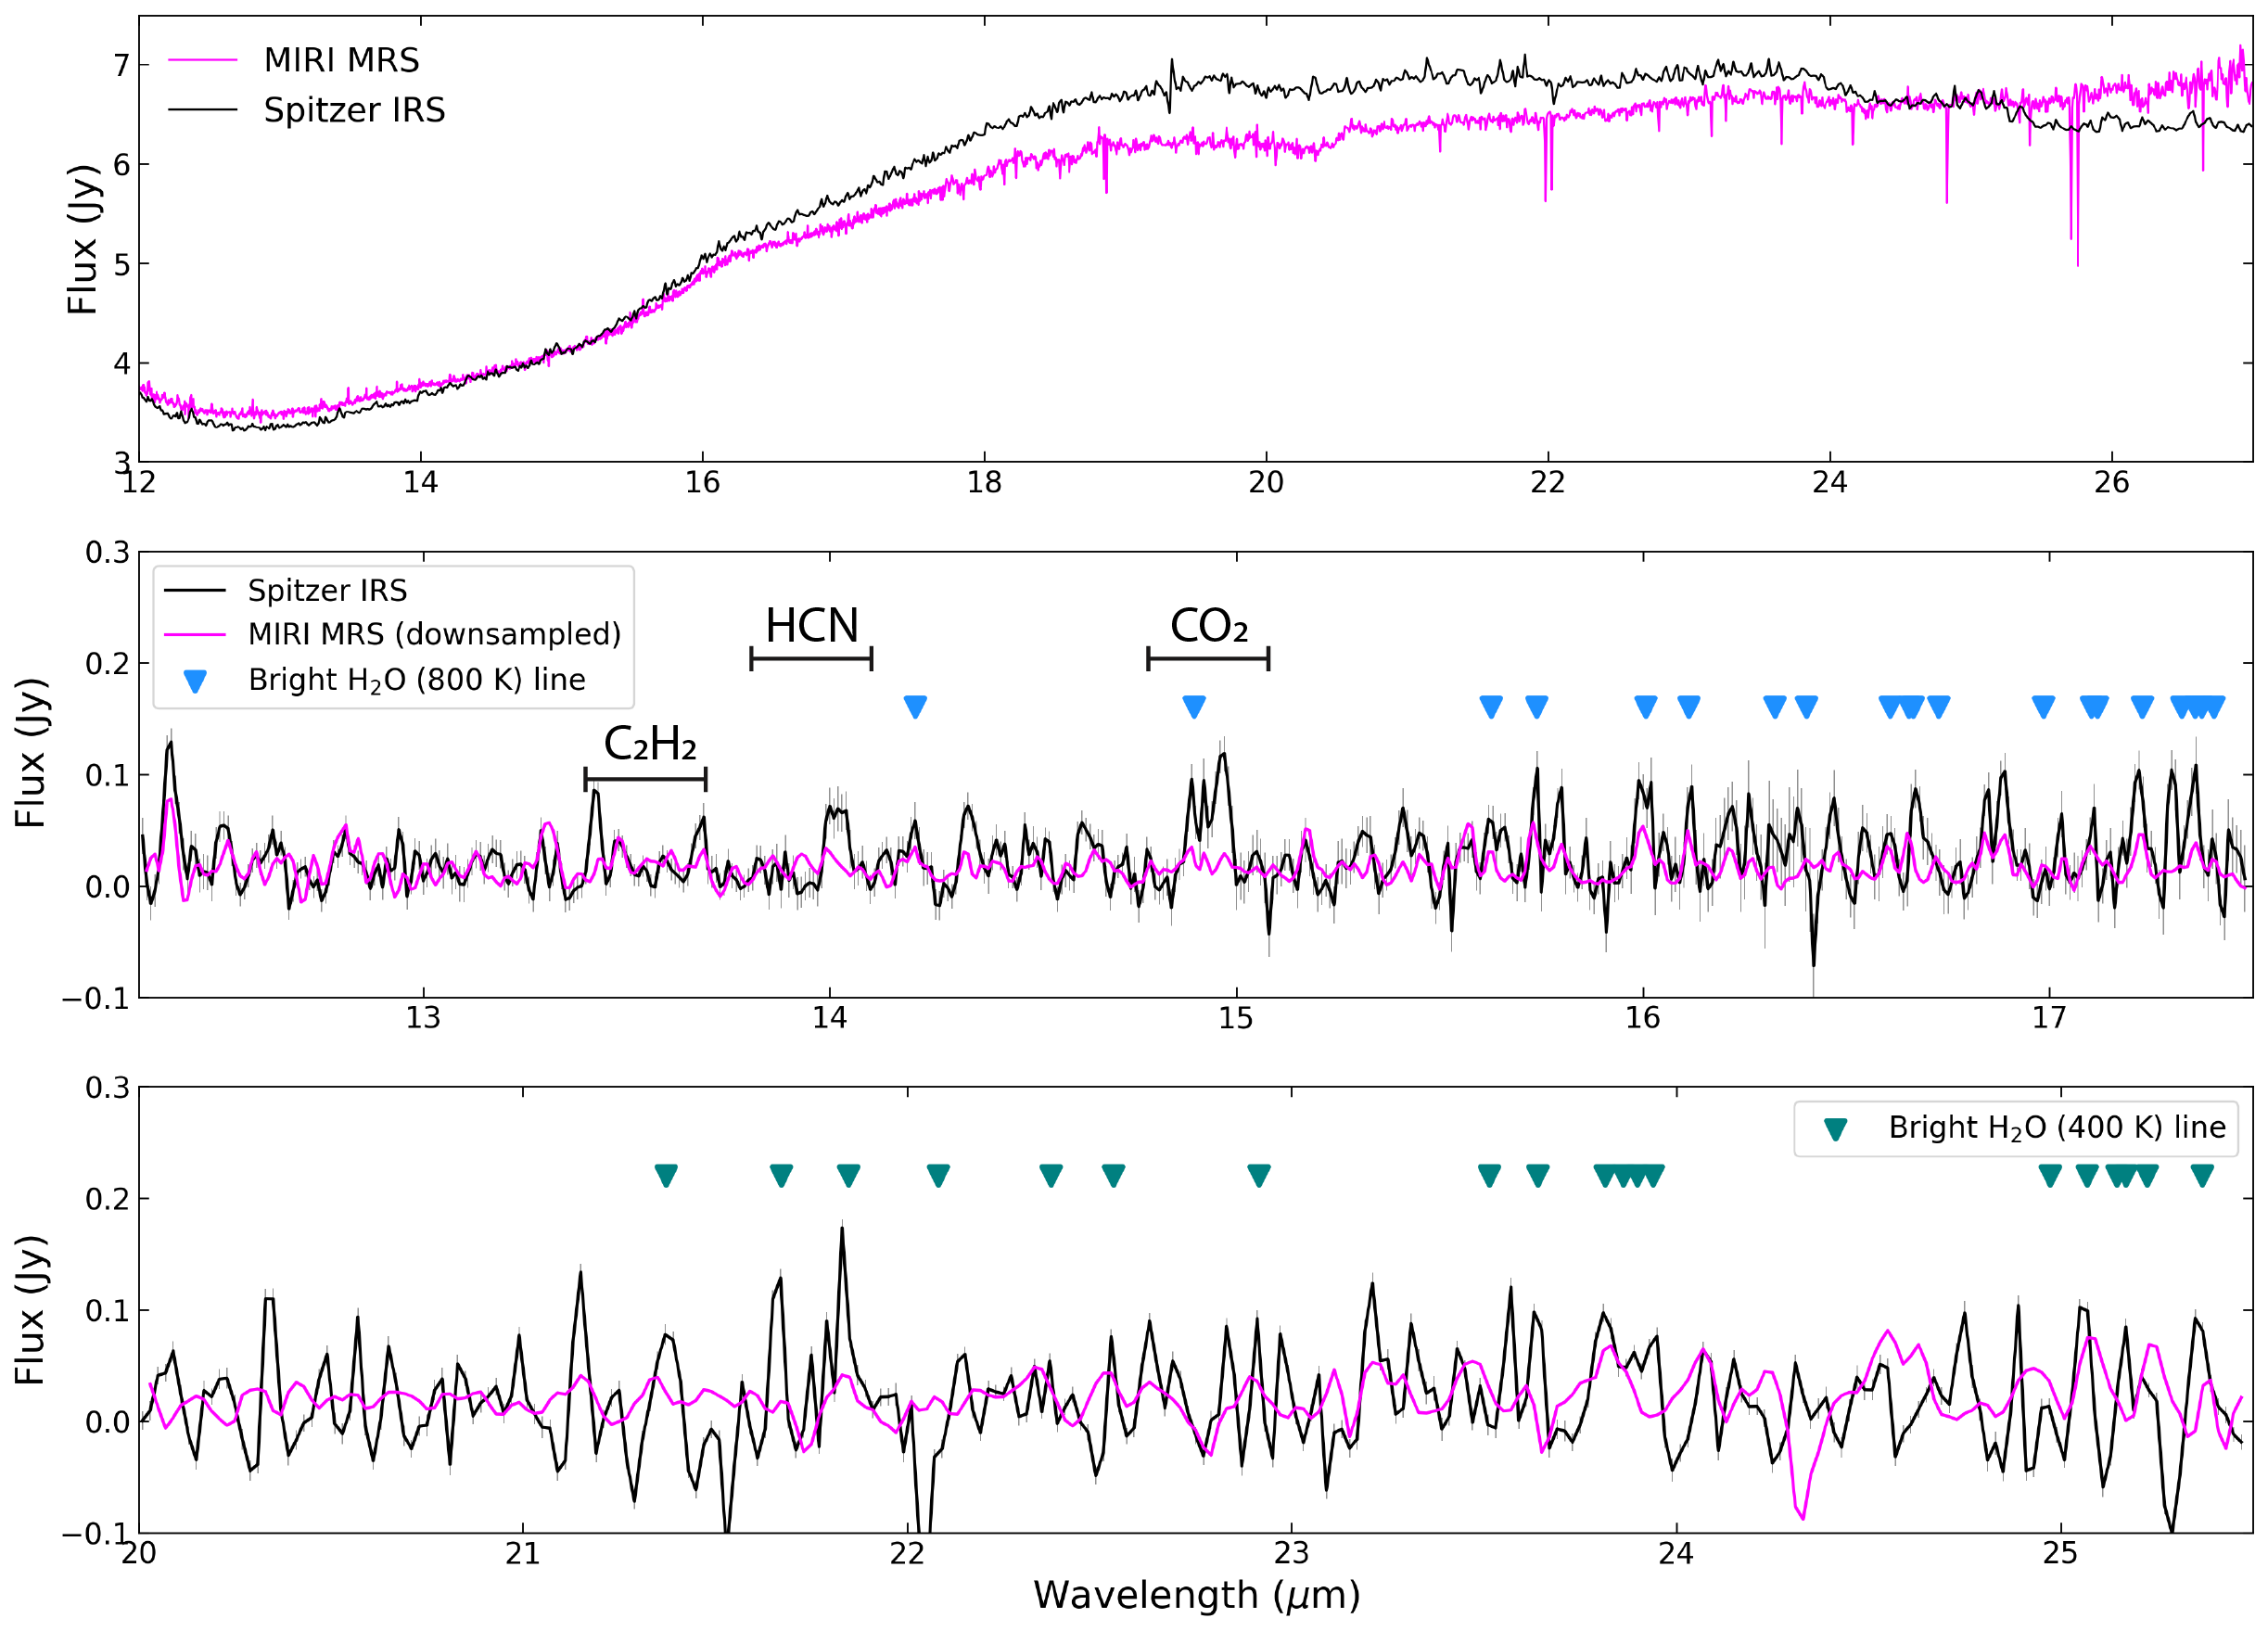
Figure 9 shows the Spitzer IRS and MIRI MRS (downsampled and convolved to the IRS resolving power of 600) spectra of AS 209. We subtract the continuum baseline from the IRS spectrum using the same pipeline applied to the MIRI MRS data. The error bars in the Spitzer IRS spectrum correspond to the flux uncertainty produced by the reduction pipeline used by Pontoppidan et al. (2010b). Note that the continuum emission at both epochs is quite similar, with the Spitzer IRS continuum being at most brighter near 20 m. On the other hand, we find substantial differences between the continuum-subtracted spectra. While some spectral regions, such as between 12 – 14 m are well matched, others require the MIRI MRS spectrum to be scaled up by factors of 2 – 4 to match the Spitzer IRS data. For instance, the region near the brightest CO2 branch at 15 m appears to be 4 as bright in Spitzer IRS, while some features between 16 – 17 m are twice as bright in Spitzer IRS.
| Species | Wavelength range (m) | Scaling factor |
|---|---|---|
| Hot H2O | [16.05 – 16.6], [17.0 – 17.3] | |
| OH | [16.75 – 16.9] | |
| Cold H2O | [21.6 – 21.9], [23.8 – 24.0] | |
| CO2 | [14.8 – 15.0] | |
| HCN | [13.8 – 14.1] |
Note. — Scaling factors necessary to match the emission from each species in the best fit model to MIRI MRS, with the Spitzer IRS data. The errors correspond to confidence intervals from curves.
The data suggest that the strength of the line emission in the disk of AS 209 has decreased from the epoch of the Spitzer IRS observations. Ideally, we would model the old observations to determine the extent of the variability, and whether the emission from some species has varied more than others. However, we are unable to obtain good fits to the Spitzer IRS data due to its low resolution and contrast. Rather, we provide an estimate of the variability of each species using the best fit models to the MIRI MRS data.
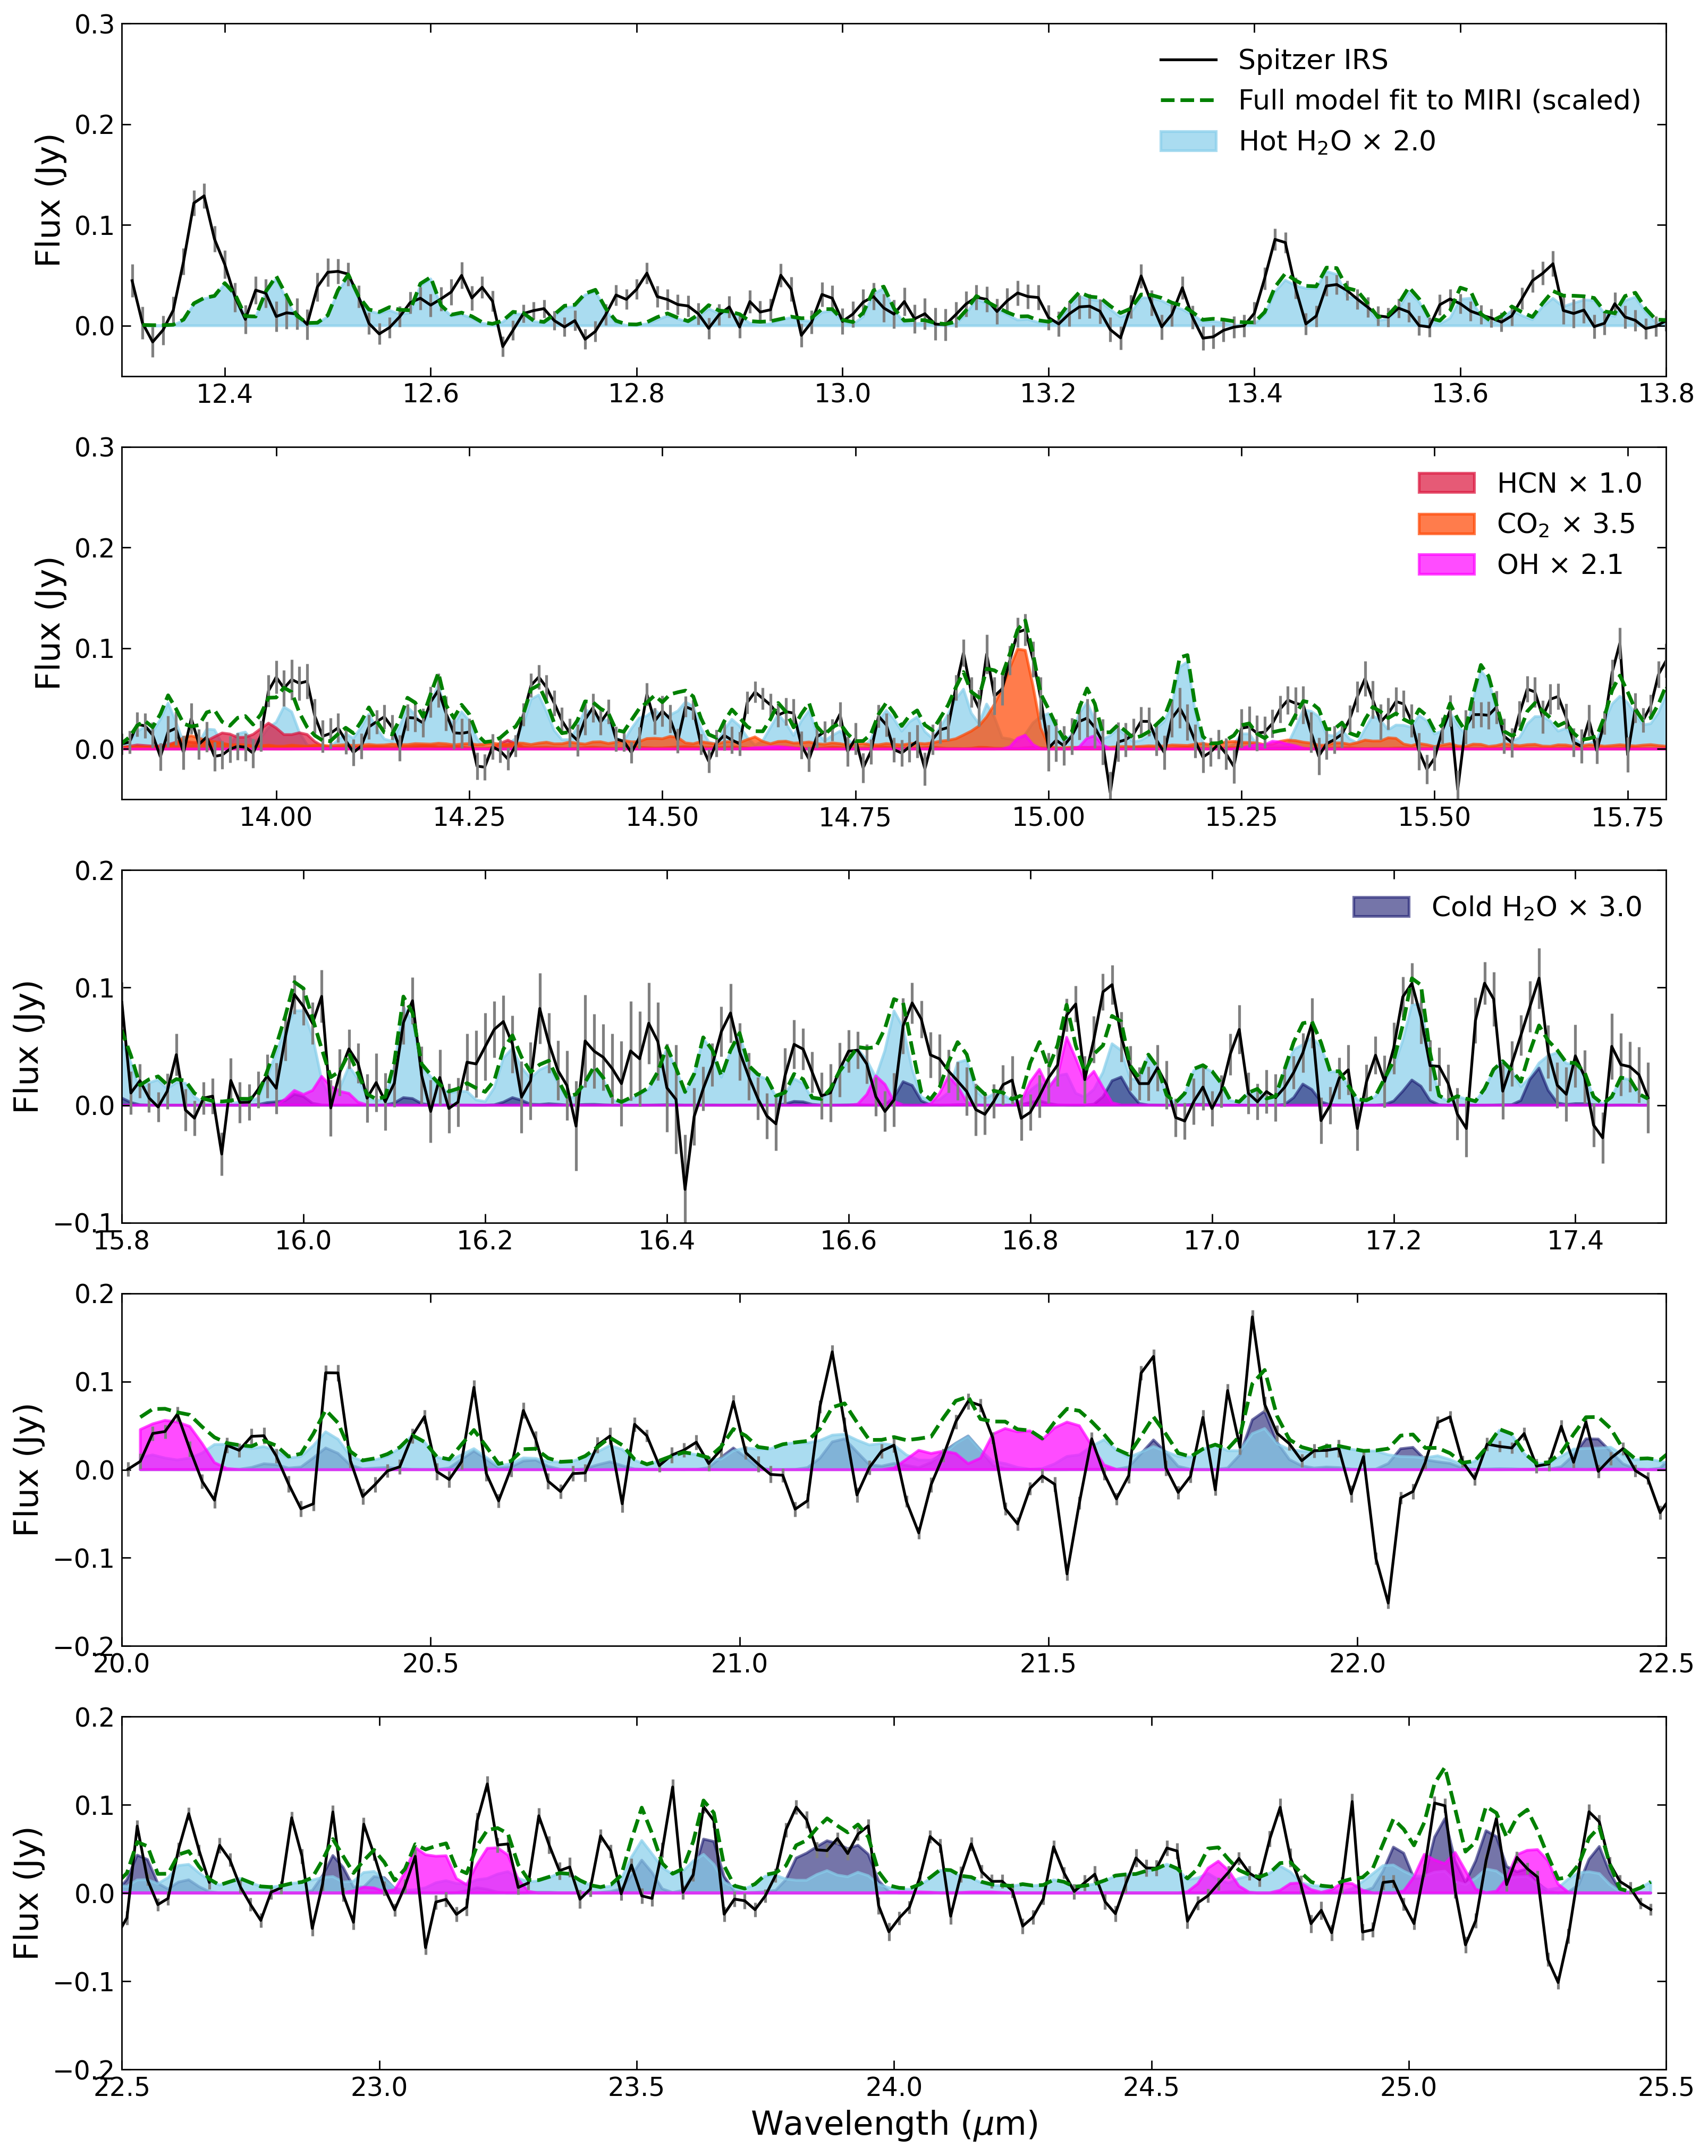
We estimate the (emitting area) scaling factor necessary to minimize the between the downsampled and convolved best fit hot H2O model to MIRI MRS and the Spitzer IRS data, using the same wavelength regions as in Section 5.1. Then, we subtract the scaled hot H2O model from the Spitzer IRS data, and find whether we need an additional scaling factor to match the emission from cold H2O, OH, CO2, and HCN. Table 2 lists the total scaling factors necessary to match the emission from each species, and the wavelength ranges used to estimate each. The latter are chosen based on where the models best reproduce the MIRI MRS data, while trying to avoid regions where lines of different species are strongly blended. We find that the emitting areas of hot H2O and OH have decreased by a factor of 2, while those of cold H2O and CO2 decreased by factors of 3 and 3.5, respectively. On the other hand, HCN does not appear to have changed. Figure 10 shows the Spitzer IRS data and the best fit model to MIRI MRS after applying the transformations described above.
It is unclear what physical mechanism could lead to the estimated emission variability. An accretion outburst during the Spitzer IRS observations could explain the brighter OH lines, as it would increase the rate of water photo-dissociation. It would also increase the disk temperature, explaining the more extended emitting areas. While there are no accurate accretion luminosity measurements at the time of the Spitzer IRS observations, based on the correlation derived by Banzatti et al. (2023b), a increase in would be necessary to explain the higher hot H2O line luminosities in the Spitzer IRS observations. However, a warmer disk would also produce a brighter continuum at the Spitzer IRS epoch, yet we do not see significant differences in the dust emission. At most, the continuum in the Spitzer IRS spectrum is 10 brighter than in the MIRI spectrum, and in some regions they are fully consistent. For comparison, the continuum emission of the well-studied EX Lup disk increased by a factor of 4 during an outburst which increased by 4.5 (Banzatti et al., 2012).
An alternative scenario could involve a ‘leak’ or sudden release of a large amount of icy material from an inner disk dust trap at the time of the Spitzer IRS observations (e.g. Stammler et al., 2023). The sublimation of O-rich ices could then explain why the line emission from cold H2O and O-carriers were preferentially affected. Otherwise, the sudden release of volatiles may be related to a giant impact, perhaps due to ongoing planet formation in the inner disk, but this scenario is highly speculative.
Ultimately, a thorough exploration of these and other ideas will be necessary to explain the observed variability, and follow-up monitoring of AS 209 with MIRI MRS may be necessary to the accomplish this goal. Furthermore, we recommend that similar comparisons with Spitzer IRS should be carried out as other sources are observed with MIRI MRS (e.g. Schwarz et al., 2023), which can help determine if this kind of line emission variability is a common phenomenon.
6 Summary
We present new observations of the AS 209 disk using JWST MIRI MRS as part of a mid-IR follow-up to the ALMA MAPS Large Program. Our main findings are as follows:
1. The mid-IR spectrum of the AS 209 disk exhibits bright emission from hot (700 - 900 K) water vapor and OH. CO2, HCN, and a colder water vapor component are marginally detected, whereas C2H2 is not detected. We emphasize that the spectrum is severely affected by noise artifacts that prevent an accurate characterization of the molecular gas.
2. Compared to high quality MIRI data of the T-Tauri disks CI Tau and GK Tau, the hot water vapor and OH emission spectra in AS 209 do not have atypical properties. HCN and CO2 emission features are not particularly weaker in the AS 209 spectrum. By contrast, C2H2 line emission in AS 209 is weaker.
3. A comparison with Spitzer IRS observations reveals molecular emission variability in the inner disk of AS 209. The emission from hot water vapor and OH decreased by a factor of 2, cold water vapor by a factor of 3, while CO2 emission decreased by a factor of 3.5. HCN does not appear to be affected. We consider an accretion outburst to be unlikely, given the large change in line fluxes but negligible variation in continuum emission. An explanation for the observed variability remains undetermined, but could be related to a triggered sublimation event and sudden release of water and organics during the epoch of the Spitzer observations.
Acknowledgments
The authors appreciate the anonymous referee for valuable comments that significantly improved the content, interpretation, and presentation of this work.
K.I.Ö. acknowledges support from the Simons Foundation (SCOL #321183), an award from the Simons Foundation (#321183FY19), and an NSF AAG Grant (#1907653).
Support for J. H. was provided by NASA through the NASA Hubble Fellowship grant #HST-HF2-51460.001-A awarded by the Space Telescope Science Institute, which is operated by the Association of Universities for Research in Astronomy, Inc., for NASA, under contract NAS5-26555.
Support for F. L. was provided by NASA through the NASA Hubble Fellowship grant #HST-HF2-51512.001-A awarded by the Space Telescope Science Institute, which is operated by the Association of Universities for Research in Astronomy, Incorporated, under NASA contract NAS5-26555.
Support for C. J. L. was provided by NASA through the NASA Hubble Fellowship grant No. HST-HF2-51535.001-A awarded by the Space Telescope Science Institute, which is operated by the Association of Universities for Research in Astronomy, Inc., for NASA, under contract NAS5-26555.
R. LG. acknowledges support from the Programme National “Physique et Chimie du Milieu Interstellaire” (PCMI) of CNRS/INSU with INC/INP co-funded by CEA and CNES.
F. M. has received funding from the European Research Council (ERC) under the European Union’s Horizon 2020 research and innovation program (grant agreement No. 101053020, project Dust2Planets).
V.V.G. gratefully acknowledges support from FONDECYT Regular 1221352, ANID BASAL project FB210003, and ANID, – Millennium Science Initiative Program – NCN19_171.
C.W. acknowledges financial support from the Science and Technology Facilities Council and UK Research and Innovation (grant numbers ST/X001016/1 and MR/T040726/1).
This work is based on observations made with the NASA/ ESA/CSA James Webb Space Telescope. The data were obtained from the Mikulski Archive for Space Telescopes at the Space Telescope Science Institute, which is operated by the Association of Universities for Research in Astronomy, Incorporated, under NASA contract NAS5-03127. The specific observations analyzed can be accessed via the following https://doi.org/10.17909/7snz-r967 (catalog DOI). Support for Program number (JWST-GO-02025.001-A) was provided through a grant from the STScI under NASA contract NAS5- 03127.
Appendix A Continuum Subtraction
Even after the removal of strong high-frequency fringes using asteroid spectra, we find it unfeasible to visually differentiate true line emission from artifacts, and thus to subtract the continuum emission in the AS 209 spectrum using splines as is customary. We thus develop an iterative Gaussian Processes (GP) continuum-subtraction technique, which does not require the prior manual identification of line-free regions. The procedure is described below.
First, we mask out negative intensity spikes in the spectrum. To do this we use the peak finding algorithm included in scipy (scipy.signal.find_peaks). Based on visual inspection of the results, we find good performance by setting a prominence parameter of 0.05 and distance between peaks of 2 pixels222For a detailed description of the algorithm and meaning of each parameter see: docs.scipy.org/doc/scipy/reference based on visual inspection of the data. Second, we condition a Gaussian Process to the masked data. In particular, we use a linear combination of three squared exponential covariance functions (i.e. kernels) , such that each is defined as:
| (A1) |
where and are the amplitude and correlation length scale, respectively, and represent any pair of points in the wavelength grid. With , we aim to capture the overall shape of the flux baseline, and we set mJy and m. Then, is set to model dust features and artifacts with mJy, but we constrain the length scale m to prevent it from erroneously removing broad emission features produced by the overlap of lines. is finally used to model the molecular line emission by setting mJy and m. These values are chosen based on prior predictive checks and visual inspection of the decomposition result. We experiment using different kernels like Matern covariance functions; the resulting decomposition is not overly sensitive to the exact choice of kernels as long as we use a mixture of functions with long and short correlation length scales, and ultimately we choose the exponential squared for its simplicity.
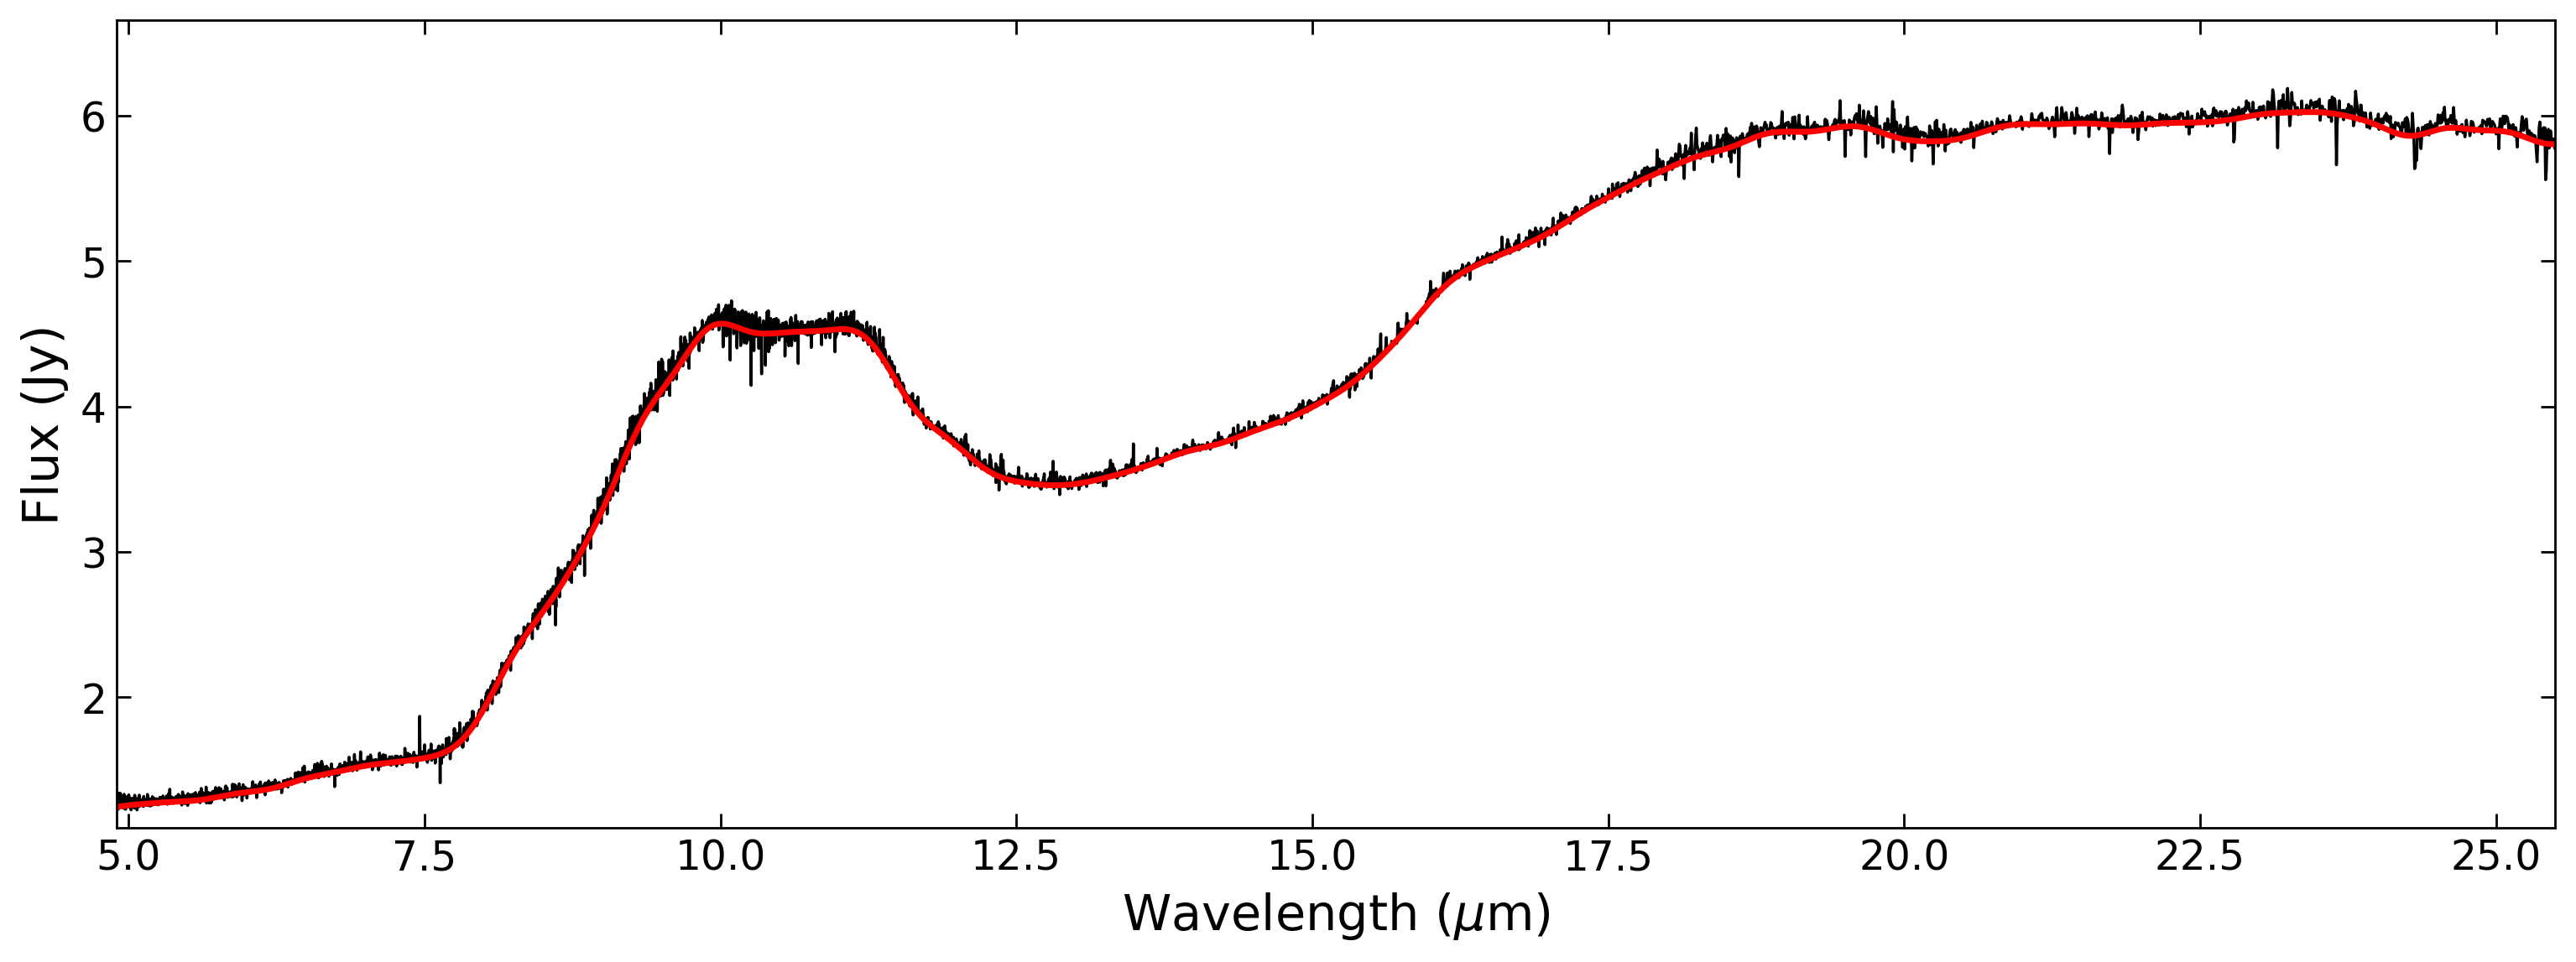
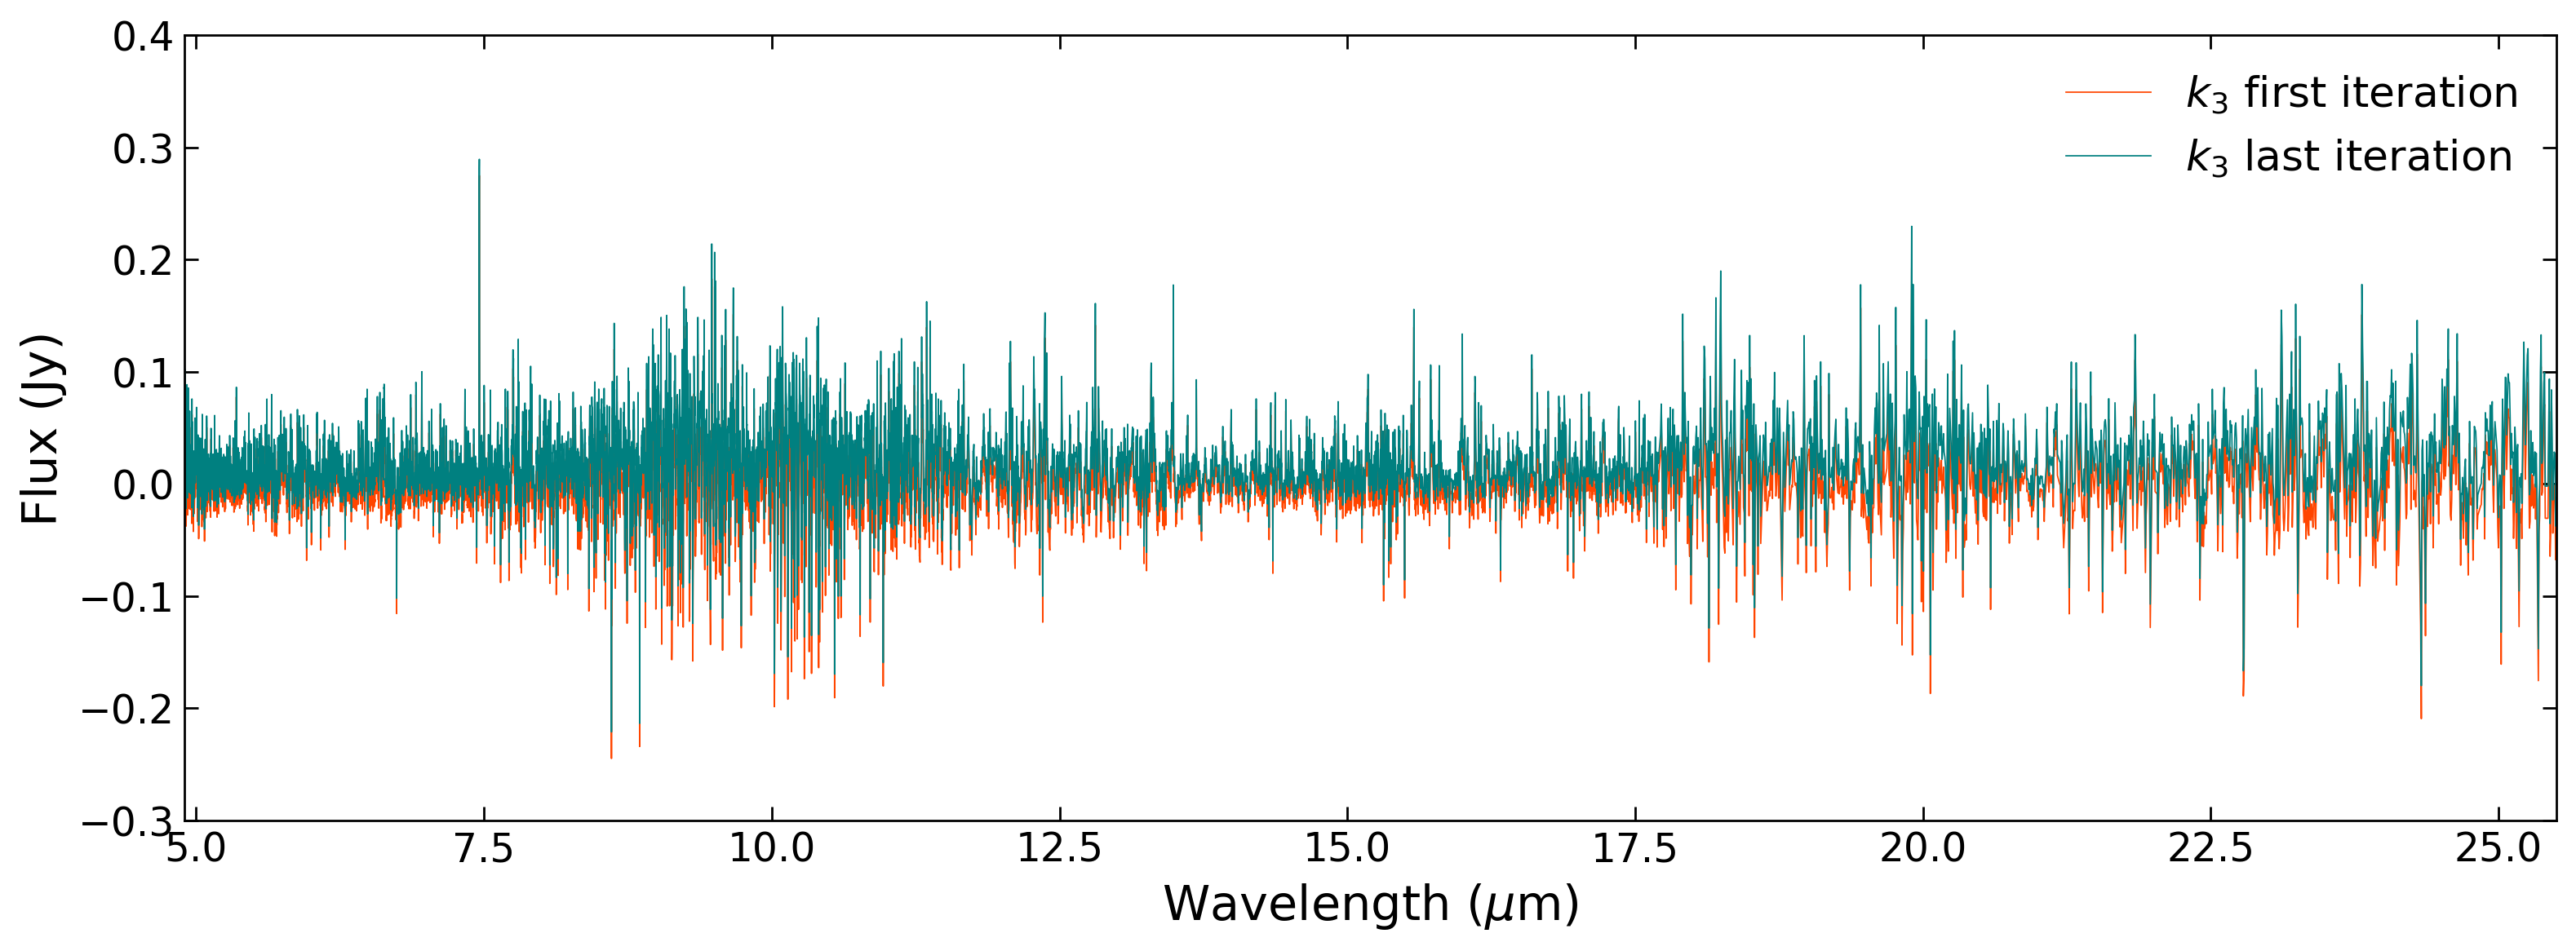
The model is conditioned on the data using the GP Python package tinyGP (Foreman-Mackey et al., 2022) assuming, initially, a mean of zero. By setting the mean of the process to zero, the conditioned continuum function described by does not trace a baseline under the line emission, but rather it follows the mean of the spectrum. Consequently, the line emission modeled by is incorrectly centered around zero. To solve this, we set all points of the conditioned contributions with negative values to zero, and repeat the GP conditioning using the contributions from as the new mean function of the process. At each iteration, the location of the continuum baseline is thus shifted downward by a small amount, but since and are constrained, the baseline is prevented from over-fitting the data and shifting the entire continuum-subtracted spectrum above zero. The process is repeated until the change in the standard deviation of the negative part of the conditioned model falls below 0.5 mJy (5 iterations). Finally, the resulting continuum baseline is linearly interpolated back onto the full wavelength grid and subtracted from the MIRI MRS spectrum, including those pixels flagged in the first step. We emphasize that the conditioned itself is not used as the continuum-subtracted spectrum, but rather the conditioned kernels subtracted from the data.
References
- Andrews et al. (2018) Andrews, S. M., Huang, J., Pérez, L. M., et al. 2018, ApJ, 869, L41, doi: 10.3847/2041-8213/aaf741
- Antonellini et al. (2015) Antonellini, S., Kamp, I., Riviere-Marichalar, P., et al. 2015, A&A, 582, A105, doi: 10.1051/0004-6361/201525724
- Bae et al. (2022) Bae, J., Teague, R., Andrews, S. M., et al. 2022, ApJ, 934, L20, doi: 10.3847/2041-8213/ac7fa3
- Banzatti et al. (2014) Banzatti, A., Meyer, M. R., Manara, C. F., Pontoppidan, K. M., & Testi, L. 2014, ApJ, 780, 26, doi: 10.1088/0004-637X/780/1/26
- Banzatti et al. (2012) Banzatti, A., Meyer, M. R., Bruderer, S., et al. 2012, ApJ, 745, 90, doi: 10.1088/0004-637X/745/1/90
- Banzatti et al. (2020) Banzatti, A., Pascucci, I., Bosman, A. D., et al. 2020, ApJ, 903, 124, doi: 10.3847/1538-4357/abbc1a
- Banzatti et al. (2023a) Banzatti, A., Pontoppidan, K. M., Pére Chávez, J., et al. 2023a, AJ, 165, 72, doi: 10.3847/1538-3881/aca80b
- Banzatti et al. (2023b) Banzatti, A., Pontoppidan, K. M., Carr, J., et al. 2023b, arXiv e-prints, arXiv:2307.03846, doi: 10.48550/arXiv.2307.03846
- Bergner et al. (2018) Bergner, J. B., Guzmán, V. G., Öberg, K. I., Loomis, R. A., & Pegues, J. 2018, ApJ, 857, 69, doi: 10.3847/1538-4357/aab664
- Berné et al. (2023) Berné, O., Martin-Drumel, M.-A., Schroetter, I., et al. 2023, Nature, 621, 56, doi: 10.1038/s41586-023-06307-x
- Birnstiel et al. (2010) Birnstiel, T., Ricci, L., Trotta, F., et al. 2010, A&A, 516, L14, doi: 10.1051/0004-6361/201014893
- Blevins et al. (2016) Blevins, S. M., Pontoppidan, K. M., Banzatti, A., et al. 2016, ApJ, 818, 22, doi: 10.3847/0004-637X/818/1/22
- Bosman et al. (2022) Bosman, A. D., Bergin, E. A., Calahan, J., & Duval, S. E. 2022, ApJ, 930, L26, doi: 10.3847/2041-8213/ac66ce
- Bushouse et al. (2023) Bushouse, H., Eisenhamer, J., Dencheva, N., et al. 2023, JWST Calibration Pipeline, 1.11.0, Zenodo, doi: 10.5281/zenodo.8067394
- Carnall (2021) Carnall, A. 2021, SpectRes: Simple spectral resampling, Astrophysics Source Code Library, record ascl:2104.019. http://ascl.net/2104.019
- Carr & Najita (2008) Carr, J. S., & Najita, J. R. 2008, Science, 319, 1504, doi: 10.1126/science.1153807
- Carr & Najita (2011) —. 2011, ApJ, 733, 102, doi: 10.1088/0004-637X/733/2/102
- Carr & Najita (2014) —. 2014, ApJ, 788, 66, doi: 10.1088/0004-637X/788/1/66
- Carr et al. (2004) Carr, J. S., Tokunaga, A. T., & Najita, J. 2004, ApJ, 603, 213, doi: 10.1086/381356
- Ciesla & Cuzzi (2006) Ciesla, F. J., & Cuzzi, J. N. 2006, Icarus, 181, 178, doi: 10.1016/j.icarus.2005.11.009
- Dominik & Tielens (1997) Dominik, C., & Tielens, A. G. G. M. 1997, ApJ, 480, 647, doi: 10.1086/303996
- Du et al. (2017) Du, F., Bergin, E. A., Hogerheijde, M., et al. 2017, ApJ, 842, 98, doi: 10.3847/1538-4357/aa70ee
- Evans et al. (2003) Evans, Neal J., I., Allen, L. E., Blake, G. A., et al. 2003, PASP, 115, 965, doi: 10.1086/376697
- Fang et al. (2018) Fang, M., Pascucci, I., Edwards, S., et al. 2018, ApJ, 868, 28, doi: 10.3847/1538-4357/aae780
- Favre et al. (2019) Favre, C., Fedele, D., Maud, L., et al. 2019, ApJ, 871, 107, doi: 10.3847/1538-4357/aaf80c
- Fedele et al. (2011) Fedele, D., Pascucci, I., Brittain, S., et al. 2011, ApJ, 732, 106, doi: 10.1088/0004-637X/732/2/106
- Foreman-Mackey et al. (2022) Foreman-Mackey, D., Yadav, S., Theorashid, et al. 2022, dfm/tinygp: v0.2.3, v0.2.3, Zenodo, Zenodo, doi: 10.5281/zenodo.7269074
- Gaia Collaboration et al. (2018) Gaia Collaboration, Brown, A. G. A., Vallenari, A., et al. 2018, A&A, 616, A1, doi: 10.1051/0004-6361/201833051
- Gommers et al. (2023) Gommers, R., Virtanen, P., Burovski, E., et al. 2023, scipy/scipy: SciPy 1.10.1, v1.10.1, Zenodo, Zenodo, doi: 10.5281/zenodo.7655153
- Gordon et al. (2022) Gordon, I. E., Rothman, L. S., Hargreaves, R. J., et al. 2022, J. Quant. Spec. Radiat. Transf., 277, 107949, doi: 10.1016/j.jqsrt.2021.107949
- Grant et al. (2022) Grant, S. L., van Dishoeck, E. F., Tabone, B., et al. 2022, arXiv e-prints, arXiv:2212.08047, doi: 10.48550/arXiv.2212.08047
- Gundlach & Blum (2015) Gundlach, B., & Blum, J. 2015, ApJ, 798, 34, doi: 10.1088/0004-637X/798/1/34
- Guzmán et al. (2018) Guzmán, V. V., Huang, J., Andrews, S. M., et al. 2018, ApJ, 869, L48, doi: 10.3847/2041-8213/aaedae
- Harris et al. (2020) Harris, C. R., Millman, K. J., van der Walt, S. J., et al. 2020, Nature, 585, 357, doi: 10.1038/s41586-020-2649-2
- Herbst & van Dishoeck (2009) Herbst, E., & van Dishoeck, E. F. 2009, ARA&A, 47, 427, doi: 10.1146/annurev-astro-082708-101654
- Hogerheijde et al. (2011) Hogerheijde, M. R., Bergin, E. A., Brinch, C., et al. 2011, Science, 334, 338, doi: 10.1126/science.1208931
- Houck et al. (2004) Houck, J. R., Roellig, T. L., Van Cleve, J., et al. 2004, in Society of Photo-Optical Instrumentation Engineers (SPIE) Conference Series, Vol. 5487, Optical, Infrared, and Millimeter Space Telescopes, ed. J. C. Mather, 62–76, doi: 10.1117/12.550517
- Huang et al. (2017) Huang, J., Öberg, K. I., Qi, C., et al. 2017, ApJ, 835, 231, doi: 10.3847/1538-4357/835/2/231
- Huang et al. (2018) Huang, J., Andrews, S. M., Dullemond, C. P., et al. 2018, ApJ, 869, L42, doi: 10.3847/2041-8213/aaf740
- Kóspál et al. (2023) Kóspál, Á., Ábrahám, P., Diehl, L., et al. 2023, ApJ, 945, L7, doi: 10.3847/2041-8213/acb58a
- Law et al. (2021) Law, C. J., Loomis, R. A., Teague, R., et al. 2021, ApJS, 257, 3, doi: 10.3847/1538-4365/ac1434
- Long et al. (2019) Long, F., Herczeg, G. J., Harsono, D., et al. 2019, ApJ, 882, 49, doi: 10.3847/1538-4357/ab2d2d
- Mandell et al. (2012) Mandell, A. M., Bast, J., van Dishoeck, E. F., et al. 2012, ApJ, 747, 92, doi: 10.1088/0004-637X/747/2/92
- Meijerink et al. (2009) Meijerink, R., Pontoppidan, K. M., Blake, G. A., Poelman, D. R., & Dullemond, C. P. 2009, ApJ, 704, 1471, doi: 10.1088/0004-637X/704/2/1471
- Munoz-Romero et al. (2023) Munoz-Romero, C. E., Banzatti, A., & Öberg, K. I. 2023, iris (InfraRed Isothermal Slabs), 0.1.0, Zenodo, doi: 10.5281/zenodo.10369000
- Najita et al. (2011) Najita, J. R., Ádámkovics, M., & Glassgold, A. E. 2011, ApJ, 743, 147, doi: 10.1088/0004-637X/743/2/147
- Najita et al. (2018) Najita, J. R., Carr, J. S., Salyk, C., et al. 2018, ApJ, 862, 122, doi: 10.3847/1538-4357/aaca39
- Najita et al. (2010) Najita, J. R., Carr, J. S., Strom, S. E., et al. 2010, ApJ, 712, 274, doi: 10.1088/0004-637X/712/1/274
- Öberg & Bergin (2021) Öberg, K. I., & Bergin, E. A. 2021, Phys. Rep., 893, 1, doi: 10.1016/j.physrep.2020.09.004
- Öberg et al. (2011) Öberg, K. I., Qi, C., Fogel, J. K. J., et al. 2011, ApJ, 734, 98, doi: 10.1088/0004-637X/734/2/98
- Öberg et al. (2021) Öberg, K. I., Guzmán, V. V., Walsh, C., et al. 2021, ApJS, 257, 1, doi: 10.3847/1538-4365/ac1432
- Pontoppidan & Blevins (2014) Pontoppidan, K. M., & Blevins, S. M. 2014, Faraday Discussions, 168, 49, doi: 10.1039/C3FD00141E
- Pontoppidan et al. (2010a) Pontoppidan, K. M., Salyk, C., Blake, G. A., & Käufl, H. U. 2010a, ApJ, 722, L173, doi: 10.1088/2041-8205/722/2/L173
- Pontoppidan et al. (2010b) Pontoppidan, K. M., Salyk, C., Blake, G. A., et al. 2010b, ApJ, 720, 887, doi: 10.1088/0004-637X/720/1/887
- Pontoppidan et al. (2023) Pontoppidan, K. M., Salyk, C., Banzatti, A., et al. 2023, arXiv e-prints, arXiv:2311.17020, doi: 10.48550/arXiv.2311.17020
- Rieke et al. (2015) Rieke, G. H., Wright, G. S., Böker, T., et al. 2015, PASP, 127, 584, doi: 10.1086/682252
- Robitaille et al. (2021) Robitaille, T., Tollerud, E., Aldcroft, T., et al. 2021, astropy/astropy: v4.2.1, v4.2.1, Zenodo, Zenodo, doi: 10.5281/zenodo.4670729
- Salyk et al. (2019) Salyk, C., Lacy, J., Richter, M., et al. 2019, ApJ, 874, 24, doi: 10.3847/1538-4357/ab05c3
- Salyk et al. (2008) Salyk, C., Pontoppidan, K. M., Blake, G. A., et al. 2008, ApJ, 676, L49, doi: 10.1086/586894
- Salyk et al. (2011) Salyk, C., Pontoppidan, K. M., Blake, G. A., Najita, J. R., & Carr, J. S. 2011, ApJ, 731, 130, doi: 10.1088/0004-637X/731/2/130
- Schwarz et al. (2023) Schwarz, K. R., Henning, T., Christiaens, V., et al. 2023, arXiv e-prints, arXiv:2312.07135, doi: 10.48550/arXiv.2312.07135
- Sierra et al. (2021) Sierra, A., Pérez, L. M., Zhang, K., et al. 2021, ApJS, 257, 14, doi: 10.3847/1538-4365/ac1431
- Speagle (2020) Speagle, J. S. 2020, MNRAS, 493, 3132, doi: 10.1093/mnras/staa278
- Stammler et al. (2023) Stammler, S. M., Lichtenberg, T., Drazkowska, J., & Birnstiel, T. 2023, A&A, 670, L5, doi: 10.1051/0004-6361/202245512
- Stevenson & Lunine (1988) Stevenson, D. J., & Lunine, J. I. 1988, Icarus, 75, 146, doi: 10.1016/0019-1035(88)90133-9
- Tabone et al. (2023) Tabone, B., Bettoni, G., van Dishoeck, E. F., et al. 2023, Nature Astronomy, 7, 805, doi: 10.1038/s41550-023-01965-3
- van Dishoeck et al. (2014) van Dishoeck, E. F., Bergin, E. A., Lis, D. C., & Lunine, J. I. 2014, in Protostars and Planets VI, ed. H. Beuther, R. S. Klessen, C. P. Dullemond, & T. Henning, 835–858, doi: 10.2458/azu_uapress_9780816531240-ch036
- Wells et al. (2015) Wells, M., Pel, J. W., Glasse, A., et al. 2015, PASP, 127, 646, doi: 10.1086/682281
- Woitke et al. (2019) Woitke, P., Kamp, I., Antonellini, S., et al. 2019, PASP, 131, 064301, doi: 10.1088/1538-3873/aaf4e5
- Zhang et al. (2013) Zhang, K., Pontoppidan, K. M., Salyk, C., & Blake, G. A. 2013, ApJ, 766, 82, doi: 10.1088/0004-637X/766/2/82