[a]IRFU, CEA, Université Paris-Saclay, Gif-sur-Yvette, France \affiliation[b]BioMAPs, Service Hospitalier Frédéric Joliot, CEA, CNRS, Inserm, Université Paris-Saclay, Orsay, France \affiliation[c]IJCLab, IN2P3, CNRS, Université Paris-Saclay, Orsay, France \affiliation[d]European Institute for Molecular Imaging, University of Münster, Münster, Germany \affiliation[e]Nuclear Physics Institute, University of Münster, Münster, Germany \emailAddviatcheslav.sharyy@cea.fr
Characterization of the BOLDPET optical prototype, an innovative Cherenkov detector for 511 keV radiation.
Abstract
In the present work we describe the design, construction, and testing of the optical prototype developed for the BOLDPET project, with the objective of creating a PET detection module with high spatial and time resolution. The BOLDPET technology uses an innovative detection liquid, trimethylbismuth, for detecting 511 keV -quanta resulting from positron annihilation. The optical signal is exclusively produced through the Cherenkov mechanism, and the produced photons are detected using Planacon microchannel-plate photomultiplier. We achieve an excellent time resolution of 150 ps (FWHM) within a sizable detection volume measuring 55 mm x 55 mm x 25 mm. Through detailed Geant4 simulations, we examine the limiting factors affecting time resolution and explore potential avenues for improvement. Furthermore, we demonstrate the feasibility of coarse 2D localization of interactions using the optical signal alone, achieving a precision of about 5-8 mm (FWHM) within the homogeneous detection volume.
Cherenkov Detector, Gamma Detector, Nuclear Imaging, PET, Time-Of-Flight, SAMPIC, Planacon, MCP-PMT
1 Introduction
Positron Emission Tomography (PET) is a non-invasive medical imaging technique allowing to visualize a radioactive tracer in a patient body with a sensitivity down to picomole level. It is widely used in oncology, cardiology, neurology, and biomedical research [1, 2, 3]. Despite its sensitivity, PET has a modest spatial resolution of 3-4 mm (FWHM) for whole-body or brain-sized scanners [4, 5, 6, 7]. However, the physical limits imposed by the positron range and two gamma acollinearity suggest that PET can achieve a resolution of less than 1 mm [8, 9, 10, 11, 12]. This creates an opportunity for the development of more accurate scanners, which are of significant interest, particularly for brain studies.
One approach to achieving high resolution is to use a matrix of scintillating crystals with a typical size of 1 mm x 1 mm and read them out individually. It is realized in the preclinical-size PET scanners reaching the spatial resolution of about 1 mm, see e.g. [13, 14, 15]. However, this method requires a high number of electronics channels and is expensive when applied to a brain-sized scanner. Another challenge arises in the requirement for utilizing small voxels (i.e., 1 mm3) for image reconstruction. This demands either augmenting statistics through prolonged scan times or elevated injected activity, or refining the signal-to-noise ratio by implementing the time-of-flight (TOF) technique \citepVandenberghe_2016,Lecoq2020Oct,Schaart2021Apr. Moreover, the ability to measure depth-of-interaction coordinate in the detection module decreases the parallax error during reconstruction and improves spatial resolution. In recent years, the use of monolithic crystals has gained significant interest as a promising solution to address these challenges in high-precision PET applications [19, 20, 21, 22, 23]. This technology addresses these issues and also facilitates the reconstruction of 3D coordinates along with the incorporation of time-of-flight (TOF) capability.
We study an alternative approach in the BOLDPET project (Bismuth Organometallic Liquid Detector for Positron Emission Tomography). We propose to use a heavy liquid media, trimethylbismuth (TMBi), for detecting the -quanta from the positron annihilation. TMBi liquid has a short, 25 mm, attenuation length and high, 47%, photoelectric fraction for converting the 511 keV photon into a relativistic electron. This electron produces about 20 Cherenkov photons and ionizes the medium. The detector operates as a time-projection chamber and detects both light and charge signals, see Fig. 1 and [24, 25].
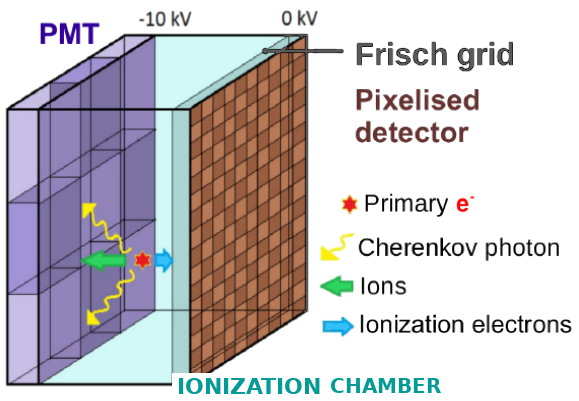
Ionization signal is read-out in a classical Frisch grid configuration using densely pixelated anode matrix and is used to determine precisely the 2D position of the interaction. The optical photons provide a precise timing to determine the 3D coordinate using the ionization drift time and to improve the quality of the image reconstruction with the time-of-flight technique. Such detector has the potential to reconstruct the 3D coordinate with a precision of 1 mm3 or better and reach the time resolution of about 150 ps (FWHM). Such characteristics give an interesting perspective of using this device as a brain-size PET scanner [26] or in pre-clinical research.
Detection of the ionization signal is the most challenging part of this project and requires an excellent purity of the liquid together with the special precautions to avoid the electrical break-down phenomena. The detail discussions of the ionization signal detection can be found elsewhere [25, 27, 28, 29]. In this article we only discuss the detection of optical Cherenkov signal and characterize the performance of the optical prototype.
The first test of the optical detection [30] demonstrates good, 35 %, efficiency to detect 511 keV photons, but achieved non-optimal time resolution of 540 ps. In this work we optimize the design of the optical prototype, in particular reduce the thickness of the TMBi sensitive volume from 5 cm to 2.5 cm, remove separation of the sensitive volume in cells and replace the conventional photo-multiplication tube (PMT) with a micro-channel-plate (MCP) PMT, see section 2 for details. As a result, we were able to achieve a significant improvement in the time resolution (section 3.1), and demonstrate the ability to have a coarse localization of the -conversion vertex (section 3.2).
2 Setup
The BOLDPET optical prototype is a sealed reservoir for TMBi liquid that serves as a Cherenkov radiator for relativistic electrons produced by the conversion of 511 keV -quanta. TMBi is a transparent, chemically reactive, high density (2.3 g/cm3) liquid that was chosen to optimize photoelectric conversion, primarily due to the high atomic number, Z=83, of Bismuth. The refraction index of TMBi at a 450 nm wavelength was measured to be 1.620.06 in a previous study [25].
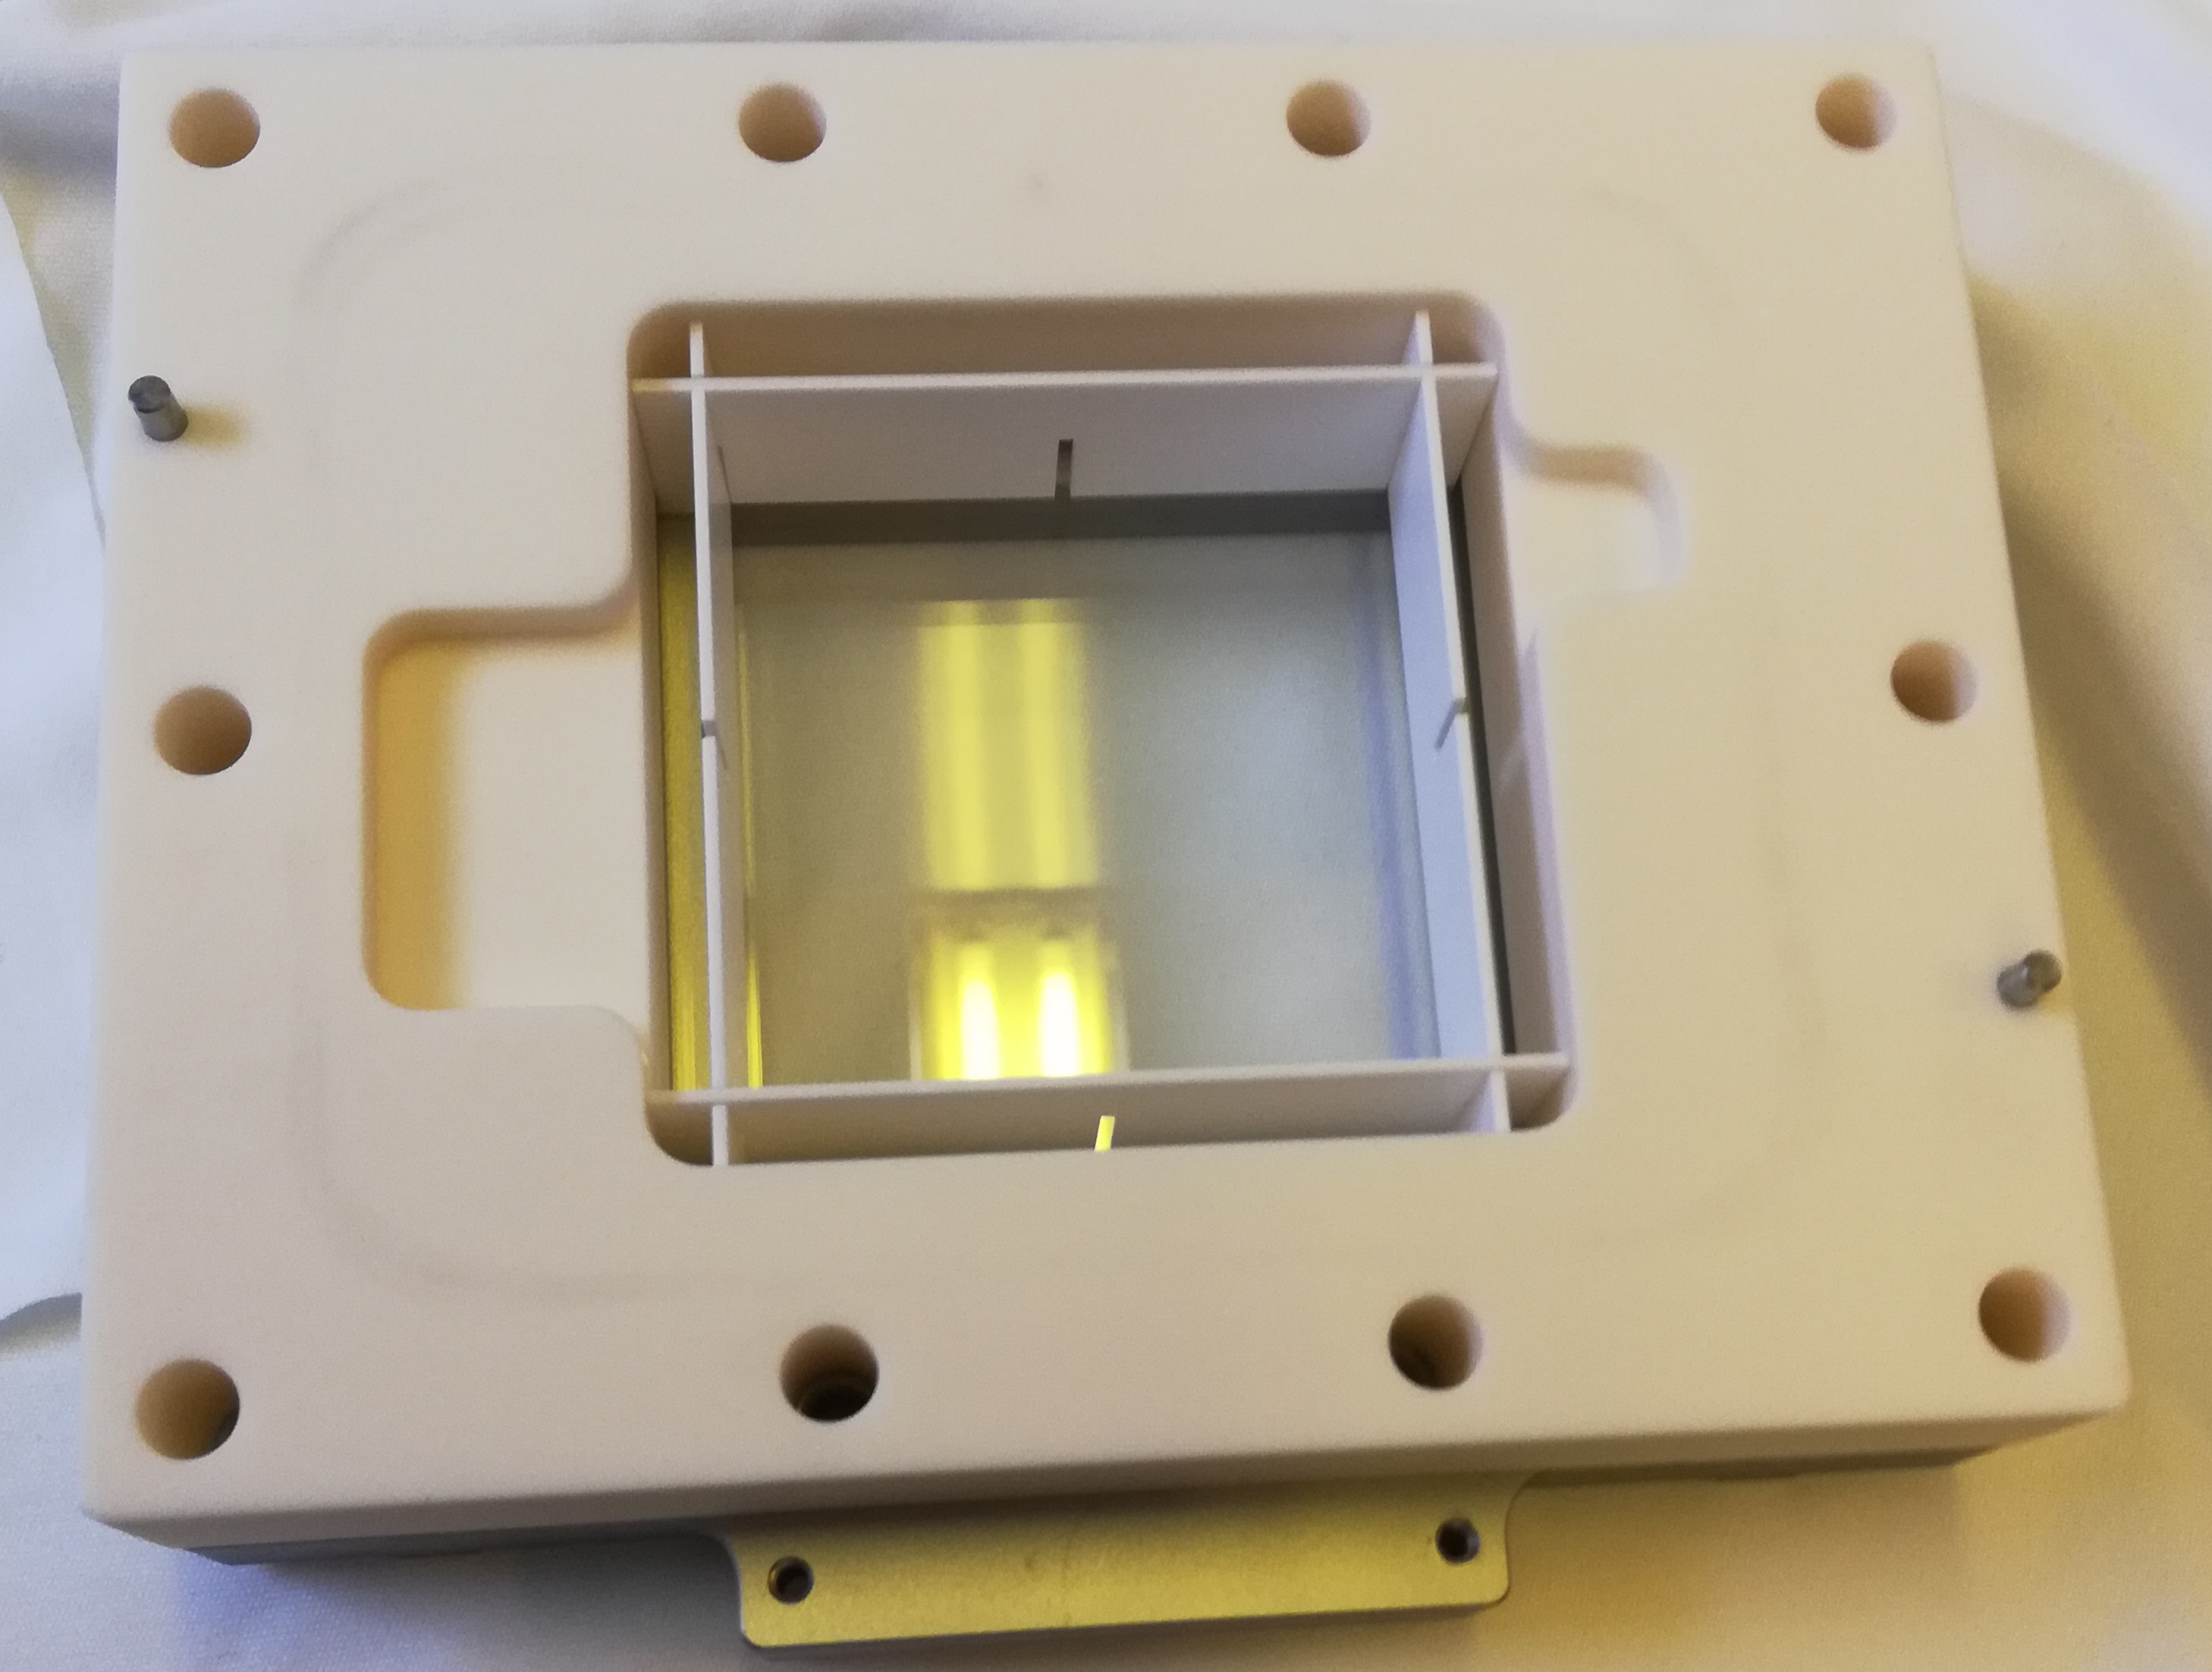
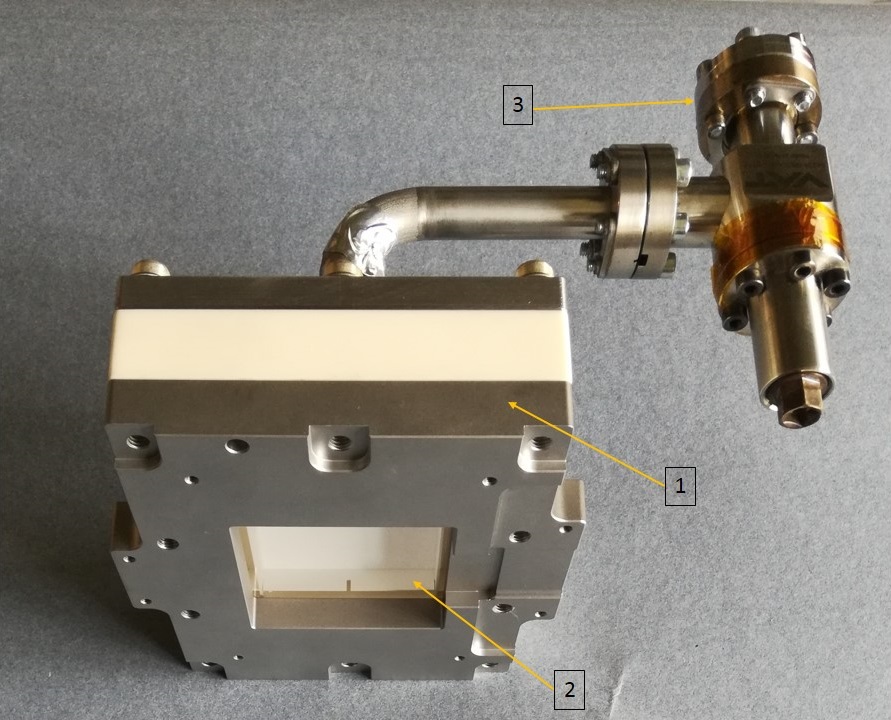
The high reactivity of TMBi necessitates that all manipulations and operations be conducted under ultra-high vacuum conditions. Any leak of air inside the prototype will induce a chemical reaction, leading to the transformation of the liquid TMBi into bismuth oxide powder. For this reason, for the prototype construction we have utilized materials known to be ultra-high vacuum compatible. Figures 3 and 3 show the prototype, with the body made from 99.7% alumina ceramic. Hermeticity is achieved through the use of metallic gaskets compressed between the stainless steel cap and the ceramic body. To improve photon collection efficiency, we have integrated specifically chosen white diffusive ceramic reflectors within the liquid. The size of the detection volume was chosen to be 55 mm x 55 mm x 25 mm, matching the dimensions of the MCP-PMT window. For the optical window, sapphire has been employed due to its high mechanical strength and a high refractive index, optimizing light transfer between the detection medium and the photomultiplier.
2.1 Photon Detection and Readout System
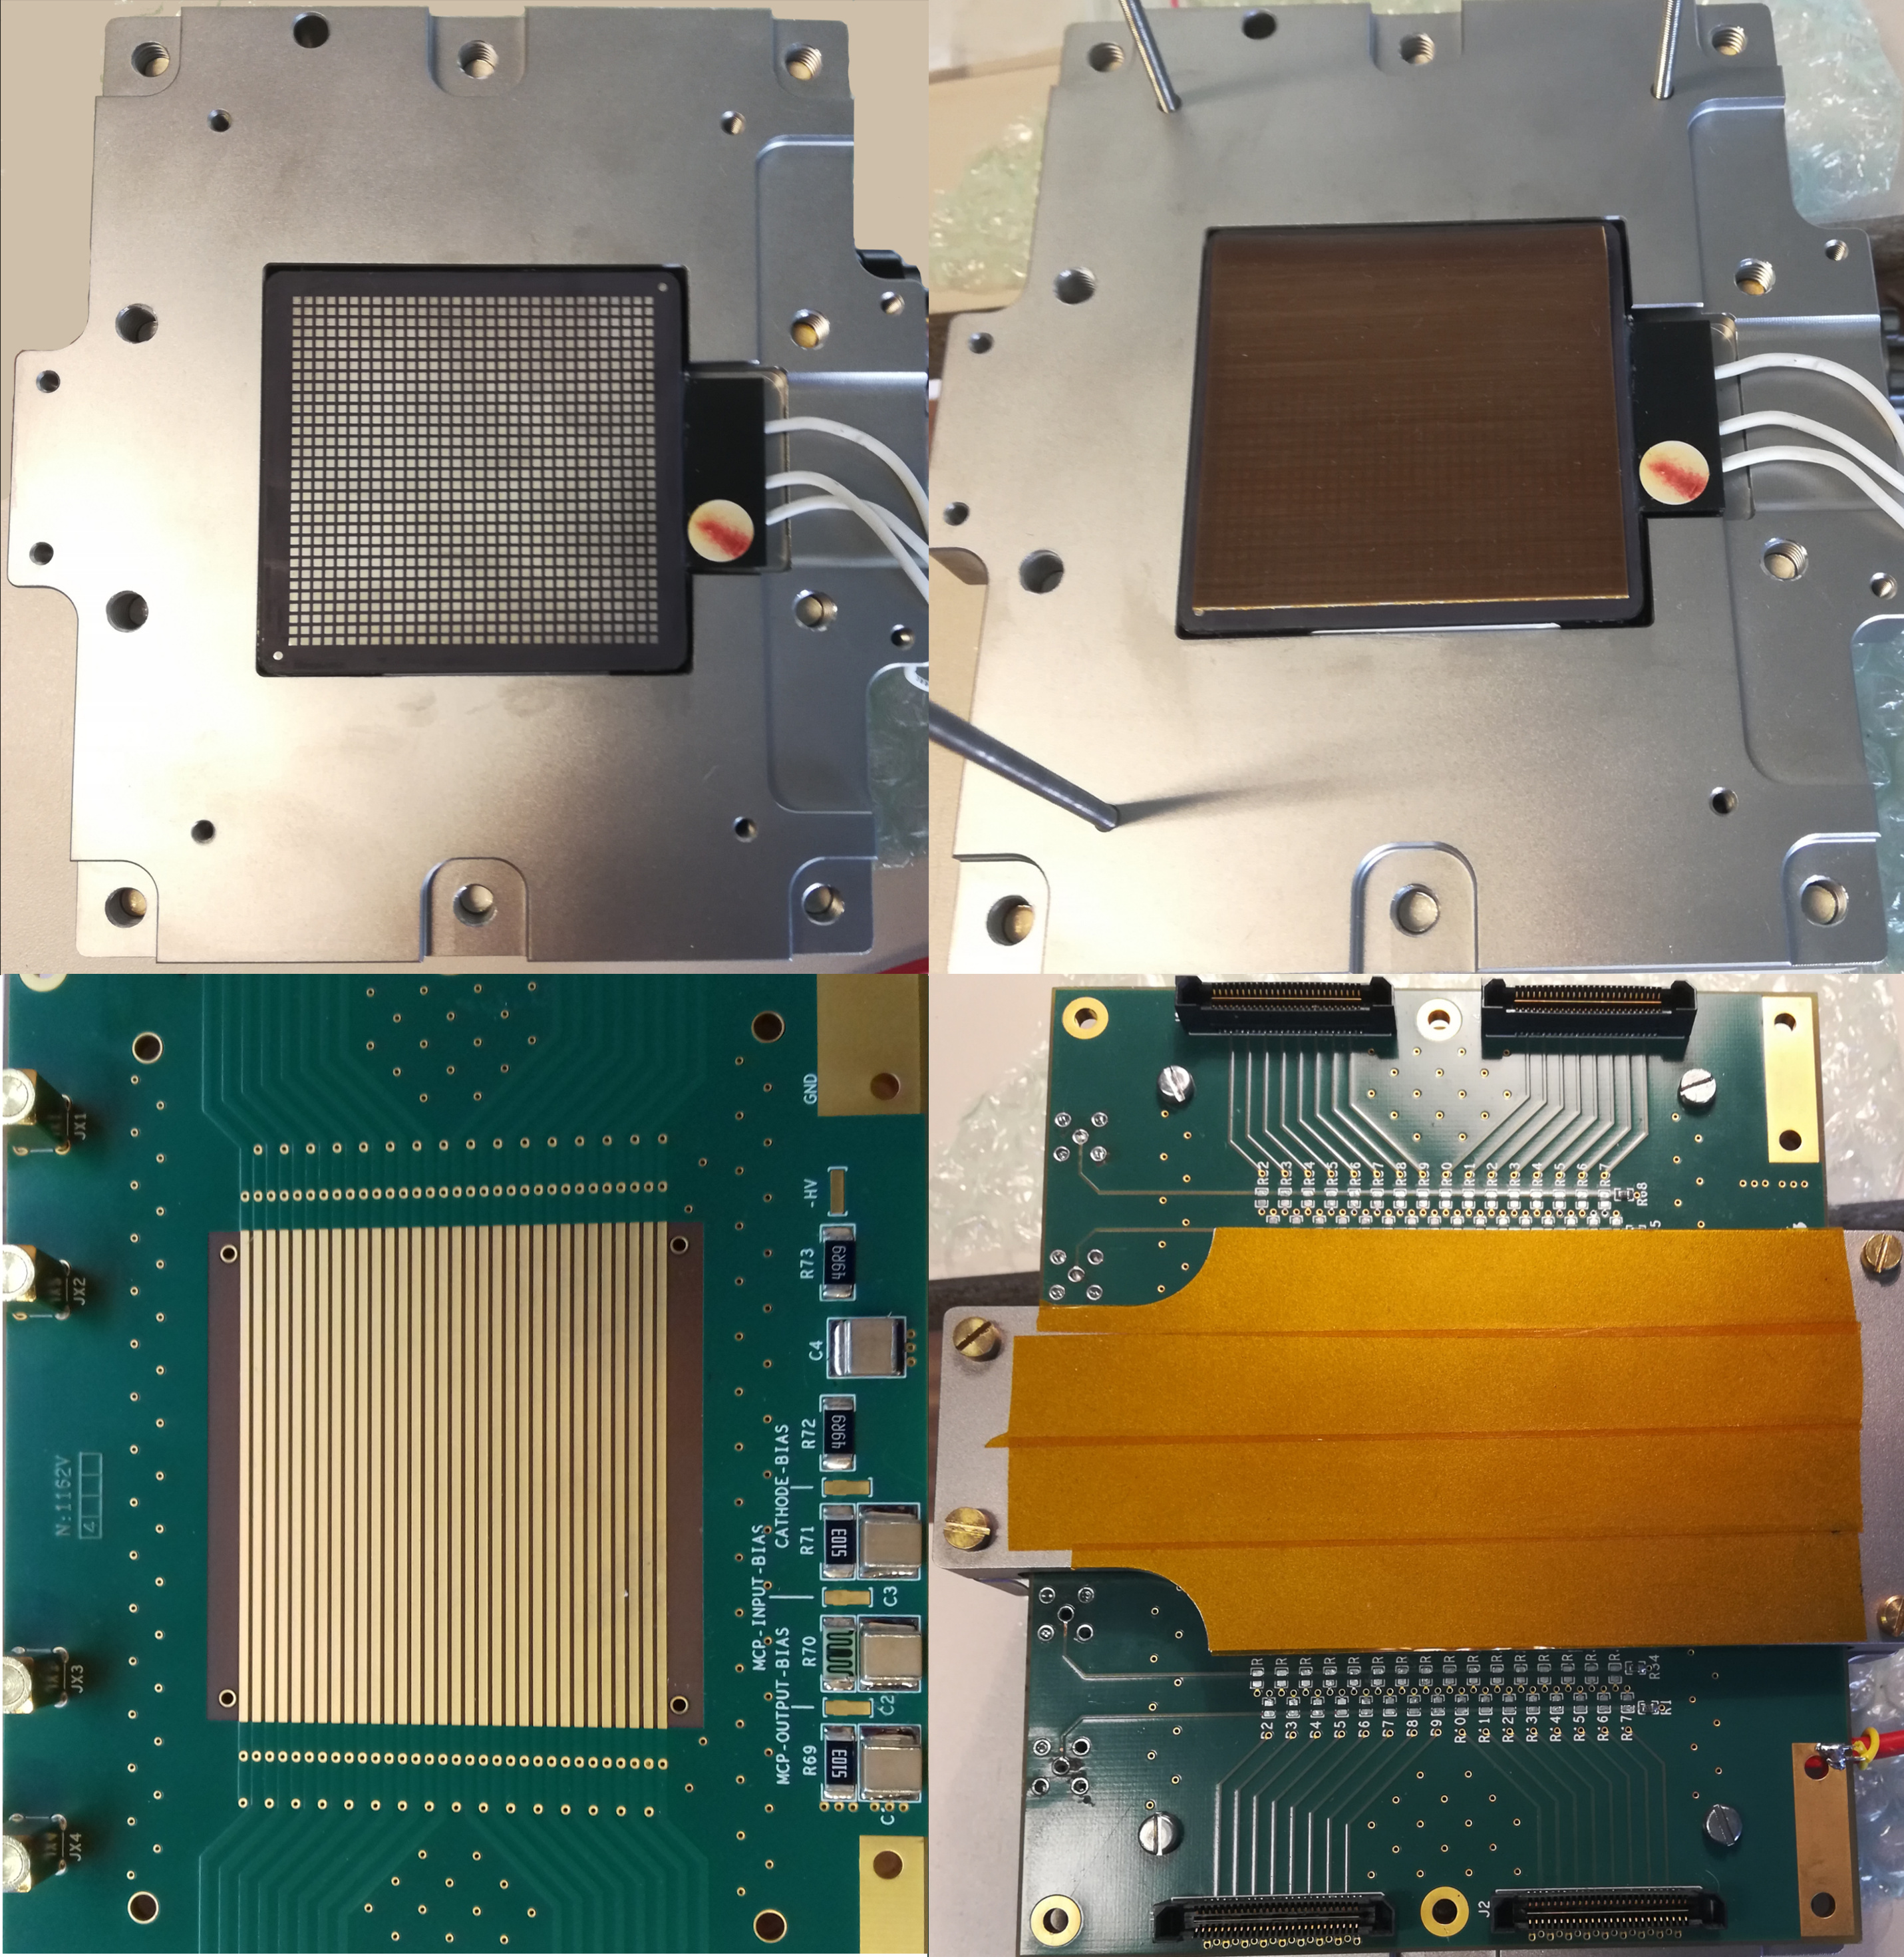
For the optical photons detection we have used Photonis’s micro-channel plate photomultiplier tube (MCP-PMT) Planacon XP85122 [31]. To ensure optimal optical coupling we utilised Nye SmartGel’s gel OCF452H [32]. This MCP-PMT has a pore diameter of 10 and an active photocathode area of 53x53 mm2. PMT’s anode structure consists of 32x32 metallic pads of 1.1x1.1 mm2 and a gap of 0.5 mm between the pads. In order to limit the number of electronics channels but keep high time resolution, we developed a read-out system using 50 Ohm 32 transmission lines printed on the 3-mm thick PCB. This PCB was connected to the anode pads with the pressure-sensitive anisotropic conductive sheet, Shin-Etsu Inter-Connector MT-4X [33], see Fig. 4.
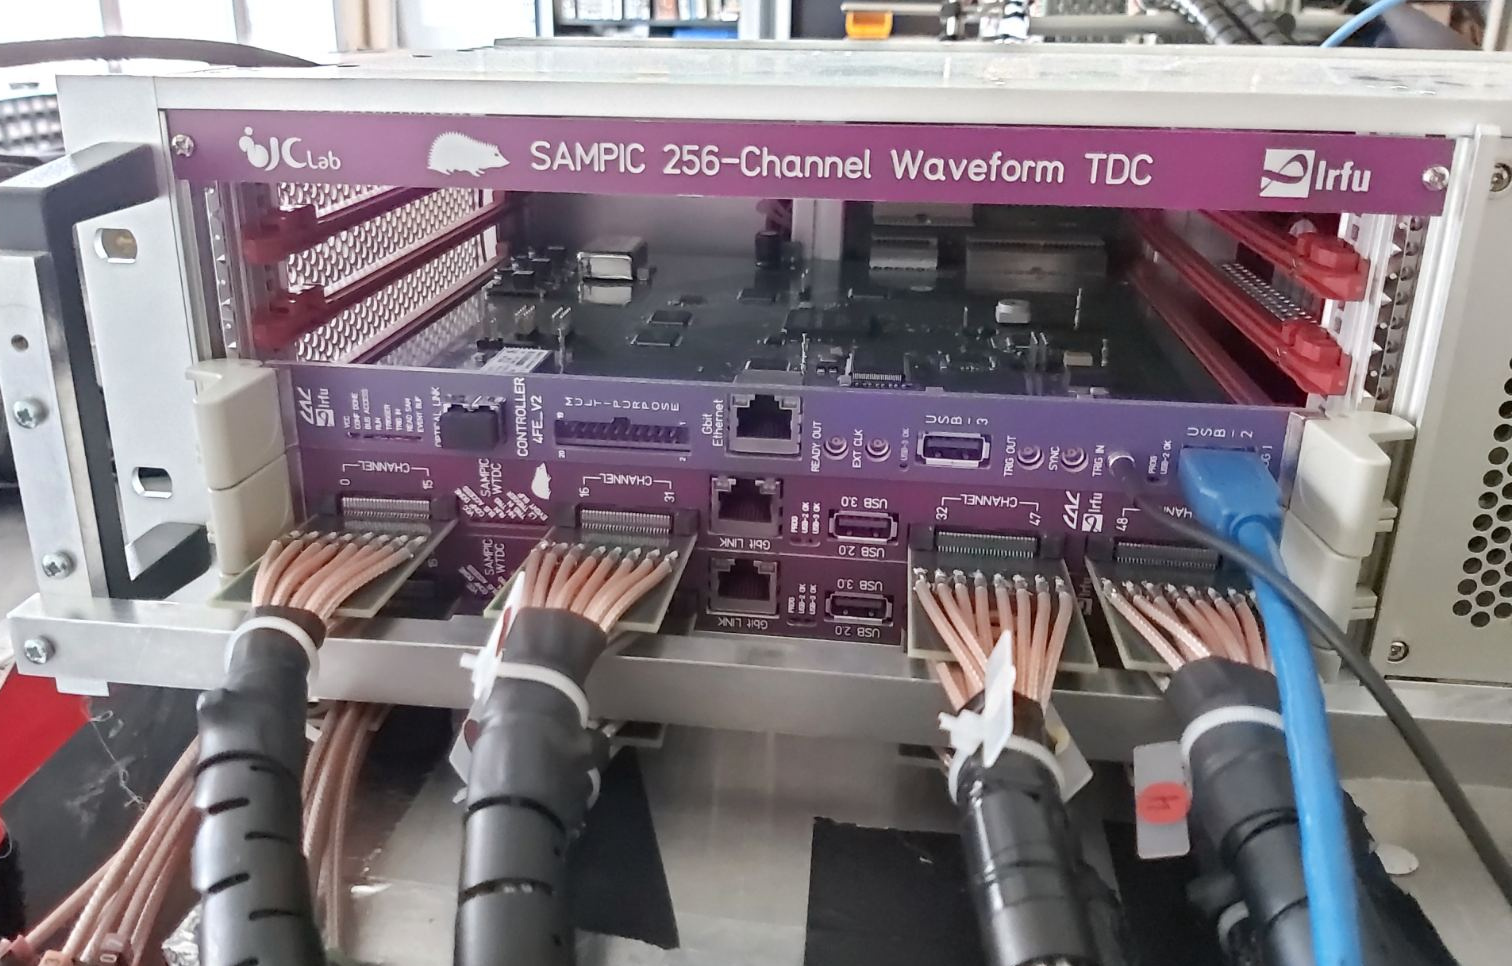
We biased the PMT at a high voltage providing a gain of about . At this gain, the single photoelectron signal needs to be amplified by a factor of 100 to be in the range suitable for the digitization module. We used a two stage amplification using dedicated boards (700 MHz bandwidth, 2x20 dB amplification). For this test, we utilized a SAMPIC crate, Fig. 5, capable of accommodating up to four 64-channels SAMPIC modules. These modules use SAMPIC_V3C chips, which are based on the patented concept of waveform and time-to-digital converter \citepDelagnes2014,Delagnes:2015oda,Breton2020. The signal sampling frequency can be varied within a range of 1.6 to 8.5 GS/s (6.4 GS/s frequency is adopted in this work). The acquired waveforms are used for the accurate timing measurement on-line, but can be also stored for the off-line processing. SAMPIC board allows to reach a timing accuracy of approximately 5 ps (standard deviation) \citepBreton2016. More details about the read-out system can be found in [38].
2.2 The reference detector
The reference detector is assembled using a LYSO:Ca,Ce co-doped crystal provided by Saint-Gobain (France), with dimensions of 333 mm3. This crystal is known for its improved rise time, excellent light yield, decay time, and afterglow characteristics [39]. The crystal is optically coupled using Histomount glue, diluted with 2/3 of Xylène to a 33 mm2 SENSL/ONSEMI silicon photo-multiplier (SiPM) MICROFC-30035-SMT-TR [40]. The assembly is wrapped in Teflon tape to increase the light collection efficiency. The SiPM is operating at V bias (18% overvoltage). The signal is amplified with a 20 dB, 2.7 GHz commercial amplifier and digitized with the SAMPIC module. Due to the limited number of available digitization samples, 64, we are able to record only the initial part of the detector signal. Despite this limitation,we achieve a 6.4% resolution in amplitude, allowing clear differentiation between the photoinization peak and compton scattering events, Fig. 7. For determining the signal time, a fixed threshold time estimator is employed. The time resolution of this detector is measured to be 105 ps (FWHM).
2.3 Tests with the radioactive source
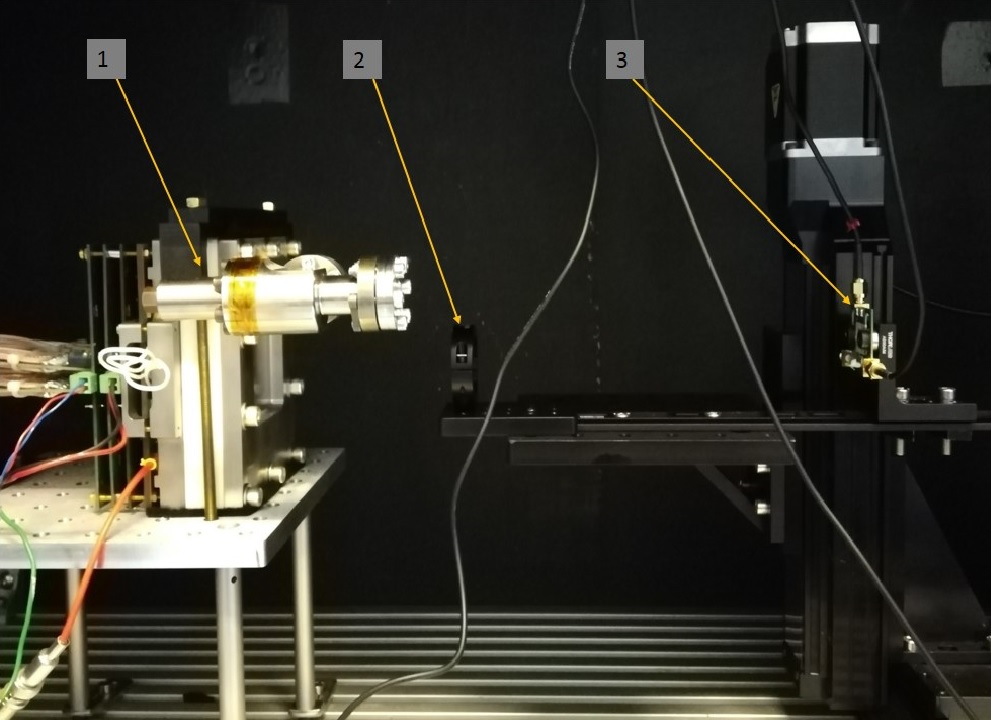
To evaluate the performance of the prototype in the PET-like configuration, we employed a radioactive 22Na source. This source emits positrons that promptly annihilates with electrons, resulting in pairs of 511 keV -photons emitted in opposite directions. Simultaneously, a 1.275 MeV photon is released in a direction uncorrelated with those from the positron annihilation. To generate a well-defined electronically collimated beam of 511 keV photons, we positioned the source between the reference detector and the prototype. Data was acquired in coincidences between the two detectors. According to the simulations (section 2.4), this configuration resulted in a beam size of 2 mm (FWHM) within the prototype when selecting events in the photoinization peak in the reference detector, Fig. 9. The radioactive source and reference detector are mounted on the 2D staging station and could be moved to test different positions along the prototype surface. To minimize the impact of ambient light, all components were enclosed within a light-blocking black box, as shown in Fig. 10.
2.4 Simulation
In order to understand the obtained results we developed a detailed simulation of the BOLDPET optical prototype [30, 26]. It is based on the Geant4 software [41, 42, 43] and simulates in full details the interaction of the -particles with matter, including the subsequent optical photons generation and tracking. This simulation includes the following main parts of the detector response:
-
•
interaction in liquid TMBi accounts for three processes: photoelectric conversion, Compton scattering and Rayleigh diffusion. The first two processes produce relativistic electrons that emit visible photons through Cherenkov radiation process.
-
•
Each optical photon is propagated individually by the simulation program. During propagation, all key physical effects are considered: photon absorption within the TMBi liquid, reflection or absorption on the prototype walls, as well as on the optical windows and the optical gel.
-
•
Photocathode simulation includes the Fresnel reflection of visible photons at photocathode boundaries, absorption of photons by the photocathode and extraction of generated photoelectrons as a function of the photon wavelength [44]. As a result, we comput that, on average, we produce 1.1 photoelectrons per 511 keV -ray photoelectric conversion in the liquid, Fig. 9.
-
•
We then parameterize the main PMT response features, including time response, PMT gain, gain fluctuation, and signal sharing between anodes.
-
•
Finally, we simulate the signal readout through the transmission lines with realistic signal shapes, taking into account the possible overlay of several photoelectrons, electronics noise and digitization sampling.
Most of the MCP-PMT simulation parameters (single-electron transition time spread, PMT gain and gain fluctuation, signal sharing between lines, etc. ) are adjusted to the results measured at the test bench using pulsed laser in the single-photon regime [38].
3 Results
3.1 Time resolution
To measure time resolution, we use a 22Na source, as detailed in Section 2.3. We acquire data in coincidence between the prototype and LYSO spectrometer. Given the intrinsic gain fluctuations of the MCP-PMT, we choose to estimate time using a constant fraction discrimination algorithm with a 50% threshold [45, 46]. The resolution is measured to be 180 ps (FWHM) with significant tail, as shown in Fig.11(a). Our simulation predicts the same resolution with reduced tail, Fig. 11(b). The difference between the experimental data and simulations is likely due to imperfections in modeling the reflective properties of the wall surfaces. Figure 12(a) shows the simulated time difference between the prototype and ideal reference detector, i.e., detector with negligible time resolution, thus demonstrating the prototype time resolution of about 150 ps (FWHM).
Further investigation into factors limiting time resolution is conducted through simulations assuming a negligible transit time spread111The PMT Transit Time Spread (TTS) refers to the variation in the time it takes for electrons to travel from the photocathode to the anodes and thereby characterizing the PMT time resolution. (TTS) for the prototype PMT. The corresponding time difference distribution, Fig. 13(a), highlighted that the fluctuation of photon arrival times due to the dispersion of photon trajectories within the prototype played a significant role in addition to the limitation imposed by the PMT TTS. To improve the resolution, one could consider reducing the thickness of the detection volume, at the cost of sacrificing detection efficiency. Alternatively, the final BOLDPET detector design allows us to measure the depth-of-interaction (DOI) coordinate through the ionization signal. By exploiting the correlation between the mean photon arrival time and DOI, as elaborated in [30], we open another avenue for improvement. For instance, assuming that we are able to measure the DOI coordinate with a precision of 5 mm (FWHM), we can significantly reduce the contribution due to fluctuations in photon collection time, thereby improving the time resolution from 107 ps to a remarkable 54 ps, as illustrated in Fig.13(b). Implementing the same correction in the prototype with realistic PMT TTS will improve its resolution from 148 ps to a noteworthy 114 ps, as demonstrated in Fig.12(b).
3.2 Spatial resolution
The optical part of the BOLDPET detection module does not aim to provide high spatial resolution, since the ionization signal would be used to accurately measure three spatial coordinates. At the same time, the ability to measure the interaction position will help to resolve the ambiguity when multiple interaction vertices exist within the volume. This, in turn, leads to an enhancement in the maximum count rate supported by the detector.
In Section 3.1, we discuss the data collected for time measurements, which is also employed to evaluate spatial resolution. The requirement for coincidence between the prototype and the reference detector leads to a 2 mm wide -beam in the former, as described in the section 2.3 and Fig. 9.
To determine the coordinate along the transition lines, the x-coordinate, we reconstruct it using the line with the highest amplitude, . The -interaction x-coordinate is determined as a time difference between the right and left signals, and respectively, multiplied by the signal propagation speed, , and divided by two, i.e. .
For the coordinate across the lines, the y-coordinate, we use the line with the highest amplitude, denoted as , and its two neighboring lines. We compute the charge-weighted coordinate as follows:
| (1) |
where corresponds to the coordinate of the center of line , and corresponds to its charge.
Figure 14(a) displays the 2D distributions of the reconstructed -interaction vertices for two different positions of the beam. The and cross-sections reveal a resolution width of approximately 5 mm for positions near the center of the detector (left column), and 7 mm to 8 mm for positions in the corner of the detector. This level of resolution will be valuable in resolving ambiguity when associating the optical signal with ionization in the case of multiple vertices in the detection volume.
4 Discussions
The current work highlights the significant potential of using Cherenkov photons to enhance the time resolution when detecting 511 keV photons. The developed detector technique has the advantage of producing optical signals due to the Cherenkov photons only. Simulation results indicate a 57% efficiency in detecting events where photons deposit their energy entirely through photoionization conversion. This value is constrained by the limited number of produced Cherenkov photons, of about 20 for a 511 keV energy deposition. Consequently the mean number of photo-electrons detected by the PMT is approximately 1.1, as illustrated in Fig. 9.
As discussed in Section 3.1, the time resolution faces two key limitations: fluctuations in the optical photon path and the limited precision of available photodetectors. Mitigating the first factor involves optimizing the detector thickness to balance detection efficiency and time resolution. An additional strategy involves measuring Depth of Interaction (DOI) coordinate and correcting for the correlation between mean detection time and DOI. Addressing the second factor requires increasing photon detection efficiency for an overall enhancement in time resolution. For instance, Fig. 15 shows the measured time resolution in events with more than one triggered line. These distributions reveal a substantial decrease in precision, down to 154 ps, corresponding to a detector resolution of about 120 ps (FWHM). This occurs because a larger number of triggered lines correlates with a higher quantity of produced photoelectrons.
Looking ahead, we may hope for the improvement in the PMT time response function thereby enhancing overall time performance. This is particularly promising, given that photons produced through the Cherenkov mechanism are generated on the timescale of several picoseconds. Therefore, any improvement in PMT time resolution directly translates to an enhanced -detection time resolution achieved through the detection of Cherenkov photons.
Although these conclusions are drawn from experiences with the BOLDPET optical prototype, they hold general applicability to any utilization of Cherenkov radiation in PET detection, such as employing it in crystalline radiators.
5 Conclusions
In this work we investigate the performance of the optical prototype developed for the BOLDPET project in detecting 511 keV -quanta. The unique feature of this detection technology is the utilization of the heavy detection liquid, TMBi, enabling the design of large-scale detection modules with a high detection efficiency. The generation of optical photons occurs exclusively through the Cherenkov mechanism, and they are detected by fast micro-channel plate photo-multiplier, resulting in an excellent time resolution for the large scale detectors of approximately 150 ps (FWHM). Further refinement of this resolution to 120 ps is achievable by implementing additional selection criteria, albeit at the expense of reduced efficiency. We demonstrate the feasibility of coarse localization of interactions using solely the optical signal, achieving a precision of about 5-8 mm (FWHM). Using detailed Geant4 simulations, we explore the limiting factors influencing time resolution and discuss potential avenues for improvement.
Acknowledgments
The authors would like to thank Saint-Gobain Crystals for kindly providing the LYSO:Ce:Ca single crystals used to build LYSO spectrometers.
We acknowledge the financial support by the joint French-German grants ANR-18-CE92-0012-01, DFG-SCHA 1447/3-1 and WE 1843/8-1.
References
- [1] S. Vallabhajosula, L. Solnes and B. Vallabhajosula, A Broad Overview of Positron Emission Tomography Radiopharmaceuticals and Clinical Applications: What Is New?, Semin. Nucl. Med. 41 (2011) 246.
- [2] O. Martinez, J. Sosabowski, J. Maher and S. Papa, New Developments in Imaging Cell-Based Therapy, Journal of Nuclear Medicine 60 (2019) 730.
- [3] M. Djekidel, R. AlSadi, M.A. Akl, S. Vandenberghe and O. Bouhali, Total-body pediatric PET is ready for prime time, European Journal of Nuclear Medicine and Molecular Imaging 49 (2022) 3624.
- [4] H.W.A.M. de Jong, F.H.P. van Velden, R.W. Kloet, F.L. Buijs, R. Boellaard and A.A. Lammertsma, Performance evaluation of the ECAT HRRT: an LSO-LYSO double layer high resolution, high sensitivity scanner, Phys. Med. Biol. 52 (2007) 1505.
- [5] A.J. González, F. Sánchez and J.M. Benlloch, Organ-Dedicated Molecular Imaging Systems, IEEE Transactions on Radiation and Plasma Medical Sciences 2 (2018) 388.
- [6] S. Vandenberghe, P. Moskal and J.S. Karp, State of the art in total body PET, EJNMMI Physics 7 (2020) 1.
- [7] K.G. Zeimpekis, F.A. Kotasidis, M. Huellner, A. Nemirovsky, P.A. Kaufmann and V. Treyer, NEMA NU 2–2018 performance evaluation of a new generation 30-cm axial field-of-view Discovery MI PET/CT, European Journal of Nuclear Medicine and Molecular Imaging 49 (2022) 3023.
- [8] A. Saanchez-Crespo, P. Andreo and S.A. Larsson, Positron flight in human tissues and its influence on PET image spatial resolution, Eur. J. Nucl. Med. Mol. Imaging 31 (2004) 44.
- [9] M.D. Harpen, Positronium: Review of symmetry, conserved quantities and decay for the radiological physicist, Med. Phys. 31 (2004) 57.
- [10] W.W. Moses, Fundamental limits of spatial resolution in PET, Nucl. Instrum. Meth. A 648 (2011) S236 .
- [11] W. Lehnert, M.-C. Gregoire, A. Reilhac and S.R. Meikle, Analytical positron range modelling in heterogeneous media for PET Monte Carlo simulation, Physics in Medicine & Biology 56 (2011) 3313.
- [12] E.C. Emond, A.M. Groves, B.F. Hutton and K. Thielemans, Effect of positron range on PET quantification in diseased and normal lungs, Phys. Med. Biol. 64 (2019) 205010.
- [13] N. Belcari, N. Camarlinghi, S. Ferretti, P. Iozzo, D. Panetta, P.A. Salvadori et al., NEMA NU-4 Performance Evaluation of the IRIS PET/CT Preclinical Scanner, .
- [14] M. Amirrashedi, S. Sarkar, P. Ghafarian, R.H. Shahraki, P. Geramifar, H. Zaidi et al., NEMA NU-4 2008 performance evaluation of Xtrim-PET: A prototype SiPM-based preclinical scanner, .
- [15] É. Gaudin, C. Thibaudeau, L. Arpin, J.-D. Leroux, M. Toussaint, J.-F. Beaudoin et al., Performance evaluation of the mouse version of the LabPET II PET scanner, Physics in Medicine & Biology 66 (2021) 065019.
- [16] S. Vandenberghe, E. Mikhaylova, E. D’Hoe, P. Mollet and J.S. Karp, Recent developments in time-of-flight PET, EJNMMI Physics 3 (2016) .
- [17] P. Lecoq, C. Morel, J.O. Prior, D. Visvikis, S. Gundacker, E. Auffray et al., Roadmap toward the 10 ps time-of-flight PET challenge, Physics in Medicine & Biology 65 (2020) 21RM01.
- [18] D.R. Schaart, Physics and technology of time-of-flight PET detectors, Physics in Medicine & Biology 66 (2021) 09TR01.
- [19] G. Borghi, B.J. Peet, V. Tabacchini and D.R. Schaart, A 32 mm x 32 mm x 22 mm monolithic LYSO:Ce detector with dual-sided digital photon counter readout for ultrahigh-performance TOF-PET and TOF-PET/MRI, Phys. Med. Biol. 61 (2016) 4929.
- [20] A. Gonzalez-Montoro, A. Aguilar, G. Canizares, P. Conde, L. Hernandez, L.F. Vidal et al., Performance Study of a Large Monolithic LYSO PET Detector With Accurate Photon DOI Using Retroreflector Layers, IEEE Transactions on Radiation and Plasma Medical Sciences 1 (2017) 229.
- [21] S. Krishnamoorthy, E. Blankemeyer, P. Mollet, S. Surti, R. Van Holen and J.S. Karp, Performance evaluation of the MOLECUBES -CUBE—a high spatial resolution and high sensitivity small animal PET scanner utilizing monolithic LYSO scintillation detectors, .
- [22] D. Yvon, V. Sharyy, M. Follin, J.-P. Bard, D. Breton, J. Maalmi et al., Design study of a scintronic crystal targeting tens of picoseconds time resolution for gamma ray imaging: the ClearMind detector, J. Instrum. 15 (2020) P07029.
- [23] M. Stockhoff, M. Decuyper, R. Van Holen and S. Vandenberghe, High-resolution monolithic LYSO detector with 6-layer depth-of-interaction for clinical PET, Physics in Medicine & Biology 66 (2021) 155014.
- [24] D. Yvon, J.-P. Renault, G. Tauzin, P. Verrecchia, C. Flouzat, S. Sharyy et al., CaLIPSO: An Novel Detector Concept for PET Imaging., IEEE Transactions on Nuclear Science 61 (2014) 60 .
- [25] E. Ramos, D. Yvon, P. Verrecchia, G. Tauzin, D. Desforge, V. Reithinger et al., Trimethyl Bismuth Optical Properties for Particle Detection and the CaLIPSO Detector, IEEE Transactions on Nuclear Science 62 (2015) 1326.
- [26] O. Kochebina, S. Jan, S. Stute, V. Sharyy, P. Verrecchia, X. Mancardi et al., Performance Estimation for the High Resolution CaLIPSO Brain PET Scanner: A Simulation Study, .
- [27] M. Farradeche, G. Tauzin, J.-P. Mols, J.-P. Bard, J.-P. Dognon, C. Weinheimer et al., Ionization parameters of Trimethylbismuth for high-energy photon detection, Nucl. Instrum. Meth. A (2019) 162646.
- [28] B. Gerke, S.-N. Peters, N. Marquardt, C. Huhmann, V.M. Hannen, M. Holtkamp et al., Suppression of electrical breakdown phenomena in liquid TriMethyl Bismuth based ionization detectors, .
- [29] S. Peters, B. Gerke, V. Hannen, C. Huhmann, N. Marquardt, K. Schäfers et al., Electro-purification studies and first measurement of relative permittivity of TMBi, 2209.00996.
- [30] E. Ramos, O. Kochebina, D. Yvon, P. Verrecchia, V. Sharyy, G. Tauzin et al., Efficient and fast 511-keV detection through Cherenkov radiation: the CaLIPSO optical detector, J. Instrum. 11 (2016) P11008.
- [31] “MCP-PMT Photonis XP85122 technical data sheet.” https://www.photonis.com/system/files/2019-04/PLANACON-10%C2%B5m-32x32-datasheet.pdf.
- [32] “SMARTGEL description.” https://www.nyelubricants.com/datasheet/SDS_CHINA_English_SMARTGEL+OCF-452H.pdf.
- [33] Shin-Etsu Polymer, “Inter-Connector® MT-type.” https://www.shinetsu.info/product/mt-type-of-inter-connector.
- [34] E. Delagnes, H. Grabas, D. Breton and J. Maalmi, The sampic WTDC chip, Workshop on Picosecond Photon Sensors for physics and medical application (March 2014) .
- [35] E. Delagnes, D. Breton, H. Grabas, J. Maalmi and P. Rusquart, Reaching a few picosecond timing precision with the 16-channel digitizer and timestamper SAMPIC ASIC, Nucl. Instrum. Meth. A A787 (2015) 245.
- [36] D. Breton, C. Cheikali, E. Delagnes, J. Maalmi, P. Rusquart and P. Vallerand, Fast electronics for particle Time-Of-Flight measurement, with focus on the SAMPIC ASIC, Nuovo Cimento C 43 (2020) 7.
- [37] D. Breton, V. De Cacqueray, E. Delagnes, H. Grabas, J. Maalmi, N. Minafra et al., Measurements of timing resolution of ultra-fast silicon detectors with the SAMPIC waveform digitizer, Nucl. Instrum. Meth. A 835 (2016) 51.
- [38] M. Follin, R. Chyzh, C.-H. Sung, D. Breton, J. Maalmi, T. Chaminade et al., High resolution MCP-PMT readout using transmission lines, Nuclear Instruments and Methods in Physics Research Section A: Accelerators, Spectrometers, Detectors and Associated Equipment 1027 (2022) 166092.
- [39] Luxium Solution, France, “LYSO crystals technical data.” https://www.luxiumsolutions.com/radiation-detection-scintillators/crystal-scintillators/lyso-scintillation-crystals, 2023.
- [40] ONSEMI, “Silicon photomultipliers (sipm), low-noise, blue-sensitive c-series sipm sensors data sheet.” https://www.onsemi.com/products/sensors/photodetectors-sipm-spad/silicon-photomultipliers-sipm/c-series, February, 2022.
- [41] GEANT4 collaboration, GEANT4: A Simulation toolkit, Nucl. Instrum. Meth. A 506 (2003) 250.
- [42] J. Allison, K. Amako, J. Apostolakis, H. Araujo, P.A. Dubois, M. Asai et al., Geant4 developments and applications, IEEE Trans. Nucl. Sci. 53 (2006) 270.
- [43] J. Allison, K. Amako, J. Apostolakis, P. Arce, M. Asai, T. Aso et al., Recent developments in Geant4, Nucl. Instrum. Meth. A 835 (2016) 186.
- [44] C.-H. Sung, L. Cappellugola, M. Follin, S. Curtoni, M. Dupont, C. Morel et al., Detailed simulation for the clearmind prototype detection module and event reconstruction using artificial intelligence, Nuclear Instruments and Methods in Physics Research Section A: Accelerators, Spectrometers, Detectors and Associated Equipment 1053 (2023) 168357.
- [45] C. Canot, Détecteur optique Cherenkov de photons 511 keV, rapide et efficace, pour l’imagerie TEP, Ph.D. thesis, 2018.
- [46] C. Canot, M. Alokhina, P. Abbon, J.P. Bard, D. Breton, E. Delagnes et al., Fast and efficient detection of 511 keV photons using Cherenkov light in PbF2 crystal, coupled to a MCP-PMT and SAMPIC digitization module, J. Instrum. 14 (2019) P12001.