Performance Insights-based AI-driven Football Transfer Fee Prediction
Abstract
We developed an artificial intelligence approach to predict the transfer fee of a football player. This model can help clubs make better decisions about which players to buy and sell, which can lead to improved performance and increased club budgets. We collected data on player performance, transfer fees, and other factors that might affect a player’s value. We then used this data to train a machine learning model that can accurately predict a player’s impact on the game. We further passed the obtained results as one of the features to the predictor of transfer fees. The model can help clubs identify players who are undervalued and who could be sold for a profit. It can also help clubs avoid overpaying for players who are not worth the money. We believe that our model can be a valuable tool for football clubs. It can help them make better decisions about player recruitment and transfers.
keywords:
Sports science; machine learning; football; predictive modelling; performance analysis1 Introduction
In the context of football evolving into a lucrative industry, players could be regarded as the most valuable assets of a club. The aforementioned study[7] has effectively established the statistical significance of the relationship between a football player’s performance and market value using the Lasso Regression methodology. Consequently, armed with insights into a player’s performance, clubs can strategically engage in advantageous transactions, augmenting their revenue streams.
Recently, various approaches have emerged for estimating a player’s transfer value using the PA framework. These approaches encompass a range of methodologies, including regression analysis methods[16, 13], where fundamental actions like passes and goals are considered. Additional techniques such as machine learning[13, 9] have been employed, with authors exploring factors like the plus-minus rating of footballers. Deep learning approaches[15] have also been applied, emphasising relative and absolute PA parameters, such as successful tackles, dribbles, and more. Notably, this research also incorporates media activity as a factor within the transfer value prediction model, including metrics like the number of YouTube videos, Reddit posts, and other indicators of player popularity.
In general, there could be distinguished a bunch of factors, having an impact on the transfer values. We divide them into two groups: major and minor.
Regarding minors, we can name media activity, relationships with coaches, out-of-pitch behaviour, etc. Technically, these are not quantitative factors that could not be calculated directly. While the research[15] presents an intriguing method for estimating media activity by considering the total views of YouTube videos, leveraging Google trends data, etc., related to a player, there may be more accurate approaches. Indeed, these metrics may only partially capture the actual number of people genuinely engaged in a footballer’s activity. The reason behind this limitation lies in the fact that these metrics primarily measure online interactions and views, which may not necessarily represent the complete scope of a player’s popularity and impact on their fans or the football community as a whole.
For the former, we can list age, the remaining term of a contract, pitch role, etc. However, the most significant parameter among major factors is a player’s contribution to the team. Indeed, correct assessment of player’s actions is relevant not only in the case of transfer fee prediction but also is highly useful for both scouts to recruit players and coaches to form a team roster.
Also PA could be used as a tool of significant feedback[3, 1, 14].In order to evaluate performance scores, various models have been presented up-to-date. Over the past years, deep learning methods of players’ actions analysis have gained popularity[18, 10, 5]. However, they mostly take into account actions with direct influence on the game (e.g., key passes, goals, etc.), yet they may need to reflect the player’s essence accurately. Such approaches are considered in [2, 17, 19, 6, 12]. For instance, some actions do not lead to scoring a goal themselves. However, they contribute a lot to perspective scoring (e.g. starting a pass of an attack, which opens some space for the offensive purpose, successful dribbling, etc.). Techniques for evaluating this staff are described in [4, 11], opening up a view of the probabilistic approach to footballer’s performance score evaluation and finding its applications in detecting young talents and substitutions of players left a club.
The study builds upon the Bayesian approach, as established in work [4], yet reconstructs the modelling approach and expands the application part. This research focuses on utilising event-stream data and incorporates a long-run perspective when assessing the impact of a player’s attacking actions within a possession chain that culminates in a shot on goal. The possession chain itself will be elaborated upon in the subsequent section. Furthermore, the study introduces a unified algorithm that enables the prediction of transfer fee value gain or loss within a specified time. This prediction is facilitated by developing supplementary models specifically designed for computing the performance score. Therefore, by leveraging the Bayesian approach and employing event-stream data, this study provides a framework for evaluating player performance within possession chains and offers a predictive algorithm for assessing a player’s potential transfer fee value fluctuation. This serves as a valuable resource for coaches and club managers and contributes to the broader understanding of player evaluation and decision-making processes in the world of football.
To evaluate a player’s performance, the researchers analyse a sample of possession chains in which the player has participated, ultimately computing their performance score. This score serves as a measure of the player’s effectiveness in contributing to goal-scoring opportunities.
2 Materials and methods
Since we do not provide open access to the developed programming code, we do not conduct comparison with related works.
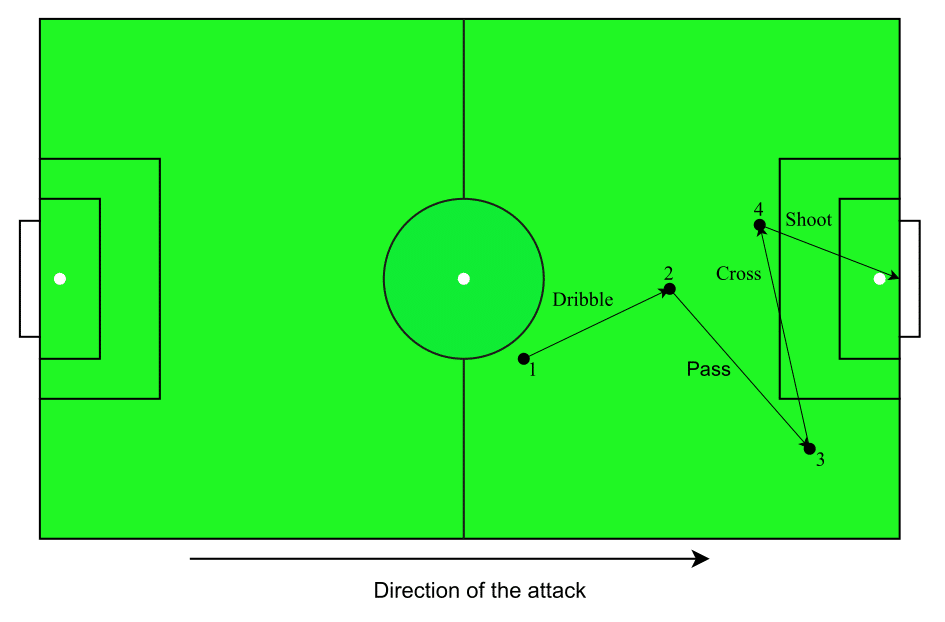
The ultimate target of every team during a game is to end a match by scoring as many goals as possible. Let us consider an attack by a random team. This attack could be represented as a possession chain. We note such a chain as a sequence of consecutive actions of a given team, possessing a ball without any interception from the opponents and finishing with a shot to the rival’s goals. The example of a possession chain is illustrated in Figure 1. The whole chain could also be split into separate actions with the total number of . Throughout a possession chain. We will focus on the ball movement: the ball changes its state with every action performed on it. The state can be represented as a vector
| (1) |
where and are the coordinates of a current ball’s position on the pitch, and is the index of an action done over the ball. Every ball’s position on the pitch over a given chain implies different probability to score. Let
| (2) |
be the probability of scoring a goal, given the ball, being in the state . Then, a footballer , performing an action over the ball during the chain , moving it from state to receives a score
| (3) |
. There could be three possible outcomes:
1) : the player receives a reward with a positive impact;
2) : the player receives a penalty with a negative impact;
3) : the player receives neither a reward or penalty with a neutral impact.
Hence, a total contribution of the player within a possession chain could be formulated as:
| (4) |
where represents the total number of actions, completed by the player within the one possession chain . Thus, we can derive a total score, assigned to a player for one match:
| (5) |
where is the total number of possession chains, in which the player has played a part.
Since each footballer plays a distinct number of matches, for further comparison of players between each other, the normalising correction is applied:
| (6) |
where is the number of games, in which the player has taken part.
As a reward for the player, who performs the last action of the possession chain, a self-developed expected goals model (xG) was applied. With the same idea, being a probabilistic classifier, the model gives a probability to score with the last action, , i.e. a shoot, in the chain :
| (7) |
In the case of performing the very last action , a footballer gets either as a penalty or (1-) as a reward.
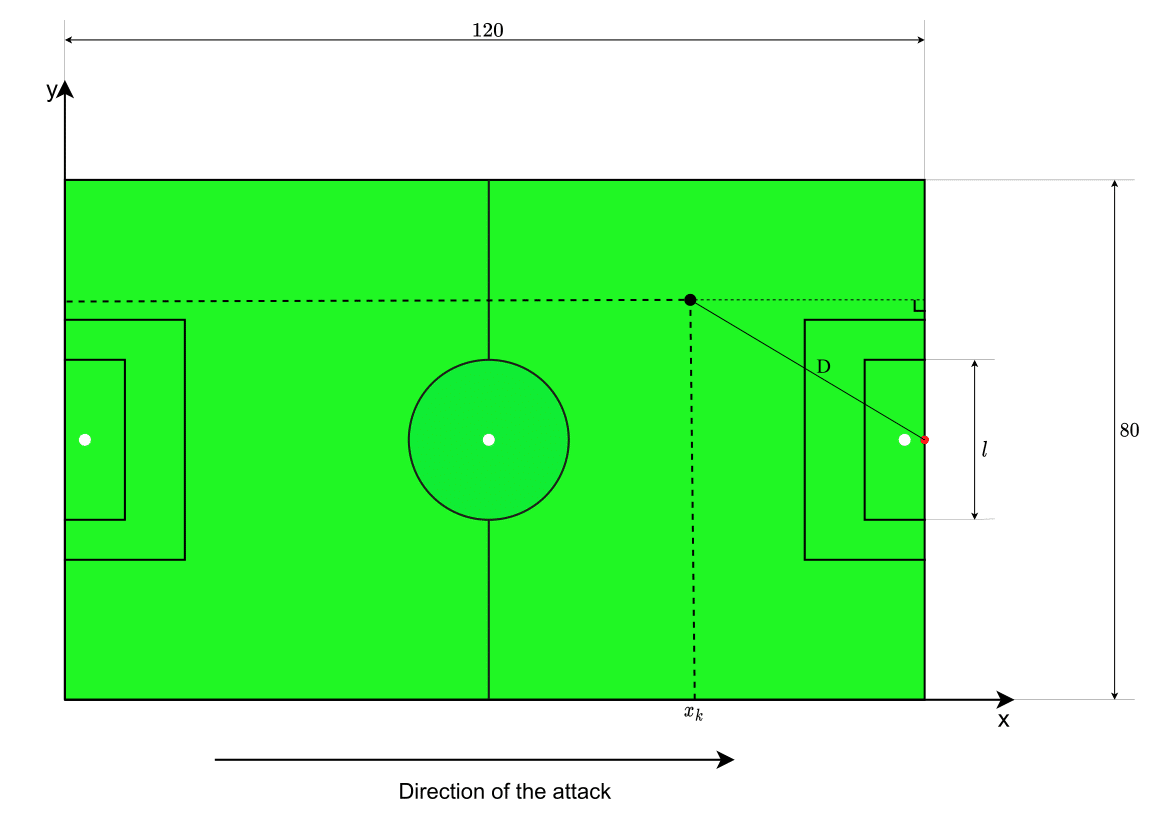
Also, the model considers players’ pitch roles (e.g. a defender, a midfielder or a striker). This implies mapping a player to his position, according to official formation. The sizes of a pitch are considered to be 120m x 80m and it is divided into 3 zones: defending, midfield and attacking. Each zone is separated by 40 meters in the direction of an attack, presented in Figure 1. The weights to a footballer’s score are set the following way:
1) A defender has no additional reward for actions in defending zone, 1.5x for successful actions in midfield zone and 2x for activity in the attacking part of the pitch;
2) A midfielder gets 1.5x for successful participation in a possession chain in the attacking zone;
3) A striker receives no reward for any actions, regardless of the zone.
Hence, to emphasise a footballer’s ability to contribute to attacking actions, his score is multiplied by the weight per the player’s pitch position. This advanced feature mainly serves as an assistant in forming the attacking line of a team.
The data that support the findings of this study are available in open-data at https://github.com/statsbomb/open-data, reference [20], provided by StatsBomb, a sports analytic company. The provided data set consists of more than one thousand games, encompassing national and international competitions for men’s and women’s football. Each match’s data consists of 105 features, describing every event of the game in the context of timestamp, type of the action, duration of the action, etc.
2.1 xG model development
The objective of this section is to develop an xG (expected goals) model based on the event-stream data. In essence, the xG score is the probability of scoring with a shoot being under specific circumstances. These could be several factors (e.g. distance to the goals, shot technique, etc.), presented in the Table 2.1.
Features for xG model. Categorical features Continuous features Shot technique Shooting angle Shot body part Distance to the goals Shot type Whether a player is under the pressure of an opponent or not
Let us define features ”shooting angle” and ”distance to the goals” explicitly:
1) Shooting angle () - angle, which is formed by the player’s view to the goals between two goalposts. There are three cases of possible position of a player and each of them preserves specific calculations:
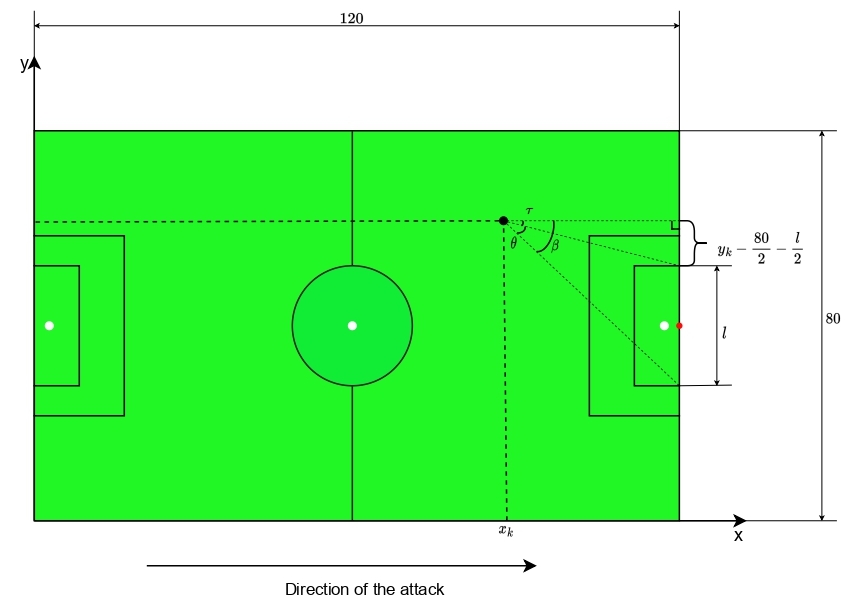
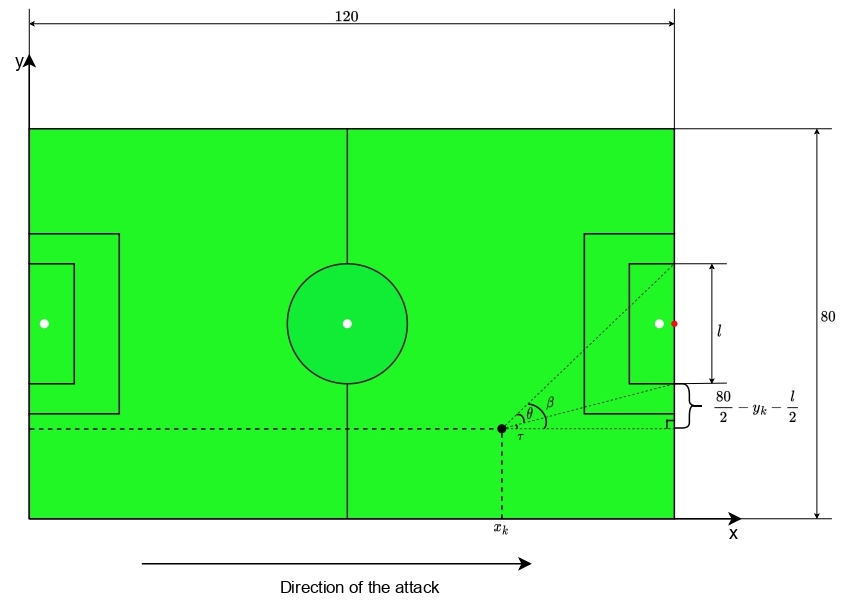
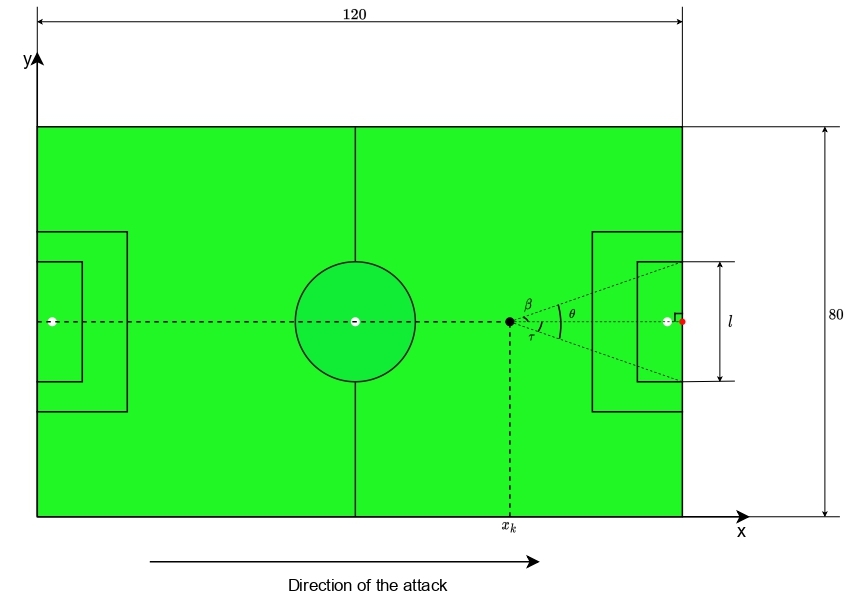
2) Distance to the goals () - distance from a player to the centre of the opponent’s goals, presented in Figure 3. It is a spatial separation between the player and the target area: . There is a base case when : .
The task at hand pertains to a binary classification problem with imbalanced classes. Specifically, the labels are assigned to shots, categorised as 1 if they result in a score and 0 otherwise. The overall proportion of class 1 instances in the provided data set is 0.22, warranting the assignment of a corresponding weight to class 0. To develop the xG model, the Python language is selected, leveraging the scikit-learn package and its built-in implementations of algorithms such as Logistic Regression, Random Forest Classifier, and CatBoost Classifier.
Logistic Regression is often employed as a baseline solution for binary classification problems due to its simplicity and interpretability. It is commonly utilised to establish a performance benchmark against more complex algorithms.
On the other hand, Random Forest Classifier is known for its ability to handle high-dimensional data without requiring dimensionality reduction techniques.
In the xG model, CatBoost Classifier is a robust algorithm that stands out due to its robustness in handling missing data and its native ability to handle categorical features. This feature makes CatBoost particularly beneficial when dealing with data sets that contain a substantial number of categorical variables, as is often the case in the xG model.
Given the presence of imbalanced data, the evaluation metrics employed include the weighted variants of F1-score, precision, recall, and the AUC score. The data is partitioned into two groups for model training and testing, with the selected proportions of 0.7 and 0.3, respectively. Stratification is employed based on the target variable to ensure the preservation of class distribution during the partitioning process. Furthermore, grid search is chosen as the method for hyperparameter tuning. The results of the models, trained on the algorithms, are presented in Table 2.1.
xG models’ metrics. F1-score(weighted) Precision(weighted) Recall(weighted) AUC score Logistic Regression 0.74 0.88 0.69 0.85 Random Forest Classifier 0.86 0.85 0.86 0.73 CatBoost Classifier 0.86 0.89 0.88 0.78
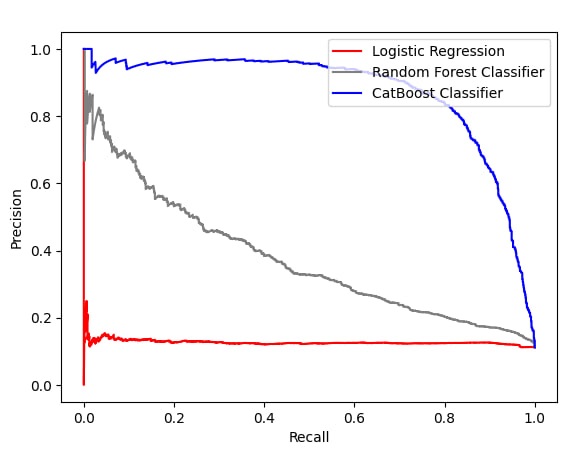
Our investigation’s primary focus centres around identifying all positive instances, thus prioritising the recall metric. Accordingly, the CatBoost Classifier demonstrates its superiority over alternative algorithms. As part of the analysis, we examined the precision-recall curve to understand how the model’s precision and recall values change across various decision thresholds.
For instance, the precision-recall curve of the CatBoost Classifier algorithm, as depicted in Figure 4a, exhibits an initial sharp increase followed by a gradual decrease. This observation suggests a high level of precision, albeit at the cost of a slightly reduced recall. These findings are consistent with the results obtained during model training.
2.2 Goal-scoring predictor development
The objective of the goal-scoring predictor is to estimate the probability outlined in Section 2, precisely (3). Due to our setting, the predictor plays an essential role in the whole study. Therefore, its characteristics must meet high evaluation standards to accurately assess the score assigned to the player with the most precise prediction. Each action of a possession chain, excluding the last one, described in 2.1, is viewed through the following factors in Table 2.2.
Features for goal-scoring predictor. Categorical features Discrete features Continuous features Type of the action Coordinates of the action Duration of the action Whether the action is performed under the pressure of an opponent Number of actions from the current position to the end of the possession chain Cumulative duration of the chain before the action Type of the previous action Timestamp of the action Play pattern* Number of the action in the chain
-
•
* - name of the play pattern relevant to the action, e.g. ”from corner”: the action is a part of the passage of play following a corner, ”from goal kick”: the action is a part of the passage of play following a keeper distribution, etc.
The outcome of each action under consideration falls into one of two categories: scoring (=1) or not scoring (=0). Thus, we are confronted with a binary classification problem. However, we encounter the challenge of highly imbalanced classes once again, as discussed in Section 2.1. Since then, the algorithms are used. Among all the actions included in the data set, only 12% of them ultimately lead to scoring. Consequently, class 0 is assigned a weight of 0.12 to address the class imbalance issue. The results are presented in Table 2.2.
Goal-scoring predictor models’ metrics. F1-score(weighted) Precision(weighted) Recall(weighted) AUC score Logistic Regression 0.44 0.83 0.37 0.51 Random Forest Classifier 0.66 0.88 0.59 0.79 CatBoost Classifier 0.95 0.95 0.95 0.97
Similarly to the xG model, the CatBoost Classifier is the most effective among all the algorithms considered, consistently achieving top performance across all evaluation metrics. The precision-recall curve, as presented in Figure 4b, illustrates that the CatBoost Classifier exhibits the most significant area under the curve compared to the other two algorithms. This indicates the algorithm’s ability to detect instances belonging to the minority class. The precision-recall curve visualisation serves as compelling evidence of the model’s high accuracy in identifying relevant items.
By leveraging the CatBoost Classifier algorithm, the goal-scoring predictor achieves a remarkable performance, exceeding its counterparts in terms of precision, recall, and overall model capability. The visualisation of the precision-recall curve strongly supports these findings, highlighting the beneficial qualities of the algorithm in accurately identifying relevant instances. The visualisation is presented in Figure 4.

2.3 Development of forecasting model for transfer fees
As discussed in Section 1, several factors affect footballers’ transfer values. Our target variable is the gain or loss in transfer value over a certain period. We are particularly interested in the relationship between this variable and the player score computed in Subsection 2.2. Nevertheless, the specification for the model training includes other features, the whole list is given in Table 2.3.
Features for transfer value gain/loss predictor. Categorical features Discrete features Pitch position of a player Evaluation time of a player(number of games) Time lag between transfer value change (months) Age of a player Age2 of a player
The task revolves around predicting the increase or decrease in transfer fees, measured in millions of euros, constituting a regression problem. To address this, we employ regression algorithms, precisely the Random Forest Regressor, CatBoost Regressor, and Decision Tree Regressor.
All the algorithms above exhibit robustness in the presence of outliers. Furthermore, the Decision Tree Regressor, along with the Random Forest Regressor and CatBoost Regressor, possess the capacity to capture nonlinear relationships and interactions among features in the data set. Moreover, the CatBoost Regressor includes an automated feature scaling mechanism, thereby obviating the necessity for manual feature scaling or normalisation. This capability streamlines the preprocessing stage and alleviates the associated time and effort requirements.
The evaluation of our research is based on appropriate metrics for regression tasks, namely the root mean squared error(RMSE) and mean absolute error(MAE). These metrics allow us to assess the accuracy and precision of our models in predicting the gain or loss in transfer fees.
Furthermore, we utilise each algorithm’s built-in feature_importance method to determine the relative importance of features in relation to the player’s score and the gain or loss in transfer value. This analysis will allow us to rank the level of importance among all the features.
Similarly to the approach employed in Sections 2.1 and 2.2, the data set is split into training and testing sets using a weight of 0.7 and 0.3, respectively. This partitioning ensures that the models are trained on sufficient data while retaining a separate portion for unbiased evaluation.
Target variable realisations are obtained from the data set [8], which provides comprehensive football-related information, including scores, results, statistics, transfer news, and fixtures. These data were derived from the following resources available in the public domain: https://www.kaggle.com/datasets/davidcariboo/player-scores. As part of the feature engineering process, the features evaluation time of a player, time lag between transfer value changes, age of a player, and age2 are computed. Additionally, the pitch position of a player is sourced from the StatsBomb data set.
The outcomes of the trained models are presented in Table 2.3, which showcases the performance and effectiveness of the different regression algorithms in predicting transfer values.
Transfer value gain/loss predictors’ results. RMSE MAE Importance of player’s score(rank) CatBoost Regressor 6.23 4.53 1 Random Forest Regressor 6.29 4.26 1 Decision Tree Regressor 6.34 4.30 4
It is essential to highlight that the range of the target variable in the test set differs by 37 (in millions of euros) between the minimum and maximum values. Due to large values within the test set, relying on the MAE metric is more appropriate as it is more robust to outliers compared to RMSE.
With this in mind, the Random Forest Regressor algorithm performs better by achieving an MAE of 4.26 (in millions of euros). This indicates that, on average, the model’s predictions for gains or losses in transfer value deviate by 4.26 (in millions of euros).
When considering the absolute sum of the values in the test set, which amounts to 232.2 million euros, the proportion of the MAE result to the predicted values by the algorithm is merely 2.05%. This demonstrates the high stability of the model, even when dealing with large value ranges.
The robustness and accuracy of the Random Forest Regressor algorithm, as evidenced by its MAE performance, suggest its effectiveness in accurately predicting gains or losses in transfer values.
3 Results
In this section, we present real-life applications of the resulting algorithm, which integrates the aforementioned models. Specifically, we focus on the European Football Championship 2020 and select three highly notable teams, namely Denmark, Czech Republic and Italy. Subsequently, we randomly select two players from each team.
For these selected footballers, their performance scores are computed and utilised as one of the parameters in the model established in Section 2.3. These performance scores provide valuable insights into the players’ on-the-field contributions, allowing us to incorporate their performance into the forecasting model. The results are presented in Table 3.
Application of the algorithm.Transfer values changes. Name Team Position Score Predicted value change(mln. euros) Kaggle data set value change(mln. euros) A. Belotti* Italy Center Forward -2.08 -3.08 -7.00 Jorginho Italy Center Defensive Midfield 1.51 15.30 5.00 M. Damsgaard Denmark Left Attacking Midfield 1.17 11.20 7.00 J. Maehle Denmark Left Back 2.05 7.20 6.00 O. Celustka* Czech Republic Right Center Back 0.23 -2.91 -0.05 P. Schick Czech Republic Center Forward 1.58 7.34 5.00
-
•
* - assessment considers only international performance due to data sparsity of national championships
By leveraging the performance scores of selected players, we can effectively evaluate the predictive capabilities of the established model in the context of the European Football Championship 2020.
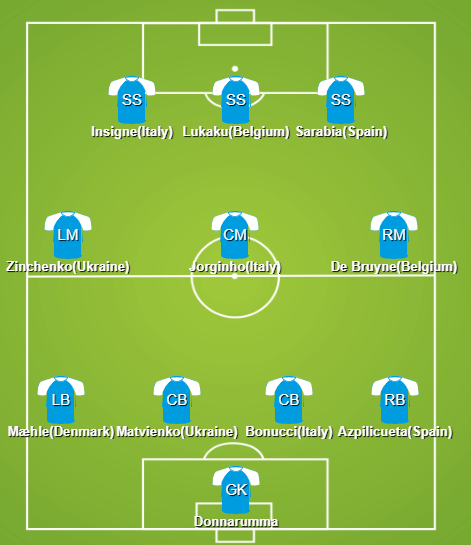
Furthermore, we apply our algorithm as a valuable tool for constructing the symbolic team of the European Football Championship 2020 with a 4-3-3 formation, consisting of 4 defenders, 3 midfielders, and 3 strikers. To accomplish this, we evaluated all teams that reached the quarter-final stage of the championship.
Based on their positions, we establish rankings for all players and select the top performers for each position. By considering their performances as determined by our algorithm, we assemble a highly skilled and representative team that encapsulates the tournament’s standout players. This process ensures that the symbolic team comprises outstanding talents from various positions, forming a cohesive and formidable group in line with the 4-3-3 formation.
As mentioned in Section 2, we leverage the normalised score, as defined in (6), to compare players. Additionally, we impose the condition that only footballers who had participated in three or more games throughout the entire championship are considered for evaluation.
By normalising the scores, we ensure a fair and equitable comparison among players, accounting for any variations or biases that might arise from game participation or playing time differences. This normalisation process allows us to assess players on a consistent scale and make meaningful comparisons based on their performance.
Furthermore, by setting the minimum threshold of three games played, we establish a criterion that guarantees a certain level of participation and consistency in performance. This condition offers a reliable basis for evaluating the players and ensures that our analysis encompasses players who have significantly contributed to their respective teams throughout the championship—the modelling results presented in Figure 5.
These examples illustrate how the algorithm can be used to address specific challenges and generate insights in various domains. By applying the algorithm to real-life data sets, we showcase its ability to contribute to the understanding and analysis of complex systems.
4 Discussion
The current research can be enhanced from several perspectives. Firstly, incorporating optical-tracking data, which enables automatic tracking of all players’ locations, would broaden the scope of actions that can be considered in the analysis. This richer data set would allow for a more comprehensive modelling of footballers’ actions, considering the actions of both the attacking and defending teams. Defensive actions could be evaluated by modelling the game as an action-reaction system, enabling a more holistic assessment of game states. This expanded model would encompass various scenarios and provide a more thorough understanding of the game dynamics.
Furthermore, the transfer value gain or loss prediction could be further improved by incorporating additional features into the model. For example, factors such as the remaining contract term, the economic level of the recruiting club [16], and the number of injuries for a player could enhance the predictive capabilities. By including these features, the model would gain insights into the influence of contract situations, club finances, and player fitness on transfer value dynamics. Moreover, by collecting data from low- and middle-budget clubs, the research could achieve robustness and unbiasedness by accounting for a broader range of transfer fee patterns. Expanding the data set to include clubs of different economic capacities would provide valuable insights into the dynamics of transfer values across various contexts. It could uncover patterns that need to be more evident in data sets solely focused on high-budget clubs.
5 Conclusions
The results of this study showcase the models’ potential for generating valuable insights into sports economics and PA. Managers can employ these models to optimise decision-making processes, particularly when managing budgets. Similarly, coaches and scouts can benefit from utilising the models as supplementary tools that offer data-driven perspectives on players. Therefore, applying the established models in the sports industry presents an avenue for practitioners to gain a competitive edge and make more informed and effective decisions.
Declaration of interest statement
No potential conflict of interest was reported by the authors.
Funding details
The authors reported there is no funding associated with the work featured in this article.
References
- Andersen et al. [2022] L. W. Andersen, J. W. Francis, and M. Bateman. Danish association football coaches’ perception of performance analysis. International Journal of Performance Analysis in Sport, 22(1):149–173, 2022. https://doi.org/10.1080/24748668.2021.2012040. URL https://doi.org/10.1080/24748668.2021.2012040.
- Anzer and Bauer [2021] G. Anzer and P. Bauer. A goal scoring probability model for shots based on synchronized positional and event data in football (soccer). Frontiers in Sports and Active Living, 3, 2021. https://doi.org/10.3389/fspor.2021.624475. URL https://doi.org/10.3389/fspor.2021.624475.
- Cronin et al. [2012] C. Cronin, T. Bampouras, and P. Miller. Performance analytic processes in elite sport practice: An exploratory investigation of the perspectives of a sport scientist, coach and athlete. International Journal of Performance Analysis in Sport, 12:468–483, 2012. https://doi.org/10.1080/24748668.2012.11868611. URL https://doi.org/10.1080/24748668.2012.11868611.
- Decroos et al. [2019] T. Decroos, L. Bransen, J. Van Haaren, and J. Davis. Actions speak louder than goals: Valuing player actions in soccer. In Proceedings of the 25th ACM SIGKDD International Conference on Knowledge Discovery & Data Mining, page 1851–1861, New York, NY, USA, 2019. Association for Computing Machinery. ISBN 9781450362016. https://doi.org/10.1145/3292500.3330758. URL https://doi.org/10.1145/3292500.3330758.
- Fernández et al. [2019] J. Fernández, L. Bornn, and D. Cervon. Decomposing the immeasurable sport: A deep learning expected possession value framework for soccer. In Research paper, MIT Sloan, Sport Analytics Conference, Boston, 2019.
- Goes-Smit et al. [2018] F. Goes-Smit, M. Kempe, R. Meerhoff, and A.P.M. Koen Lemmink. Not every pass can be an assist: A data-driven model to measure pass effectiveness in professional soccer matches. Big Data, 7, 2018. https://doi.org/10.1089/big.2018.0067. URL https://doi.org/10.1089/big.2018.0067.
- He et al. [2015] M. He, R. Cachucho, and A. J. Knobbe. Football player’s performance and market value. In In Proceedings of the 2nd workshop of sports analytics, European Conference on Machine Learning and Principles and Practice of Knowledge Discovery in Databases (ECML PKDD), pages 87–95, 2015.
- Kaggle [2023] Kaggle. Football data from transfermarkt, 2023. URL https://www.kaggle.com/datasets/davidcariboo/player-scores.
- Kovacs and Toka [2022] R. Kovacs and L. Toka. Predicting player transfers in the small world of football, 2022. URL https://doi.org/10.1007/978-3-031-02044-5\_4.
- Liu and Schulte [2018] G. Liu and O. Schulte. Deep reinforcement learning in ice hockey for context-aware player evaluation. In Proceedings of the Twenty-Seventh International Joint Conference on Artificial Intelligence, July, IJCAI-18., pages 3442–3448, 2018. https://doi.org/10.24963/ijcai.2018/478. URL https://doi.org/10.24963/ijcai.2018/478.
- Liu et al. [2020] G. Liu, Y. Luo, O. Schulte, and T. Kharrat. Deep soccer analytics: Learning an action-value function for evaluating soccer players. Data Min. Knowl. Discov., 34(5):1531–1559, 2020. ISSN 1384-5810. https://doi.org/10.1007/s10618-020-00705-9. URL https://doi.org/10.1007/s10618-020-00705-9.
- Lucey et al. [2015] P. Lucey, A. Bialkowski, M. Monfort, P. Carr, and I. Matthews. ”Quality vs quantity”: Improved shot prediction in soccer using strategic features from spatiotemporal data. In In Proceedings of 8th Annual MIT Sloan Sports Analytics Conference (pp. 1-9), 2015.
- McHale and Holmes [2023] I. G. McHale and B. Holmes. Estimating transfer fees of professional footballers using advanced performance metrics and machine learning. European Journal of Operational Research, 306(1):389–399, 2023. ISSN 0377-2217. https://doi.org/10.1016/j.ejor.2022.06.033. URL https://doi.org/10.1016/j.ejor.2022.06.033.
- Nicholls et al. [2018] S. Nicholls, N. James, E. Bryant, and J. Wells. Elite coaches’ use and engagement with performance analysis within olympic and paralympic sport. International Journal of Performance Analysis in Sport, 18:1–16, 2018. https://doi.org/10.1080/24748668.2018.1517290. URL https://doi.org/10.1080/24748668.2018.1517290.
- Patnaik et al. [2019] D. Patnaik, H. Praharaj, K. Prakash, and K. Samdani. A study of prediction models for football player valuations by quantifying statistical and economic attributes for the global transfer market. In 2019 IEEE International Conference on System, Computation, Automation and Networking (ICSCAN), pages 1–7, 2019. https://doi.org/10.1109/ICSCAN.2019.8878843. URL https://doi.org/10.1109/ICSCAN.2019.8878843.
- Poli et al. [2022] R. Poli, R. Besson, and L. Ravenel. Econometric approach to assessing the transfer fees and values of professional football players. Economies, 10(1), 2022. ISSN 2227-7099. https://doi.org/10.3390/economies10010004. URL https://doi.org/10.3390/economies10010004.
- Power et al. [2017] P. Power, H. Ruiz, X. Wei, and P. Lucey. Not all passes are created equal: Objectively measuring the risk and reward of passes in soccer from tracking data. In Proceedings of the 23rd ACM SIGKDD International Conference on Knowledge Discovery and Data Mining, pages 1605–1613, 2017. ISBN 978-1-4503-4887-4. https://doi.org/10.1145/3097983.3098051. URL https://doi.org/10.1145/3097983.3098051.
- Rahimian et al. [2022] P. Rahimian, J. Van Haaren, T. Abzhanova, and L. Toka. Beyond action valuation: A deep reinforcement learning framework for optimizing player decisions in soccer. In 16th Annual MIT Sloan Sports Analytics Conference. Boston, MA, USA: MIT, page 25, 2022.
- Rein et al. [2017] R. Rein, D. Raabe, and D. Memmert. “Which pass is better ?” novel approaches to assess passing effectiveness in elite soccer. Human Movement Science, 55:172–181, 2017. ISSN 0167-9457. https://doi.org/10.1016/j.humov.2017.07.010. URL https://doi.org/10.1016/j.humov.2017.07.010.
- StatsBomb [2023] StatsBomb. open-data, 2023. URL https://github.com/statsbomb/open-data.