AT 2019pim: A Luminous Orphan Afterglow from a Moderately Relativistic Outflow
Abstract
Classical gamma-ray bursts (GRBs) have two distinct emission episodes: prompt emission from ultrarelativistic ejecta and afterglow from shocked circumstellar material. While both components are extremely luminous in known GRBs, a variety of scenarios predict the existence of luminous afterglow emission with little or no associated high-energy prompt emission. We present AT 2019pim, the first secure example of this phenomenon to be identified. Serendipitously discovered during follow-up observations of a gravitational-wave trigger and located in a contemporaneous TESS sector, it is hallmarked by a fast-rising ( hr), luminous ( mag) optical transient with accompanying luminous X-ray and radio emission. No gamma-ray emission consistent with the time and location of the transient was detected by Fermi-GBM or by Konus, placing strong limits on an accompanying GRB. We investigate several independent observational aspects of the afterglow in the context of constraints on relativistic motion and find all of them are consistent with an initial Lorentz factor of –50, significantly lower than in any well-observed GRB and consistent with the theoretically-predicted “dirty fireball” scenario in which the high-energy prompt emission is stifled by pair production. However, we cannot rule out a structured jet model in which only the line-of-sight material was ejected at low-, off-axis from a classical high- jet core. This event represents a milestone in orphan afterglow searches, demonstrating that luminous afterglows with weak or no detectable gamma-ray radiation exist in nature and can be discovered by high-cadence optical surveys.
1 Introduction
Long-duration gamma-ray bursts (GRBs) originate from the collapse of a rapidly rotating, stripped-envelope massive star. During the collapse, both a highly collimated relativistic jet and a largely isotropic supernova (SN) explosion are produced; the collision of the jet with the surrounding medium also produces a multiwavelength afterglow (for reviews see, e.g., van Paradijs et al. 2000; Piran 2004; Woosley & Bloom 2006; Hjorth & Bloom 2012; Gehrels & Mészáros 2012).
The properties of the SN show little variation from event to event (Cano, 2014; Cano et al., 2017; Melandri et al., 2014b). All known GRB-associated supernovae (SNe) are of spectral type Ic-BL; the SN peak luminosity varies by only about a factor of 2–3 and the rise time varies even less, suggesting a common progenitor with relatively little intrinsic diversity in (for example) structure or composition.111Known exceptions are plausibly associated with other classes of events: a few GRBs with s but with strong upper limits on an accompanying classical SN (GRBs 060605, 060614, 211211A, and 230307A; Fynbo et al. 2006; Gehrels et al. 2006; Della Valle et al. 2006; Rastinejad et al. 2022; Troja et al. 2022; Levan et al. 2023) may be related to short-duration GRBs or perhaps another class of event entirely (Gal-Yam et al., 2006; Ofek et al., 2007; Zhang et al., 2007; Jin et al., 2015; Yang et al., 2022), while GRB 111209A and its unusually luminous SN is a member of the ultra-long class of GRBs (Greiner et al., 2015; Levan et al., 2014).
The nature of the jet, however, is vastly more diverse. Inferred GRB isotropic gamma-ray energies () vary from to almost erg, while the duration, spectral hardness, and temporal structure of the GRB light curve also vary by orders of magnitude (Kouveliotou et al., 1993; Paciesas et al., 1999; Amati, 2006). Some of this variation may originate from simple differences in orientation angle (a “structured jet”; e.g., Mészáros et al. 1998; Rossi et al. 2002; Granot & Kumar 2003), but detailed studies of extreme events show that much of the variation is indeed intrinsic (Kulkarni et al., 1998; Soderberg et al., 2004; Amati et al., 2007; Cenko et al., 2010, 2011).
GRBs are by definition selected at high photon energies (10 keV) via the detection of prompt emission by an orbiting wide-field-of-view satellite, which is then followed by a narrow-field search for the associated afterglow and/or SN. However, there is no strong reason to expect that all energetic jet outflows must produce luminous gamma-ray emission of this nature. The outflow might, for example, be insufficiently variable to generate the luminous internal shocks that are generally presumed to produce GRB prompt emission (Rees & Meszaros, 1994). Alternatively, the velocity of the ejecta may be sufficiently low that pair production suppresses the production of the highest-energy photons (a “dirty” fireball; Dermer et al. 2000; Huang et al. 2002; Rhoads 2003). Geometrical reasons may also be important: the GRB ejecta that produce the prompt emission travel much faster (and beams its radiation into a narrower opening angle) than the afterglow which by definition is only set up once the outflow has decelerated somewhat (Rhoads, 1997; Perna & Loeb, 1998; Nakar et al., 2002; Granot et al., 2002; Rhoads, 2003). The rate of these various types of gamma-ray-“dark” explosions may greatly exceed that of classical long-duration GRBs.
Finding examples has, however, proven quite challenging. The optical, X-ray, and radio sky are all much more crowded than the gamma-ray sky, requiring the advent of both wide-field telescopes and sophisticated machine-learning techniques to distinguish genuine transients. There are also many false positives with similar “fast-rise, slow-decay” features. In the optical band, flares from M-dwarfs and cataclysmic variables (dwarf novae) are particularly problematic (Kulkarni & Rau, 2006; Rau et al., 2008; Berger et al., 2013; Ho et al., 2018; Andreoni et al., 2020): at typical operational flux limits, the rates of these events exceed the expected rate of afterglows by orders of magnitude.
However, the past ten years have seen steady progress. The first optical orphan222We use the term “orphan” to describe any afterglow without an observationally associated GRB. afterglow candidate was PTF11agg (Cenko et al., 2013), found by the Palomar Transient Factory during a dedicated, high-cadence, narrow-field experiment. PTF11agg was detected as a new, bright ( mag) transient in the first exposure of the field taken that night, and faded rapidly in subsequent exposures over the next few hours. Follow-up observations with the Karl G. Jansky Very Large Array (VLA; Perley et al. 2011) revealed a long-lived scintillating radio counterpart and deep late-time optical imaging unveiled a faint, blue extended object at the location — most likely a high-redshift host galaxy, although its actual redshift remains unknown and its cosmological nature unconfirmed (but very likely). Unfortunately, because of poor constraints on the true explosion time (a window of 20 hr between the most recent limit and first detection), it was not possible to rule out that the location was in a “blind spot” to Fermi and/or other satellites at the time of explosion.
Two other optical afterglows were subsequently discovered by wide-area sky surveys in a similar manner: iPTF14yb (Cenko et al., 2015) and ATLAS17aeu (Stalder et al., 2017; Bhalerao et al., 2017; Melandri et al., 2019). iPTF14yb was spectroscopically confirmed to originate at a cosmological distance (redshift ). ATLAS17aeu, discovered serendipitously in follow-up observations of a gravitational-wave trigger, also likely originated at given the photometric properties of its presumptive host galaxy, although (as with PTF11agg) it has not been possible to confirm this spectroscopically. However, both events were later found to have associated GRBs detected by Fermi or other satellites whose times and sky locations were consistent with the optically discovered afterglows.
Dedicated afterglow searches with the Zwicky Transient Facility (ZTF) have yielded nine published333This total does not include several other events distributed via GCN Circulars but not yet published, including the notable events AT 2023lcr and AT 2023sva. afterglow candidates to date (Ho et al., 2020, 2022; Andreoni et al., 2021, 2022), of which seven have redshift measurements from optical spectroscopy. Redshifts range from (AT 2021buv; Ho et al. 2022) to (AT 2020blt; Ho et al. 2020). Of the nine events, three had no associated detected GRB (AT 2020blt, AT 2021any, and AT 2021lfa). However, at the redshifts of these three events an accompanying typical GRB cannot be ruled out based on the sensitivity and coverage of GRB satellites (Ho et al., 2020, 2022). As a result, it is unclear if these objects represent normal GRBs whose prompt high-energy emission was simply missed. Modeling the X-ray through radio emission, and the detection of a “rise phase” using the MASTER telescope network, has led to suggestions that at least some of these events had a truly low Lorentz factor (Lipunov et al., 2022; Xu et al., 2023), and that another may represent a GRB with a low gamma-ray efficiency (Sarin et al., 2022).
Advancements have also been made outside the optical domain. An X-ray transient with GRB-like properties and no known GRB counterpart was reported by Bauer et al. (2017), although it is much lower in luminosity than classical GRB afterglows and is also spectroscopically unconfirmed (although photometric constraints on the host-galaxy redshift are relatively good: ). Separately, searches for orphan afterglows using radio-survey data have identified a compelling candidate radio afterglow, plausibly from a highly off-axis GRB (Law et al., 2018), but the explosion time window is years long and it is not possible rule out a classical GRB origin. Additionally, radio follow-up observations of optically discovered SNe Ic-BL have identified a few with moderately luminous radio emission indicative of a very energetic high-velocity shock, although no clear evidence of a jetted, relativistic outflow has yet emerged (Soderberg et al., 2010; Margutti et al., 2014; Corsi et al., 2017).
In this paper we describe the discovery of AT 2019pim (ZTF19abvizsw), the first optical afterglow with limits on accompanying prompt high-energy emission deep enough to rule out a typical GRB. In §2 we briefly outline the ZTF afterglow search program and the partially serendipitous discovery of AT 2019pim during a gravitational-wave counterpart search, and describe our observational follow-up activities that confirmed this source as an afterglow. We model the observational properties in §3, including the explosion time and peak time using a combination of our ZTF discovery observations, follow-up observations, and TESS data, and we place upper limits on associated gamma-ray emission from Konus and Fermi. §4 establishes physical constraints on the nature of the outflow using the combined optical and radio data set, and we summarise our conclusions in §5.
2 Observations
2.1 P48 Discovery
The Zwicky Transient Facility (ZTF; Bellm et al. 2019a; Graham et al. 2019) is a refurbishment of the Palomar 48-inch Oschin Schmidt telescope (P48), most recently in use as part of the Palomar Transient Factory (PTF). The ZTF camera has a 47 square degree operational field of view, fast readout, and near-real-time data processing (Masci et al., 2019; Dekany et al., 2020).
A major science driver of ZTF has been the search for luminous, fast, and/or young transients (characteristic timescales day). While such transients can be detected in the standard 2–3 d cadence public survey (Bellm et al., 2019b), higher-cadence observations (nightly or faster cadence) are better suited for rapid and accurate identification of these objects. Several ZTF programmes operate at higher cadence, including a 10,000 square degree “partnership” survey which acquires 4 observations of each field per night and a 2000–3000 1-night cadence survey. During 2019 and 2020, ZTF also conducted a public 1-night cadence survey shadowing the Transiting Exoplanets Survey Satellite (TESS; Ricker et al. 2015) footprint (van Roestel et al., 2019). Custom software filters scan all of these streams to search for bright new transients not coincident with known point sources.
On 2019 September 1 (23:31:01.838 UTC444UT dates are used throughout this paper.; equivalent to 58727.97988 MJD) the LIGO-VIRGO network (Abbott et al., 2018) registered a candidate gravitational-wave signal, initially designated S190901ap (LIGO Scientific Collaboration and Virgo Collaboration, 2019), consistent with a neutron-star–neutron-star merger waveform555The astrophysical nature of this event has not been confirmed by further analysis (Abbott et al., 2021).. Only LIGO L1/Livingston detected the event (H1/Hanford was offline) and thus the localisation was exceptionally poor, covering over 14,000 deg2; the distance constraint is 241 79 Mpc ()666We assume , , throughout this work.. Nevertheless, ZTF was triggered in target-of-opportunity mode for the following night to tile as much of the observable error region as possible and all candidates detected during the night with no previous history were scanned by eye using tools available via the GROWTH Marshal (Kasliwal et al., 2019).
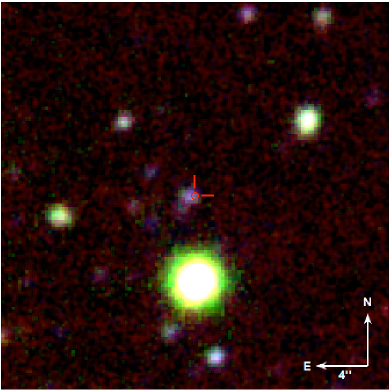
AT 2019pim was initially “saved” (i.e., flagged by a human as a probable real transient) as part of an unrelated software filter designed to look for young SNe. The transient was first detected at MJD = 58728.1798 with a magnitude777Magnitudes are in the AB system (Oke & Gunn, 1983) and uncertainties are 1 throughout, unless otherwise specified. of . Following a filter change, the source was detected again hr later (MJD = 58728.2300) with mag at a consistent location (, ; J2000). There is no counterpart in prior ZTF reference imaging nor any previous detections of variability at the same location; the most recent nondetection originates from the preceding night ( mag at MJD = 58727.3161). The source was within the TESS footprint and the associated footprint of the public ZTF 1-night TESS shadowing survey, but it did not generate a public alert because the gravitational wave target-of-opportunity search programme displaced normal public observations that night. The transient was reported to the GCN Circulars (as ZTF19abvizsw, its internal ZTF survey name), along with the three other transients detected that night consistent within the error region with no prior history (Kool et al., 2019). All four candidates were reported to the Transient Name Server the next day (Fremling, 2019).
2.2 Spectroscopy
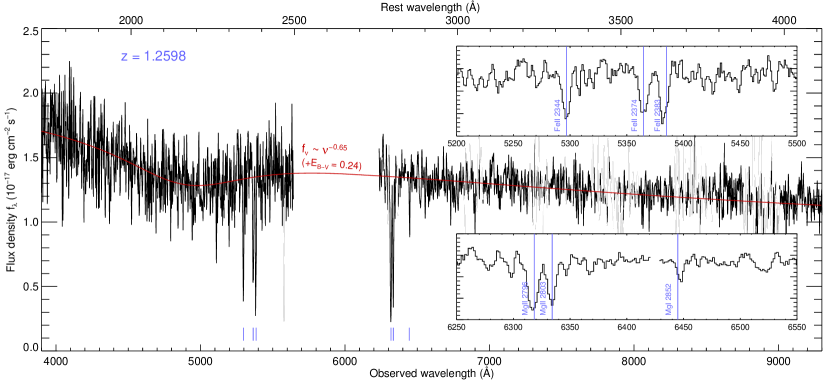
On the night following the discovery of the transient (2019-09-03) we obtained a spectrum using the Low Resolution Imaging Spectrometer (LRIS; Oke et al. 1995) on the Keck I 10 m telescope. The 600/4000 grism was used on the blue side and the 600/7500 grating was used on the red side, providing wavelength coverage of 3139–5642 Å (blue) and 6236–9516 Å (red). The 1 arcsec slit was used, positioned at the parallactic angle (134 at the time of observation). The exposure time was 600 s on both sides. The spectrum was reduced using LPipe (Perley, 2019) with BD+284211 as a flux calibrator. The red and blue relative flux scales are scaled by matching synthetic photometry to colours inferred from photometry of the transient.
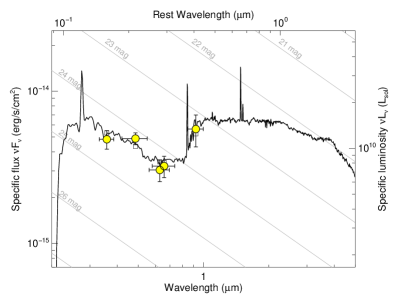
The reduced spectrum, shown in Figure 1, is largely featureless and fairly red. Deep, narrow absorption lines are evident in the middle region of the spectrum; these are matched by Fe II, Mg II, and Mg I at a common . We associate this with the redshift of the transient, although because the signal-to-noise ratio (S/N) of the spectrum does not permit the detection of fine-structure lines it is technically only a lower limit on the true redshift. A firm upper limit of can be placed by the absence of Lyman . The implied rest-frame UV magnitude (AB) at the time of the -band discovery is (for , as will be assumed throughout the remainder of this paper). This unambiguously identifies the event as an extremely luminous cosmological explosion and firmly rules out any association with the gravitational-wave trigger.
2.3 Follow-up Photometry
We obtained observations using several different telescopes at different locations around the globe to obtain additional photometric observations of AT 2019pim over the first few nights following its discovery. These include the GROWTH India Telescope (GIT; Kumar et al. 2022), the Liverpool Telescope (LT), and the Apache Point Observatory 3 m telescope (APO). We additionally acquired later imaging observations of the transient with ACAM on the William Herschel Telescope (2019-09-11/12), with LRIS on the Keck I 10 m telescope (2019-09-24 and 2019-10-27), and with OSIRIS on the GTC (2019-11-23). Late-time reference imaging of the host galaxy was taken with LRIS in April 2022 using the LRIS , , , and filters.
| filter | AB magnitude |
|---|---|
| 24.63 0.09 | |
| 24.29 0.07 | |
| 24.50 0.15 | |
| 24.20 0.06 | |
| (24.08)† | |
| 23.38 0.09 |
†Estimated using SED fitting (§3.5)
Photometry for most follow-up observations was performed using a custom aperture photometry routine in IDL, with calibration performed relative to Sloan Digital Sky Survey (SDSS) secondary standard stars in the field.
The host galaxy of this source is relatively bright and contributes non-negligibly to the flux at all epochs. For most of our measurements, we correct for the host contribution in flux space by measuring the host flux in the late-time LRIS imaging (, , , and were treated as , , , and , respectively) and GTC imaging888The GTC observations were taken 83 days post-explosion, when afterglow contribution may still have been present. Our empirical model (§3.2) suggests that the afterglow had mag at this time, which would represent about 0.06 mag contribution to the host measurement. This is less than the 1 statistical uncertainty in the photometry, and we did not correct for this in our estimate in Table 1. () and subtracting the fluxes from the direct aperture photometry measurements. No reference imaging was acquired in the band, so the host flux at this band was inferred indirectly via synthetic photometry of our fit to the host spectral energy distribution (SED). The host-galaxy magnitudes are given in Table 1.
While the host galaxy is compact and direct flux subtraction should generally be adequate, in the case of the LRIS measurements in September and October we employ image subtraction to obtain the flux of the afterglow above the level of the host galaxy. This was not possible for the simultaneous LRIS -band observations, since no late-time reference image was obtained in this band. Photometry is presented in Table 2.
| facility | MJD | filter | AB mag. | unc. |
|---|---|---|---|---|
| P48+ZTF | 58727.1641 | g | 20.74 | |
| P48+ZTF | 58727.1790 | g | 20.77 | |
| P48+ZTF | 58727.2708 | g | 20.64 | |
| P48+ZTF | 58727.2933 | r | 20.49 | |
| P48+ZTF | 58727.3161 | g | 20.60 | |
| P48+ZTF | 58728.1798 | g | 20.04 | 0.16 |
| P48+ZTF | 58728.2297 | r | 19.45 | 0.11 |
| GIT | 58728.6034 | r | 20.34 | 0.09 |
| GIT | 58728.6100 | r | 20.35 | 0.06 |
| GIT | 58728.6189 | i | 20.12 | 0.09 |
| GIT | 58728.6259 | i | 19.97 | 0.08 |
| GIT | 58728.6353 | r | 20.40 | 0.08 |
| GIT | 58728.7223 | i | 19.96 | 0.08 |
| GIT | 58728.7287 | i | 20.09 | 0.09 |
| GIT | 58728.8026 | g | 21.23 | 0.11 |
| GIT | 58728.8093 | g | 21.07 | 0.10 |
| LT+IOO | 58729.8552 | r | 21.54 | 0.18 |
| LT+IOO | 58729.9420 | r | 21.70 | 0.09 |
| LT+IOO | 58729.9481 | g | 22.16 | 0.10 |
| LT+IOO | 58729.9541 | i | 21.24 | 0.07 |
| LT+IOO | 58729.9621 | z | 20.96 | 0.12 |
| LT+IOO | 58730.8802 | r | 22.17 | 0.10 |
| LT+IOO | 58730.8862 | g | 22.73 | 0.21 |
| LT+IOO | 58730.8923 | i | 21.72 | 0.10 |
| LT+IOO | 58730.8983 | z | 21.33 | 0.19 |
| LT+IOO | 58731.0112 | r | 22.23 | 0.12 |
| LT+IOO | 58731.0172 | g | 22.78 | 0.17 |
| LT+IOO | 58731.0232 | i | 21.76 | 0.11 |
| LT+IOO | 58731.0293 | z | 21.75 | 0.22 |
| APO | 58733.2200 | r | 22.36 | 0.03 |
| APO | 58733.2530 | i | 21.94 | 0.05 |
| APO | 58733.2650 | g | 22.78 | 0.11 |
| WHT+ACAM | 58737.8819 | r | 22.77 | 0.10 |
| WHT+ACAM | 58738.8839 | i | 22.55 | 0.09 |
| WHT+ACAM | 58739.9939 | i | 22.67 | 0.13 |
| WHT+ACAM | 58740.0219 | r | 23.48 | 0.27 |
| Keck1+LRIS | 58750.2351 | g | 25.44 | 0.36 |
| Keck1+LRIS | 58750.2354 | i | 25.50 | 0.63 |
| Keck1+LRIS | 58783.2306 | i | 24.66 | |
| Keck1+LRIS | 58783.2306 | g | 26.22 |
2.4 TESS observations
As previously noted, AT 2019pim was detected in a high-cadence ZTF field associated with an active TESS sector. TESS observed the field nearly continuously during Sector 15 from 2019-08-15 to 2019-09-10 in Camera 2, CCD 2. The location was imaged in nearly 2400 30 min full-frame images (FFIs) over that period.
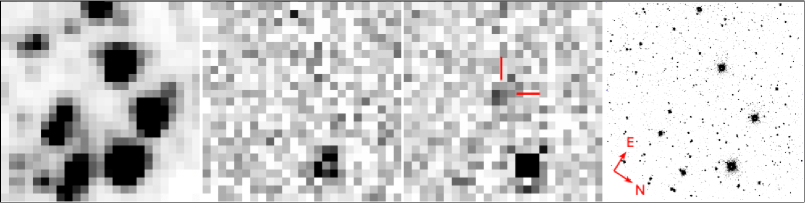
A light curve for AT 2019pim was constructed from the FFIs using difference imaging. First, we constructed a reference image by median stacking 20 FFIs with low background levels (Figure 3). We then subtracted the reference image from each epoch using the ISIS software (Alard & Lupton, 1998; Alard, 2000), which solves for a spatially variable kernel that matches the point-spread function (PSF) of the reference image to individual FFIs. This procedure removes systematic errors due to pointing shifts/jitter and thermal variations, and is able to recover clear but weak detections of the transient in individual images. We extracted a light curve by fitting a model of the PSF to the difference images at the predicted location of the transient in the FFIs based on the coordinates of AT 2019pim, and subtracted a local background based on the median of pixel values in an annulus of inner/outer radius 8/12 pixels, following similar procedures as by Fausnaugh et al. (2023).
Despite background subtraction and PSF-fitting, the long-term light curve shows slow ( d), low-level ( Jy) variations in the baseline flux. The origin of this is not completely certain, but is likely due to a combination of real variation in nearby bright stars that are blended with the transient and its background annulus, and (particularly in the days after the afterglow onset) variations in the background as the Earth limb becomes visible to the spacecraft. To model these background estimations we first subtracted a model of the late-time afterglow flux based on ground-based data (§3.2), then measured the remaining background flux using a series of median windows with a duration of 0.5 d each spanning from 3 d prior to the likely explosion time to 3 d after, excluding a 1 d region around the afterglow onset. A fourth-order polynomial was then fit to the median-averaged data, and the resulting background model was subtracted from the raw count values to estimate the afterglow count rate.
The photon-counting uncertainties in the count measurements substantially underestimate the actual variation from exposure to exposure, even on short timescales when no background or afterglow variation is expected. We calculated corrected errors by taking the standard deviation of the afterglow- and background-subtracted flux over each of the median windows described above and fit this with a second-order polynomial to model the time dependence of the noise.
TESS count values are converted to preliminary flux-density values (at the TESS central wavelength of = 7865 Å) using a conversion factor of 0.01208 Jy/count, calculated assuming a standard (Vega-like) spectrum and an on-source integration time of (1800 s) (0.8) (0.99) = 1425.6 s per FFI exposure.
The TESS light curve is given in Table 3. The counts column provides values prior to any background subtraction; the flux column lists values after background subtraction. Observations taken more than 0.2 d before or after the probable explosion time were binned together in proportion to the time before or after explosion.
| MJDa | Countsb | |||
|---|---|---|---|---|
| (Jy) | (Jy) | |||
| 58727.74062 | -1215 | -6.58 | 12.58 | 3 |
| 58727.80312 | 207 | 11.25 | 12.63 | 3 |
| 58727.85520 | -1873 | -13.35 | 15.52 | 2 |
| 58727.89688 | -1425 | -7.51 | 15.56 | 2 |
| 58727.93854 | -411 | 5.17 | 15.59 | 2 |
| 58727.98020 | -555 | 3.86 | 15.63 | 2 |
| 58728.02188 | 260 | 14.12 | 15.67 | 2 |
| 58728.05312 | -1055 | -1.45 | 22.20 | 1 |
| 58728.07396 | 387 | 16.19 | 22.22 | 1 |
| 58728.09479 | -2752 | -21.54 | 22.25 | 1 |
| 58728.11562 | -524 | 5.59 | 22.28 | 1 |
| 58728.13646 | 448 | 17.54 | 22.30 | 1 |
| 58728.15729 | 3774 | 57.93 | 22.33 | 1 |
| 58728.17812 | 9708 | 129.81 | 22.35 | 1 |
| 58728.19895 | 8994 | 121.39 | 22.38 | 1 |
| 58728.21979 | 4562 | 68.06 | 22.40 | 1 |
| 58728.24062 | 5409 | 78.49 | 22.43 | 1 |
| 58728.26145 | 6813 | 95.65 | 22.45 | 1 |
| 58728.28229 | 6737 | 94.93 | 22.47 | 1 |
| 58728.30312 | 7242 | 101.22 | 22.50 | 1 |
| 58728.32395 | 6121 | 87.88 | 22.52 | 1 |
| 58728.34479 | 5487 | 80.41 | 22.55 | 1 |
| 58728.37603 | 3780 | 60.08 | 15.97 | 2 |
| 58728.41770 | 4082 | 64.11 | 16.00 | 2 |
| 58728.45937 | 2199 | 41.74 | 16.03 | 2 |
| 58728.50103 | 4200 | 66.26 | 16.07 | 2 |
| 58728.55312 | 4604 | 71.59 | 13.15 | 3 |
| 58728.61562 | 3785 | 62.21 | 13.19 | 3 |
| 58728.67812 | 1384 | 33.70 | 13.23 | 3 |
| 58728.75451 | 1587 | 36.73 | 13.27 | 3 |
| 58728.83437 | 305 | 21.79 | 11.54 | 4 |
| 58728.92812 | 968 | 30.40 | 10.36 | 5 |
| 58729.03228 | 1402 | 36.23 | 10.40 | 5 |
| 58729.14687 | -404 | 14.95 | 9.54 | 6 |
a Midpoint of observation.
b TESS counts, prior to subtraction of the time-dependent background model. (For binned rows, this is the mean counts per exposure.)
c TESS flux density, after subtraction of the time-dependent background model. Not corrected for Galactic or host extinction.
d TESS flux-density uncertainty, based on the noise model.
e Number of exposures (FFIs) binned together.
Note: This table includes only measurements close to the inferred onset time of the afterglow. A complete table of all TESS measurements with no binning applied is provided in the online supplementary material.
2.5 Limits on a GRB Counterpart
We searched the Fermi999https://heasarc.gsfc.nasa.gov/W3Browse/fermi/fermigbrst.html (Gruber et al., 2014; von Kienlin et al., 2014; Narayana Bhat et al., 2016), Fermi subthreshold101010https://gcn.gsfc.nasa.gov/fermi_gbm_subthresh_archive.html (with reliability flag !=2), Swift111111https://swift.gsfc.nasa.gov/archive/grb_table/, and General Coordinates Network121212https://gcn.gsfc.nasa.gov/gcn3_archive.html archives for a GRB between the last ZTF nondetection and the first ZTF detection. The only event that occurred during this period was the known GRB 190901A, at MJD 58727.89015. The position of this GRB is inconsistent with that of AT 2019pim and its time of occurrence was several hours before the optical explosion-time window (§3.1), so an association can be firmly ruled out.
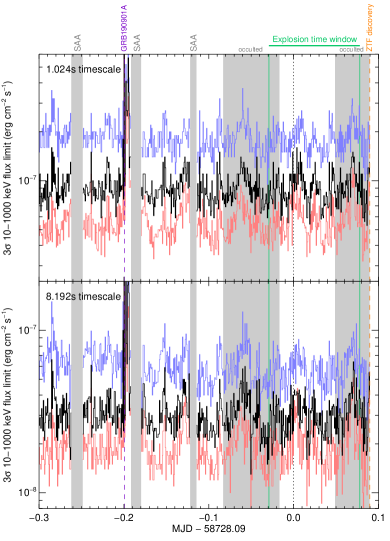
The position of AT 2019pim was in the field of view of the Fermi Gamma-Ray Burst Monitor (GBM; Meegan et al. 2009) throughout the period between the most recent ZTF upper limit and ZTF discovery except for brief Earth occultations and South Atlantic Anomaly (SAA) passages. We ran the GBM targeted search in the 10–1000 keV energy band during this period. The detector count data was separated into 1 min blocks, each of which was analysed on 1 s and 8 s sliding time windows and, assuming a spectral model (described below), checked for detector-coherent flux above the background level.
Limits were calculated for two different search timescales (1.024 s and 8.192 s) and three different spectral models, shown in Figure 4. Our preferred spectral model is parameterised using a Band (2003) function with keV, , , and is shown as a black curve, although for comparison we also provide limits assuming two other models: a “soft” model assuming a Band spectrum and keV, , , and a “hard” model with a cutoff power law (Goldstein et al., 2016) and keV, . For the preferred model131313For the “hard” spectral model the limit would be shallower by a factor of , although given the relation Amati (2006) a spectrally hard burst at would be expected to also be very luminous., the typical limit on the 1 s peak flux during the optical explosion time window is erg cm-2 s-1, equivalent to a limit on the peak luminosity of erg s-1. For 8.192 s intervals, the limit on the average flux is erg cm-2, equivalent to erg s-1.
To convert these values to approximate limits on the burst fluence, we take the 8 s flux limit and multiply by the assumed characteristic timescale, typically 40 s for long-duration GRBs. We obtain erg s-1, equivalent to erg s-1.
Fermi was occulted in the direction of AT 2019pim for about 20 minutes at the beginning of the afterglow-inferred explosion window and about 40 minutes towards the end of the window, so no limit can be placed on gamma-ray emission during this period from GBM. However, the Interplanetary Network was sensitive to the position of AT 2019pim throughout this interval, and no detections are recorded.
From the Konus-Wind observations, for a typical long-GRB spectrum described by the Band function (, keV, ) the 90% confidence limiting peak flux (10 keV–10 MeV) is erg cm-2 s-1, equivalent to erg s-1. Assuming a similar scaling over longer intervals as in GBM, the equivalent limit is about erg.
The position of AT 2019pim was not141414Search conducted using https://github.com/lanl/swiftbat_python in the field of view of the Swift Burst Alert Telescope (BAT; Barthelmy 2004), except for during short windows.
2.6 Swift XRT Observations
We obtained two 3 ks observations with the X-Ray Telescope (XRT; Burrows et al. 2005) on board the Neil Gehrels Swift observatory (Swift; Gehrels et al. 2004) under a target-of-opportunity program (target ID 11549). The first observation started on Sept 4.13, and the second started on Sept 12.08. Using the online tool151515https://www.swift.ac.uk/user_objects/ from the Swift team (Evans et al., 2007, 2009), we found that the count rate in the first observation was s-1 with a best-fit photon index of and a corresponding unabsorbed flux density of erg cm-2 s-1 (90% confidence), and erg s-1 (Ho et al., 2019). This assumes a neutral hydrogen column density cm-2 (Willingale et al., 2013). In the second observation, the count rate was s-1. Assuming the same photon index () and we used webpimms161616https://heasarc.gsfc.nasa.gov/cgi-bin/Tools/w3pimms/w3pimms.pl to find erg cm-2 s-1 and erg s-1.
2.7 Radio Observations
Shortly after the spectroscopic confirmation of the transient, we triggered our pre-approved VLA program for follow-up observations of orphan afterglows (program ID VLA/18B-242, PI D. Perley). The transient was well detected in the initial X-band observation and we continued following it with a series of observations at L, S, C, X, and Ku bands during the 2019B A-configuration cycle. Observations in different bands were not always obtained at the same epoch owing to scheduling constraints. Late-time observations were obtained in 2020A via dedicated follow-up programs (IDs VLA/19B-342 and VLA/20A-506, PI D. Perley). This included a D-configuration observation in C, X, and Ku bands in January 2020, a C-configuration observation in X and Ku bands in April 2020, and a final deep ( hr) C-configuration observation in X band in June 2020. The D-configuration C-band observations were significantly affected by radio frequency interference (RFI), as were the April C-configuration X-band observations above 10 GHz.
Data reduction was performed using standard procedures in the Astronomical Image Processing System (AIPS). Images were made in separate windows with a bandwidth of 1 GHz, except in the last two observations where images were made with a 2 GHz bandwidth. Flux-density measurements were performed using jmfit. In the small number of cases where the afterglow was not securely detected, the location of the centroid was fixed to the position as measured in our high-S/N A-configuration imaging to provide a forced measurement of the flux density. All values are reported in Table 4. Reported uncertainties do not include errors in the flux calibration, which is expected to be about 5% (or less) of each measurement.
We do not apply any corrections for radio emission from the host galaxy. The star-formation rate of the host as measured from optical SED fitting (§3.5) is about 3 yr-1, which (using the relations in Murphy et al. 2011) at the distance of AT2019pim would contribute only 0.6 Jy of radio continuum flux at 1 GHz and less at shorter wavelengths, and so can safely be ignored.
| MJD | unc. | MJD | unc. | ||||
|---|---|---|---|---|---|---|---|
| (GHz) | (Jy) | (Jy) | (GHz) | (Jy) | (Jy) | ||
| 58731.0379 | 8.50 | 25 | 9 | 58760.1055 | 5.50 | 340 | 9 |
| 58731.0379 | 9.50 | 52 | 8 | 58760.1055 | 6.50 | 451 | 9 |
| 58731.0379 | 10.50 | 93 | 9 | 58760.1055 | 7.50 | 434 | 9 |
| 58731.0379 | 11.50 | 103 | 10 | 58760.1278 | 8.50 | 345 | 9 |
| 58733.1521 | 8.50 | 183 | 9 | 58760.1278 | 9.50 | 314 | 9 |
| 58733.1521 | 9.50 | 158 | 9 | 58760.1278 | 10.50 | 298 | 9 |
| 58733.1521 | 10.50 | 139 | 15 | 58760.1278 | 11.50 | 293 | 10 |
| 58733.1521 | 11.50 | 178 | 15 | 58760.1535 | 12.50 | 253 | 10 |
| 58737.1719 | 8.50 | 237 | 9 | 58760.1535 | 13.50 | 246 | 9 |
| 58737.1719 | 9.50 | 233 | 8 | 58760.1535 | 14.50 | 257 | 10 |
| 58737.1719 | 10.50 | 239 | 12 | 58760.1535 | 15.50 | 253 | 10 |
| 58737.1719 | 11.50 | 248 | 12 | 58760.1535 | 16.50 | 243 | 11 |
| 58739.1205 | 2.25 | 0 | 30 | 58760.1535 | 17.50 | 266 | 13 |
| 58739.1205 | 2.75 | 154 | 16 | 58770.0915 | 1.02 | 29 | 54 |
| 58739.1205 | 3.25 | 163 | 12 | 58770.0915 | 1.28 | 193 | 35 |
| 58739.1205 | 3.75 | 143 | 12 | 58770.0915 | 1.52 | 188 | 46 |
| 58739.1430 | 8.50 | 146 | 9 | 58770.0915 | 1.78 | 245 | 38 |
| 58739.1430 | 9.50 | 157 | 8 | 58770.1140 | 2.25 | 131 | 19 |
| 58739.1430 | 10.50 | 178 | 9 | 58770.1140 | 2.75 | 141 | 15 |
| 58739.1430 | 11.50 | 212 | 10 | 58770.1140 | 3.25 | 119 | 12 |
| 58739.1684 | 12.50 | 265 | 10 | 58770.1140 | 3.75 | 108 | 12 |
| 58739.1684 | 13.50 | 243 | 9 | 58775.0573 | 8.50 | 161 | 7 |
| 58739.1684 | 14.50 | 280 | 10 | 58775.0573 | 9.50 | 169 | 7 |
| 58739.1684 | 15.50 | 265 | 10 | 58775.0573 | 10.50 | 166 | 7 |
| 58739.1684 | 16.50 | 315 | 11 | 58775.0573 | 11.50 | 129 | 8 |
| 58739.1684 | 17.50 | 306 | 12 | 58775.9458 | 4.50 | 166 | 10 |
| 58739.1927 | 5.00 | 153 | 7 | 58775.9458 | 5.50 | 114 | 9 |
| 58739.1927 | 7.00 | 139 | 6 | 58775.9458 | 6.50 | 147 | 9 |
| 58739.1927 | 4.50 | 142 | 10 | 58775.9458 | 7.50 | 118 | 8 |
| 58739.1927 | 5.50 | 138 | 9 | 58775.9677 | 8.50 | 142 | 8 |
| 58739.1927 | 6.50 | 129 | 9 | 58775.9677 | 9.50 | 121 | 8 |
| 58739.1927 | 7.50 | 144 | 8 | 58775.9677 | 10.50 | 146 | 8 |
| 58745.0569 | 2.75 | 194 | 16 | 58775.9677 | 11.50 | 162 | 9 |
| 58745.0569 | 3.25 | 254 | 12 | 58775.9934 | 12.50 | 143 | 9 |
| 58745.0569 | 3.75 | 429 | 11 | 58775.9934 | 13.50 | 153 | 8 |
| 58745.0792 | 8.50 | 323 | 9 | 58775.9934 | 14.50 | 127 | 8 |
| 58745.0792 | 9.50 | 342 | 9 | 58775.9934 | 15.50 | 149 | 8 |
| 58745.0792 | 10.50 | 366 | 9 | 58775.9934 | 16.50 | 119 | 9 |
| 58745.0792 | 11.50 | 357 | 10 | 58775.9934 | 17.50 | 134 | 10 |
| 58745.1048 | 12.50 | 378 | 9 | 58860.9094 | 9.00 | 41 | 7 |
| 58745.1048 | 13.50 | 405 | 9 | 58860.9094 | 11.00 | 34 | 7 |
| 58745.1048 | 14.50 | 396 | 9 | 58860.9441 | 12.50 | 49 | 8 |
| 58745.1048 | 15.50 | 399 | 9 | 58860.9441 | 13.50 | 40 | 7 |
| 58745.1048 | 16.50 | 419 | 10 | 58860.9441 | 14.50 | 27 | 7 |
| 58745.1048 | 17.50 | 420 | 12 | 58860.9441 | 15.50 | 43 | 8 |
| 58745.1288 | 4.50 | 408 | 9 | 58860.9441 | 16.50 | 34 | 8 |
| 58745.1288 | 5.50 | 379 | 9 | 58860.9441 | 17.50 | 47 | 8 |
| 58745.1288 | 6.50 | 324 | 8 | 58860.9760 | 4.50 | 55 | 19 |
| 58745.1288 | 7.50 | 329 | 8 | 58860.9760 | 5.50 | 88 | 25 |
| 58757.0172 | 1.02 | 96 | 50 | 58860.9760 | 6.50 | 88 | 17 |
| 58757.0172 | 1.28 | 121 | 36 | 58860.9760 | 7.50 | 33 | 19 |
| 58757.0172 | 1.52 | 108 | 49 | 58940.6566 | 9.00 | 23 | 8 |
| 58757.0172 | 1.78 | -19 | 42 | 58940.6997 | 12.77 | 20 | 7 |
| 58757.0397 | 2.25 | 159 | 47 | 58940.6997 | 14.30 | 16 | 6 |
| 58757.0397 | 2.75 | 74 | 19 | 58940.6997 | 15.84 | 20 | 6 |
| 58757.0397 | 3.25 | 92 | 17 | 58940.6997 | 17.38 | 27 | 8 |
| 58757.0397 | 3.75 | 103 | 13 | 59004.5502 | 9.00 | 14 | 2 |
| 58760.1055 | 4.50 | 190 | 10 | 59004.5502 | 11.00 | 10 | 3 |
3 Modeling and Analysis
Before interpreting the emission physically, we first attempt to fit simple empirical models to constrain key features: specifically the explosion time, temporal and spectral slopes, and temporal and spectral breaks.
3.1 Explosion Time and Early Decay
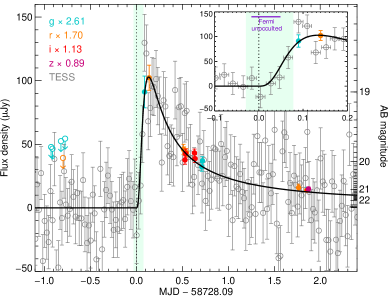
We fit an empirical model to all ground-based optical photometry within 4 days after discovery (plus all TESS data in the range MJD 58727.657–58729.158, or approximately d to +1.0 d after the ZTF discovery observation). We initially assume a simple broken Beuermann et al. (1999) power law with the onset time and peak time being free parameters, although we later extend this to add a second additive power law and a jet break at later times (§3.2). The sharpness parameter was fixed at 0.5, and the power-law index of the rising phase of the afterglow is fixed to (as expected for a relativistically-expanding optically-thin fireball during the pre-deceleration phase). The evolution of the afterglow is assumed to be achromatic but the relative flux in each band is a free parameter.
The resulting best-fit curve is plotted in Figure 5 and in Figure 6. The model indicates a peak close in time to the first ZTF detection and an explosion time hr prior: for our assumed and we obtain an explosion time (MJD) of 58728.0898 0.0289 (2) although this is strongly sensitive to those assumptions, and for a more sudden initial rise the explosion time can be significantly more recent. The TESS measurement centred at MJD 58728.1573 is 2.6 above the background, so we have reasonable confidence that the afterglow began to rise sometime within this exposure (i.e., no later than MJD 58728.168), placing a firm upper limit on the explosion time. A conservative bracketing of the exposure time combining these constraints is shown as the shaded region in Figure 5 (MJD 58728.062–58727.168).
3.2 Late Plateau and Break
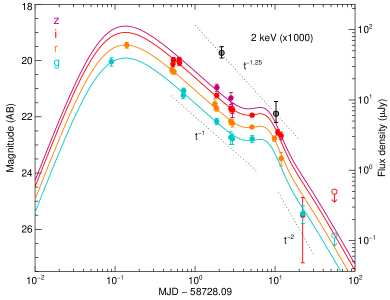
A single-component power-law fit to the light curve over the first five days suggests a post-peak decay index of . However, the decay behaviour is clearly more complicated than this: between about 5 to 10 days the rate of decay briefly becomes much shallower, before then steepening dramatically, and there are no detections of the afterglow beyond 20 days even in deep Keck imaging. To incorporate this behaviour, we added a second broken power-law component to the model as well as a late-time break at 20 days to an assumed final decay index of . While this model is not unique (owing to the sparse nature of the post-plateau follow-up observations, it is not possible to robustly fit all parameters), it provides a good match to all the data.
3.3 Radio Light Curve
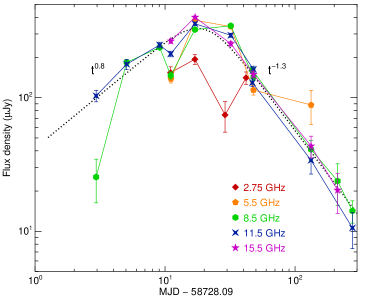
The radio light curve at a few select frequencies is shown in Figure 7. It exhibits a gradual rise ( at high frequencies), peaks at 20 d post-discovery, and then fades (). Significant short-timescale variability is superimposed on top of this slow evolution, especially at the lower frequencies ( GHz) and early times ( days).
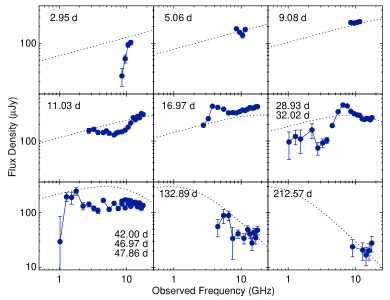
The rapid low-frequency variability results in complex radio spectra. Approximately coeval SEDs are shown in Figure 8. Between 10–30 days the SEDs cannot be well-fit with a power law (or broken power law) owing to modulations in the SED by a factor of –2, producing structure on a frequency scale of . This behaviour is present until at least 30 days, and may persist beyond that (although the more limited frequency coverage and lower S/N makes it difficult to be definitive). The average spectral index () (forcing a power-law fit to each spectrum for which multiple receivers were used, excluding measurements below 3 GHz) is typically about , although it ranges between and +0.6.
This single-peaked behaviour is typical of GRB light curves, as the spectral break associated with the minimum synchrotron energy passes through the radio bands. It is difficult to clearly identify this break in any of the available radio spectra (shown in Figure 8) as a result of what is likely quite strong interstellar scintillation (§5.1.3). However, the well-sampled multiband SEDs at d and d are broadly consistent with the spectrum expected below the synchrotron peak (suggesting GHz at this time), the d spectrum is largely flat (suggesting GHz), and the d spectrum, while having low S/N, shows a negative spectral index (suggesting GHz); this is broadly consistent with the expected passage of through the radio band for a relativistically expanding outflow. However, the strong scintillation and lack of low-frequency coverage during the D/C-configuration cycles do not allow us to robustly model the behaviour in more detail, or to easily discriminate between constant-density or density profiles. There is no obvious counterpart of the “bump” and corresponding sharp dropoff seen in the optical light curve at 10 days, although the peak of the radio light curve occurs only a few days after this.
3.4 Optical SED and Extinction Column
The optical transient is quite red. We extracted the simultaneous SED of the transient using the LT data 1–3 days post-explosion and applied a Galactic extinction correction ( mag; Schlafly & Finkbeiner 2011.) A power-law fit to these data implies an apparent spectral index of (using the convention ). The optical to X-ray spectral index at the same time is significantly shallower (), implying that the optical flux is likely extinguished by moderate host-galaxy dust. The blue portion of the LRIS spectrum also shows slight curvature at approximately the expected location of the redshifted 2175 Å extinction feature commonly seen in local galaxies.
To constrain the extinction column, we assume an intrinsic optical spectral index of (§5.2) and adopt a Fitzpatrick (1999) dust-extinction law with the values of most of the parameters set to their diffuse Milky Way values, with the exception that the strength of the 2175 Å bump is allowed to be a free parameter. We find a good fit to our spectrum for mag and (red curve in Figure 1), implying host extinction of about 1 mag in the observed optical bands.
3.5 Host-Galaxy SED
The late-time filter coverage is (marginally) sufficient to obtain basic constraints on the fundamental properties of the host galaxy using SED fitting. We use codes previously employed by Perley et al. (2014) and population-synthesis templates from Bruzual & Charlot (2003) to fit the data against a model that assumes a single stellar population with a uniform star-formation history and Calzetti et al. (1994) dust attenuation. The data are well fit by a model with a moderate star-formation rate (SFR = yr-1), moderate stellar mass (), and low to moderate dust extinction ( mag). These properties are typical of star-forming galaxies (and of long-GRB hosts) at similar redshifts. A plot of the SED is given in Figure 9.
4 Discussion
4.1 AT 2019pim in Context: Empirical Constraints on a GRB Origin
As the first well-characterised afterglow with deep limits on an associated gamma-ray counterpart, AT 2019pim is of interest primarily as a candidate for a phenomenon related to but separate from “typical” GRBs: a dirty fireball, an off-axis GRB, or a GRB with a smooth outflow free of internal shocks.
Before considering these possibilities, it should be emphasised that even the known GRB phenomenon (as selected by existing high-energy satellites) is extremely diverse: there are numerous examples of “normal” but lower-luminosity GRBs171717We distinguish this population (with erg) from the truly low-luminosity GRBs such as GRB 980425 or GRB 060218 whose inferred energy outputs are orders of magnitude lower ( erg) and which could in principle be a separate population (Liang et al., 2007; Virgili et al., 2009; Bromberg et al., 2011; Nakar, 2015). which are visible in the low-redshift universe yet would not be detectable to Konus, Fermi, or even Swift at higher redshifts (e.g., Singer et al. 2013; Schulze et al. 2014). Thus, as a first step, it is important to establish that AT 2019pim stands out from the well-established GRB and afterglow population in at least some way.
We restrict our comparisons to long-duration GRBs specifically. While short GRBs may also produce afterglows, their optical luminosities are typically much lower, and even among the existing gamma-ray-selected population few or none would be detectable by ZTF at the distance of AT 2019pim (Kann et al., 2011). Certain tidal disruption events also produce relativistic “afterglows” (Bloom et al., 2011; Levan et al., 2011; Zauderer et al., 2011; Burrows et al., 2011; Andreoni et al., 2022), but these have quite distinctive X-ray and radio behaviour different from this event. The association of this event with a star-forming low-mass galaxy (§3.5) further supports this.
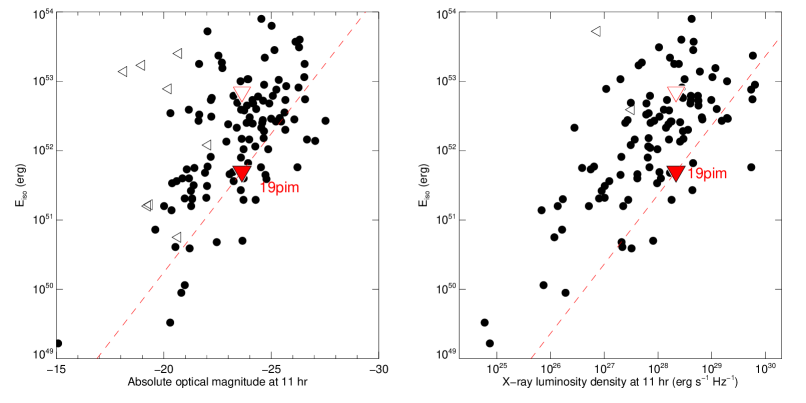
Figure 10 shows the afterglow luminosity at the commonly standardised time of 11 hr post-GRB (observed) versus the prompt emission for a sample of pre-Swift and early-Swift bursts (from Nysewander et al. 2009). Luminosities are calculated assuming a basic -correction factor of . These quantities could be further corrected to standard times and frequencies in the rest frame as , assuming a GRB light curve power-law index of and spectral index of ; for typical afterglows at these frequencies and timescales , these factors helpfully cancel out, and we neglect this correction. Under these assumptions, the left plot can be treated as an -band absolute magnitude at 11 rest-frame hours or equivalently as a 3000 Å absolute magnitude at 5 rest-frame hours; the right plot can be treated as a 1 keV rest-frame luminosity density at 11 rest-frame hours or a 2.2 keV rest-frame luminosity density at 5 rest-frame hours.
The GBM limit on GRB emission from AT 2019pim is shown in solid red. The X-ray flux is extrapolated backward to 11 hr assuming . It is clear that the bulk of known GRBs with comparable afterglow luminosities have prompt emission substantially brighter (by a factor of 10–30) than what the limit allows for AT 2019pim, making this event uncharacteristic of “normal” members of the GRB population. However, the scatter in the relation is significant and a handful of known events do exist with similarly bright (or brighter) afterglows despite prompt emission fainter than what would have been detectable for this event: specifically, 6% of the optical afterglows in this sample and 3% of the X-ray afterglows have a ratio below the equivalent limit for AT 2019pim.
The GBM limit covers the most probable time of explosion but (due to occultations) does not cover the entire allowed explosion time window. The shallower limit from Konus is also shown in Figure 10 as an open triangle. This limit does not rule out most classical GRBs of comparable afterglow luminosity, so we cannot fully rule out a GRB scenario. However, the early light curve would be unusual for a GRB occurring during either of the occulations: a GRB in the first occultation would have an unusually long rise time of almost 3 hours; a GRB in the second occultation would have to exhibit a fast rise time and then a multi-hour plateau with virtually no fading.
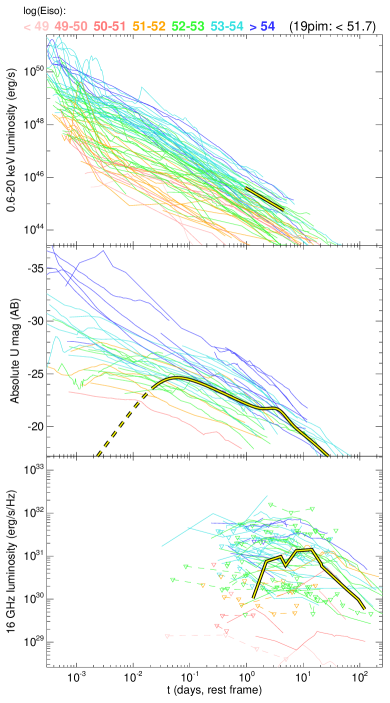
We can also perform comparisons of this type more qualitatively over the entire light curve to compare the general behaviour and time-dependent luminosity to the general afterglow population. Figure 11 shows the X-ray, optical, and radio light curves of this event in comparison to GRBs, colour-coded by . The comparison population is the same as in the equivalent figure of Perley et al. (2014): specifically, events from the sample analyses of Evans et al. (2007), Cenko et al. (2009), Kann et al. (2011), and Chandra & Frail (2012). The luminosity and general decay rate of AT 2019pim are fairly typical at late times, although at every wavelength the luminosity is characteristic only of high- ( erg) events, as expected given Figure 10. Comparing the early phase is more difficult owing to the uncertain explosion time of AT 2019pim, but rise times as slow as 0.5 rest-frame hours are extremely rare, constituting no more than a few percent of known afterglows with early-time follow-up observations. This has also been noted in other early-afterglow samples (Rykoff et al., 2009; Melandri et al., 2014a; Hascoët et al., 2014; Ghirlanda et al., 2018; Page et al., 2019; Jayaraman et al., 2023).
5 Physical Constraints on the Outflow
5.1 Constraints from Basic Physical Arguments
Even in the absence of a complete model to explain the multiwavelength behaviour of the afterglow across all bands, the observations can be used directly to constrain the source size and therefore outflow velocity. Three independent constraints are possible: a lower limit from the emergence (rise) time of the afterglow, a lower limit from the nonthermal spectrum, and an upper limit based on the presence of strong scintillation at late times.
5.1.1 Lower limit from rise time of afterglow
Time-of-flight effects greatly compress the characteristic observed timescales in material moving toward the observer at relativistic speeds, making the early afterglow a particularly sensitive probe of the Lorentz factor.
At fixed energy, the observed time it takes for the GRB ejecta to sweep up sufficient material to begin decelerating the ejecta (thus forming the forward shock) can be estimated via Equation 16 of Mészáros (2006),
Here is the isotropic-equivalent energy of the outflow, is the density of the circumburst interstellar medium (ISM), and is the Lorentz factor of the outflow prior to deceleration onset. The factor of has been added to account for cosmological time dilation.
The emergence of the afterglow is expected to occur on a similar timescale. The TESS observations strongly suggest an afterglow rise time of 1–4 hr (observer frame), so the maximum deceleration time is hr, corresponding to a lower limit on the Lorentz factor of
If the peak of the optical afterglow is due to deceleration, then the 1 hr limit can also set an approximate upper limit of . However, the optical peak can occur substantially later than if the peak frequency is above the optical band at this time. The two cases can be distinguished with colour information, but we do not have a sufficiently precise colour measurement pre-peak. Modeling (§5.2) does indeed suggest that is likely to be close to the optical band at 1–4 hr.
5.1.2 Lower limit from nonthermal spectrum
Compact radio sources exhibit steep radio spectra ( to ) on account of synchrotron self-absorption of radio emission from within the dense, shocked gas. Our first radio observation, at d, may be self-absorbed: it falls below the projected synchrotron spectrum and exhibits a steep downturn toward lower frequencies. As strong scintillation was occurring at this time and only X-band observations are available, it is not possible to confirm this. However, by the time of the first multireceiver observation at d, the radio spectrum is clearly not self-absorbed, indicating it has expanded sufficiently to be optically thin above GHz. Using Equation 5 from Barniol Duran et al. (2013) and assuming GHz, , and a full filling factor, we estimate a minimum average Lorentz factor of (at 10 d).
This is only an average limit out to late times. However, the jet velocity is not constant (it is decelerating): in an ISM the apparent projected size increases as (Galama et al., 2003)181818This holds before the jet break; it is after the jet break. As the difference is small and the jet break is no earlier than 20 days, we simply take the ISM case., or . Extrapolating back to the upper limit on the peak time of the afterglow at hr, we infer .
If the first radio epoch was in fact self-absorbed, the equivalent maximum average Lorentz factor extrapolated to 4 hr is . As this is inconsistent with the more secure estimate from the 11 d spectrum, this suggests the first epoch was probably not self-absorbed. (Indeed, a change from self-absorbed to unabsorbed on these timescales would be inconsistent with an afterglow expanding into a constant-density ISM to begin with, as is constant within the model.)
5.1.3 Upper limit from interstellar scintillation
The radio spectrum shows wiggles in frequency space and short-timescale fluctuations (by a factor of ) until at least 30 days, and probably as late as 130 days. This strongly suggests that the source is small enough in angular size until at least 30 d to be affected by strong interstellar scintillation (ISS) from electrons along the line of sight through our Galaxy. From Figures 1–2 of Walker (2001) (Erratum to Walker 1998), the critical frequency for ISS in this direction is GHz and the Fresnel scale at this frequency is arcsec; the latter corresponds to a physical scale of cm (25 light-days) given the angular diameter distance of the source. Large-amplitude ISS (modulation index 1) near requires a source size comparable to the Fresnel scale, so the implied is (if scintillation quenches after 30 days) .
Extrapolating back our 30 d scintillation limit to the peak of the afterglow as in §5.1.2, we infer light-days at 1 hr and an average Lorentz factor191919We emphasise that this is different from the initial Lorentz factor at the end of deceleration, which cannot be constrained by this method without knowledge of the deceleration time: if the deceleration time is very short, the initial Lorentz factor can still be large even given tight limits on the late-time size. at the optical peak .
This is in tension with our limits from the rise time: even if the rise time was the maximum allowed (4 hr), the afterglow should have been significantly larger in apparent size on all timescales and therefore quenching should have occurred earlier than our observations allow. The rise-time limit is -dependent, although the dependency is weak and this ratio would have to differ by 2–3 orders of magnitude from our assumed fiducial value to relieve this tension (which would be inconsistent with our multiband modeling; §5.2). It could possibly be explained by other effects, such as a variation in the circumstellar density between early and late times, or by the existence of smaller-scale structure in the afterglow image at late times. We note that even for some well-studied, non-orphan GRB afterglows, scintillation effects have been observed to be significantly stronger than simple afterglow/ISS theory predicts (Alexander et al., 2019).
In any case, all three lines of argument suggest that the bulk of the material was moderately but not necessarily highly ultra-relativistic: likely –40.
5.2 Constraints from Afterglow Modeling
Additionally, we modeled the entire afterglow dataset using a numerical code based on the method presented by Lamb et al. (2018). Free parameters in the model include the initial Lorentz factor , jet half-opening angle , viewing angle , as well as the (isotropic-equivalent) kinetic energy , the circumburst density , and the time of explosion (measured relative to MJD 58728.09). This model also permits a variety of jet-structure profiles and allows for the possibility of late-time energy injection (“refreshed” shocks; see Lamb et al., 2020, for details). We fit three types of model: a simple uniform (“top-hat”) jet with no energy injection, a uniform jet with energy injection, and a structured jet without energy injection. In each case we fix the microphysical parameters , , , and (the fraction of energy given to the magnetic fields, the accelerated electrons, the fraction of accelerated electrons that contribute to synchrotron emission, and the power-law index for the relativistic electron distribution, respectively).
Consistent with our analysis using basic physical arguments, most models converge toward Lorentz factors that are lower than typical for GRBs but still relativistic (–50). In the case of a structured jet, higher core Lorentz factors are preferred, but the viewing angle is at the edge of the jet core and the material ejected toward the viewer, consistent with a scenario in which the most relativistic material is beamed outside the line of sight.
To contrast various potential interpretations of the afterglow, we focus on five specific cases below:
- •
- •
-
•
Model B (“low-”): A uniform, on-axis jet with a “low” Lorentz factor (), for which pair production should almost completely suppress high-energy photons.
-
•
Model C (“grazing”): A structured relativistic jet with a “high” Lorentz factor core, but viewed from just outside this core.
-
•
Model D (“refreshed”): A uniform, on-axis, jet with a low to moderate Lorentz factor and late-time energy injection.
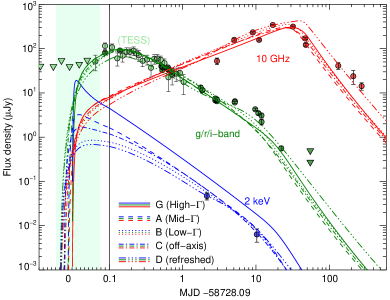
Model parameters in each case were chosen from regions of the posterior distribution of the model runs that indicate reasonably good fits to the data (at least in comparison to other models); values are given in Table 5. In the case of model C, is as seen at a viewing angle , and refers to the jet structure core angle. We assume a Gaussian jet profile where the energy and the Lorentz factor vary with lateral angle as ) = , and for and . In the case of model D, the Lorentz factor of the decelerating blast wave when energy injection begins is given by and the fractional energy increase originating from the refreshed shock is parameterised as .
The model light curves are plotted against the data in Figure 12. The and optical bands have been shifted to match the band, as have the TESS data.
| G | A | B | C | D | ||
| Parameter | high- | mid- | low- | off-axis | refreshed | |
| [] | 100 | 55 | 35 | 130 | 45 [7] | |
| [] | (1053 erg) | 3.5 | 2 | 2 | 6 | 1.6 [6.4] |
| (cm-3) | 0.5 | 2 | 3 | 2.5 | 2.5 | |
| [] | (rad) | 0.22 | 0.22 | 0.22 | 0.09 [0.4] | 0.15 |
| (rad) | 0 | 0 | 0 | 0.13 | 0 | |
| (day) | 0.01 | 0 | -0.02 | -0.01 | -0.02 | |
It can be seen that all of these models reproduce the basic observations (the approximate peak times, decay slopes, and relative fluxes in each band), although none of them fully reproduce the optical flattening or the much steeper evolution in the optical compared to the radio at late times. Model D (“refreshed”) comes closest to reproducing the late-time evolution (this model was introduced for this reason), though it does not fully explain the optical bump feature and it overpredicts the radio data around peak brightness. Model A (mid-) underpredicts both the late-time optical and radio data but better explains the rise timescale. Model G (high-) is similar but also greatly overpredicts the X-rays.
We cannot formally rule out any of the scenarios on the basis of the afterglow alone, both owing to the simplified nature of the models and because we have not yet performed an exhaustive search of the parameter space for each case. However, the modeling establishes that a low- outflow is indeed consistent with most of the key features in the data (rise time, decay rate, and multiwavelength spectrum). On the other hand, while a high- on-axis outflow is not a good match to the data, a classical GRB is fully consistent with the observations if the jet was observed slightly off-axis.
6 Conclusions
Both basic scaling relations and numerical modeling provide strong evidence that the afterglow emission observed from AT 2019pim is the result of moderately relativistic material (–50) emitted in the direction of the observer. Outflows with Lorentz factors this low are unlikely to efficiently produce gamma-radiation, providing a natural explanation for the absence of any detected moderate- or high-luminosity GRB counterpart around the time of the burst. Consistent with this, our estimated Lorentz factor is substantially less than what has been reported for any classical (i.e., non-low-luminosity) GRB (Ghirlanda et al., 2018; Chen et al., 2018; Hascoët et al., 2014), giving a strong indication that the observed population selected purely via optical afterglows has at least some differences from the population selected by gamma-rays.
At the same time, while the Lorentz factor is lower than for the GRB population, it is not dramatically lower, nor does the number of explosions of this nature necessarily imply the existence of a large population of “hidden” afterglows previously missed by gamma-ray selection. Additionally, our data are not able to firmly rule out the presence of an off-axis jet core with higher Lorentz factor which could have produced a classical GRB in some other direction.
Fortunately, AT 2019pim was only the first example of an extremely well-observed optically-selected afterglow of this nature. Since the discovery of AT 2019pim, ZTF has already increased the size of the orphan afterglow sample by an order of magnitude, including the recent detection of an afterglow with even deeper limits on accompanying gamma-ray emission (Ho 2024, in prep.). Particularly notable is the detection of AT 2022cmc, a relativistic transient with a Lorentz factor of only (Andreoni et al. 2022; Pasham et al. 2023; Rhodes et al. 2023, c.f. Yao et al. 2023): while its origin appears to be due to a tidal disruption of a star rather than a collapse, it clearly demonstrates that optical surveys are quite sensitive to energetic transients across the entire range of potential Lorentz factors. While the assemblage of optically selected afterglows remains too small at the present time to draw firm conclusions on the nature of the population, a complete picture of relativistic ejection from massive stars and other phenomena is now within reach.
Continued improvements to afterglow search methods in large surveys and the commissioning or expansion of additional wide-field facilities capable of high-cadence monitoring over large areas (such as GOTO and ATLAS) are facilitating the discovery of more such objects. Even more powerful surveys such as the upcoming Large Array Survey Telescope (Ofek et al., 2023) and proposed Argus Array (Law et al., 2022) will further extend these capabilities over the next few years. Additionally, upcoming powerful radio facilities such as the Next-Generation VLA (ngVLA; Murphy 2018) and Square Kilometre Array (SKA) will enable late-time calorimetry and possibly direct imaging of the jet, permitting distinguishing off-axis from on-axis cases. Future sensitive soft X-ray surveys also represent a promising means of low- afterglow discovery (Amati et al., 2021; Ghirlanda et al., 2021). The next few years should enable broad population studies that will allow us to finally produce a complete picture of energetic, relativistic ejection from collapsing stars.
7 Data Availability
All flux density measurements of the afterglow underlying this article are available in the article and in its online supplementary material. Additionally, the original raw data from LT, Keck, TESS, and VLA are available in public archives hosted by their respective facilities.
8 Acknowledgments
This work was supported by the GROWTH project funded by the U.S. National Science Foundation (NSF) under grant 1545949. GROWTH is a collaborative project between California Institute of Technology, Pomona College, San Diego State University, Los Alamos National Laboratory, University of Maryland College Park, University of Wisconsin Milwaukee (USA), Tokyo Institute of Technology (Japan), National Central University (Taiwan), Indian Institute of Astrophysics (India), Weizmann Institute of Science (Israel), The Oskar Klein Centre at Stockholm University (Sweden), Humboldt University (Germany), and Liverpool John Moores University (UK). This paper used the GROWTH marshal to filter alerts and coordinate follow-up observations.
The discovery, early follow-up observations, and initial analysis of this transient took place during the Aspen Center for Physics (ACP) summer 2019 workshops, “Astrophysics in the LIGO/Virgo Era” and “Non-standard Cosmological Probes”. DAP thanks the ACP for hospitality and support during this period, and acknowledges fruitful discussions with P. Chandra, J. Granot, K. Alexander, and many others on this event. The ACP is supported by NSF grant PHY-1607611. This work was partially supported by a grant from the Simons Foundation.
AYQH was supported by an NSF Graduate Research Fellowship under grant DGE-1144469. GPL is supported by a Royal Society Dorothy Hodgkin Fellowship (grants DHF-R1-221175 and DHF-ERE-221005). S. Anand acknowledges support from NSF GROWTH PIRE grant 1545949. AC acknowledges support from NSF grant AST-2307358. ECK acknowledges support from the G.R.E.A.T research environment, funded by Vetenskapsrådet, the Swedish Research Council, under project 2016-06012. RH acknowledges funding from the European Union’s Horizon 2020 research and innovation programme under Marie Skłodowska-Curie grant agreement 945298-ParisRegionFP. AVF’s team at UC Berkeley is grateful for financial support from the Christopher R. Redlich Fund, Tim and Melissa Draper, William Draper, Briggs and Kathleen Wood (TGB is a Draper-Wood Specialist in Astronomy), and many other donors. PGJ has received funding from the European Research Council (ERC) under the European Union’s Horizon 2020 research and innovation programme (Grant agreement No. 101095973).
Based on observations obtained with the Samuel Oschin 48-inch telescope and the 60-inch telescope at the Palomar Observatory as part of the Zwicky Transient Facility project. ZTF is supported by the NSF under grant AST-1440341 and a collaboration including Caltech, IPAC, the Weizmann Institute of Science, the Oskar Klein Center at Stockholm University, the University of Maryland, the University of Washington, Deutsches Elektronen-Synchrotron and Humboldt University, Los Alamos National Laboratories, the TANGO Consortium of Taiwan, the University of Wisconsin at Milwaukee, and Lawrence Berkeley National Laboratories. Operations are conducted by COO, IPAC, and UW.
The Karl G. Jansky Very Large Array is operated by NRAO, for the NSF under cooperative agreement by Associated Universities, Inc. This paper includes data collected by the TESS mission. Funding for the TESS mission is provided by the NASA Explorer Program. This research is based in part on observations made with the Neil Gehrels Swift Observatory.
The Liverpool Telescope is operated on the island of La Palma by Liverpool John Moores University in the Spanish Observatorio del Roque de los Muchachos of the Instituto de Astrofisica de Canarias with financial support from the UK Science and Technology Facilities Council.
Some of the data presented herein were obtained at the W. M. Keck Observatory, which is operated as a scientific partnership among the California Institute of Technology, the University of California, and the National Aeronautics and Space Administration (NASA). The Observatory was made possible by the generous financial support of the W. M. Keck Foundation. The authors wish to recognise and acknowledge the very significant cultural role and reverence that the summit of Maunakea has always had within the indigenous Hawaiian community. We are most fortunate to have the opportunity to conduct observations from this mountain. We thank Weikang Zheng for assistance with obtaining the late-time Keck imaging.
The GROWTH-India telescope (GIT; Kumar et al 2022) is a 70 cm telescope with a 0.7 deg2 field of view set up by the Indian Institute of Astrophysics (IIA) and the Indian Institute of Technology Bombay (IITB) with funding from the Indo-US Science and Technology Forum and the Science and Engineering Research Board, Department of Science and Technology, Government of India. It is located at the Indian Astronomical Observatory (IAO, Hanle). We acknowledge funding by the IITB alumni batch of 1994, which partially supports the operation of the telescope. Telescope technical details are available at https://sites.google.com/view/growthindia/.
The Pan-STARRS1 Surveys (PS1) and the PS1 public science archive have been made possible through contributions by the Institute for Astronomy, the University of Hawaii, the Pan-STARRS Project Office, the Max-Planck Society and its participating institutes, the Max Planck Institute for Astronomy, Heidelberg and the Max Planck Institute for Extraterrestrial Physics, Garching, The Johns Hopkins University, Durham University, the University of Edinburgh, the Queen’s University Belfast, the Harvard-Smithsonian Center for Astrophysics, the Las Cumbres Observatory Global Telescope Network Incorporated, the National Central University of Taiwan, the Space Telescope Science Institute, the National Aeronautics and Space Administration under Grant No. NNX08AR22G issued through the Planetary Science Division of the NASA Science Mission Directorate, NSF grant AST-1238877, the University of Maryland, Eotvos Lorand University (ELTE), the Los Alamos National Laboratory, and the Gordon and Betty Moore Foundation.
References
- Abbott et al. (2018) Abbott B. P., et al., 2018, Living Reviews in Relativity, 21, 3
- Abbott et al. (2021) Abbott R., et al., 2021, Physical Review X, 11, 021053
- Alard (2000) Alard C., 2000, A&AS, 144, 363
- Alard & Lupton (1998) Alard C., Lupton R. H., 1998, ApJ, 503, 325
- Alexander et al. (2019) Alexander K. D., et al., 2019, ApJ, 870, 67
- Amati (2006) Amati L., 2006, MNRAS, 372, 233
- Amati et al. (2007) Amati L., Della Valle M., Frontera F., Malesani D., Guidorzi C., Montanari E., Pian E., 2007, A&A, 463, 913
- Amati et al. (2021) Amati L., et al., 2021, Experimental Astronomy, 52, 183
- Andreoni et al. (2020) Andreoni I., et al., 2020, MNRAS, 491, 5852
- Andreoni et al. (2021) Andreoni I., et al., 2021, ApJ, 918, 63
- Andreoni et al. (2022) Andreoni I., et al., 2022, Nature, 612, 430
- Band (2003) Band D. L., 2003, ApJ, 588, 945
- Barniol Duran et al. (2013) Barniol Duran R., Nakar E., Piran T., 2013, ApJ, 772, 78
- Barraud et al. (2005) Barraud C., Daigne F., Mochkovitch R., Atteia J. L., 2005, A&A, 440, 809
- Barthelmy (2004) Barthelmy S. D., 2004, Burst Alert Telescope (BAT) on the Swift MIDEX mission. pp 175–189, doi:10.1117/12.506779
- Bauer et al. (2017) Bauer F. E., et al., 2017, MNRAS, 467, 4841
- Bellm et al. (2019a) Bellm E. C., et al., 2019a, PASP, 131, 018002
- Bellm et al. (2019b) Bellm E. C., et al., 2019b, PASP, 131, 068003
- Berger et al. (2013) Berger E., et al., 2013, ApJ, 779, 18
- Beuermann et al. (1999) Beuermann K., et al., 1999, A&A, 352, L26
- Bhalerao et al. (2017) Bhalerao V., et al., 2017, ApJ, 845, 152
- Bloom et al. (2011) Bloom J. S., et al., 2011, Science, 333, 203
- Bromberg et al. (2011) Bromberg O., Nakar E., Piran T., 2011, ApJ, 739, L55
- Bruzual & Charlot (2003) Bruzual G., Charlot S., 2003, MNRAS, 344, 1000
- Burrows et al. (2005) Burrows D. N., et al., 2005, Space Sci. Rev., 120, 165
- Burrows et al. (2011) Burrows D. N., et al., 2011, Nature, 476, 421
- Calzetti et al. (1994) Calzetti D., Kinney A. L., Storchi-Bergmann T., 1994, ApJ, 429, 582
- Cano (2014) Cano Z., 2014, ApJ, 794, 121
- Cano et al. (2017) Cano Z., Wang S.-Q., Dai Z.-G., Wu X.-F., 2017, Advances in Astronomy, 2017, 8929054
- Cenko et al. (2009) Cenko S. B., et al., 2009, ApJ, 693, 1484
- Cenko et al. (2010) Cenko S. B., et al., 2010, ApJ, 711, 641
- Cenko et al. (2011) Cenko S. B., et al., 2011, ApJ, 732, 29
- Cenko et al. (2013) Cenko S. B., et al., 2013, ApJ, 769, 130
- Cenko et al. (2015) Cenko S. B., et al., 2015, ApJ, 803, L24
- Chandra & Frail (2012) Chandra P., Frail D. A., 2012, ApJ, 746, 156
- Chen et al. (2018) Chen Y., Liu R.-Y., Wang X.-Y., 2018, MNRAS, 478, 749
- Corsi et al. (2017) Corsi A., et al., 2017, ApJ, 847, 54
- Dekany et al. (2020) Dekany R., et al., 2020, PASP, 132, 038001
- Della Valle et al. (2006) Della Valle M., et al., 2006, Nature, 444, 1050
- Dermer et al. (2000) Dermer C. D., Chiang J., Mitman K. E., 2000, ApJ, 537, 785
- Evans et al. (2007) Evans P. A., et al., 2007, A&A, 469, 379
- Evans et al. (2009) Evans P. A., et al., 2009, MNRAS, 397, 1177
- Fausnaugh et al. (2023) Fausnaugh M. M., et al., 2023, ApJ, 956, 108
- Fitzpatrick (1999) Fitzpatrick E. L., 1999, PASP, 111, 63
- Fremling (2019) Fremling C., 2019, Transient Name Server Discovery Report, 2019-1722
- Fynbo et al. (2006) Fynbo J. P. U., et al., 2006, Nature, 444, 1047
- Gal-Yam et al. (2006) Gal-Yam A., et al., 2006, Nature, 444, 1053
- Galama et al. (2003) Galama T. J., Frail D. A., Sari R., Berger E., Taylor G. B., Kulkarni S. R., 2003, ApJ, 585, 899
- Gehrels & Mészáros (2012) Gehrels N., Mészáros P., 2012, Science, 337, 932
- Gehrels et al. (2004) Gehrels N., et al., 2004, ApJ, 611, 1005
- Gehrels et al. (2006) Gehrels N., et al., 2006, Nature, 444, 1044
- Ghirlanda et al. (2018) Ghirlanda G., et al., 2018, A&A, 609, A112
- Ghirlanda et al. (2021) Ghirlanda G., et al., 2021, Experimental Astronomy, 52, 277
- Goldstein et al. (2016) Goldstein A., Connaughton V., Briggs M. S., Burns E., 2016, ApJ, 818, 18
- Graham et al. (2019) Graham M. J., et al., 2019, PASP, 131, 078001
- Granot & Kumar (2003) Granot J., Kumar P., 2003, ApJ, 591, 1086
- Granot et al. (2002) Granot J., Panaitescu A., Kumar P., Woosley S. E., 2002, ApJ, 570, L61
- Greiner et al. (2015) Greiner J., et al., 2015, Nature, 523, 189
- Gruber et al. (2014) Gruber D., et al., 2014, ApJS, 211, 12
- Hascoët et al. (2014) Hascoët R., Beloborodov A. M., Daigne F., Mochkovitch R., 2014, ApJ, 782, 5
- Hjorth & Bloom (2012) Hjorth J., Bloom J. S., 2012, The Gamma-Ray Burst - Supernova Connection. pp 169–190
- Ho (2024) Ho Anna Y. Q. e. a., 2024, AT2023lcr
- Ho et al. (2018) Ho A. Y. Q., et al., 2018, ApJ, 854, L13
- Ho et al. (2019) Ho A. Y. Q., Cenko S. B., Perley D. A., GROWTH Collaboration 2019, GRB Coordinates Network, 25658, 1
- Ho et al. (2020) Ho A. Y. Q., et al., 2020, ApJ, 905, 98
- Ho et al. (2022) Ho A. Y. Q., et al., 2022, ApJ, 938, 85
- Huang et al. (2002) Huang Y. F., Dai Z. G., Lu T., 2002, MNRAS, 332, 735
- Jayaraman et al. (2023) Jayaraman R., Fausnaugh M., Ricker G. R., Vanderspek R., 2023, arXiv e-prints, p. arXiv:2308.05148
- Jin et al. (2015) Jin Z.-P., Li X., Cano Z., Covino S., Fan Y.-Z., Wei D.-M., 2015, ApJ, 811, L22
- Kann et al. (2011) Kann D. A., et al., 2011, ApJ, 734, 96
- Kasliwal et al. (2019) Kasliwal M. M., et al., 2019, PASP, 131, 038003
- Kool et al. (2019) Kool E., et al., 2019, GRB Coordinates Network, Circular Service, No. 25616, 25616
- Kouveliotou et al. (1993) Kouveliotou C., Meegan C. A., Fishman G. J., Bhat N. P., Briggs M. S., Koshut T. M., Paciesas W. S., Pendleton G. N., 1993, ApJ, 413, L101
- Kulkarni & Rau (2006) Kulkarni S. R., Rau A., 2006, ApJ, 644, L63
- Kulkarni et al. (1998) Kulkarni S. R., et al., 1998, Nature, 395, 663
- Kumar et al. (2022) Kumar H., et al., 2022, AJ, 164, 90
- LIGO Scientific Collaboration and Virgo Collaboration (2019) LIGO Scientific Collaboration and Virgo Collaboration 2019, GRB Coordinates Network, Circular Service, No. 25606, 25606
- Lamb & Kobayashi (2016) Lamb G. P., Kobayashi S., 2016, ApJ, 829, 112
- Lamb et al. (2018) Lamb G. P., Mandel I., Resmi L., 2018, MNRAS, 481, 2581
- Lamb et al. (2020) Lamb G. P., Levan A. J., Tanvir N. R., 2020, ApJ, 899, 105
- Law et al. (2018) Law C. J., Gaensler B. M., Metzger B. D., Ofek E. O., Sironi L., 2018, ApJ, 866, L22
- Law et al. (2022) Law N. M., et al., 2022, PASP, 134, 035003
- Levan et al. (2011) Levan A. J., et al., 2011, Science, 333, 199
- Levan et al. (2014) Levan A. J., et al., 2014, ApJ, 781, 13
- Levan et al. (2023) Levan A., et al., 2023, arXiv e-prints, p. arXiv:2307.02098
- Liang et al. (2007) Liang E., Zhang B., Virgili F., Dai Z. G., 2007, ApJ, 662, 1111
- Lipunov et al. (2022) Lipunov V. M., et al., 2022, Astronomy Letters, 48, 623
- Margutti et al. (2014) Margutti R., et al., 2014, ApJ, 797, 107
- Masci et al. (2019) Masci F. J., et al., 2019, PASP, 131, 018003
- Matsumoto et al. (2019) Matsumoto T., Nakar E., Piran T., 2019, MNRAS, 486, 1563
- Meegan et al. (2009) Meegan C., et al., 2009, ApJ, 702, 791
- Melandri et al. (2014a) Melandri A., et al., 2014a, A&A, 565, A72
- Melandri et al. (2014b) Melandri A., et al., 2014b, A&A, 567, A29
- Melandri et al. (2019) Melandri A., et al., 2019, A&A, 621, A81
- Mészáros (2006) Mészáros P., 2006, Reports on Progress in Physics, 69, 2259
- Mészáros et al. (1998) Mészáros P., Rees M. J., Wijers R. A. M. J., 1998, ApJ, 499, 301
- Murphy (2018) Murphy E. J., 2018, in Tarchi A., Reid M. J., Castangia P., eds, Vol. 336, Astrophysical Masers: Unlocking the Mysteries of the Universe. pp 426–432 (arXiv:1711.09921)
- Murphy et al. (2011) Murphy E. J., et al., 2011, ApJ, 737, 67
- Nakar (2015) Nakar E., 2015, ApJ, 807, 172
- Nakar et al. (2002) Nakar E., Piran T., Granot J., 2002, ApJ, 579, 699
- Narayana Bhat et al. (2016) Narayana Bhat P., et al., 2016, ApJS, 223, 28
- Nysewander et al. (2009) Nysewander M., Fruchter A. S., Pe’er A., 2009, ApJ, 701, 824
- Ofek et al. (2007) Ofek E. O., et al., 2007, ApJ, 662, 1129
- Ofek et al. (2023) Ofek E. O., et al., 2023, PASP, 135, 065001
- Oke & Gunn (1983) Oke J. B., Gunn J. E., 1983, ApJ, 266, 713
- Oke et al. (1995) Oke J. B., et al., 1995, PASP, 107, 375
- Paciesas et al. (1999) Paciesas W. S., et al., 1999, ApJS, 122, 465
- Page et al. (2019) Page M. J., et al., 2019, MNRAS, 488, 2855
- Pasham et al. (2023) Pasham D. R., et al., 2023, Nature Astronomy, 7, 88
- Perley (2019) Perley D. A., 2019, PASP, 131, 084503
- Perley et al. (2011) Perley R. A., Chandler C. J., Butler B. J., Wrobel J. M., 2011, ApJ, 739, L1
- Perley et al. (2014) Perley D. A., et al., 2014, ApJ, 781, 37
- Perna & Loeb (1998) Perna R., Loeb A., 1998, ApJ, 509, L85
- Piran (2004) Piran T., 2004, Reviews of Modern Physics, 76, 1143
- Rastinejad et al. (2022) Rastinejad J. C., et al., 2022, Nature, 612, 223
- Rau et al. (2008) Rau A., Ofek E. O., Kulkarni S. R., Madore B. F., Pevunova O., Ajello M., 2008, ApJ, 682, 1205
- Rees & Meszaros (1994) Rees M. J., Meszaros P., 1994, ApJ, 430, L93
- Rhoads (1997) Rhoads J. E., 1997, ApJ, 487, L1
- Rhoads (2003) Rhoads J. E., 2003, ApJ, 591, 1097
- Rhodes et al. (2023) Rhodes L., et al., 2023, MNRAS, 521, 389
- Ricker et al. (2015) Ricker G. R., et al., 2015, Journal of Astronomical Telescopes, Instruments, and Systems, 1, 014003
- Rossi et al. (2002) Rossi E., Lazzati D., Rees M. J., 2002, MNRAS, 332, 945
- Rykoff et al. (2009) Rykoff E. S., et al., 2009, ApJ, 702, 489
- Sarin et al. (2022) Sarin N., Hamburg R., Burns E., Ashton G., Lasky P. D., Lamb G. P., 2022, MNRAS, 512, 1391
- Schlafly & Finkbeiner (2011) Schlafly E. F., Finkbeiner D. P., 2011, ApJ, 737, 103
- Schulze et al. (2014) Schulze S., et al., 2014, A&A, 566, A102
- Singer et al. (2013) Singer L. P., et al., 2013, ApJ, 776, L34
- Soderberg et al. (2004) Soderberg A. M., et al., 2004, Nature, 430, 648
- Soderberg et al. (2010) Soderberg A. M., et al., 2010, Nature, 463, 513
- Stalder et al. (2017) Stalder B., et al., 2017, ApJ, 850, 149
- Troja et al. (2022) Troja E., et al., 2022, Nature, 612, 228
- Virgili et al. (2009) Virgili F. J., Liang E.-W., Zhang B., 2009, MNRAS, 392, 91
- Walker (1998) Walker M. A., 1998, MNRAS, 294, 307
- Walker (2001) Walker M. A., 2001, MNRAS, 321, 176
- Willingale et al. (2013) Willingale R., Starling R. L. C., Beardmore A. P., Tanvir N. R., O’Brien P. T., 2013, MNRAS, 431, 394
- Woosley & Bloom (2006) Woosley S. E., Bloom J. S., 2006, ARA&A, 44, 507
- Xu et al. (2023) Xu F., Huang Y.-F., Geng J.-J., 2023, arXiv e-prints, p. arXiv:2304.09051
- Yang et al. (2022) Yang J., et al., 2022, Nature, 612, 232
- Yao et al. (2023) Yao Y., Lu W., Harrison F., Kulkarni S. R., Gezari S., Guolo M., Cenko S. B., Ho A. Y. Q., 2023, arXiv e-prints, p. arXiv:2308.09834
- Zauderer et al. (2011) Zauderer B. A., et al., 2011, Nature, 476, 425
- Zhang et al. (2007) Zhang B., Zhang B.-B., Liang E.-W., Gehrels N., Burrows D. N., Mészáros P., 2007, ApJ, 655, L25
- Zitouni et al. (2008) Zitouni H., Daigne F., Mochkovich R., Zerguini T. H., 2008, MNRAS, 386, 1597
- van Paradijs et al. (2000) van Paradijs J., Kouveliotou C., Wijers R. A. M. J., 2000, ARA&A, 38, 379
- van Roestel et al. (2019) van Roestel J., et al., 2019, Research Notes of the American Astronomical Society, 3, 136
- von Kienlin et al. (2014) von Kienlin A., et al., 2014, ApJS, 211, 13