The Effects of -Process Enrichment in Hydrogen-Rich Supernovae
Abstract
Core-collapse supernovae are candidate sites for the rapid neutron capture process (-process). We explore the effects of enrichment from -process nuclei on the light-curves of hydrogen-rich supernovae (SNe IIP) and assess the detectability of these signatures. We modify the radiation transport code SNEC to include the approximate effects of opacity and radioactive heating from -process elements in the SN ejecta. We present models spanning a range of total -process masses and their assumed radial distribution within the ejecta, finding that is sufficient to induce appreciable differences in their light-curves as compared to ordinary SNe IIP (without any -process elements). The primary photometric signatures of -process enrichment include a shortening of the plateau phase, coinciding with the hydrogen-recombination photosphere retreating to the -process-enriched layers, and a steeper post-plateau decline associated with a reddening of the SN colors. We compare our -process-enriched models to ordinary IIP models and observational data, showing that yields of are potentially detectable across several of the metrics used by transient observers, provided that the -process rich layers are mixed halfway to the ejecta surface. This detectability threshold can roughly be reproduced analytically using a two-zone (“kilonova within a supernova”) picture. Assuming that a small fraction of SNe produce a detectable -process yield , and respecting constraints on the total Galactic production rate, we estimate that SNe need be observed to find one -enriched event, a feat that may become possible with the Vera Rubin Observatory.
1 Introduction
Current and upcoming large-scale optical time-domain surveys are enabling for the first time the collection of extremely large statistical samples of core-collapse supernova (SN) light-curves. At present these include facilities such as the Zwicky Transient Facility (ZTF; Bellm et al. 2019), Asteroid Terrestrial impact Last Alert System (ATLAS; Tonry et al. 2018), Las Cumbres Observatory Global Telescope Network (LCOGT; Brown et al. 2013) the Automatic Search for Supernovae (ASAS-SN; Kochanek et al. 2017), among others. These efforts will soon be joined by the Vera C. Rubin Observatory (amongst others, e.g. Lin et al. 2023) the first wide-field survey on an 8m-class telescope (Ivezić et al. 2019; hereafter Rubin), conducting the Legacy Survey of Space and Time (LSST). Rubin will monitor almost half of the extragalactic sky (roughly 18000 square degrees) over ten years in the filters (modeled after the SDSS system), during which it is expected to observe to the order of millions of Type II (hydrogen-rich) SNe (LSST Science Collaboration et al., 2009). The resulting light-curve sample will enable detailed studies of the distribution of explosion properties (e.g., Goldberg & Bildsten 2020; Barker et al. 2023), and how they map onto progenitor star (e.g., Podsiadlowski et al. 1992; Crowther 2007; Smartt 2009; Zapartas et al. 2017; Renzo et al. 2019; Strotjohann et al. 2023) and host galaxy properties (e.g., Foley & Mandel 2013; Baldeschi et al. 2020; Gagliano et al. 2023). However, in addition to the expected abundance of “garden variety” SNe, such large samples will inevitably reveal anomalous events (e.g., Villar et al. 2021) that offer potential insights into rare but important event classes.
The origin of the rapid neutron-capture process (-process) elements is a long-standing mystery (e.g., Horowitz et al. 2019; Thielemann et al. 2020; Cowan et al. 2021), particularly the astrophysical site or sites which produce the heaviest elements up to the third -process peak around atomic mass number . Core-collapse SNe have long been considered a promising -process source (e.g., Meyer et al. 1992; Woosley et al. 1994; Burrows et al. 1995), motivated in part by observations of metal-poor stars in the Galactic halo or nearby galaxies which imply an -process site with relatively prompt enrichment after star formation (e.g., Ji et al. 2016; Côté et al. 2019; Simon et al. 2023). However, the standard neutrino-driven proto-neutron star (PNS) wind believed to accompany many if not all core-collapse SNe, likely fails to produce heavy -process elements (e.g., Qian & Woosley 1996; Otsuki et al. 2000; Thompson et al. 2001; Wang & Burrows 2023). This has prompted variations of the standard neutrino-wind models, such as convection-driven wave heating (e.g., Metzger et al. 2007; Nevins & Roberts 2023), strong magnetic fields (e.g., Thompson 2003; Thompson et al. 2004; Metzger et al. 2007; Winteler et al. 2012; Mösta et al. 2014; Vlasov et al. 2017; Thompson & ud-Doula 2018; Prasanna et al. 2022; Desai et al. 2023) and/or rapid rotation (e.g., Desai et al. 2022; Prasanna et al. 2023). In the (likely rare) case that the core of the progenitor is rapidly spinning at the time of the collapse (e.g. Ma & Fuller 2019), the latter can lead to an accretion torus forming around the central compact object (e.g., MacFadyen & Woosley 1999; however, see Quataert et al. 2019; Burrows et al. 2023, who find disk formation from the collapse of a progenitor even without initial rotation). Such accretion disk outflows may be sufficiently neutron-rich to create -process elements in even larger quantities than possible from the earlier explosion or PNS wind phase (e.g., Siegel et al. 2019; Miller et al. 2020; Just et al. 2022).
A key property of heavy -process elements is the high UV/optical wavelength opacity provided by bound-bound transitions of lanthanide/actinide elements with partially-filled valence electron shells (e.g., Kasen et al. 2013; Tanaka & Hotokezaka 2013). This implies that any portion of the SN ejecta which contains a moderate fraction of these elements will trap radiation more effectively, giving rise to redder emission than an otherwise equivalent -process-free explosion. Such near-infrared emission is a key diagnostic of heavy element synthesis in the “kilonovae” which accompany neutron star mergers (e.g., Metzger et al. 2010; Barnes & Kasen 2013; Tanaka et al. 2017).
Signatures of the -process in kilonovae are conspicuous because neutron star merger ejecta is composed almost exclusively of -process elements. In contrast, most -process production in a SN explosion will be seeded from the innermost layers and hence expected to be embedded within the bulk of the “ordinary” (i.e., non -process-enriched) ejecta originating from the outer layers of the exploding star. Nevertheless, fast-moving -process material as generated in the SN explosion, the neutrino-heated wind, or an accretion disk outflow, can in principle be mixed outwards through the ejecta via hydrodynamic processes (e.g., Wongwathanarat et al. 2015; Barnes & Duffell 2023; Wang & Burrows 2023), thereby allowing pronounced effects on the SN light-curve even at relatively early times as the SN photosphere retreats through -enriched outer layers.
Barnes & Metzger (2022) developed a semi-analytic one-dimensional model for the effects of -process enrichment on the light-curves of stripped-envelope SNe, in which the total mass of -process elements and their degree of radial mixing through the ejecta are treated as free parameters. They found that the effect of -process pollution is to induce reddening in the SN light-curves which becomes more prominent with time, as the photosphere retreats inwards towards the -enriched layers. Motivated by this work, efforts to quantify the presence of -process in stripped-envelope SNe via new or archival infrared follow-up observations have recently begun (Anand et al., 2023; Rastinejad et al., 2023). Barnes & Metzger (2023) applied their model to interpret the excess infrared emission observed to accompany the nominally long-duration GRB 211211A (Rastinejad et al., 2022) to explore whether this event was compatible with being an -process-enriched SN, rather than a kilonova from a neutron-star merger.
In this paper we extend these works to consider the impact that -process enrichment would have on Type IIP SNe (SNe IIP) resulting from the explosions of hydrogen-rich massive progenitor stars. Most scenarios for substantial -process production in SNe require the birth of a rapidly rotating black hole or neutron star engine (e.g., Thompson et al. 2004; Metzger et al. 2007; Vlasov et al. 2017; Prasanna et al. 2022, 2023; Desai et al. 2023), an occurrence less frequently associated with the collapse of hydrogen-rich progenitors than stripped-envelope stars (e.g., Kasen & Bildsten 2010; Piran et al. 2017; Metzger et al. 2018; however, see Sukhbold & Thompson 2017; Dessart & Audit 2018). Nevertheless, with SNe IIP being the most common core-collapse explosion in the universe (Smith et al., 2011), the large sample of light-curves to be collected over the next years provides an opportunity to search for outlier events, comprising even a rare subset of the sample. Furthermore, as a result of the qualitatively different opacity structure of hydrogen-rich ejecta (namely, electron scattering regulated by hydrogen recombination), -process enrichment can have a distinct effect on the light-curve shape and colors relative to the hydrogen-poor explosions previously studied in Siegel et al. (2019); Barnes & Metzger (2023). By developing this framework for SNe IIP, we also lay the groundwork to explore a broader range of SN progenitors in future work.
This paper is organized as follows. In Sec. 2 we describe the model for -process-enriched SN light-curves. In Sec. 3 we present our results, starting with an illuminating (albeit extreme) fiducial example and then expanding to a broader parameter study. In Sec. 4 we discuss implications of our results, including practical criteria for observationally distinguishing (necessarily rare) -process-enriched explosions from large samples of SNe, and the resulting constraints one can place on the contributions of H-rich SNe to the Galactic -process budget. We summarize our results and conclude in Sec. 5.
2 Model
We modify the SuperNova Explosion Code111https://stellarcollapse.org/index.php/SNEC.html (SNEC; Morozova et al. 2015) to account for some of the effects of -process element enrichment on the light-curves of SNe IIP from the explosion of red supergiant (RSG) progenitor stars. SNEC solves the equations of Lagrangian radiation hydrodynamics in one radial dimension under the assumption of equilibrium radiation diffusion with gray opacity. It assumes an equation of state containing contributions from radiation, ions, and electrons (Paczynski, 1983) with the ionization state calculated from the Saha equations. As described below in Sec. 2.2, our main modifications to SNEC include changes to the opacity prescriptions and radioactive heating rate in accordance with what is expected from -process enrichment, parameterized by the total mass of -nuclei, , and their radial mixing fraction in the SN ejecta, .
2.1 Unenriched Explosion Models
We consider as a fiducial case the explosion of an (unstripped) nonrotating solar-metallicty () RSG of initial (zero age main sequence) mass , with a pre-SN mass and radius of and , respectively. The progenitor model accounts for wind mass-loss (de Jager et al. 1988, Vink et al. 2001), exponential overshooting, and a 21-isotope nuclear reaction network. It was calculated using the stellar evolution code MESA (Paxton et al., 2011, 2013, 2015) and introduced in Renzo (2015); it corresponds to the unstripped model of Morozova et al. (2015).222The MESA model is included with the SNEC source code. We first consider a fiducial explosion energy of erg. The total mass of the unbound ejecta is where is the excised core corresponding to the assumed PNS mass. The explosion is modeled by injecting a large thermal energy approximately equal to across the inner above the PNS mass cut, where is the binding energy of the progenitor at the onset of core collapse. The total mass of radioactive 56Ni generated during the explosion, , is another free parameter; we assume in our fiducial model, typical of SNe IIP (Müller et al., 2017). The 56Ni is assumed to be mixed uniformly from the PNS boundary out to a specified mass coordinate, fiducially taken to be (we later apply compositional smoothing to this profile, following the approach of Morozova et al. 2015 as described below), roughly corresponding to the carbon-oxygen core of the progenitor where we would expect most of the explosive 56Ni nucleosynthesis to occur. SNEC implements artificial boxcar averaging (or “smoothing”) of element compositional profiles to simulate radial mixing from hydrodynamic instabilities arising during shock propagation. We emphasize that SNEC does not include a smoothing mechanism for the density profile (therefore the density profile is inconsistent with the post-boxcar compositions, as seen in Fig. 2), however, the choice of the minimum opacity profile discussed in the following section attempts to compensate for this.
2.2 Modified Models Including -Process Enrichment
In this study, we do not conduct the detailed multidimensional modeling required to capture the complex physical processes which give rise to neutron-rich ejecta during or following the explosion. Due to the ad-hoc nature of compositional mixing in SNEC, which occurs before the shock passes through the star, and in order to explore the dependence of lightcurve properties on the extent of the mixing, we assume the existence of an (early, unmodeled) process that creates -process material near the core of the explosion and radially mixes it into the ejecta in a parameterized way, detailed further below. We modify the continuum opacity and radioactive heating rates in SNEC according to this assumed radial distribution of -process nuclei. The SN light-curve is most sensitive to changes in the opacity. By contrast, energy deposited from the radioactive decay of -nuclei has only a minor effect on both the ejecta dynamics and the light-curve, as it is typically small compared to the ejecta kinetic energy and energy deposited from 56Ni decay (as shown in Appendix A).
In addition to the temperature and density-dependent opacity contributions corresponding to known continuum absorption processes (e.g., bound-free and electron scattering; Iglesias & Rogers 1996, Ferguson et al. 2005), SNEC implements a minimum opacity “floor” proportional to the ejecta metallicity in a given mass shell (Bersten et al., 2011; Morozova et al., 2015). In the outer hydrogen-rich layers of the ejecta, the floor opacity converges to a default “envelope” value roughly corresponding to the metal line opacity of solar-composition material. For mass coordinates approaching the innermost ejecta near the core boundary, the default floor opacity is higher, taken to be corresponding to the higher metallicity of these layers. Although both of these opacity values may be higher than those expected physically for ordinary SN composition material, they are chosen for SNEC to produce SN IIP light-curve shapes in agreement with light-curves from multi-group calculations (Bersten et al., 2011; Bersten, 2013) and observations (e.g., Morozova et al., 2015). In the context of considering even higher opacities arising from -process elements, this relatively high floor opacity for our unenriched models is conservative in that it tends to mitigate the effects of -process enrichment. In Appendix A.1 we also show light-curves calculated for a floor opacity reduced by an order of magnitude, finding that the relatively high opacity floor prescription cited above is required to avoid unphysical light-curve features, in part arising due to the unsmoothed density profile.
To the extent that the pseudo-continuum line opacity of -process elements (e.g., Kasen et al. 2013) can be approximately modeled as a gray opacity roughly independent of temperature (Tanaka et al., 2020), we model their presence in the ejecta by modifying the opacity floor profile in SNEC, according to:
| (1) |
where is the normal opacity floor set by the presence of metals . The opacity contribution at coordinate of -process elements, , is taken to be proportional to the -process mass-fraction, , as follows:
| (2) |
where is the effective gray opacity of pure -process material. We expect a range of values cm2 g-1, depending on the abundance distribution of -nuclei, particularly the mass fraction of lanthanide/actinide elements (e.g., Kasen et al. 2013; Tanaka & Hotokezaka 2013). Hereafter, we take cm2 g-1, corresponding roughly to the expected value for material with a solar -process abundance ratios at a temperature K (e.g., Tanaka et al. 2020).
Lacking a first principles model for the radial distribution of -process elements within the ejecta, we adopt a somewhat ad hoc mass-fraction profile:
| (3) |
Here, is the characteristic mass coordinate out to which -nuclei are homogeneously mixed (e.g., during the SN explosion itself or due to delayed outflows from the central compact objectmagnetar or accreting black hole) and is a dimensionless parameter proportional to the radial width of the transition between -process-enriched and unenriched layers. We take , in order to give a relatively sharp transition from -enriched layers at to -process-free layers at (see Barnes & Duffell 2023 for motivation), though our results are not overly sensitive to this precise value, as long as the transition remains sharp (as shown in Appendix . Rather than , it will often be more convenient to quote the ejecta radial mixing fraction,
| (4) |
which we take as a free parameter. Small represents -process that remains confined to the center of the star and larger approaching unity represent mixing that extends all the way to the ejecta surface.
The normalization constant entering Eq. (3) is set by the total mass of -process nuclei, which is also treated as a free parameter. The expected -process yields of the explosion can vary considerably, depending on the nature of the central engine responsible for generating neutron-rich -process material. For example, the neutrino-driven winds that accompany PNS birth in most core-collapse SNe yield (e.g., Qian & Woosley 1996) while the prodigious collapsar-like accretion disk outflows can conceivably reach or even higher for very massive stars (e.g., Siegel et al. 2019, 2022).
The second effect of -process enrichment is on the radioactive heating rate within the SN ejecta. In addition to the usual heating from the 56Ni CoFe decay chain already implemented in SNEC, we add a specific radioactive heating rate for -process nuclei of the form (Metzger et al., 2010)
| (5) |
where is time measured since the explosion. The chosen normalization of the heating rate is on the high end of the -decay heating rate for solar-like -process distribution (e.g., Wanajo 2018) and we neglect corrections due to inefficient thermalization of the radioactive decay products (e.g., Barnes et al. 2016). Even under such generous assumptions, we show in Appendix A.2 that the heating effects, even for large -process masses, are generally minor. This follows because the heating rate of the 56Ni CoFe decay chain greatly exceeds the -process heating rate on the weeks to months timescales relevant to SN light-curves (Siegel et al., 2019; Barnes & Metzger, 2022), and because the high opacity of -enriched ejecta efficiently traps the thermalized energy released earlier from -process decay, diluting its effects due to adiabatic expansion.
In summary, for a given stellar progenitor, an -process-enriched model is fully specified in our setup by the free parameters , with and fixed at the aforementioned values.
3 Results
3.1 Fiducial Model
We first describe the results for a fiducial, highly -process-enriched model with and , the latter corresponding to a case where -process material is mixed out through the ejecta to a mass-coordinate , located below the ejecta surface but within the hydrogen-rich envelope for the fiducial . Although represents a very large -process yield, this model is instructive for illustrating clearly the effects of -enrichment. Throughout, we compare the model evolution side by side to an otherwise equivalent but “unenriched” -process-free model with , which successfully reproduces the fiducial model of Morozova et al. (2015). Fig. 1 summarizes schematically the physical picture.
Fig. 2 shows the opacity floor (top panel), along with the mass fractions of different elements and density as a function of enclosed mass (bottom panel). We include in the total opacity floor, (Eq. (1)), the separate contributions from the -process elements, , and the floor set by ordinary non -process material, . The former falls off from its uniform value near the core to zero for Due to the high opacity contributed by the -process nuclei, the opacity floor at small radii exceeds that of the unenriched model by a factor . Note, the metallicity Z does not include the additional -process elements, which are included in the opacity calculation via the modified opacity floor and are otherwise treated as a perturbation to the total ejecta mass and metal distribution. Furthermore, the smoothing assumption does not apply to the density, thus the steep transition at .
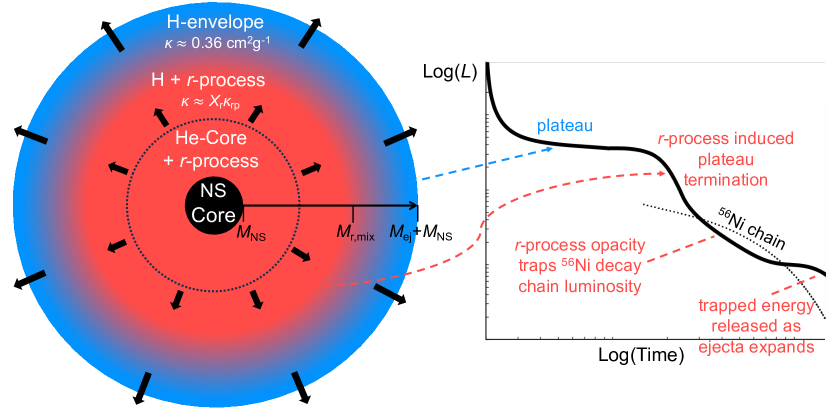
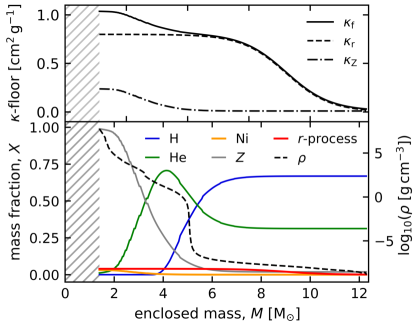
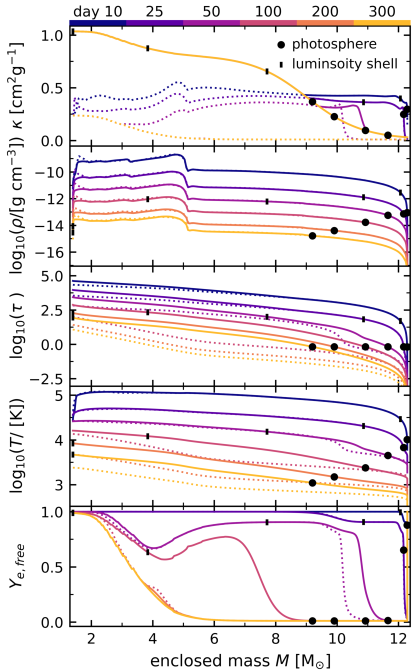
Fig. 3 shows snapshots of the radial profiles of several key ejecta properties at different times ranging from 10 to 300 days after explosion. The early phases of the explosion, when the photosphere is still in the outer -process-free layers, proceed in a similar manner to an ordinary SN IIP from an -process-free explosion (e.g., Grassberg et al. 1971; Falk & Arnett 1977; Litvinova & Nadezhin 1985; Popov 1993). The radial density profile is determined by the progenitor structure and the SN shock that passes through the ejecta within the first 48 hours following the explosion and its subsequent approach to a state of homologous expansion. As the ejecta continues to expand, its temperature at all radii drops monotonically with time due to a combination of adiabatic and radiative losses. As the outer layers reach the recombination temperature, 6000 K, the free electron fraction there decreases from near unity to almost zero, causing an abrupt drop in the opacity from the electron scattering value cmg-1 to the lower floor opacity of the envelope. The location of the photosphere is therefore fixed at the location where 6000 K, which retreats inwards in mass-coordinate with time, driving the characteristic “plateau” phase in SNe IIP. The opacity evolution described above for mass coordinates can be seen in top panel of Fig. 3 over the first two snapshots of the enriched model corresponding to d.
However, by d, the photosphere has retreated sufficiently to reveal zones in which the -process opacity exceeds alternate opacity sources (e.g. electron scattering or unenriched floor). From this time on, the opacity is dominated by the time-independent floor value for all mass coordinates, which for the remaining optically-thick layers now corresponds to the opacity cmg-1 arising primarily from -process elements. This high and (at least within our treatment) temperature-independent opacity thus comes to dominate the ejecta cooling after the first month, altering the emission behavior from that of the unenriched model as we now describe.
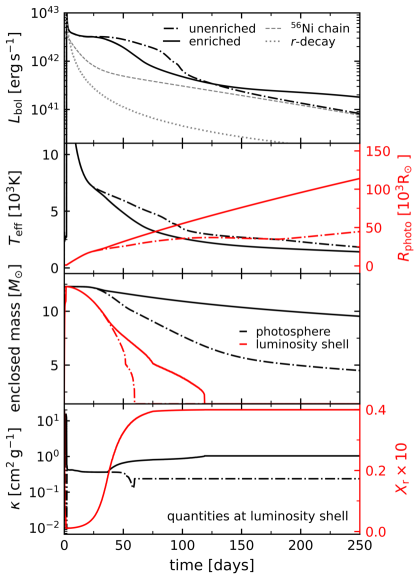
The top two panels of Fig. 4 show the bolometric light-curve and effective temperature, respectively, for the fiducial -process-enriched and unenriched models. In ordinary SNe IIP as illustrated by the unenriched model, the early shock-cooling phase is followed by the characteristic plateau phase of roughly constant luminosity lasting approximately 100 days with a roughly constant effective temperature K as determined by the hydrogen recombination front regulating the photosphere location. After the photosphere has moved completely through the H-envelope and into the He-rich core, the plateau ends and the luminosity drops, until it eventually converges on the energy output from the decay chain.
However, the luminosity and temperature for the enriched model begin to deviate significantly from the unenriched model once the photosphere reaches the -enriched layers around day 30. In particular, the length of the plateau phase, , is shortened for the enriched model by 30 days compared to the unenriched case. The magnitude of this shortening is consistent with when the opacity at the luminosity shell (the location in the ejecta where , beyond which radiation can stream to the observer within a dynamical time; bottom panel of Fig. 4) rises from the electron scattering to -process opacities around day 30 (see also Fig. 3). After the plateau ends, the photosphere location is no longer set by the hydrogen recombination front, despite the fact that not all of the hydrogen has recombined. Instead, after day 30 the photosphere stalls at a higher mass coordinate due to the high -process opacity in what are still (by mass) H-dominated layers, as shown in the third panel of Fig. 4.
The lower effective temperature in the enriched case results from the higher opacity pushing the photosphere radius out into the cooler outer ejecta layers, as can be seen by comparing the second panel of Fig. 4 and the fourth panel of Fig. 3. This larger is not sufficient to compensate for the lower temperature in setting the bolometric luminosity , resulting in the enriched model light-curve decaying faster than the unenriched case. However, at very late times d, the enriched model becomes brighter than the unenriched model; this results from the high -process opacity in the slowly expanding core material, which traps the 56Ni chain radioactive decay and initial thermal energy longer than in the unenriched case to be released at these later times.
In summary, the main effects of significant -process enrichment extending into the hydrogen envelope on the SN properties are: (1) a premature truncation of the light-curve plateau phase once the H-recombination photosphere enters the -process-enriched layers, after which follows (2) a more rapid decline in the luminosity and a lower effective temperature at a fixed time after the explosion leading to a premature reddening of the SN colors; (3) a late luminosity in excess of the 56Ni decay-chain tail resulting from heat trapped by the high opacity of the -enriched core material.
From the above trends, we expect the timescale of plateau shortening to correlate primarily with the mass coordinate of the -process mixing (equivalently, ), while the magnitude of the deviations to follow the plateau will scale with the level of the enrichment , as this controls the opacity enhancement of the inner layers which radiate at late times. These possibilities are explored in Sec. 3.2.
3.2 Parameter Study
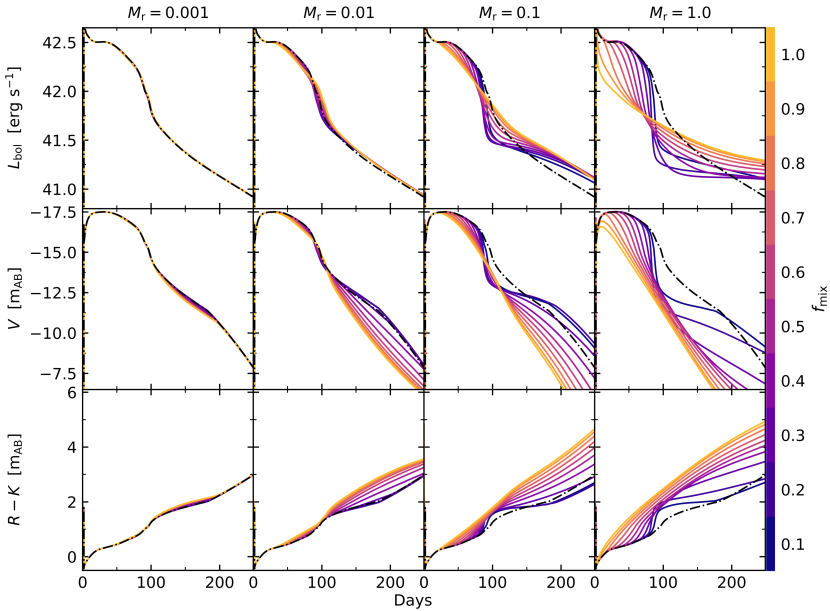
We now explore a broader range of light-curve behavior for models spanning different -process ejecta masses and radial mixing extents . Fig. 5 shows for such a grid of models, the bolometric and V-band light-curves, as well as the color evolution (motivated by Barnes & Metzger 2022, who found was a sensitive diagnostic for enrichment).
The models with the lowest levels of -process enrichment (e.g., ) show bolometric light-curves virtually indistinguishable from an otherwise identical unenriched model, and the effects in -band and color evolution are also small. This indicates that the prospect of photometric detection for are limited. However, for models with larger , the three major effects of -process enrichment, described in Sec. 3.1, become apparent.
The degree of plateau shortening increases as -process material mixes further out in the ejecta (larger ) due to the high-opacity regions being exposed earlier, evident in the bolometric and V-band light-curves of Fig. 5. Moreover, for models with for which plateau shortening is visible, greater -process mass amplifies the effect. For example, although the bolometric plateau duration for the and cases are equal to within a few days for , the difference becomes much more pronounced for ( days for versus a complete absence of a plateau for ).
A second effect of -process enrichment is to reduce the luminosity and effective temperature after the plateau phase. Regarding this declining luminosity phase, there are two general behaviors, depending on . When -process material is concentrated at the center of the ejecta (i.e., for low ), the plateau is followed by an abrupt and steep drop in luminosity; in extreme cases (e.g., with ) the luminosity drops by an order of magnitude or more within days after the plateau ends. Conversely, models with greater (e.g., with ), associated with shorter plateaus, experience a linear or almost-linear decline in both bolometric and V-band luminosity. As an aside, we note that this (probably coincidentally) mimics the behavior of some SNe IIL light-curves, which are normally attributed to the SN progenitor being partially stripped of its H-envelope (e.g. Hiramatsu et al., 2021), and/or reheating of the ejecta by circumstellar interactions (in certain parameter regimes of high explosion energies and/or low 56Ni mass; Morozova et al. 2015; Moriya et al. 2016; Morozova et al. 2017; Fraser 2020; Piro et al. 2021).
These behaviors are physically consistent with expectations given the enriched ejecta structure. When the -process mass is significant () but confined to small mass coordinates (), the recombination driven phase will proceed as normal at early times, until the photosphere recedes sufficiently far in to hit an “opacity wall” of a highly concentrated -process core at , after which the photosphere abruptly stalls, leading to an abrupt drop in luminosity. On the other hand, when a significant quantity of -process material is mixed more uniformly throughout the ejecta (), no such abrupt transition from low to high opacity layers occurs, preventing sudden changes in the light-curve decay. Instead, the escaping luminosity even from early phases is inhibited by the -process opacity effects, resulting in a comparatively steady decline rate.
Models with greater -process enrichment mixed to larger mixing coordinates are in general also significantly redder than models with lower enrichment at a given time, as shown in the bottom row of Fig. 5. Consistent with our explanation for the photosphere evolution in the fiducial model (Sec. 3.1), this trend of redder emission with increasing and is due to a slower photosphere recession rate through the outer ejecta layers, resulting in a lower . Models with extremely low are an exception to this, insofar that their colors become even redder than more homogeneously mixed models around the time of the abrupt steep luminosity drop. This results from the photosphere radius stalling or even reversing direction (in radial coordinate) once reaching the highly-concentrated -process core, leading to a significant drop in the effective temperature.
In summary, considering a wide parameter space of -process enrichment profiles , noticeable differences appear in the light-curves for . The light-curve behavior for models which satisfy this minimal condition are further distinguished based on the radial mixing parameter. Models with low exhibit less plateau shortening, but a steep transition to the nebular phase (defined as when the ejecta becomes optically thin, rendering the innermost layers visible), while models with large exhibit more severe plateau shortening and a corresponding roughly linear light-curve decline. These features, for both low and high degrees of mixing, become more apparent with greater -process mass. Likewise, all models with exhibit noticeable reddening, although the exact color evolution differs based on in a manner consistent with the luminosity behavior. As in the fiducial model, the very late-time luminosity for all sufficiently enriched models is enhanced by -process opacity trapping, the magnitude of the effect scaling with .
4 Applications and Discussion
4.1 Detectability of -Process Enrichment
In the previous section we found that SNe enriched in -process masses exhibit sizable photometric differences relative to otherwise similar unenriched explosions (Fig. 5). We now attempt to more precisely quantify the “detectability” prospects for -process-enriched events by considering several photometric and spectroscopic observables commonly used in the transient community to characterize observed SNe which correlate with varied explosion, progenitor star, and host galaxy properties. We choose five such metrics that we found to be most sensitive to -process enrichment:
- •
-
•
: the bolometric luminosity at day 50.
-
•
: the ejecta velocity at the photosphere location at day 50.
- •
-
•
: The color at day 100.
All possible 2D covariant parameter spaces obtained from these five metrics are shown in Fig. 6. Each space is populated by enriched models spanning parameter values and . These are compared to a large sample of unenriched models, spanning different 56Ni masses , explosion energies , and assumed stellar progenitor models555MESA progenitor models from Morozova et al. (2016) available at https://stellarcollapse.org/Morozova2016.html. See also Renzo (2015). (Morozova et al. 2016) covering a range of pre-explosion masses . When available, we also show for comparison measured values for these metrics obtained from SNe IIP observations collected from the literature. While sufficiently enriched (i.e., high and/or high ) models occupy unique regions in all parameter spaces, we focus below on some cases where this separation between enriched and unenriched models is the cleanest (these parameter spaces are outlined in bold in Fig. 5).
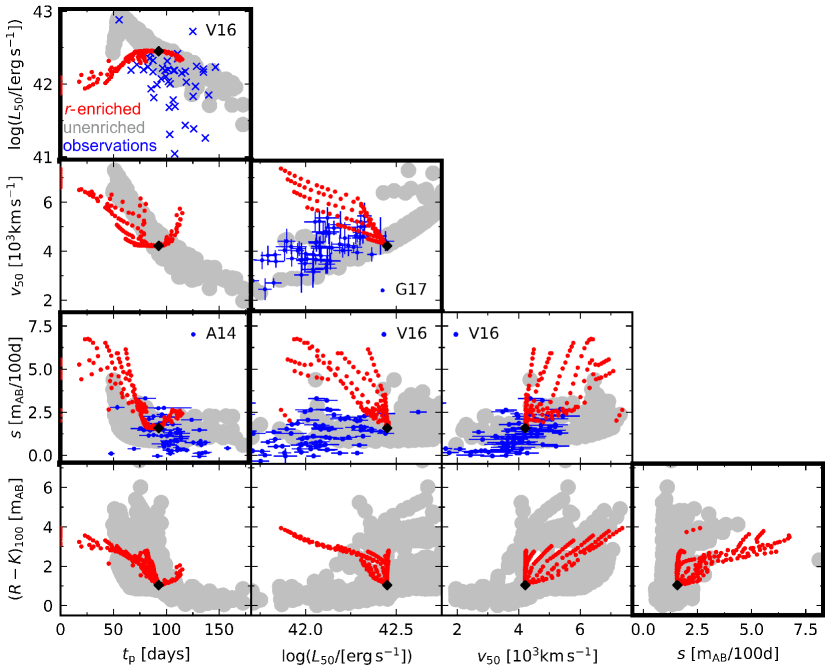
Quantities at day 50 are of interest in ordinary SNe IIP as they typically sample the plateau phase. For instance, and can probe the explosion energy and properties of the progenitor star (Popov 1993, Kasen & Woosley 2009, though see discussions in Dessart & Hillier 2019 and Goldberg et al. 2019 regarding the non-uniqueness of such constraints due to variations in progenitor radius and H-rich envelope mass). In general, weaker explosions are fainter, and, due to slower expansion velocities, exhibit longer plateaus. This anti-correlation between and is revealed in the data and reproduced by our unenriched models. Conversely, larger -process enrichment drives shorter plateaus and reduced effective temperatures, resulting in a dimmer plateau luminosity. For very high levels of enrichment (severely shortened plateaus), it is sometimes the case that the plateau has already terminated by day 50, in which case samples the subsequent post-plateau decay phase, breaking the general trends. Nevertheless, the enriched model sequence follows a distinct track compared to the unenriched models, remaining clearly separated in space.
A second feature of significance is the deviation of -process-enriched SNe from the well-documented SN IIP “standard candle” relationship between the photospheric velocity and luminosity at day 50 (as observed by Hamuy 2003 and explained by Kasen et al. 2009). The photosphere velocity is commonly inferred from the absorption minimum of the Fe II 5169Å line, which corresponds to the ejecta velocity near the photosphere. Since the photosphere location in an unenriched SN IIP is set by the recombination of H at fixed K, unenriched SNe IIP have been shown to follow a relationship (see, e.g., discussions by Kasen et al. 2009; Goldberg et al. 2019). This relation is evident in both the data and unenriched models of Fig. 6.
In contrast, the -process-enriched models exhibit an anticorrelation between and , with higher levels of enrichment pushing these events into a parameter space region unoccupied by any unenenriched models or SN data. This behavior can be attributed to the photosphere’s recession in mass coordinate being stalled due to the high -process opacity as detailed in Sec. 3.1. This keeps the photosphere out at larger radii where the ejecta expansion velocity is greater (homologous expansion) and the temperature is lower. That is, unlike in an unenriched SN IIP, the photosphere location is not set by the location where the ejecta temperature equals the H-recombination temperature, but rather by the changing density of the expanding medium for a given magnitude and location of the large (which is taken here to be temperature- and density-independent). The anti-correlation can thus approximately be understood considering homologous expansion ( for a shell of ejecta moving at velocity ) and the Stephan-Boltzmann equation (up to a dilution factor which is assumed to primarily be a function of , see discussion by Kasen et al. 2009). When is set by K, and time is fixed at days, this leads to the familiar for ordinary SNe. If the photospheric temperature is instead set by the ejecta’s expansion, e.g. (or any power-law dependence steeper than ), then for a fixed time we would instead see an anti-correlation (or a similar inverse relationship) with scatter introduced from varying and . The opposing trends between unenriched and enriched models support vs. as a promising parameter space in which to flag potential -process sources within the first 50 days of SN evolution.
The color evolution was shown to be a sensitive metric for -enrichment in stripped-envelope SNe (Barnes & Metzger 2022) and we show this is also the case for hydrogen-rich explosions (Sec. 3.2). We consider the color value at day 100, as this is typically a sufficient timescale for appreciable differences from the unenriched case to develop. Patat et al. (1994) showed that IIL-like explosions and high energy explosions possess steeper plateaus (larger decline rates, ) along with reduced reddening at day 100. We show that -process-enriched models exhibit a unique correlation in vs. space, where increasing enrichment results in both a steeper decline rate and increased reddening. The extreme decline rates of our highly enriched models place them in a unique region of this parameter space.
Unsurprisingly, these metrics confirm that the detectability prospect of -process-enriched events increases with the level of enrichment. Observations of luminosity and photosphere velocity at around 50 days after explosion may provide the best opportunity to identify candidate events, while respecting preferences for earlier measurements (relative to the timescales of -process enrichment effects) when events are brighter. Follow up observations would then be required to determine the plateau duration, decline rate, and/or color at day 100, which would all aid in further validating or excluding initial candidates. Of course, if a densely sampled light-curve is obtained up to days, it would be possible to directly compare to light-curve models (Sec. 3.2) and estimate the yield of -process material.
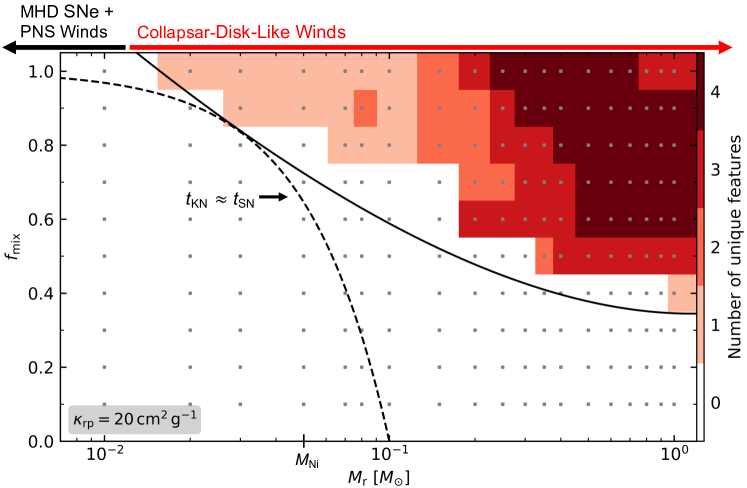
In Fig. 7 we attempt to quantify those regions of parameter space for which -process enrichment produces a significant deviation from an ensemble of unenriched models. Small gray squares represent the -process-enriched models, while the surrounding color denotes the total number of 2D parameter spaces (out of the subset of four spaces bolded in Fig. 6) in which the model deviates significantly from any one of the unenriched models (defined somewhat arbitrarily by the enriched model not overlapping with the grey region). The weight given to each model on the grid (with values ranging from 0 to 4, as in the color bar of Fig. 7) is interpolated to fill the whole grid. As expected, the upper right hand corner, corresponding to large and , hosts the most readily distinguishable models. In the next section we describe an approximate analytic estimate for the boundary of this region.
We conclude by noting that, even for models outside this “detectability” window, other signatures of -process enrichment may still be observable. Spectroscopic line signatures from -process elements may be present during the early photospheric (e.g., Kasen et al. 2013), or late nebular (e.g., Hotokezaka et al. 2021), phases, even when photometric signatures are more subtle. Furthermore, events with extremely large but centrally concentrated -process enrichment (high but low ) could power sustained late-time infrared plateaus (see Sec. 3.2, Siegel et al. 2022) which are not readily apparent from earlier optical light-curve or spectroscopic data.
4.2 Analytic Estimates
The effect of mixing a sufficiently large quantity of -process material666Such that the opacity of the -process material exceeds that of the non--enriched material it mixes with. This approximately requires for . out to a given ejecta mass-coordinate can in effect be thought of as creating a “two-layered” transient: a kilonova (of ejecta mass and opacity ) “inside” a SN (of ejecta mass with ordinary electron scattering opacity); see Fig. 1.
For the SN portion of the transient, the plateau phase duration can be estimated based on standard analytic arguments (Popov, 1993; Sukhbold et al., 2016)
| (6) |
as determined by the timescale for hydrogen recombination to move inwards in mass coordinate through the ejecta and reduce the opacity (neglecting heat input from the 56Ni decay chain), where is the characteristic velocity of the unenriched -process layers. By contrast, during the “kilonova” phase of the transient, the opacity can be taken as roughly constant, with the escaping emission instead peaking when the expansion and photon diffusion timescales become equal (e.g., Arnett 1980; Metzger et al. 2010),
| (7) | |||||
where is the characteristic velocity of the slower inner -process-enriched layers.
The above estimates reveal that, for a sufficiently high -process enrichment (i.e., large ), one can have . In such cases, emission from the “kilonova” core will peak after the end of the plateau, potentially leading to a double-peaked bolometric light-curve (though likely still single-peaked at optical bands, due to the photosphere temperature being lower during the “kilonova” phase than the earlier H-recombination plateau). By contrast, for , the kilonova will already have begun to decay by the end of the plateau, its effect on the subsequent light-curve thus being less pronounced (see also Barnes & Metzger 2022). We show the curve with a dashed line in Fig. 7, where it is seen to roughly coincide with the “detectable” boundary for well-mixed ejecta (). We find that the contour can be approximately represented as , where our calculation makes use of velocities, and at days, obtained from SNEC for the fiducial model.
4.3 Implications for the Sites of the -Process
Our results indicate that only relatively large -process masses mixed to high mass-coordinates in the SN ejecta produce a discernible effect on the light-curve or other observables (Figs. 6, 7). This minimal detectable -process yield exceeds by orders of magnitude those potentially produced in the PNS winds which accompany standard neutrino-driven explosions (e.g., Qian & Woosley 1996), implying that SN light-curve observations are unlikely to test such models. On the other hand, a small fraction of PNS may be born with extreme properties (e.g., rapidly spinning with ultra-strong magnetic fields G), and the more heavily mass-loaded magneto-centrifugally-driven outflows from such objects can in principle produce substantially higher -process yields (e.g., Thompson et al. 2004; Metzger et al. 2007; Winteler et al. 2012; Halevi & Mösta 2018). Thus, if -process material mixes outwards into the hydrogen envelope during such “MHD”-powered explosions, photometric signatures such as those explored here may provide tight constraints for such events. The same is true of collapsar-like events in which accretion disk outflows generate substantial -process material (e.g., Siegel et al. 2019), up to tens of in extreme cases (Siegel et al., 2021). We label the estimated -process yields of these sources schematically on the top axis of Fig. 7.
The source or sources of Galactic -process elements remain a topic of active debate. While several lines of evidence favor the dominant site being one capable of producing a large per-event -process yield (e.g., Wallner et al. 2015; Ji et al. 2016), this also implies that -process-enriched SNe must be exceptionally rare. This holds implications for the number of SNe that need be searched to find one enriched event. To explain the entire mass of -process elements (mass number in the Milky Way via a single formation channel, the product of the per-event -process yield and the event rate must obey, (e.g., Metzger et al. 2008; Hotokezaka et al. 2018)
| (8) |
Using the present-day Galactic SN rate yr-1 (e.g., Rozwadowska et al. 2021) as an estimate for the time-averaged rate, we see that every SN would need only create to explain all of the Galactic -process if every SN synthesized -process. If instead only a rare subset corresponding to a small fraction of core-collapse SNe generate -process elements (e.g., Wallner et al. 2015; Ji et al. 2016), and if such a rare SN channel contributes only a fraction of the total -process (the remainder, e.g., arising from neutron star mergers or other sources), then we can modify Eq. (8) to calculate the required yield from each such rare SNe:
| (9) |
While Figs. 6, 7 show that -process yields , mixed sufficiently close to the ejecta surface (for ), may be sufficient for identification based on the photometry, Eq. (9) show that such high-yields are necessarily extremely rare among the core-collapse population, to avoid surpassing the Galactic -process abundances. This has the practical consequence that at least core-collapse SNe would need to be searched to identify a single -process-enriched event (for ), even assuming such events generate a significant fraction (e.g., ) of the total Galactic -process budget.
The Rubin Observatory is expected to discover core-collapse SNe over its 10 year survey, potentially yielding a sample of up to enriched candidates. Once candidates have been identified, confirmation will likely require spectroscopic follow-up observations to search, e.g. for -process line signatures (Kasen et al., 2013; Pian et al., 2017). Alternatively, the absence of a single -enriched candidate SN in Rubin would imply a constraint on enrichment events with .
5 Conclusions
We have performed an explorative study of the effects of -process enrichment on the light-curves of hydrogen-rich SNe resulting from the core-collapse of single solar-metallicity stars. Using a one-dimensional radiation-hydrodynamics model, we include the effects of the high optical/UV opacity of -process elements (modeled as a constant gray opacity) and their associated radioactive heating rate (Sec. 2), the latter augmenting that of the 56Ni produced in the explosion. The total mass of -process elements, , and its radial distribution within the ejecta (encapsulated mainly in the radial mixing coordinate ), are taken as free parameters. We produce a grid of light-curve models spanning a physically motivated range of and (Fig. 5), and compare our results to a sample of ordinary (i.e., non--process-enriched) SNe IIP models and observational data (Fig. 6).
For an assumed -process opacity cmg-1, we find a lower limit on the -process yield required to produce an an appreciable change to the bolometric and -band light-curves, and the color evolution, relative to an equivalent unenriched model. Although the value of is uncertain theoretically, we note that it enters our model exclusively through the combination where (Eqs. 2, 3). This means that our results for models with varying can be readily translated to scenarios where is larger or smaller than the assumed value.
The key photometric features of -process enrichment include a reduction in length of the characteristic plateau phase, a corresponding steep transition to the nebular phase, and a late time infrared excess resulting in the reddening of the SN colors (Fig. 1, Sec. 3.1). These effects become more pronounced with increasing levels of enrichment. From these signatures, we have identified key metrics that may distinguish -process-enriched events from otherwise ordinary SNe in statistically large samples of SNe observations, such as those expected to be available from upcoming surveys. We find that the luminosity and photosphere velocity at day 50 present the best opportunity to identify enriched events relatively early in their evolution, while measurements of the plateau duration, plateau decline rate, and/or at day 100 can be used to further constrain the viability of initial -process-enriched SN candidates (Sec. 4.1). Densely sampled light-curves of initial candidates may also confirm -process enrichment via comparison to the models presented in this paper.
Based on the considered metrics, we quantify an approximate detectability threshold for -process enrichment (Sec. 4.2). This analysis also suggests that events with may be distinguishable from ordinary SNe IIP of typical progenitor and explosion properties, depending on the ejecta radial mixing fraction. Such detectable -process masses are well above the yields of standard (weakly magnetized) PNS wind models, but may be consistent with rare high-yield events such as MHD-SNe, proto-magnetar winds, or accretion disk outflows in cases of substantial fall-back. Most of these scenarios require high pre-collapse angular momentum in the core of the progenitor star, which in light of efficient angular momentum transport during earlier phases of stellar evolution (e.g., Spruit 1999, 2002; Stello et al. 2016; Eggenberger et al. 2019; Fuller et al. 2019) may require a well-timed merger or tidal interaction with a tight binary companion (e.g., Cantiello et al. 2007; Fuller & Lu 2022), which may preclude the presence of a H-envelope at collapse (however, see Dopita 1988; Chatzopoulos et al. 2020; Wheeler & Chatzopoulos 2023; Burrows et al. 2023).
To improve our study, multi-group radiation-hydrodynamics calculations, which account for more realistic wavelength- and temperature-dependent -process opacities (e.g., within the expansion opacity formalism), would enable more accurate light-curve models. In addition, multidimensional (magneto-)hydrodynamic simulations of the interaction between the -process-enriched wind or jet from the central compact object, and the expanding SN ejecta, could better inform our assumptions about the radial and angular distribution of the -process material within the ejecta (e.g., Barnes & Duffell 2023). Such simulations can be used to constrain the parameter to and other properties of the stellar explosion, and eventually inform the (likely non-spherical) distribution of -process enrichment within the ejecta to motivate multi-dimensional transport simulations.
References
- Anand et al. (2023) Anand, S., Barnes, J., Yang, S., et al. 2023, arXiv e-prints, arXiv:2302.09226, doi: 10.48550/arXiv.2302.09226
- Anderson et al. (2014) Anderson, J. P., González-Gaitán, S., Hamuy, M., et al. 2014, ApJ, 786, 67, doi: 10.1088/0004-637X/786/1/67
- Arnett (1980) Arnett, W. D. 1980, ApJ, 237, 541, doi: 10.1086/157898
- Baldeschi et al. (2020) Baldeschi, A., Miller, A., Stroh, M., Margutti, R., & Coppejans, D. L. 2020, The Astrophysical Journal, 902, 60, doi: 10.3847/1538-4357/abb1c0
- Barker et al. (2023) Barker, B. L., O’Connor, E. P., & Couch, S. M. 2023, ApJ, 944, L2, doi: 10.3847/2041-8213/acb052
- Barnes & Duffell (2023) Barnes, J., & Duffell, P. C. 2023, arXiv e-prints, arXiv:2305.00056, doi: 10.48550/arXiv.2305.00056
- Barnes & Kasen (2013) Barnes, J., & Kasen, D. 2013, ApJ, 775, 18, doi: 10.1088/0004-637X/775/1/18
- Barnes et al. (2016) Barnes, J., Kasen, D., Wu, M.-R., & Martínez-Pinedo, G. 2016, ApJ, 829, 110, doi: 10.3847/0004-637X/829/2/110
- Barnes & Metzger (2022) Barnes, J., & Metzger, B. D. 2022, ApJ, 939, L29, doi: 10.3847/2041-8213/ac9b41
- Barnes & Metzger (2023) Barnes, J., & Metzger, B. D. 2023, The Astrophysical Journal, 947, 55, doi: 10.3847/1538-4357/acc384
- Bellm et al. (2019) Bellm, E. C., Kulkarni, S. R., Graham, M. J., et al. 2019, PASP, 131, 018002, doi: 10.1088/1538-3873/aaecbe
- Bersten (2013) Bersten, M. C. 2013, arXiv e-prints, arXiv:1303.0639, doi: 10.48550/arXiv.1303.0639
- Bersten et al. (2011) Bersten, M. C., Benvenuto, O., & Hamuy, M. 2011, ApJ, 729, 61, doi: 10.1088/0004-637X/729/1/61
- Blinnikov & Bartunov (1993) Blinnikov, S. I., & Bartunov, O. S. 1993, A&A, 273, 106
- Blinnikov et al. (1998) Blinnikov, S. I., Eastman, R., Bartunov, O. S., Popolitov, V. A., & Woosley, S. E. 1998, ApJ, 496, 454, doi: 10.1086/305375
- Brown et al. (2013) Brown, T. M., Baliber, N., Bianco, F. B., et al. 2013, PASP, 125, 1031, doi: 10.1086/673168
- Burrows et al. (1995) Burrows, A., Hayes, J., & Fryxell, B. A. 1995, ApJ, 450, 830, doi: 10.1086/176188
- Burrows et al. (2023) Burrows, A., Vartanyan, D., & Wang, T. 2023, ApJ, 957, 68, doi: 10.3847/1538-4357/acfc1c
- Cantiello et al. (2007) Cantiello, M., Yoon, S. C., Langer, N., & Livio, M. 2007, A&A, 465, L29, doi: 10.1051/0004-6361:20077115
- Chatzopoulos et al. (2020) Chatzopoulos, E., Frank, J., Marcello, D. C., & Clayton, G. C. 2020, The Astrophysical Journal, 896, 50, doi: 10.3847/1538-4357/ab91bb
- Côté et al. (2019) Côté, B., Eichler, M., Arcones, A., et al. 2019, ApJ, 875, 106, doi: 10.3847/1538-4357/ab10db
- Cowan et al. (2021) Cowan, J. J., Sneden, C., Lawler, J. E., et al. 2021, Reviews of Modern Physics, 93, 015002, doi: 10.1103/RevModPhys.93.015002
- Crowther (2007) Crowther, P. A. 2007, ARA&A, 45, 177, doi: 10.1146/annurev.astro.45.051806.110615
- de Jager et al. (1988) de Jager, C., Nieuwenhuijzen, H., & van der Hucht, K. A. 1988, A&AS, 72, 259
- Desai et al. (2022) Desai, D., Siegel, D. M., & Metzger, B. D. 2022, ApJ, 931, 104, doi: 10.3847/1538-4357/ac69da
- Desai et al. (2023) Desai, D. K., Siegel, D. M., & Metzger, B. D. 2023, ApJ, 954, 192, doi: 10.3847/1538-4357/acea83
- Dessart & Audit (2018) Dessart, L., & Audit, E. 2018, A&A, 613, A5, doi: 10.1051/0004-6361/201732229
- Dessart & Hillier (2019) Dessart, L., & Hillier, D. J. 2019, A&A, 625, A9, doi: 10.1051/0004-6361/201834732
- Dopita (1988) Dopita, M. A. 1988, Nature, 331, 506, doi: 10.1038/331506a0
- Duffell (2016) Duffell, P. C. 2016, ApJ, 821, 76, doi: 10.3847/0004-637X/821/2/76
- Eastman et al. (1994) Eastman, R. G., Woosley, S. E., Weaver, T. A., & Pinto, P. A. 1994, ApJ, 430, 300, doi: 10.1086/174404
- Eggenberger et al. (2019) Eggenberger, P., Buldgen, G., & Salmon, S. J. A. J. 2019, A&A, 626, L1, doi: 10.1051/0004-6361/201935509
- Falk & Arnett (1977) Falk, S. W., & Arnett, W. D. 1977, ApJS, 33, 515, doi: 10.1086/190440
- Ferguson et al. (2005) Ferguson, J. W., Alexander, D. R., Allard, F., et al. 2005, ApJ, 623, 585, doi: 10.1086/428642
- Foley & Mandel (2013) Foley, R. J., & Mandel, K. 2013, The Astrophysical Journal, 778, 167, doi: 10.1088/0004-637X/778/2/167
- Fraser (2020) Fraser, M. 2020, Royal Society Open Science, 7, 200467, doi: 10.1098/rsos.200467
- Fuller & Lu (2022) Fuller, J., & Lu, W. 2022, MNRAS, 511, 3951, doi: 10.1093/mnras/stac317
- Fuller et al. (2019) Fuller, J., Piro, A. L., & Jermyn, A. S. 2019, MNRAS, 485, 3661, doi: 10.1093/mnras/stz514
- Gagliano et al. (2023) Gagliano, A., Contardo, G., Foreman-Mackey, D., Malz, A. I., & Aleo, P. D. 2023, ApJ, 954, 6, doi: 10.3847/1538-4357/ace326
- Goldberg & Bildsten (2020) Goldberg, J. A., & Bildsten, L. 2020, ApJ, 895, L45, doi: 10.3847/2041-8213/ab9300
- Goldberg et al. (2019) Goldberg, J. A., Bildsten, L., & Paxton, B. 2019, ApJ, 879, 3, doi: 10.3847/1538-4357/ab22b6
- Grassberg et al. (1971) Grassberg, E. K., Imshennik, V. S., & Nadyozhin, D. K. 1971, Ap&SS, 10, 28, doi: 10.1007/BF00654604
- Gutiérrez et al. (2017) Gutiérrez, C. P., Anderson, J. P., Hamuy, M., et al. 2017, The Astrophysical Journal, 850, 90, doi: 10.3847/1538-4357/aa8f42
- Halevi & Mösta (2018) Halevi, G., & Mösta, P. 2018, MNRAS, 477, 2366, doi: 10.1093/mnras/sty797
- Hamuy (2003) Hamuy, M. 2003, The Astrophysical Journal, 582, 905, doi: 10.1086/344689
- Herant & Woosley (1994) Herant, M., & Woosley, S. E. 1994, ApJ, 425, 814, doi: 10.1086/174026
- Hiramatsu et al. (2021) Hiramatsu, D., Howell, D. A., Moriya, T. J., et al. 2021, ApJ, 913, 55, doi: 10.3847/1538-4357/abf6d6
- Horowitz et al. (2019) Horowitz, C. J., Arcones, A., Côté, B., et al. 2019, Journal of Physics G Nuclear Physics, 46, 083001, doi: 10.1088/1361-6471/ab0849
- Hotokezaka et al. (2018) Hotokezaka, K., Beniamini, P., & Piran, T. 2018, International Journal of Modern Physics D, 27, 1842005, doi: 10.1142/S0218271818420051
- Hotokezaka et al. (2021) Hotokezaka, K., Tanaka, M., Kato, D., & Gaigalas, G. 2021, arXiv e-prints, arXiv:2102.07879. https://arxiv.org/abs/2102.07879
- Iglesias & Rogers (1996) Iglesias, C. A., & Rogers, F. J. 1996, ApJ, 464, 943, doi: 10.1086/177381
- Ivezić et al. (2019) Ivezić, Ž., Kahn, S. M., Tyson, J. A., et al. 2019, ApJ, 873, 111, doi: 10.3847/1538-4357/ab042c
- Ji et al. (2016) Ji, A. P., Frebel, A., Chiti, A., & Simon, J. D. 2016, Nature, 531, 610, doi: 10.1038/nature17425
- Just et al. (2022) Just, O., Aloy, M. A., Obergaulinger, M., & Nagataki, S. 2022, ApJ, 934, L30, doi: 10.3847/2041-8213/ac83a1
- Kasen et al. (2013) Kasen, D., Badnell, N. R., & Barnes, J. 2013, ApJ, submitted, arXiv:1303.5788. https://arxiv.org/abs/1303.5788
- Kasen & Bildsten (2010) Kasen, D., & Bildsten, L. 2010, ApJ, 717, 245, doi: 10.1088/0004-637X/717/1/245
- Kasen et al. (2009) Kasen, D., Röpke, F. K., & Woosley, S. E. 2009, Nature, 460, 869, doi: 10.1038/nature08256
- Kasen & Woosley (2009) Kasen, D., & Woosley, S. E. 2009, ApJ, 703, 2205, doi: 10.1088/0004-637X/703/2/2205
- Kochanek et al. (2017) Kochanek, C. S., Shappee, B. J., Stanek, K. Z., et al. 2017, PASP, 129, 104502, doi: 10.1088/1538-3873/aa80d9
- Lin et al. (2023) Lin, H., Zhang, J., & Zhang, X. 2023, Universe, 9, 201, doi: 10.3390/universe9050201
- Litvinova & Nadezhin (1985) Litvinova, I. Y., & Nadezhin, D. K. 1985, Soviet Astronomy Letters, 11, 145
- LSST Science Collaboration et al. (2009) LSST Science Collaboration, et al. 2009, arXiv e-prints, arXiv:0912.0201, doi: 10.48550/arXiv.0912.0201
- Ma & Fuller (2019) Ma, L., & Fuller, J. 2019, MNRAS, 488, 4338, doi: 10.1093/mnras/stz2009
- MacFadyen & Woosley (1999) MacFadyen, A. I., & Woosley, S. E. 1999, ApJ, 524, 262, doi: 10.1086/307790
- Metzger et al. (2018) Metzger, B. D., Beniamini, P., & Giannios, D. 2018, ApJ, 857, 95, doi: 10.3847/1538-4357/aab70c
- Metzger et al. (2008) Metzger, B. D., Quataert, E., & Thompson, T. A. 2008, MNRAS, 385, 1455, doi: 10.1111/j.1365-2966.2008.12923.x
- Metzger et al. (2007) Metzger, B. D., Thompson, T. A., & Quataert, E. 2007, ApJ, 659, 561, doi: 10.1086/512059
- Metzger et al. (2010) Metzger, B. D., Martínez-Pinedo, G., Darbha, S., et al. 2010, Mon. Not. R. Astron. Soc., 406, 2650, doi: 10.1111/j.1365-2966.2010.16864.x
- Meyer et al. (1992) Meyer, B. S., Mathews, G. J., Howard, W. M., Woosley, S. E., & Hoffman, R. D. 1992, ApJ, 399, 656, doi: 10.1086/171957
- Miller et al. (2020) Miller, J. M., Sprouse, T. M., Fryer, C. L., et al. 2020, ApJ, 902, 66, doi: 10.3847/1538-4357/abb4e3
- Moriya et al. (2016) Moriya, T. J., Pruzhinskaya, M. V., Ergon, M., & Blinnikov, S. I. 2016, Monthly Notices of the Royal Astronomical Society, 455, 423, doi: 10.1093/mnras/stv2336
- Morozova et al. (2016) Morozova, V., Piro, A. L., Renzo, M., & Ott, C. D. 2016, ApJ, 829, 109, doi: 10.3847/0004-637X/829/2/109
- Morozova et al. (2015) Morozova, V., Piro, A. L., Renzo, M., et al. 2015, ApJ, 814, 63, doi: 10.1088/0004-637X/814/1/63
- Morozova et al. (2017) Morozova, V., Piro, A. L., & Valenti, S. 2017, The Astrophysical Journal, 838, 28, doi: 10.3847/1538-4357/aa6251
- Mösta et al. (2014) Mösta, P., Richers, S., Ott, C. D., et al. 2014, ApJ, 785, L29, doi: 10.1088/2041-8205/785/2/L29
- Müller et al. (2017) Müller, T., Prieto, J. L., Pejcha, O., & Clocchiatti, A. 2017, ApJ, 841, 127, doi: 10.3847/1538-4357/aa72f1
- Nevins & Roberts (2023) Nevins, B., & Roberts, L. F. 2023, MNRAS, doi: 10.1093/mnras/stad372
- Otsuki et al. (2000) Otsuki, K., Tagoshi, H., Kajino, T., & Wanajo, S.-y. 2000, ApJ, 533, 424, doi: 10.1086/308632
- Paczynski (1983) Paczynski, B. 1983, ApJ, 267, 315, doi: 10.1086/160870
- Patat et al. (1994) Patat, F., Barbon, R., Cappellaro, E., & Turatto, M. 1994, A&A, 282, 731
- Paxton et al. (2011) Paxton, B., Bildsten, L., Dotter, A., et al. 2011, ApJS, 192, 3, doi: 10.1088/0067-0049/192/1/3
- Paxton et al. (2013) Paxton, B., Cantiello, M., Arras, P., et al. 2013, ApJS, 208, 4, doi: 10.1088/0067-0049/208/1/4
- Paxton et al. (2015) Paxton, B., Marchant, P., Schwab, J., et al. 2015, ApJS, 220, 15, doi: 10.1088/0067-0049/220/1/15
- Paxton et al. (2018) Paxton, B., Schwab, J., Bauer, E. B., et al. 2018, ApJS, 234, 34, doi: 10.3847/1538-4365/aaa5a8
- Pian et al. (2017) Pian, E., D’Avanzo, P., Benetti, S., et al. 2017, Nature, 551, 67, doi: 10.1038/nature24298
- Piran et al. (2017) Piran, T., Nakar, E., Mazzali, P., & Pian, E. 2017, arXiv e-prints, arXiv:1704.08298, doi: 10.48550/arXiv.1704.08298
- Piro et al. (2021) Piro, A. L., Haynie, A., & Yao, Y. 2021, ApJ, 909, 209, doi: 10.3847/1538-4357/abe2b1
- Podsiadlowski et al. (1992) Podsiadlowski, P., Joss, P. C., & Hsu, J. J. L. 1992, ApJ, 391, 246, doi: 10.1086/171341
- Popov (1993) Popov, D. V. 1993, ApJ, 414, 712, doi: 10.1086/173117
- Prasanna et al. (2022) Prasanna, T., Coleman, M. S. B., Raives, M. J., & Thompson, T. A. 2022, MNRAS, 517, 3008, doi: 10.1093/mnras/stac2651
- Prasanna et al. (2023) —. 2023, MNRAS, 526, 3141, doi: 10.1093/mnras/stad2948
- Qian & Woosley (1996) Qian, Y., & Woosley, S. E. 1996, ApJ, 471, 331, doi: 10.1086/177973
- Quataert et al. (2019) Quataert, E., Lecoanet, D., & Coughlin, E. R. 2019, Monthly Notices of the Royal Astronomical Society: Letters, 485, L83, doi: 10.1093/mnrasl/slz031
- Rastinejad et al. (2022) Rastinejad, J. C., Gompertz, B. P., Levan, A. J., et al. 2022, arXiv e-prints, arXiv:2204.10864. https://arxiv.org/abs/2204.10864
- Rastinejad et al. (2023) Rastinejad, J. C., Fong, W., Levan, A. J., et al. 2023, arXiv e-prints, arXiv:2312.04630, doi: 10.48550/arXiv.2312.04630
- Renzo (2015) Renzo, M. 2015, Master’s thesis, Università di Pisa, Italy
- Renzo et al. (2019) Renzo, M., Zapartas, E., de Mink, S. E., et al. 2019, A&A, 624, A66, doi: 10.1051/0004-6361/201833297
- Rozwadowska et al. (2021) Rozwadowska, K., Vissani, F., & Cappellaro, E. 2021, New A, 83, 101498, doi: 10.1016/j.newast.2020.101498
- Siegel et al. (2021) Siegel, D. M., Agarwal, A., Barnes, J., et al. 2021, arXiv e-prints, arXiv:2111.03094. https://arxiv.org/abs/2111.03094
- Siegel et al. (2022) —. 2022, ApJ, 941, 100, doi: 10.3847/1538-4357/ac8d04
- Siegel et al. (2019) Siegel, D. M., Barnes, J., & Metzger, B. D. 2019, Nature, 569, 241, doi: 10.1038/s41586-019-1136-0
- Simon et al. (2023) Simon, J. D., Brown, T. M., Mutlu-Pakdil, B., Ji, A. P., et al. 2023, ApJ, 944, 43, doi: 10.3847/1538-4357/aca9d1
- Smartt (2009) Smartt, S. J. 2009, ARA&A, 47, 63, doi: 10.1146/annurev-astro-082708-101737
- Smith et al. (2011) Smith, N., Li, W., Filippenko, A. V., & Chornock, R. 2011, MNRAS, 412, 1522, doi: 10.1111/j.1365-2966.2011.17229.x
- Spruit (1999) Spruit, H. C. 1999, A&A, 349, 189, doi: 10.48550/arXiv.astro-ph/9907138
- Spruit (2002) —. 2002, A&A, 381, 923, doi: 10.1051/0004-6361:20011465
- Stello et al. (2016) Stello, D., Cantiello, M., Fuller, J., et al. 2016, Nature, 529, 364, doi: 10.1038/nature16171
- Strotjohann et al. (2023) Strotjohann, N. L., Ofek, E. O., Gal-Yam, A., et al. 2023, arXiv e-prints, arXiv:2303.00010, doi: 10.48550/arXiv.2303.00010
- Sukhbold et al. (2016) Sukhbold, T., Ertl, T., Woosley, S. E., Brown, J. M., & Janka, H. T. 2016, ApJ, 821, 38, doi: 10.3847/0004-637X/821/1/38
- Sukhbold & Thompson (2017) Sukhbold, T., & Thompson, T. A. 2017, MNRAS, 472, 224, doi: 10.1093/mnras/stx2004
- Tanaka & Hotokezaka (2013) Tanaka, M., & Hotokezaka, K. 2013, Astrophys. J., 775, 113, doi: 10.1088/0004-637X/775/2/113
- Tanaka et al. (2020) Tanaka, M., Kato, D., Gaigalas, G., & Kawaguchi, K. 2020, MNRAS, 496, 1369, doi: 10.1093/mnras/staa1576
- Tanaka et al. (2017) Tanaka, M., Utsumi, Y., Mazzali, P. A., et al. 2017, Publications of the Astronomical Society of Japan, 69, 102, doi: 10.1093/pasj/psx121
- Thielemann et al. (2020) Thielemann, F.-K., Wehmeyer, B., & Wu, M.-R. 2020, in Journal of Physics Conference Series, Vol. 1668, Journal of Physics Conference Series, 012044, doi: 10.1088/1742-6596/1668/1/012044
- Thompson (2003) Thompson, T. A. 2003, ApJ, 585, L33, doi: 10.1086/374261
- Thompson et al. (2001) Thompson, T. A., Burrows, A., & Meyer, B. S. 2001, ApJ, 562, 887, doi: 10.1086/323861
- Thompson et al. (2004) Thompson, T. A., Chang, P., & Quataert, E. 2004, ApJ, 611, 380, doi: 10.1086/421969
- Thompson & ud-Doula (2018) Thompson, T. A., & ud-Doula, A. 2018, MNRAS, 476, 5502, doi: 10.1093/mnras/sty480
- Tonry et al. (2018) Tonry, J. L., Denneau, L., Heinze, A. N., et al. 2018, PASP, 130, 064505, doi: 10.1088/1538-3873/aabadf
- Utrobin (2007) Utrobin, V. P. 2007, A&A, 461, 233, doi: 10.1051/0004-6361:20066078
- Utrobin et al. (2017) Utrobin, V. P., Wongwathanarat, A., Janka, H. T., & Müller, E. 2017, ApJ, 846, 37, doi: 10.3847/1538-4357/aa8594
- Valenti et al. (2016) Valenti, S., Howell, D. A., Stritzinger, M. D., et al. 2016, Monthly Notices of the Royal Astronomical Society, 459, 3939, doi: 10.1093/mnras/stw870
- Villar et al. (2021) Villar, V. A., Cranmer, M., Berger, E., et al. 2021, ApJS, 255, 24, doi: 10.3847/1538-4365/ac0893
- Vink et al. (2001) Vink, J. S., de Koter, A., & Lamers, H. J. G. L. M. 2001, A&A, 369, 574, doi: 10.1051/0004-6361:20010127
- Vlasov et al. (2017) Vlasov, A. D., Metzger, B. D., Lippuner, J., Roberts, L. F., & Thompson, T. A. 2017, MNRAS, 468, 1522, doi: 10.1093/mnras/stx478
- Wallner et al. (2015) Wallner, A., Faestermann, T., Feige, J., et al. 2015, Nature Commun., 6, 5956, doi: 10.1038/ncomms6956
- Wanajo (2018) Wanajo, S. 2018, ApJ, 868, 65, doi: 10.3847/1538-4357/aae0f2
- Wang & Burrows (2023) Wang, T., & Burrows, A. 2023, arXiv e-prints, arXiv:2306.13712, doi: 10.48550/arXiv.2306.13712
- Wheeler & Chatzopoulos (2023) Wheeler, J. C., & Chatzopoulos, E. 2023, Astronomy and Geophysics, 64, 3.11, doi: 10.1093/astrogeo/atad020
- Winteler et al. (2012) Winteler, C., Käppeli, R., Perego, A., et al. 2012, Astrophys. J. Lett., 750, L22, doi: 10.1088/2041-8205/750/1/L22
- Wongwathanarat et al. (2015) Wongwathanarat, A., Müller, E., & Janka, H. T. 2015, A&A, 577, A48, doi: 10.1051/0004-6361/201425025
- Woosley et al. (1994) Woosley, S. E., Wilson, J. R., Mathews, G. J., Hoffman, R. D., & Meyer, B. S. 1994, ApJ, 433, 229, doi: 10.1086/174638
- Zapartas et al. (2017) Zapartas, E., et al. 2017, Astron. Astrophys., 601, A29, doi: 10.1051/0004-6361/201629685
Appendix A Model Tests
Here we describe several numerical tests of our models, to assess the robustness of our conclusions in face of different assumptions regarding the opacity floor and the role of energy input from -process radioactive decay.
A.1 Default Opacity Floor
According to Morozova et al. (2015), the “default” opacity floor profile in SNEC, set such that cm2 g-1 and cm2 g-1, was chosen so as to produce light-curves consistent with previous modeling (Blinnikov & Bartunov, 1993; Blinnikov et al., 1998; Bersten et al., 2011). For consistency, we have thus adopted this default opacity prescription for the non--process-enriched material in all models presented thus far in this paper. However, given that these values are not motivated by first principles, they may overestimate the true physical opacities of the system.
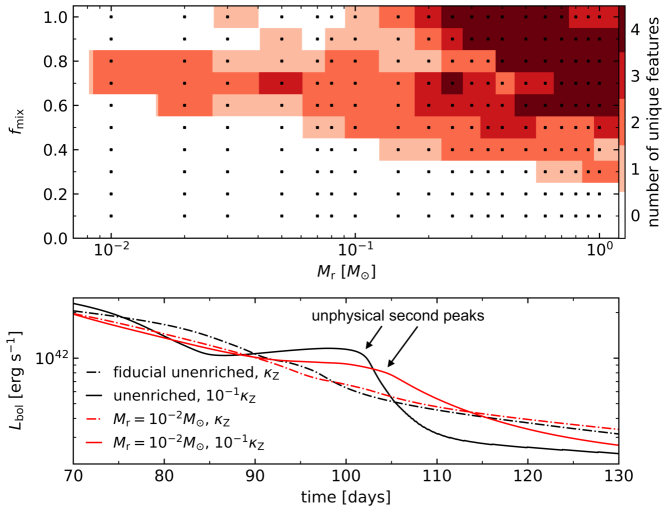
Since an unphysically high baseline opacity would “dilute” the opacity effects of -process elements, we explore the sensitivity of our results to the floor opacity treatment. Repeating an otherwise identical analysis by reducing the floor opacity by a factor of 10 (such that cm2 g-1 and cm2 g-1) we find that the detectability threshold for -process enrichment is extended down to lower levels, and , than in the high-floor case, as shown in the top panel of Fig. 8.
However, as shown in the bottom panel of the same figure, the implementation of this low floor opacity also introduces strange, likely unphysical light-curve features around days. These include a second light-curve peak, which arises at least in part from those steep gradients in the radial density profile of the ejecta shown in Fig. 2 (see, e.g. discussions in Eastman et al. 1994; Utrobin 2007, and in particular, Utrobin et al. 2017). Such density profile features may themselves be unphysical, as multidimensional effects and hydrodynamic instabilities during the early shock-crossing explosion phase, such as the Rayleigh-Taylor Instability (Herant & Woosley, 1994; Wongwathanarat et al., 2015; Duffell, 2016; Paxton et al., 2018) would smooth these out in more realistic 3D simulations.
Due to uncertainties in how the “detectable” signatures of -process enrichment may be confounded with these unphysical effects on the light-curve, we opt not to draw strong conclusions from this analysis with the low floor opacity. We maintain that the results with the fiducial floor provide a conservative estimate for the detectability boundary.
A.2 Effects of -Process Heating
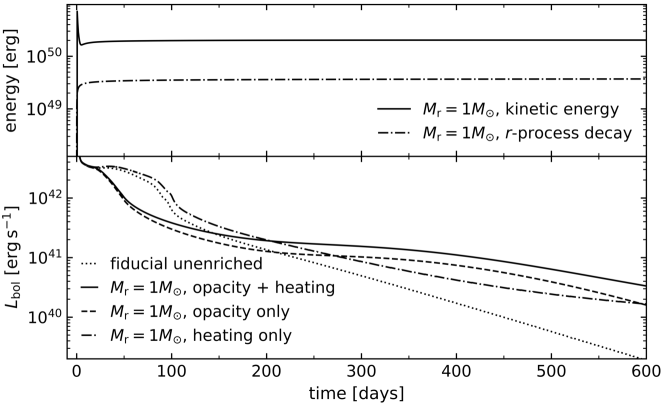
Although our models include heating due to the decay of -process nuclei, we do not expect its presence to result in significant changes to the dynamical evolution of the ejecta nor the observed luminosity, for reasons outlined here. Regarding dynamics, the top panel of Fig. 9 shows as a function of time the integrated energy input from -process decay, , in comparison to the total ejecta kinetic energy, , for a highly -process-enriched model with (greater than the fiducial . These are calculated as,
| (A1) |
Even for this extreme level of enrichment, is an order of magnitude smaller than , resulting in a negligible impact on the ejecta dynamics, even for complete conversion of the former into the latter via PdV work during the ejecta expansion.
Regarding the effect of -process decay on the SN luminosity budget, Siegel et al. (2019) showed that the specific energy deposition rate from the 56Ni decay chain exceeds that from -process decay by orders of magnitude on the timescales of interest ( days). For nickel masses relevant to SNe IIP, we see that -process masses obeying should not appreciably alter the light-curve.
For extreme enrichment events (), the -process decay luminosity can compete with 56Ni. This is evident in the “heating only” model in the bottom panel of Fig. 9, whose light-curve deviates from the otherwise equivalent unenriched model. The “heating only” model accounts only for the effects of -process heating. When the effects of higher -process opacity are also included, as in the “opacity + heating” model, there is also an increase in the luminosity compared to the “opacity only” model. The high opacity traps the energy from -process decay, preventing it from escaping rapidly enough to appreciably alter the light-curve. This effect is most evident at late times, where the “heating only” model is substantially more luminous than the unenriched model, while the differences between the “opacity + heating” and the “opacity only” models are less significant. Even for this extreme level of enrichment, -process heating increases the luminosity by a factor of on timescales of interest, and the effect is further diminished for lower levels of enrichment. We conclude that -process heating effects are minor, leaving opacity as the most prominent signature of -process enrichment.
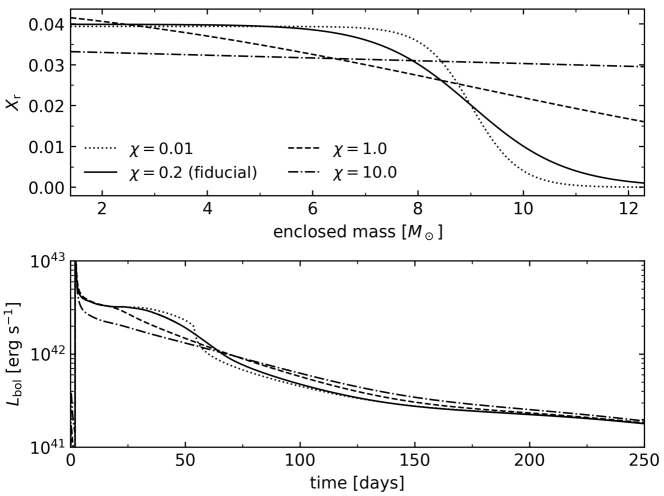
A.3 Sensitivity to
The parameter entering Eq. 3 was set to in all -process-enriched models presented thus far. The light-curves in Fig. 10 (bottom panel), corresponding to -process mass fraction profiles of different values (top panel), show that our results are not overly sensitive to the value of , as long as there is a steep transition from -process-enriched layers to -process free layers (e.g. , ). Values of which are very high (e.g. ) entail -rich material distributed far out into the ejecta, leading to degenerate behavior with a higher mixing fraction. We take the smoother as the fiducial value as it does not produce an abrupt change in the light-curve such as that seen in the model at day 60.
Appendix B Light-Curve Morphology Fitting
B.1 Fitting
To estimate the plateau duration, , we fit the bolometric light-curve to the functional form:
| (B1) |
as introduced by Valenti et al. (2016). Following Goldberg et al. (2019), we begin fitting the light-curves at the time where is the time of steepest descent in the bolometric light-curve (i.e., where the absolute value of the slope is maximum, excluding the initial rise to peak luminosity). The steepest descent typically occurs during the transition from the plateau to the 56Ni tail. We end the fit at . While we find this works well for unenriched models with sufficiently long plateaus days, the enriched models exhibit shorter plateaus, such that days for highly enriched cases. Insofar that a start time is in these cases insufficient to encompass enough of the light-curve to produce a good fit, we add conditional arguments in our fitting procedure as follows: If days, then . If days, the fit is started at day 10. If days, the fit is started at day 15. If days, the fit is started at day 20. If days, the fit is started at day 30. If days, the fit is started at 40 days. For days, the start time is determined as in the standard case, at . These conditions allow sufficient range in data to encompass all the necessary features of plateau, transition, and Ni-tail. We find good agreement between the results of this modified fitting algorithm and plateau durations estimated by eye, for models across all levels of enrichment.
B.2 Fitting
In the observational literature, the plateau decline rate in V-band luminosity is typically divided into two components, and , where is the slope magnitude of the initial steeper portion of the plateau (representing initial cooling from peak luminosity) and is the slope magnitude of the second, shallower section of the plateau as defined in Anderson et al. 2014. These quantities are defined to fit data from observations. The V-band light-curves produced by post-processing our SNEC bolometric luminosities do not show these two distinct slopes during the plateau. Even if the code could accurately simulate these features of the light-curve in unenriched models, it is uncertain how -process enrichment would affect these features and whether two slopes would be distinguishable across all levels of enrichment. To accommodate these uncertainties while maintaining synonymity to the original definition of , we consider for simplicity a single plateau decline rate by performing a linear fit starting at peak V-band magnitude and ending 35 days past peak, where V-band magnitude is calculated using the AB magnitude system assuming a black body at temperature . The resulting decline rates accurately capture the trends visible by eye, where models with greater explosion energies or greater levels of -process enrichment have steeper “plateau” slopes.
Appendix C Modifications to SNEC
As described in Sec. 2, we include the effects of -process enrichment on the opacity of the SN ejecta by modifying the default opacity floor present in SNEC. To do so, we first determine the ejecta mass by subtracting the excised mass (corresponding to the central PNS) from the total pre-SN progenitor mass and then we calculate following Eq. (4), determining the normalization constant from the integral described in Sec. 2. For each grid point, (i=1, imax=1000), the -process mass-fraction is evaluated as a function of as in Eq. (3) and the new -process opacity floor, , is calculated by Eq. (2). The original (“default”) opacity floor of each zone is reassigned to a new variable , while the native SNEC variable (which previously denoted the default floor), is now set as the sum of and .
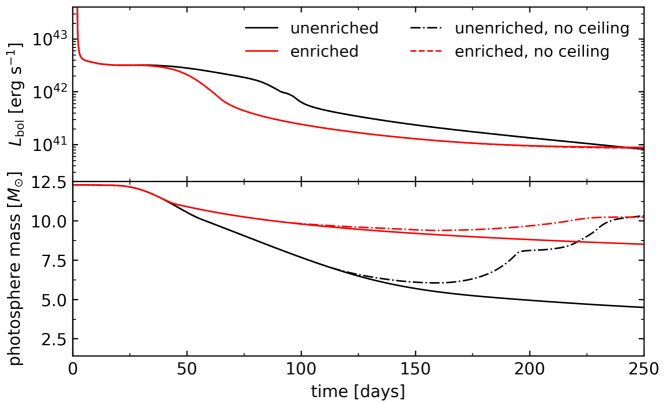
SNEC refers to the OPAL (Iglesias & Rogers, 1996) and Ferguson (Ferguson et al., 2005) opacity tables to determine the ejecta opacity as a function of the temperature and density in a given grid cell. OPAL opacities are used at high temperatures ( K K) while Ferguson opacities are used at low temperatures ( K K) (Morozova et al., 2015). In the overlapping region, preference is given to Ferguson. If the opacity value read from the table for zone i is less than the corresponding opacity floor for that zone, then the opacity is set to the floor value instead of the table value. At low temperatures ( K), the Ferguson opacities rise to high values due to the assumed presence of dust. This leads to a sudden increase in the opacity of the outermost zones in the explosion at late time, which causes the photosphere to move outwards in mass coordinate at late times (“no ceiling” models, shown in Fig. 11). However, if dust formation is not efficient throughout the ejecta, then these opacities are over-estimated and such behavior is not physical (the photosphere radius should actually continue to move inwards monotonically). To circumvent this issue, at low temperatures ( K) we artificially force opacities to the floor value, rather than using the opacity table; in effect, we use the opacity floor also as an opacity “ceiling”. We accomplish this by including a conditional argument that sets a zone’s opacity value to the floor value if its temperature is less than 3000 K. To test the sensitivity of our early-time results to this assumed temperature threshold, we ran an otherwise identical model but with the ceiling instead set to trigger below 2000 K; reassuringly, the photosphere and luminosity evolution were found to be nearly identical to the 3000 K threshold case.
The variable kappa denotes the opacity value set by the opacity floor and ceiling, while kappa_table denotes that assigned by the opacity tables. By default, the radial optical depth (and hence the photosphere location) are calculated in SNEC using kappa_table. In order to account for the opacity floor and ceiling limits on the photosphere profiles, we calculate using kappa instead of kappa_table. With this modification and those described above, we are able to achieve the desired opacity profile (Fig. 3) and avoid an unphysical outward expansion of the photosphere in mass coordinate. The corrected photosphere evolution for a enriched and fiducial unenriched models is shown in Fig. 11.
We include the effects of radioactive decay energy by multiplying the specific heating rate given by Eq. (5) with the -process mass in each zone. We amend the definition of total luminosity to include this contribution, which thus becomes the sum of the photosphere luminosity, 56Ni decay luminosity external to the photosphere, and -process decay luminosity external to the photosphere. We similarly amend the the ejecta heating rate internal to the photosphere.