The fast transient AT 2023clx in the nearby LINER galaxy NGC 3799, as a tidal disruption event of a very low-mass star
We present an extensive analysis of the optical and ultraviolet (UV) properties of AT 2023clx, the closest tidal disruption event (TDE) to date, that occurred in the nucleus of the interacting LINER galaxy, NGC 3799 (). From several standard methods, we estimate the mass of the central supermassive black hole (SMBH) to be . After correcting for the host reddening ( = 0.177 mag) we measured its peak absolute -band magnitude to be mag, and its peak bolometric luminosity to be , making AT 2023clx an intermediate luminosity TDE. The first distinctive feature of AT 2023clx is that it rose to peak within only days, making it the fastest rising TDE to date. Our SMBH mass estimate rules out the possibility of an intermediate mass BH as the reason of the fast rise. Dense spectral follow-up revealed a blue continuum that cools slowly and broad Balmer and He II lines as well as weak He I 5876,6678 emission, features that are typically seen in TDEs. The early, broad (width ) profile of H matches theoretical expectations from an optically thick outflow. A flat Balmer decrement (/) suggests that the lines are collisionally excited rather than being produced via photoionisation, as in typical active galactic nuclei. A second distinctive feature, seen for the first time in TDE spectra, is a sharp, narrow emission peak at a rest wavelength of 6353 Å. This feature is clearly visible up to 10 d post-peak; we attribute it to clumpy material preceding the bulk outflow, and manifested as a high-velocity component of H (). The third distinctive feature of AT 2023clx is a break observed in the near-UV light curves that is reflected as a dip in the temperature evolution around days post-peak. Combining these findings, we propose a scenario for AT 2023clx involving the disruption of a very low-mass star () with an outflow launched in our line-of-sight with disruption properties that led to circularisation and prompt and efficient accretion disc formation, observed through a low-density photosphere.
Key Words.:
black hole physics – Methods: observational – Galaxy: nucleus1 Introduction
Black holes (BHs) are thought to reside in the nuclei of galaxies and spanning a wide range of masses, from supermassive (SMBHs) with to intermediate (IMBHs) with (Kormendy & Richstone, 1995; Kormendy & Ho, 2013; Greene et al., 2020). When a star falls in the vicinity of such BHs, it gets tidally ripped apart by the immense gravitational force. More specifically, when the pericenter distance of the star (with mass and radius ) is smaller than the tidal radius – the disruption distance from the BH – which is defined as , the star is destroyed (Hills, 1975) and around half of the stellar debris escape in unbound orbits while the rest get bound and stretched into a thin elongated stream that starts circularising around the BH into highly eccentric orbits (Rees, 1988; Evans & Kochanek, 1989). The above process is called a Tidal Disruption Event (TDE) and leads to a strong (), transient, nuclear flare (Lacy et al., 1982; Rees, 1988; Evans & Kochanek, 1989; Phinney, 1989), that sometimes surpasses the Eddington luminosity (Strubbe & Quataert, 2009; Lodato & Rossi, 2011).
TDEs were first discovered in the X-ray regime (Komossa & Bade 1999; see Auchettl et al. 2017; Guolo et al. 2023 for more recent X-ray TDEs) however, during the last decade, discoveries of many TDEs were identified at ultraviolet (UV) and optical wavelengths (Gezari et al. 2012; Arcavi et al. 2014; van Velzen et al. 2021; Yao et al. 2023, and see reviews from van Velzen et al. 2020 and Gezari 2021), taking advantage of the capabilities of surveys such as the Galaxy Evolution Explorer (GALEX; Siegmund et al. 2004) in the UV, and numerous wide-field sky surveys in the optical such as the Sloan Digital Sky Survey (SDSS; Gunn et al. 2006), the Palomar Transient Factory (PTF; Law et al. 2009) and its successor the intermediate Palomar Transient Factory (iPTF), PanSTARRS1 (PS1; Kaiser et al. 2002), the All-Sky Automated Survey for Supernovae (ASAS-SN; Shappee et al. 2014), the Asteroid Terrestrial impact Last Alert System (ATLAS; Tonry et al. 2018) and the Zwicky Transient Facility (ZTF; Bellm et al. 2019; Masci et al. 2019; Graham et al. 2019). Furthermore, there are TDEs discovered in the mid-infrared (Mattila et al., 2018; Kool et al., 2020; Jiang et al., 2021; Reynolds et al., 2022) and others that launch relativistic jets and outflows leading to bright gamma and X-ray (Zauderer et al., 2011; Andreoni et al., 2022; Pasham et al., 2023) as well as radio emission (Van Velzen et al., 2016; Mattila et al., 2018; Alexander et al., 2020; Goodwin et al., 2022; Cendes et al., 2023).
The broad range of properties of TDEs (some being bright in the X-rays, other in the optical and UV and others in both regimes) has led to different theoretical scenarios regarding the emission mechanism at play. It was suggested that such strong optical and UV emission might arise from shocks during the self intersection of the debris stream (Piran et al., 2015; Jiang et al., 2016) or from the reprocessing of X-rays arising from an accretion disc (Guillochon & Ramirez-Ruiz, 2013; Metzger & Stone, 2016; Roth et al., 2016). In the latter scenario, the \sayreprocessing-layer is suggested to be optically thick outflows arising from super-Eddington accretion (Miller et al., 2015; Dai et al., 2018; Thomsen et al., 2022) or a \saycollision-induced outflow arising from the self-intersection point (Lu & Bonnerot, 2020; Bonnerot et al., 2021; Charalampopoulos et al., 2023a).
It is still under study how the BH mass of the host galaxy affects the light curve properties of optical and UV TDEs. There have been some events that are faint and fast, that is, they rise to the peak on shorter timescales and have dimmer peak magnitudes relative to the bulk of the TDE population (see extensive discussion about their properties in Charalampopoulos et al. 2023b). Blagorodnova et al. (2017) suggested that the reason for faint and fast TDEs could be the low SMBH mass of the host galaxy, however TDEs discovered later than this study had estimated BH masses not significantly lower compared to the other more slowly evolving TDEs (Nicholl et al., 2020). On the other extreme end, it has been suggested that TDEs might occur around BHs with masses larger than , something not possible for non-spinning BHs as the disruption of the star (hence the electromagnetic flare) would happen within the event horizon. However, for a highly rotating BH, a TDE outside the event horizon becomes possible (Kesden, 2012). Such a scenario was proposed to explain the super-luminous transient ASASSN-15lh (Leloudas et al., 2016) that showed a spectacular re-brightening in the UV wavelengths two months after the transient peak. Spectroscopically, optical and UV TDEs typically show strong and broad Balmer emission lines and sometimes strong Helium emission lines as well. They show a vast spectroscopic diversity as a class, with different line profiles seen in different TDEs, and dramatic profile evolution within the same event (e.g. see Charalampopoulos et al. 2022). Some of these peculiar line profiles (e.g. Hung et al. 2019; Nicholl et al. 2020; Hung et al. 2021) have been attributed to the existence of outflows (Roth & Kasen 2018).
Demographically, optical and UV TDEs are usually discovered in quiescent galaxies. The rare subset of quiescent Balmer-strong E+A galaxies seems to be over-represented in hosting TDEs by a factor of 30–35 (Arcavi et al., 2014; French et al., 2016; Graur et al., 2018; French et al., 2020), and lately a rate enhancement in green-valley galaxies has been discovered (Yao et al., 2023). However, there have been TDE candidates that were discovered in the nuclei of active galaxies (e.g. Blanchard et al. 2017; Kankare et al. 2017; Nicholl et al. 2020; Hung et al. 2021; Cannizzaro et al. 2020, 2021; Tadhunter et al. 2021; Cannizzaro et al. 2022; Wevers et al. 2022b; Petrushevska et al. 2023; Homan et al. 2023). It is harder to elucidate the nature of such transients as the pre-TDE activity and variability is entangled with the transient flux; it is therefore not trivial to ascribe a sudden change in nuclear brightness to a TDE or to e.g. a changing-look of a Seyfert active galactic nucleus (AGN) or low-ionization nuclear emission-line region (LINER; Frederick et al. 2019, 2021).
2 Discovery and background
On 23-02-2023 the ASAS-SN collaboration reported on the Transient Name Server (TNS111The TNS is the official IAU mechanism for reporting new astronomical transients https://wis-tns.weizmann.ac.il/) the discovery of a transient (ASASSN-23bd, IAU name: AT 2023clx) in the nucleus of the nearby galaxy NGC 3799 and noted in the remarks that it could potentially be a TDE (Stanek, 2023). In 26-02-2023 the transient was classified as a TDE (Taguchi et al., 2023) based on a SEIMEI telescope spectrum. It is important to note that the Sherlock package222https://github.com/thespacedoctor/sherlock (Young, 2023; Smith et al., 2020) (that predicts the classification of a reported new transient by cross-matching data against a library of historical and on-going astronomical survey data e.g. nearby galaxies, known CVs, AGNs, etc) used by the Lasair333https://lasair-ztf.lsst.ac.uk/ broker (Smith et al., 2019) identified this transient as being within 0.5 arcseconds of the core of NGC 3799. At this separation, Sherlock would classify the source either as an NT (nuclear transient) or AGN depending on what information exists in galaxy catalogues. NGC 3799 is labelled as a potential AGN in the Milliquas catalogue (Flesch, 2023) and hence an AGN label was applied both in the Lasair stream for the ZTF detection and in the ATLAS database. This means that every querying transient filter that disregards discovered transients because they occur in the nucleus of a known AGN or because of the Sherlock contextual classification, would have also disregarded AT 2023clx. To further complicate the matter, the ATLAS team sent the ATLAS initial source detection (2023 March 04) to TNS automatically, triggered after the ASAS-SN discovery. A detection of the source (either a spurious subtraction artefact or real variability) was made in 2018 (ATLAS18bcno), which caused an object under the name AT 2018meh to be created on the TNS. ZTF also had a variability detection in 2018 (ZTF18aabkvpi). To be clear, a comment was added on the TNS to note these are not likely real sources. However, there was a second classification (again as a TDE) on 12-05-2023 by Johansson et al. (2023) based on a Keck telescope spectrum, associated with AT 2018meh on the TNS. From hereon, we will refer to the transient as AT 2023clx. In an earlier work, Zhu et al. (2023) presented the early time properties of AT 2023clx, concluding it is the faintest and closest optical TDE discovered.
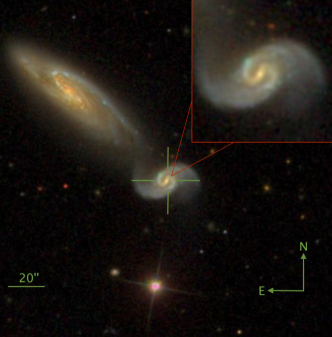
In the NASA/IPAC Extragalactic Database (NED444https://ned.ipac.caltech.edu/) and in SIMBAD (SIMBAD555https://simbad.cds.unistra.fr/), the host is classified as a LINER and has a spectroscopic redshift of , reported in SDSS based on the archival host galaxy spectrum. This corresponds to a distance of 47.8 Mpc assuming a CDM cosmology with H0 = 67.4 km s-1 Mpc-1, = 0.315 and = 0.685 (Aghanim et al., 2020), that we will use throughout this work. We note that distances to NGC 3799 that include corrections for Virgo and Great Attractor infall as well as the Shapley supercluster, are all consistent within the errors with the above value. An image of the host is shown in Fig. 1. We note that the galaxy appears to be merging with a companion, the nearby galaxy NGC 3800. Ramos Padilla et al. (2020) studied 189 nearby interacting galaxies and, in a merger-state scale of 1 – 5, they have classified the NGC 3799 system as Stage 3, that is \saygalaxies are moderately interacting, have apparent tidal features, and display moderate morphological distortions.
In this paper, we present the follow-up and thorough photometric and spectroscopic analysis of AT 2023clx. The discovery and background of the transient was presented in this section (Sect. 2). We describe our observations and data reduction in Sect. 3. We present a comprehensive analysis of the photometric and spectroscopic properties of AT 2023clx in Sect. 4 and we discuss their implications in Sect. 5. Sect. 6 contains our summary and conclusions.
3 Observations and data reduction
We infer a foreground Galactic extinction of = 0.0829 mag (Schlafly & Finkbeiner, 2011), and apply this to our data assuming the Cardelli et al. (1989) extinction law with = 3.1. We also de-redden for the host galaxy extinction (we discuss this in Sect. 4.1.1) assuming a host visual extinction of = 0.73 mag.
3.1 Ground-based imaging
Well-sampled host subtracted light curves of AT 2023clx were obtained by the ZTF public survey in the and bands, from the ATLAS survey in the and bands and from the ASAS-SN survey in the band. We performed forced point spread function (PSF) photometry to extract precise flux measurements through the ZTF forced-photometry service (Masci et al., 2019). The ATLAS o and c band light curves were generated using the ATLAS Forced Photometry service (Tonry et al., 2018; Smith et al., 2020; Shingles et al., 2021)666https://fallingstar-data.com/forcedphot/. The ASAS-SN light curves were collected from the ASAS-SN Sky Patrol Photometry Database777http://asas-sn.ifa.hawaii.edu/skypatrol/. Near-infrared (NIR) imaging of AT 2023clx was obtained with the Nordic Optical Telescope (NOT) as both part of the NUTS2888http://nuts2.sn.ie/ program and a systematic effort to observe nearby TDEs in the NIR, using the NOTCam instrument. The NOTCam data were reduced using a slightly modified version of the NOTCam quicklook v2.5 reduction package (e.g. to increase the field of view). The reduction process included flat-field correction, a distortion correction, bad pixel masking, sky subtraction and finally stacking of the dithered images. PSF photometry was performed with the autophot pipeline (Brennan & Fraser, 2022) after template subtraction and the resulting magnitudes were calibrated using the 2MASS catalogue (Skrutskie et al., 2006). Images were aligned for template subtraction using standard IRAF tasks and template subtraction was performed with the hotpants package999https://github.com/acbecker/hotpants, an implementation of the image subtraction algorithm by Alard & Lupton (1998). NIR imaging follow-up of AT 2023clx consisted of four epochs of imaging. Template images were obtained on 27-12-2023 and 28-12-2023 under good conditions to obtain similar seeing and depth to the best quality follow-up images. The template epochs were observed at 305 rest frame days after the observed optical peak of the TDE, which is early enough that there could be residual infrared (IR) emission from a slowly evolving IR echo of the TDE (Mattila et al., 2018; Kool et al., 2020; Reynolds et al., 2022). To check for such an IR echo, we performed image subtractions of our NOT template images against available template images of the field obtained in 2020 by the UKIRT large area survey (Lawrence et al., 2007). We did not detect a residual in any of these subtractions. Through injection and recovery of sources in the template subtracted images, we find 3 upper limits in our NOT templates of 20.5, 20 and 19 mag for , and respectively. Additionally, if a long lasting IR echo was present, we would expect the band flux to be brighter in the template than in our earliest NIR data, leading to negative residuals in the subtractions, which we do not observe. We conclude that there is no evidence of any residual emission in our template data.
3.2 Swift UVOT photometry
Target-of-opportunity observations spanning 30 epochs (PIs: Leloudas, Wevers, Huang, Gomez, Sfaradi) were obtained with the UV-Optical Telescope (UVOT) and X-ray Telescope (XRT) on board the Neil Gehrels Swift Observatory (Swift). The UVOT data were reduced using the standard pipeline available in the HEAsoft software package101010https://heasarc.gsfc.nasa.gov/docs/software/heasoft/. Observation of every epoch was conducted using one or several orbits. To improve the signal-to-noise ratio (S/N) of the observation in a given band in a particular epoch, we co-added all orbit-data for that corresponding epoch using the HEAsoft routine uvotimsum. We used the routine uvotsource to measure the apparent magnitude of the transient (using the most recent UVOT photometric zero-points of Breeveld et al. 2011 that updated the ones of Poole et al. 2008) by performing aperture photometry using a 5 arcsec radius aperture for the source and a 25 arcsec aperture for the background. Since there were archival images, in all bands except , we performed aperture photometry using the same methods in order to estimate the host galaxy flux in each of the UVOT bands and subtract it from the TDE+host photometry. For the -band, we scaled the archival SDSS spectrum with the archival UVOT photometry and then computed the synthetic photometry of the filter. The band photometry quickly reaches the host level so we do not take it into account for the rest of our analysis.
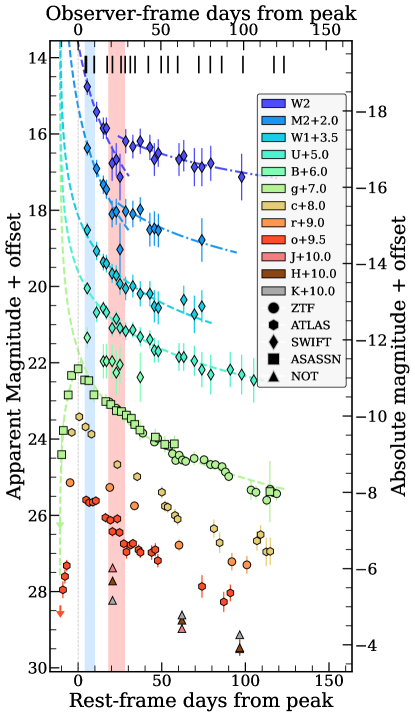
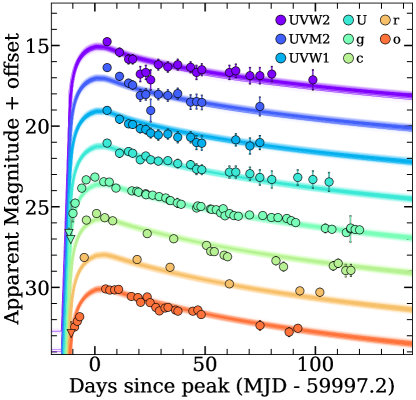
The complete, host subtracted and de-reddened UV and optical light curves from Swift, ZTF, ATLAS and ASAS-SN are shown in Fig. 2 and all magnitudes are tabulated in Table 5 of the Appendix.
3.3 X-ray upper-limits
We looked for X-ray emission from the position of the source in the XRT data and we report that AT 2023clx was not bright in X-rays. After stacking all available observations (30 epochs; 129 days) we find a marginal detection at counts per second that we consider a 3 upper-limit. Using the webPIMMS tool111111https://heasarc.gsfc.nasa.gov/cgi-bin/Tools/w3pimms/w3pimms.pl and assuming a Galactic column density of cm-2, we convert the count rate to an unabsorbed flux upper-limit of (0.3–10 keV, assuming a blackbody model with keV) which translates to an upper-limit for the X-ray luminosity of (a power-law model with results in an upper-limit of ). These upper-limits make it 25 times fainter than the faintest X-ray detected TDE of the sample of Guolo et al. (2023).
3.4 Imaging polarimetry
We obtained two epochs of imaging polarimetry with the Multi-colour OPTimised Optical Polarimeter (MOPTOP) mounted on the Liverpool Telescope (LT). MOPTOP is a dual-beam, dual camera polarimeter with the beams sent to a pair of low-noise fast-readout imaging cameras. It utilises a continuously rotating half-wave plate, with 16 rotation positions per cycle. Images were obtained in “slow mode” with four second exposures and each set of 56 images were stacked per rotation angle. Exposures undergo bias subtraction, dark subtraction and flat fielding using an automated facility pipeline. LT observed AT 2023clx on 13-03-2023 (MJD 60016.95; d) and 18-04-2023 (MJD 60052.90; d) using MOPTOP in the L band. Unfortunately, the observing conditions were not optimal as the seeing was very high in the first epoch (4′′) and varied a lot in the second (1′′– 3.4′′). Images from 13-03-2023 were affected by cloud cover resulting in two exposures being removed from the final stacked images. Observations also commenced on 17-04-2023 but were aborted due to high cloud cover and are not subsequently analysed. Fluxes were extracted with a 10 pixel aperture, corresponding to 2 times the full-width at half-maximum (FWHM), using the ASTROPY PHOTUTILS package (Bradley et al., 2019). Background fluxes were calculated using the median value of a patch of the exposure close to source due to interference from the host and neighbouring galaxy close to the target. The S/N of the target was 120 on 13-03-2023 and 130 on 18-04-2023. Polarisation measurements were calculated using the two-camera technique described by Shrestha et al. (2020). This method uses four rotation positions from each camera to produce an independent set of q, u pairs. All four sets of q, u parameters were combined and averaged to produce a final q, u pair per night of observation.
For the first epoch (13-03-2023), we measure and (leading to ). Due to the very large seeing and cloud cover we consider this measurement unreliable. For the second epoch (18-04-2023), we measure and (leading to ). This measurement is more trustworthy and is consistent with an intrinsic polarisation degree of zero. Due to the bad observing conditions and the low S/N, we decided not use the imaging polarimetry measurements in our discussion and conclusions about the object.
3.5 Optical spectroscopy
We collected low-resolution spectra of AT 2023clx with the Alhambra Faint Object Spectrograph and Camera (ALFOSC) mounted on the NOT through our programme (PI Charalampopoulos; P67-021) and through the NUTS2 collaboration. Spectra were also obtained with EFOSC2 on the New Technology Telescope (NTT) in La Silla Observatory, Chile, as part of the extended Public ESO Spectroscopic Survey for Transient Objects (ePESSTO+) survey (Smartt et al., 2015). The NOT spectra were reduced using the PyNOT reduction pipeline121212https://github.com/jkrogager/PyNOT/, and the NTT spectra were reduced in a standard manner with the PESSTO pipeline (Smartt et al., 2015). In addition to the above low-resolution spectra, we also acquired four intermediate-resolution spectra with the X-shooter mounted on European Southern Observatory’s (ESO) Very Large Telescope (VLT) in Cerro Paranal, Chile through Director’s Discretionary Time (DDT; PI Wevers; 110.25AX). The observations were performed using the standard nod-on-slit mode, but each single arm spectrum was reduced using the \saystare mode reduction, using ESOreflex and the standard X-shooter pipeline (Goldoni et al., 2006; Modigliani et al., 2010).
We performed host subtraction (following the methods described in Charalampopoulos et al. 2022) using the SDSS archival spectrum. This is not a trivial process; first we degraded the SDSS spectrum to the resolution of the NOT and NTT spectra by binning the flux values of the former to the wavelengths of the latter (or alternatively, degraded the X-shooter spectra to match the resolution of the SDSS spectrum). We then scaled the spectra to match the photometry (including the one of the host) before carrying out the subtraction. All spectra were taken at the parallactic angle. Typically TDEs are found in elliptical galaxies so the orientation of the slit does not change which parts of the galaxy are included in the slit. However NGC 3799 is a spiral galaxy. A consequence of using the parallactic angle is that the background contamination changes with each epoch (see Fig. 1). To minimise the effect of this, we exercised extreme care in our choice of aperture when extracting the spectra so that only the nuclear region was included. As expected, the subtraction was not perfect, and residuals corresponding to narrow lines from the host galaxy were apparent in the host subtracted spectra, especially around the H and the [N II] lines. For these cases, we applied sigma-clipping of the residuals on top of the broad H profile. The NIR arm X-shooter spectra were corrected for telluric features using telluric standard star observations taken the same nights with the spectra. Since there is no host galaxy spectrum in the NIR, we could not perform host subtraction.
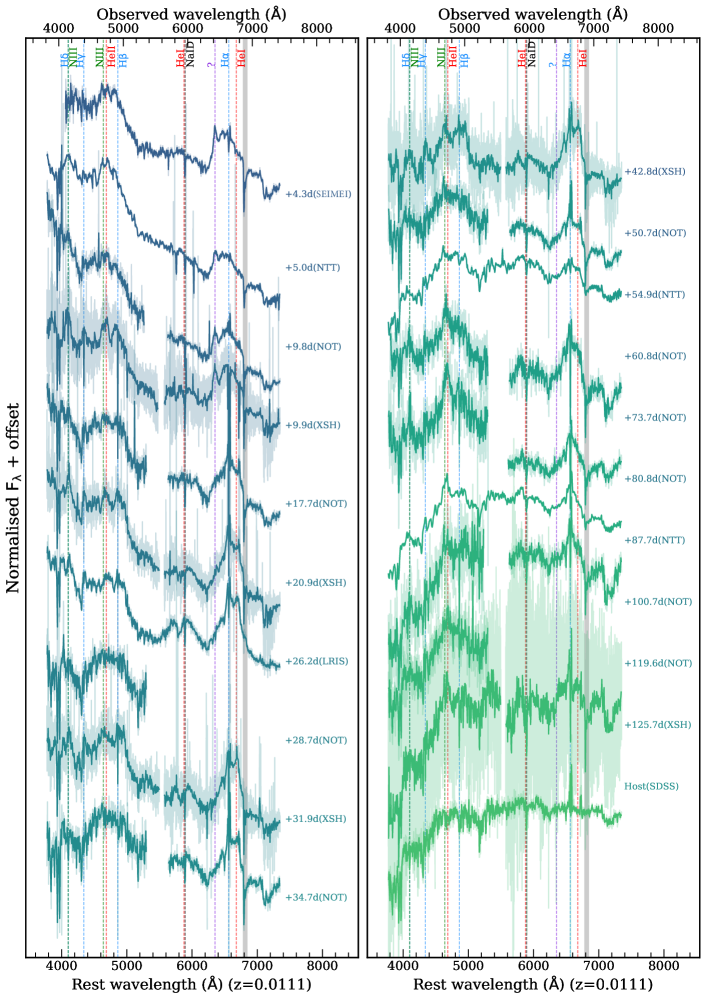
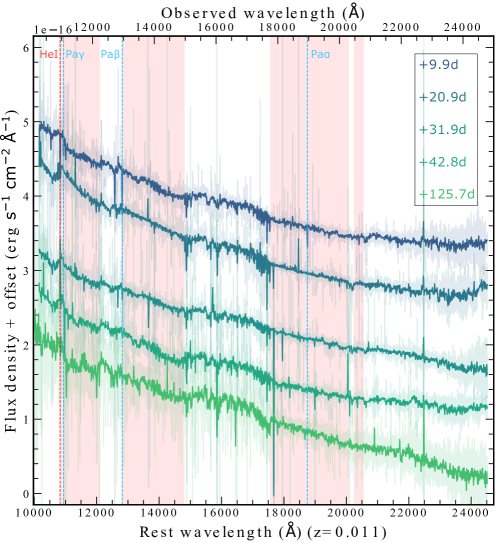
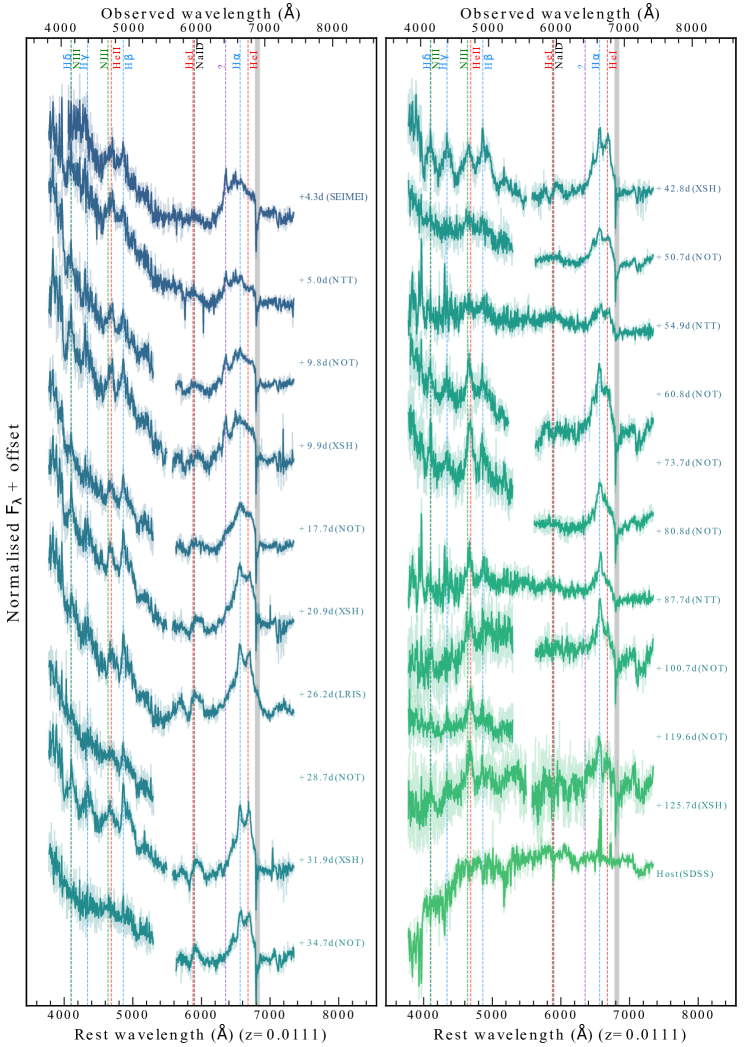
A spectroscopic log is presented in Table 1 (including the slit position angle at each epoch). The effect of host subtraction can be appreciated by comparing Fig. 3 with the non-host subtracted spectral series shown in Fig. 16. The NIR spectra are presented in Fig. 17 in the Appendix.
| UT date | MJD | Phasea | Telescope+Instrument | Grism/Grating | Slit Width | Airmass | Exposure Time | Position Angle |
| (yyyy-mm-dd) | (days) | (arcsec) | (s) | (deg) | ||||
| 2023-02-26 | 60001.58 | 4.3 | SEIMEI+KOOLS-IFU | VPH-blue | - | - | 3600 | - |
| 2023-02-27 | 60002.29 | 5.0 | NTT+EFOSC2 | GR#11 | 1.0 | 1.45 | 1500 | 105.4 |
| 2023-03-04 | 60007.02 | 9.8 | NOT+ALFOSC | GR#18, GR#8 | 1.0 | 1.07 | 1800, 1800 | 56.6 |
| 2023-03-04 | 60007.13 | 9.9 | VLT+XSHOOTER | UVB,VIS,NIR | 1.0, 1.0, 0.9 | 1.63 | 960, 1088, 600 | 136.6 |
| 2023-03-11 | 60014.98 | 17.7 | NOT+ALFOSC | GR#18, GR#8 | 1.0 | 1.12 | 2400,2400 | 60.2, 51.6 |
| 2023-03-15 | 60018.16 | 20.9 | VLT+XSHOOTER | UVB,VIS,NIR | 1.0, 1.0, 0.9 | 1.35 | 1200, 1326, 500 | 154.4 |
| 2023-03-20 | 60023.50 | 26.2 | Keck+LRIS | - | - | - | 300 | - |
| 2023-03-22 | 60025.98 | 28.7 | NOT+ALFOSC | GR#18 | 1.0 | 1.08 | 2400 | 50.3 |
| 2023-03-26 | 60029.11 | 31.9 | VLT+XSHOOTER | UVB,VIS,NIR | 1.0, 1.0, 0.9 | 1.42 | 1668, 1800, 600 | 148.4 |
| 2023-03-28 | 60031.99 | 34.7 | NOT+ALFOSC | GR#18, GR#8 | 1.0 | 1.07 | 2400, 2400 | 35.4, 51.2 |
| 2023-04-06 | 60040.09 | 42.8 | VLT+XSHOOTER | UVB,VIS,NIR | 1.0, 1.0, 0.9 | 1.38 | 1974, 2100, 960 | 148.4 |
| 2023-04-13 | 60047.98 | 50.7 | NOT+ALFOSC | GR#18, GR#8 | 1.0 | 1.04 | 2400, 2400 | 41.2, 7.7 |
| 2023-04-18 | 60052.20 | 54.9 | NTT+EFOSC2 | GR#13 | 1.0 | 1.72 | 3600 | 120.5 |
| 2023-04-24 | 60058.06 | 60.8 | NOT+ALFOSC | GR#18, GR#8 | 1.0 | 1.37 | 3000, 3000 | 61.7 |
| 2023-05-06 | 60070.98 | 73.7 | NOT+ALFOSC | GR#18 | 1.0 | 1.10 | 3600 | 46.8 |
| 2023-05-14 | 60078.01 | 80.8 | NOT+ALFOSC | GR#8 | 1.0 | 1.29 | 3600 | 61.2 |
| 2023-05-20 | 60085.00 | 87.7 | NTT+EFOSC2 | GR#13 | 1.0 | 1.42 | 5400 | 77.9 |
| 2023-06-02 | 60097.94 | 100.7 | NOT+ALFOSC | GR#18, GR#8 | 1.0 | 1.31 | 3600, 3600 | 59.5 |
| 2023-06-21 | 60116.90 | 119.6 | NOT+ALFOSC | GR#18 | 1.0 | 1.3 | 3600 | 61.3 |
| 2023-06-28 | 60122.99 | 125.7 | VLT+XSHOOTER | UVB,VIS,NIR | 1.0, 1.0, 0.9 | 1.48 | 440, 400, 300 | 149.6 |
aWith respect to the date of -band maximum () and given in the rest frame of AT 2023clx ().
4 Analysis
4.1 Host galaxy properties
4.1.1 SED fit and host extinction
We retrieved archival photometry of the host galaxy from the PanSTARRS catalog (Huber et al., 2015) in the filters and from the Sloan Digital Sky Survey (SDSS; York et al. 2000) in the filters. Furthermore, we retrieved archival photometry from the 2 Micron All Sky Survey (2MASS; Skrutskie et al. 2006) in the filters and from the Wide-field Infrared Survey Explorer (WISE; Wright et al. 2010) un-blurred images (un-WISE; Lang 2014) in the filters. The archival photometry is presented in Table 2.
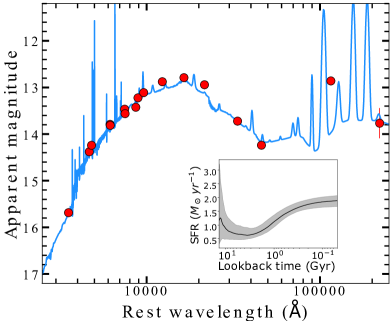
We used PROSPECTOR (Leja et al., 2017) to fit the archival photometry and produce the best-fitting spectral energy distribution (SED) model (see Ramsden et al. 2022 for a description of the methods), which is shownin Fig. 4. We find a stellar mass of and a high specific star formation rate (SFR) of . The reported values and uncertainties are the median and 16th and 84th percentiles of the marginalized posterior distributions. In the figure, we also show the star-formation history versus lookback time since the Big Bang. We find that the SFR of the galaxy around 3 Gyrs ago was 0.6 , when a rise started reaching a plateau of 1.9 . This confirms that this is indeed an unusual TDE host since post-starburst galaxies (typical TDE hosts) show a recent decline in star-formation.
Furthermore, we find a high dust extinction of = 0.177 mag, that translates to = 0.73 mag131313In order to retrieve an from the PROSPECTOR values we followed the discussion in section 3.1.3 of Leja et al. (2017) and references therein. This assumes an for the host.. Inspecting the SDSS spectrum of the host, we also see a very prominent Na I D line which is also strong in the TDE spectra (see Fig. 16 in the Appendix), indicating a potential high host extinction, based on the Poznanski relation (Poznanski et al., 2012). We measure the equivalent width (EW) of the very prominent Na I D line in the SDSS host spectrum to be 1.755 Å. In our first X-shooter spectrum (where the resolution is higher and we can resolve the doublet), we measure 0.808 Å for the Na I D1 line and 0.863 Å for the Na I D2 line. The Na I D line is known to rapidly saturate (as is the case here) which means that we can derive a lower-limit for the extinction ( ¿ 0.3 mag) using the Poznanski relation, corroborating a large host extinction. For this reason, we decide to use the PROSPECTOR estimate for . The fact that two independent methods result in high host extinction values influenced our decision to de-redden our data for the host extinction as well. Another reason that supports our choice is that without the correction, AT 2023clx seems to have a very low blackbody temperature compared to standard optical and UV TDEs (see Sect. 4.2.2). This is one of the first TDE studies to correct for the host extinction since TDEs are typically observed in passive galaxies and negligible host extinctions are assumed. Furthermore, the Na I D lines of the hosts are typically weak suggesting a low host extinction, unlike AT 2023clx. After applying this correction, we find that AT 2023clx is not anymore the faintest TDE but it has an intermediate brightness (see Sect. 4.2). Undoubtedly, assuming an attenuation value and performing a host extinction correction based on that, introduces a large systematic uncertainty to the photometry (and especially in the UV) that propagates to the rest of the values derived by blackbody fitting (like bolometric luminosities and temperatures). However, we believe that assuming a non-zero value will lead to a more realistic estimate of those properties. Assuming negligible attenuation would lead to lower-limits for those properties.
| Filter | Magnitude | Uncertainty |
|---|---|---|
| SDSS u | 15.686 | 0.006 |
| SDSS g | 14.379 | 0.002 |
| PS1 g | 14.241 | 0.001 |
| SDSS r | 13.792 | 0.002 |
| PS1 r | 13.813 | 0.001 |
| SDSS i | 13.466 | 0.002 |
| PS1 i | 13.562 | 0.001 |
| SDSS z | 13.223 | 0.003 |
| PS1 z | 13.425 | 0.001 |
| PS1 y | 13.111 | 0.001 |
| 2MASS J | 12.877 | 0.026 |
| 2MASS H | 12.790 | 0.041 |
| 2MASS Ks | 12.942 | 0.041 |
| un-WISE W1 | 13.722 | 0.001 |
| un-WISE W2 | 14.239 | 0.003 |
| un-WISE W3 | 12.860 | 0.011 |
| un-WISE W4 | 13.767 | 0.324 |
Archival magnitudes of the host galaxy of AT 2023clx NGC 3799 used for the PROSPECTOR fit. All magnitudes are presented in the AB system.
4.1.2 Velocity dispersion and black hole mass
We use the penalized pixel fitting (pPXF) method (Cappellari & Emsellem, 2004; Cappellari, 2017) to measure the line-of-sight velocity dispersion function and we convert it to BH masses using the M- relation from Ferrarese & Ford (2005), following the methods of Wevers et al. (2017). We performed the above routine on both the SDSS archival spectrum and our last X-shooter spectrum ( d), and we measure a BH mass of dex, and dex respectively. The uncertainty estimates include the systematic uncertainty of the relation which is 0.34 dex. The large difference between the measurements (still within 1-) might arise from weak contribution of the transient, even though the emission lines were masked, to the continuum of the X-shooter spectrum.
Finally, we estimate the BH mass based on the empirical relation between the total galaxy stellar mass (which we derived from PROSPECTOR) and the BH mass (Reines & Volonteri, 2015) and we find a mass of dex. Again, the uncertainty estimate includes the systematic uncertainty of the relation which is in this case is 0.55 dex. All the different black hole mass estimates are tabulated in Table 3 along with the corresponding Eddington luminosity estimate and the Eddington ratio based on the peak bolometric luminosity estimate (see Sect. 4.2.2).
4.1.3 Galaxy emission lines and evidence for a LINER
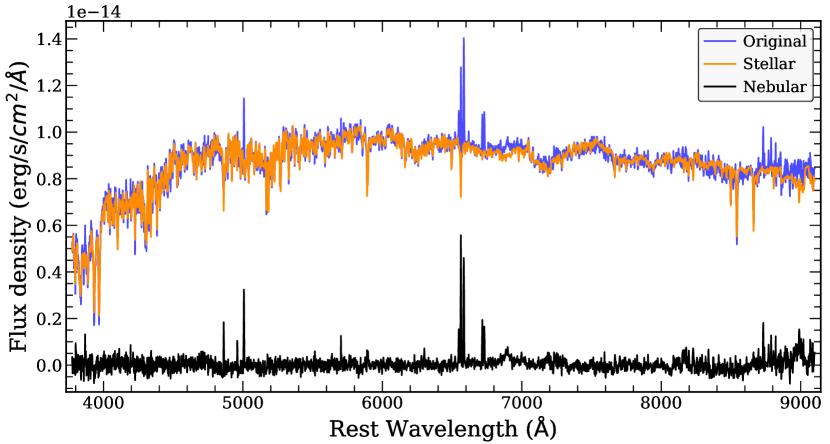
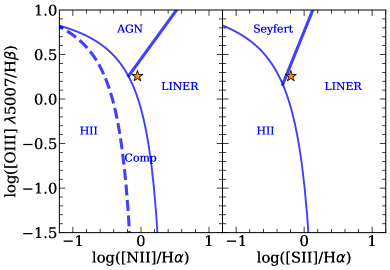
The host spectrum shows narrow emission lines (some of them evident in the TDE spectra as well) including H, [O III] , [N II] and [S II] . The presence of stellar absorption in the continuum often affects the flux of weaker lines. In order to recover the pure nebular fluxes, we fitted the spectrum with the STARLIGHT software (Cid Fernandes et al., 2011). STARLIGHT fits the stellar continuum, identifying the underlying stellar populations in terms of age and metallicity. By subtracting the output synthetic spectrum from the observed data, we isolate the pure nebular continuum, and we manage to identify also H in emission. The spectra are presented in Fig. 18 in the Appendix. We measure the fluxes of the emission lines in the nebular spectrum by fitting Gaussian profiles and we construct a \sayBPT (Baldwin, Phillips & Terlevich) diagram (Baldwin et al., 1981), which is widely adopted to identify the level of nuclear activity in a galaxy. We use two line ratio diagnostics, [N II]/H and [S II]/H against the [O III]/H ratio. The BPT diagrams are shown in Fig. 5. In both diagrams, NGC 3799 falls in the LINER region, however it is very close to the locus of AGN, LINER and star-forming regions. Nonetheless, we do confirm the LINER nature of the host141414https://simbad.cds.unistra.fr/simbad/sim-id?Ident=%401845231&Name=NGC%20%203799&submit=submit.
We also compared the inferred host extinction with that from the STARLIGHT code. The STARLIGHT fit returns a global value of 0.16. However, a subset of models appropriate for stellar populations in nuclear regions show an average visual extinction of 0.7–0.8 mag. That is in agreement with our PROSPECTOR host extinction estimate. Although reassuring, we stress that there are well-known degeneracies between age and metallicity that need to be accounted for.
4.2 Photometric analysis
4.2.1 Broadband light curve evolution
From a fourth degree polynomial fit to the ASAS-SN -band light curve, we constrain the peak date to MJD . The resulting peak magnitude is mag ( mag). Given that the last non-detection was on MJD 59986.3 and the first detection at MJD 59 987.3, the rise time to peak is days, making AT 2023clx the fastest rising TDE to date. The rate of brightening from first detection to peak is estimated to be mag/day.
Concerning the decline, we see two distinct phases in the broadband light curve: in the bluest UVOT bands there is a \saydip around 18-28 days post-peak, of mags in three epochs in -band and of mag seen clearly in one epoch in the -band. Here, it is important to note that we propagated errors during the process of the host subtraction and the host extinction correction which enlarged the original error-bars of the photometry. In the non host subtracted and non de-reddened light curves the errors are smaller, making the dip of larger significance (2.3) than the 1.5 that is here. We fit power-laws () to the light curves (, , , , ): the first two could not be fit with a single power-law hence we fit two power-laws to their light curves, one before including the early data and the \saydip, and one including everything after the \saydip. In , we find = for the former and = for the latter. In , we find = for the former and = . For all other bands,, we obtain satisfactory fits with a single power-law and we find = in , = in and = in . All the above fits are plotted in Fig. 2. Further discussion about the nature of this \saydip or \saybreak can be found in Sect. 5.3.
4.2.2 Bolometric light curve
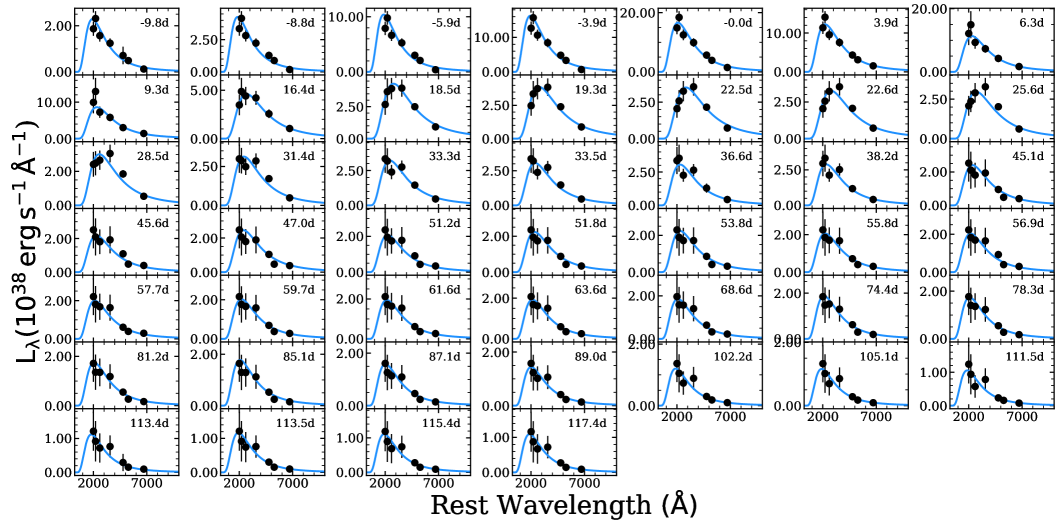
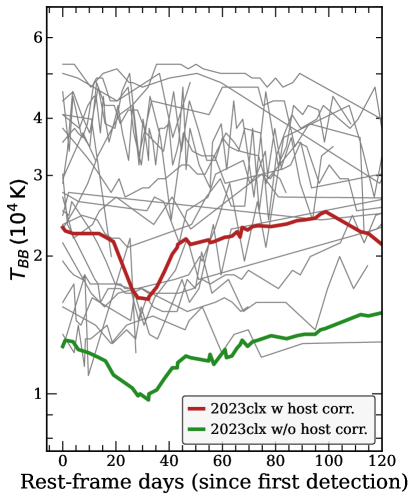
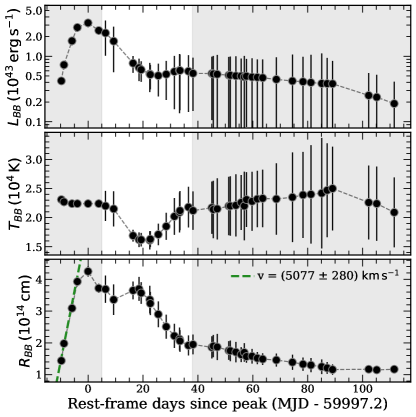
We construct the bolometric light curve of AT 2023clx by interpolating or extrapolating the host subtracted and de-reddened photometry of each band in time, to any epoch with data in the band (defined as the reference filter), using SUPERBOL (Nicholl, 2018). We interpolate the light curves using polynomials of third to fifth order and we integrate under the SED of each epoch (from 1 to 25000 Å) to get the luminosity. We fit a blackbody function to the SED in order to estimate the temperature and the radius, and also to calculate the missing energy outside of the observed wavelength range. Since our first UVOT epochs were observed five days post-peak, we extrapolated before this epoch assuming constant colours. We base this choice on the fact that TDEs having a generally constant colour evolution (e.g. Holoien et al. 2019; van Velzen et al. 2021; Yao et al. 2023) and because of the persistent blue colour of the spectra in all the early epochs (see Fig. 3). The bolometric light curve, temperature and radius evolution are plotted in Fig. 6. The epochs for which we used the constant colour extrapolation method are shaded with grey colour and – especially for the late epochs where the uncertainties of the photometry are also larger – the effect is also evident in the large error-bars. The blackbody fits are presented in Fig. 19 in the Appendix.
The bolometric light curve analysis shows a blackbody temperature in the range K. However, there is a \saydip in the temperature evolution around 10–30 days post-peak, driven by the drop in the and magnitudes around these epochs (see Fig. 2 and Sect. 4.2.1 as well as Sect. 5.3 for further discussion). Interestingly, this is when we see the emergence of He I in the spectra, most likely associated with the sudden temperature drop, as He II recombines to He I. During this phase, the temperature drops to a minimum of K around d post-peak, then rises back to K (where it was before the \saydip) and after that remains almost constant or slowly rises. Concerning the radius of the blackbody photosphere, it rises to a value of cm peak, then it starts contracting before showing a secondary peak ( cm) in the epochs where the temperature drops, and after that it keeps contracting. We fit the expansion of the radius before the peak (the first four data points) with a constant velocity and we find a best fit value of (i.e. 0.017c). The velocity of the expanding photosphere is very fast compared to other TDEs where the expansion of their photosphere was fit with a constant velocity: for AT 2019qiz (Nicholl et al., 2020), for AT 2020zso (Wevers et al., 2022b), for AT 2020wey (Charalampopoulos et al., 2023b). For the fit, we used the lmfit151515https://lmfit.github.io/lmfit-py/ package (Newville et al., 2021), with a Levenberg–Marquardt algorithm (i.e., least-squares method).
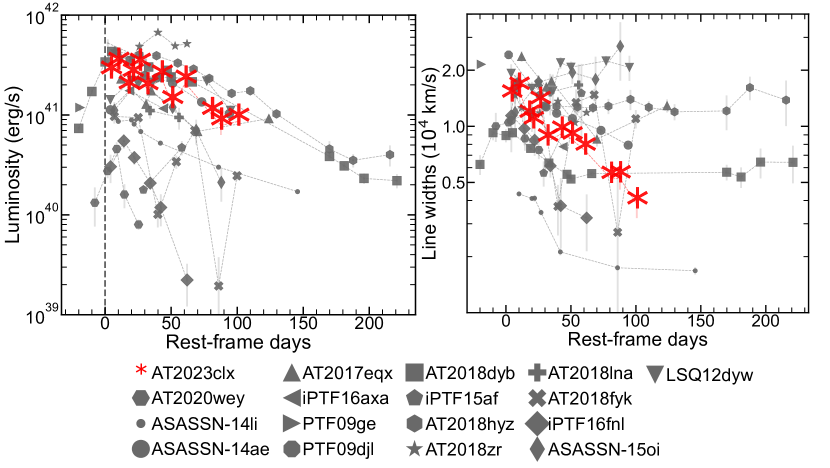
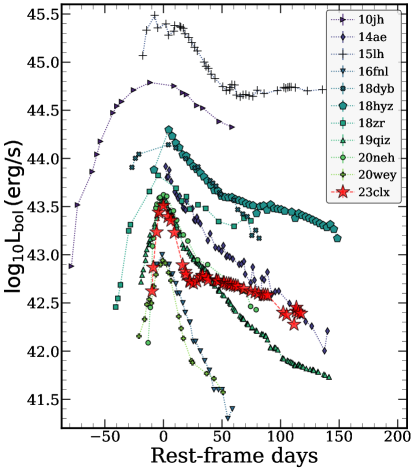
In Fig. 7, we plot the bolometric light curve compared to other well observed TDEs studied in Nicholl et al. (2020) and Charalampopoulos et al. (2023b), as well as the super-luminous transient ASASSN-15lh (data from Leloudas et al. 2016). AT 2023clx is in the intermediate luminosity region with a peak bolometric luminosity of , having similar peak luminosities as AT 2019qiz (Nicholl et al., 2020; Hung et al., 2021; Short et al., 2023) and AT 2020neh (Angus et al., 2022). It also shows similar rise times with the latter, which was an exceptionally fast TDE candidate. Further discussion on the fast timescale can be found in Sect. 5.1. AT 2023clx also declines very fast during the first thirty days post-peak, when it slightly re-brightens and then declines slower. Similar behaviour is seen in AT 2018hyz and ASASSN-15lh. Based on the different black hole mass estimates (see Sect. 4.1.2 and 4.2.3) and on the peak bolometric luminosity above, the Eddington ratio ranges from 0.1 to 0.5, hence sub-Eddington luminosities but still on the high-end of typical optical and UV TDEs. We note here that if we had not applied the host extinction de-reddening, those values would range from 0.01 to 0.1, somewhat low compared to typical TDE values. On a similar note, in Fig. 20 of the Appendix, we plot the blackbody temperature evolution of AT 2023clx with and without the host galaxy extinction de-reddening, compared to the TDEs presented in Hinkle et al. (2021). Without applying the host galaxy extinction, the temperature of the TDE would be very low, further supporting the need for correcting the data for the host galaxy extinction.
Concerning the NIR imaging, we detect IR emission in the first three epochs of our NOTcam observations, as shown in Fig. 2. In order to assess the nature of the emission, we compare the IR fluxes to a blackbody fit to the UV and optical fluxes, interpolated to the same epoch as the NIR observations through the power-law fits presented in Fig. 2. For the first NIR epoch, the IR fluxes are consistent with the tail of the UV and optical blackbody Fig. 6, which at this phase of d has a temperature of K . However, for the second and third epochs ( d and d respectively), the IR detections are in clear excess of the UV and optical blackbody. We simultaneously fit the UV, optical and IR SED with two blackbodies and derive the associated parameters and uncertainties using the emcee python implementation of the Markov Chain Monte Carlo (MCMC) method (Foreman-Mackey et al., 2013). We find that the additional blackbody has a temperature of K and a radius of cm at d and a temperature of K and a radius of cm at d. In both cases, the UV and optical blackbody parameters are consistent with a single blackbody. The decreasing temperature and increasing radius is consistent with an IR echo for this emission (e.g. Lu et al. 2016; van Velzen et al. 2016). The luminosity of the IR blackbody from the Stefan–Boltzmann law, gives and at the second and third epochs respectively, with large uncertainties arising from the uncertainty in the radius. These luminosities are % of the UV and optical blackbody luminosity at those epochs, indicating a rather low covering factor of dust, in agreement with previous observations of TDEs (Jiang et al., 2021).
| Method | () | () | |
|---|---|---|---|
| M- (SDSS) | 6.490.39 | 4.02 | 0.08 |
| M- (X-shooter) | 5.710.40 | 0.67 | 0.49 |
| - | 6.460.74 | 3.75 | 0.09 |
| MOSFiT | 5.910.28 | 1.06 | 0.31 |
4.2.3 TDE model fit
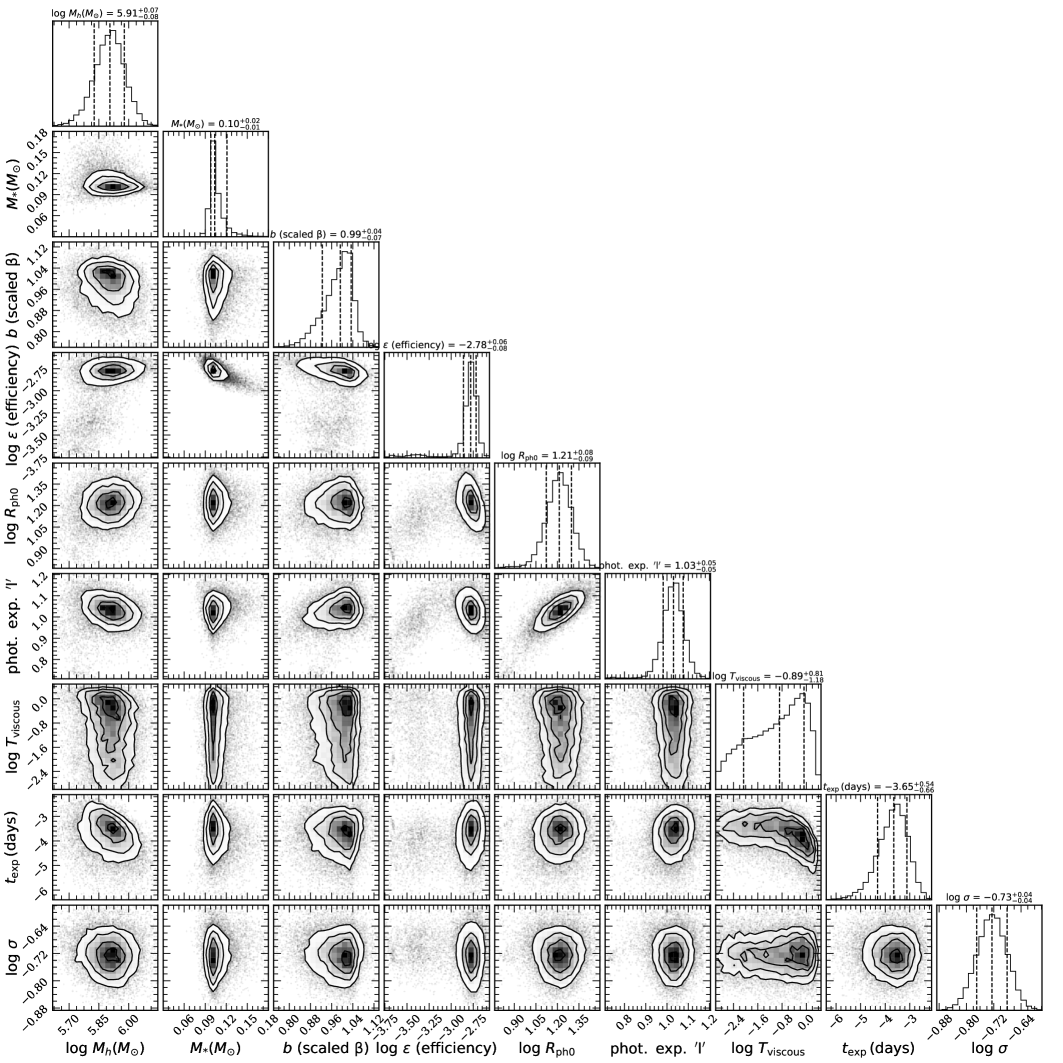
We fit our host subtracted, multi-band light curves using the Modular Open Source Fitter for Transients (MOSFiT; Guillochon et al., 2018) with the TDE model from Mockler et al. (2019) in order to estimate physical parameters of the disruption. This model assumes a mass fallback rate derived from simulated disruptions of polytropic stars by a SMBH of (Guillochon et al., 2014), and uses scaling relations and interpolations for a range of black hole masses, star masses, and encounter parameters. We ran MOSFiT using dynamic nested sampling with DYNESTY (Speagle, 2020) in order to evaluate the posterior distributions of the model.
For our MOSFiT runs, we used several different configurations and combination of priors. For example, we considered fits with and without correction for host extinction, removing and data before the \saydip, or after the \saydip). In all cases, the returned stellar mass parameter () invariably converged to 0.1 . In order to investigate this behaviour further, we fixed the stellar mass to and allowed it to vary only between . In the former case, it was clear that the match was poor in the sense that neither the rise time, nor the peak was reproduced. In the latter case, the fit converged at the higher bound (i.e. 0.09 ) and the fits were virtually indistinguishable from those when the stellar parameter was left free to vary. For the parameters listed in Table 4, the model light curves reproduce the salient features in each band (see Fig. 8). We list the free parameters of the model (as defined by Mockler et al. 2019), their priors and their posterior probability distributions in Table 4, with two-dimensional posteriors shown in Fig. 21. Mockler et al. (2019) calculate the systematic uncertainties of MOSFiT TDE fitting and report a 0.2 dex uncertainty in the BH mass and a 0.66 dex in the stellar mass. The model returns a SMBH mass of dex, in between (and within 1-) the M- relation estimates using the X-shooter spectrum ( dex) and the SDSS spectrum ( dex).
| Parameter | Prior | Posterior | Units |
|---|---|---|---|
| M⊙ | |||
| M⊙ | |||
| days | |||
| days | |||
4.3 Spectroscopic analysis
4.3.1 Line identification
After host subtracting (see Sect. 3.5) and de-reddening the spectra, we can identify the emission lines that are present in the spectra. There are strong and broad Balmer lines in the spectra with H being the most prominent. We also identify He II 4686, typical in TDE spectra and, especially after 20 days post-peak, we start seeing He I 5876. A very interesting and puzzling feature of AT 2023clx is a sharp, narrow emission peak at a rest wavelength of 6353 Å, on top of the blue side of the broad H profile. This feature is clearly present in the first four spectra ( d, d, d, d) taken with three different telescopes and spectrographs, showing that the feature is real and not an artefact. In the two spectra at d and d, the sharp peak is not there anymore, however it seems there is a bump in the blue wing of H. Then, from a month post-peak until our last spectrum, there seems to be a much fainter and less prominent feature at 6450 Å. In the two spectra at d and d, H develops a sharp peak centered at zero velocity on top of the broad profile, that remains centered around zero velocity until our last spectrum ( d). In the spectrum at d, a sharp peak also emerges at He I 6678. We robustly identify this line as He I 6678 because, apart from being in the He I wavelength, it emerges simultaneously with He I 5876 and both these lines start becoming weaker in the d spectrum and onward. A peculiarity of the He I 5876 line however is that, during the first epochs at least, it seems redshifted and an absorption feature is present on the blue side of the rest wavelength. The latter might be an artefact of the host subtraction, especially since the prominent Na I D line is in this region of the spectrum as well. Furthermore, the (non host subtracted) NIR-arm spectra (Fig. 17) show the He I 10 830 line but no evident hydrogen lines from the Paschen series. The He I line is more prominent in the intermediate phases spectra ( d, d, d), coincident with the emergence of the optical He I lines. Finally, we cannot rule out neither robustly identify the Bowen Fluorescence N III lines as one () is blended with He II and a potentially very broad H structure and the other () is blended with the H line in an also heavily blended region, where the continuum is very steep and blue. However, there might be an indication for the latter, as H appears stronger than H in some of the early spectra but because we do not see that in all the spectra and because this is where the S/N starts deteriorating, we cannot confirm its presence.
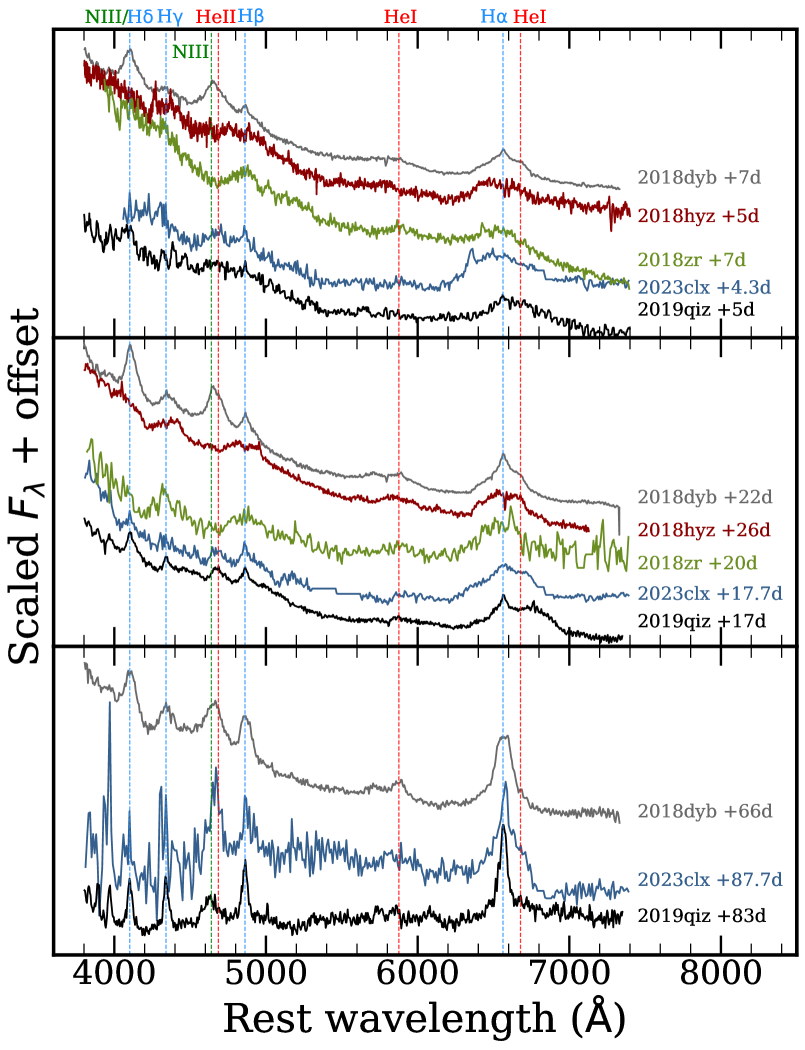
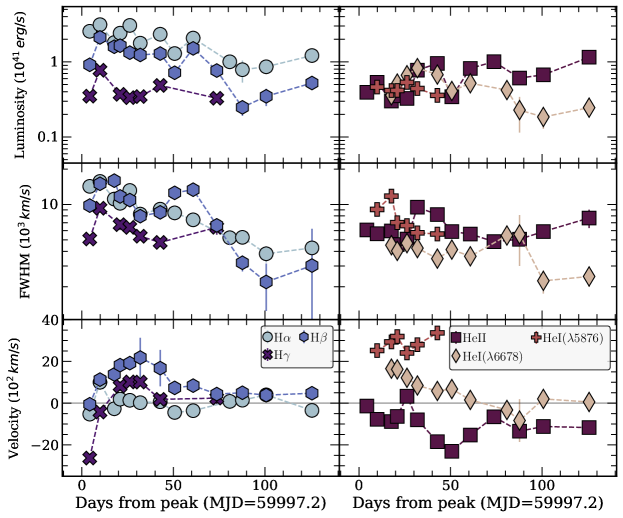
In Fig. 9 we present a (host subtracted) spectral comparison of AT 2023clx with other TDEs throughout different phases of its evolution. The spectra share many similarities, most importantly a blue continuum that cools slowly with time and broad Balmer and He II lines as well as a weak He I 5876 emission, features that are typically seen in TDEs. Furthermore, in the peak epochs (top panel) they all show an extended red wing, attributed by theory and models to early optically thick outflows and electron scattering (Roth & Kasen, 2018). In the intermediate epochs (middle panel) some of the TDEs show a potential second bump on the red side of H, tentatively identified in the literature as He I 6678 (e.g. Leloudas et al. 2019). Also, the H line narrows with time in all the TDEs (evident in the bottom panel; see Sect. 4.3.2 for quantification of the spectral properties and comparison with other TDEs). Finally, we note that there is a remarkable similarity in line profiles and continuum shapes with AT 2019qiz, the TDE that AT 2023clx has similar luminosities with.
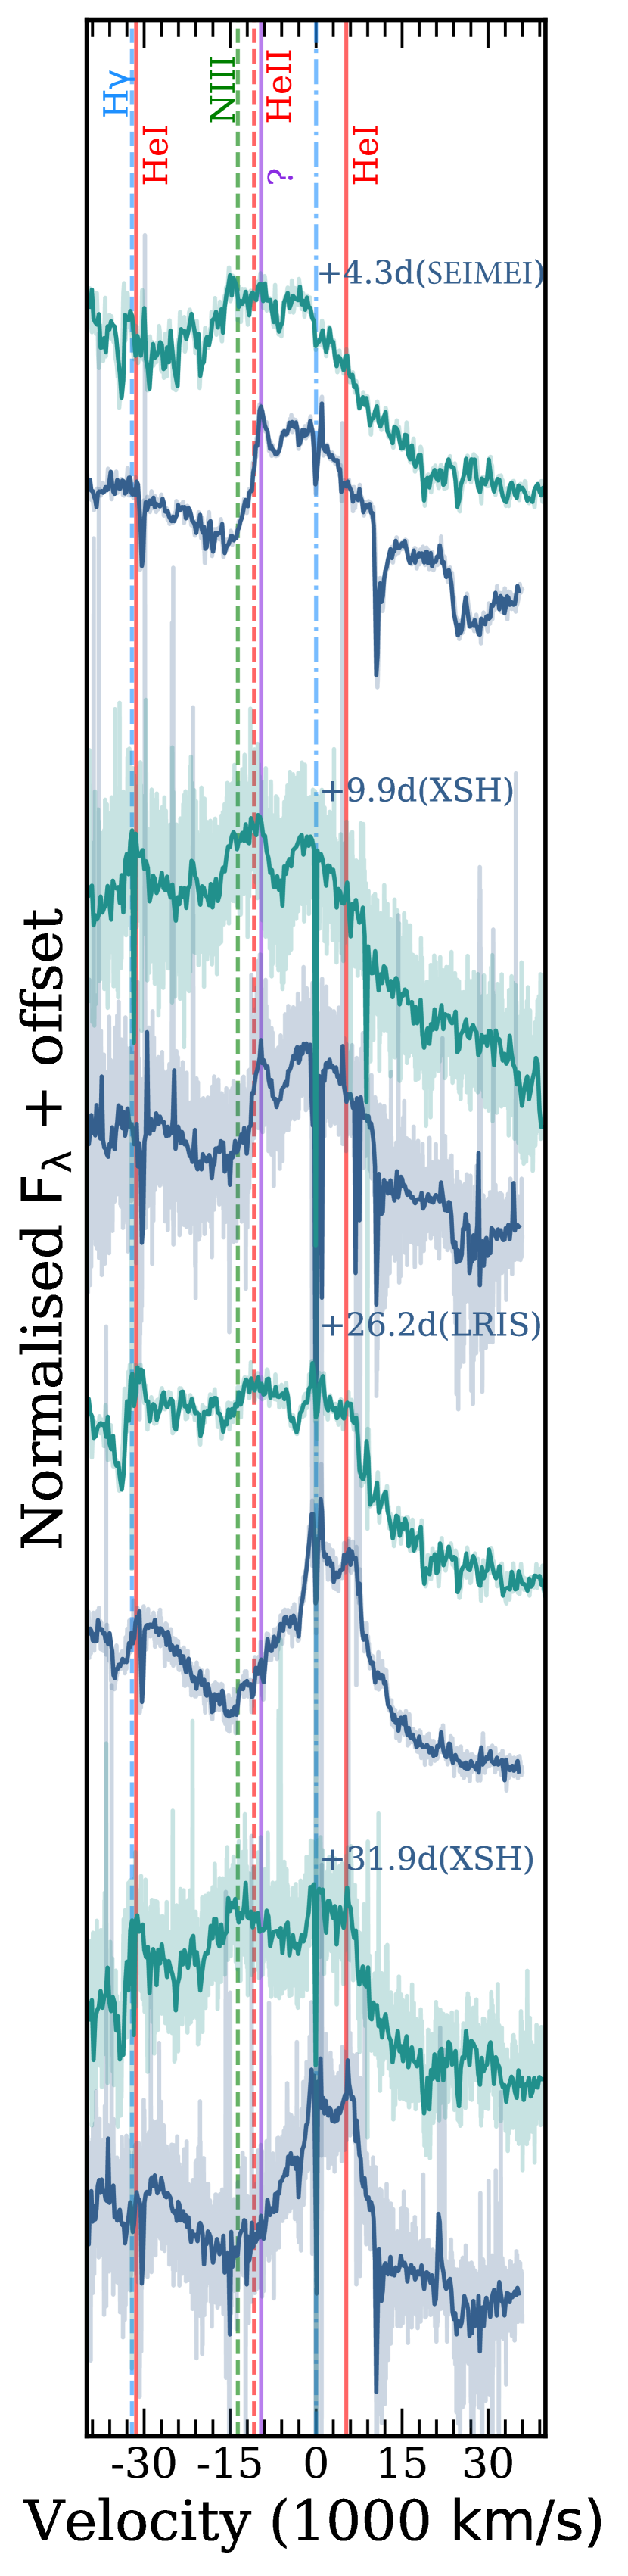
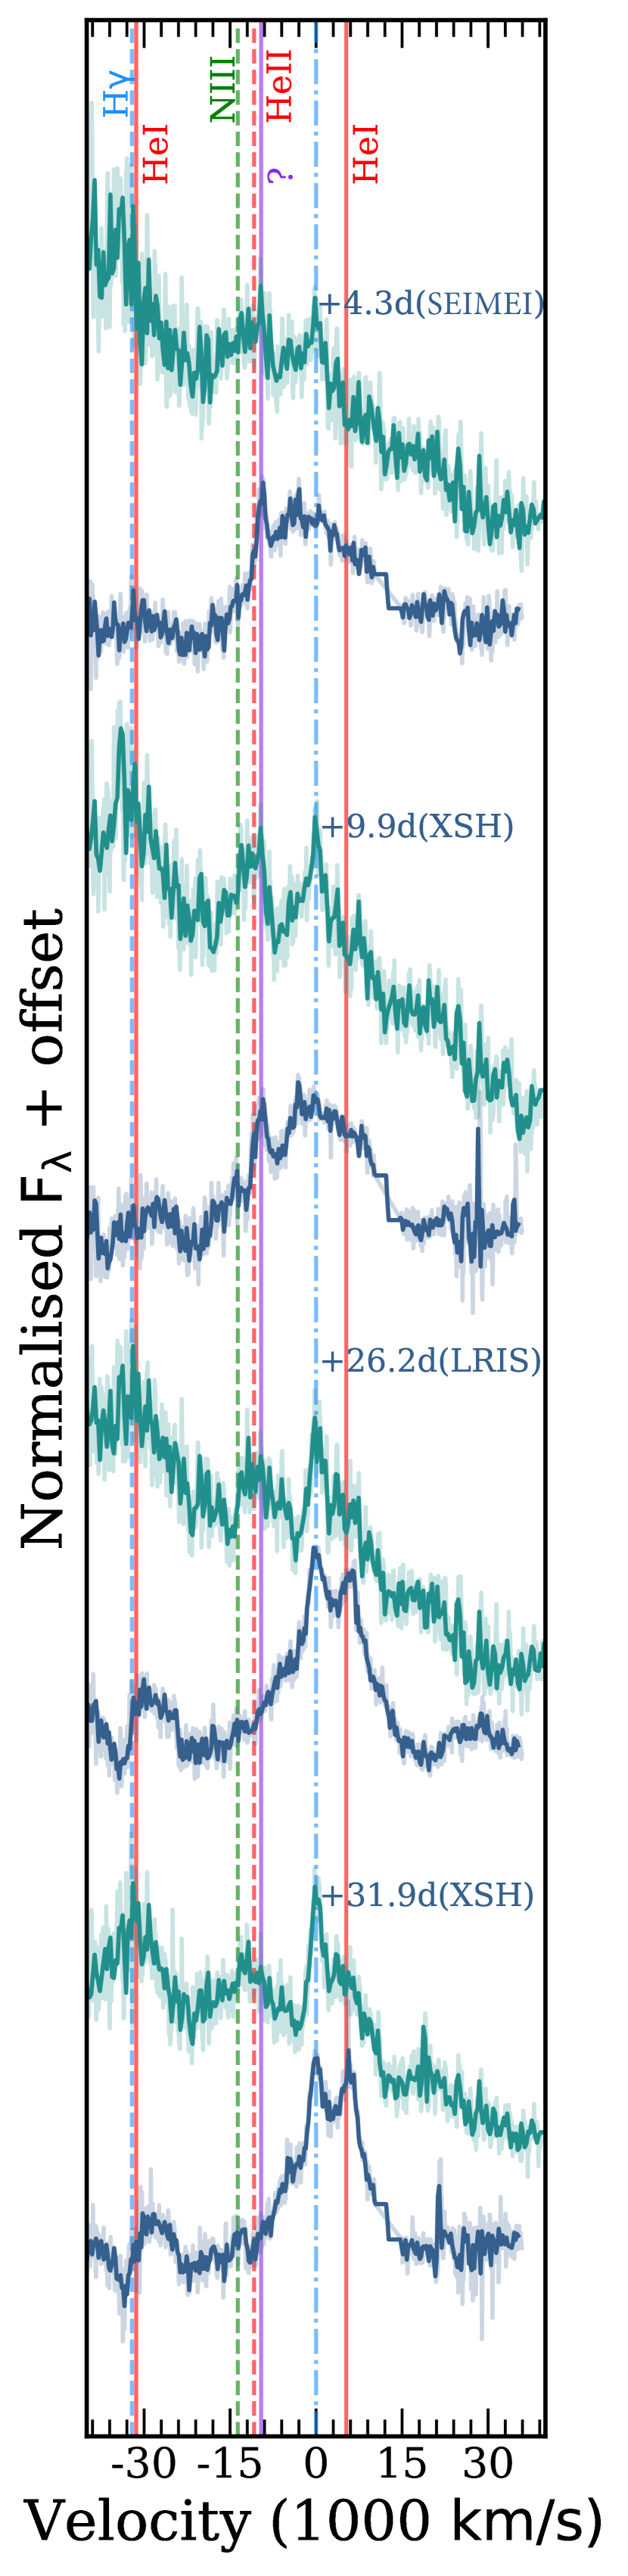
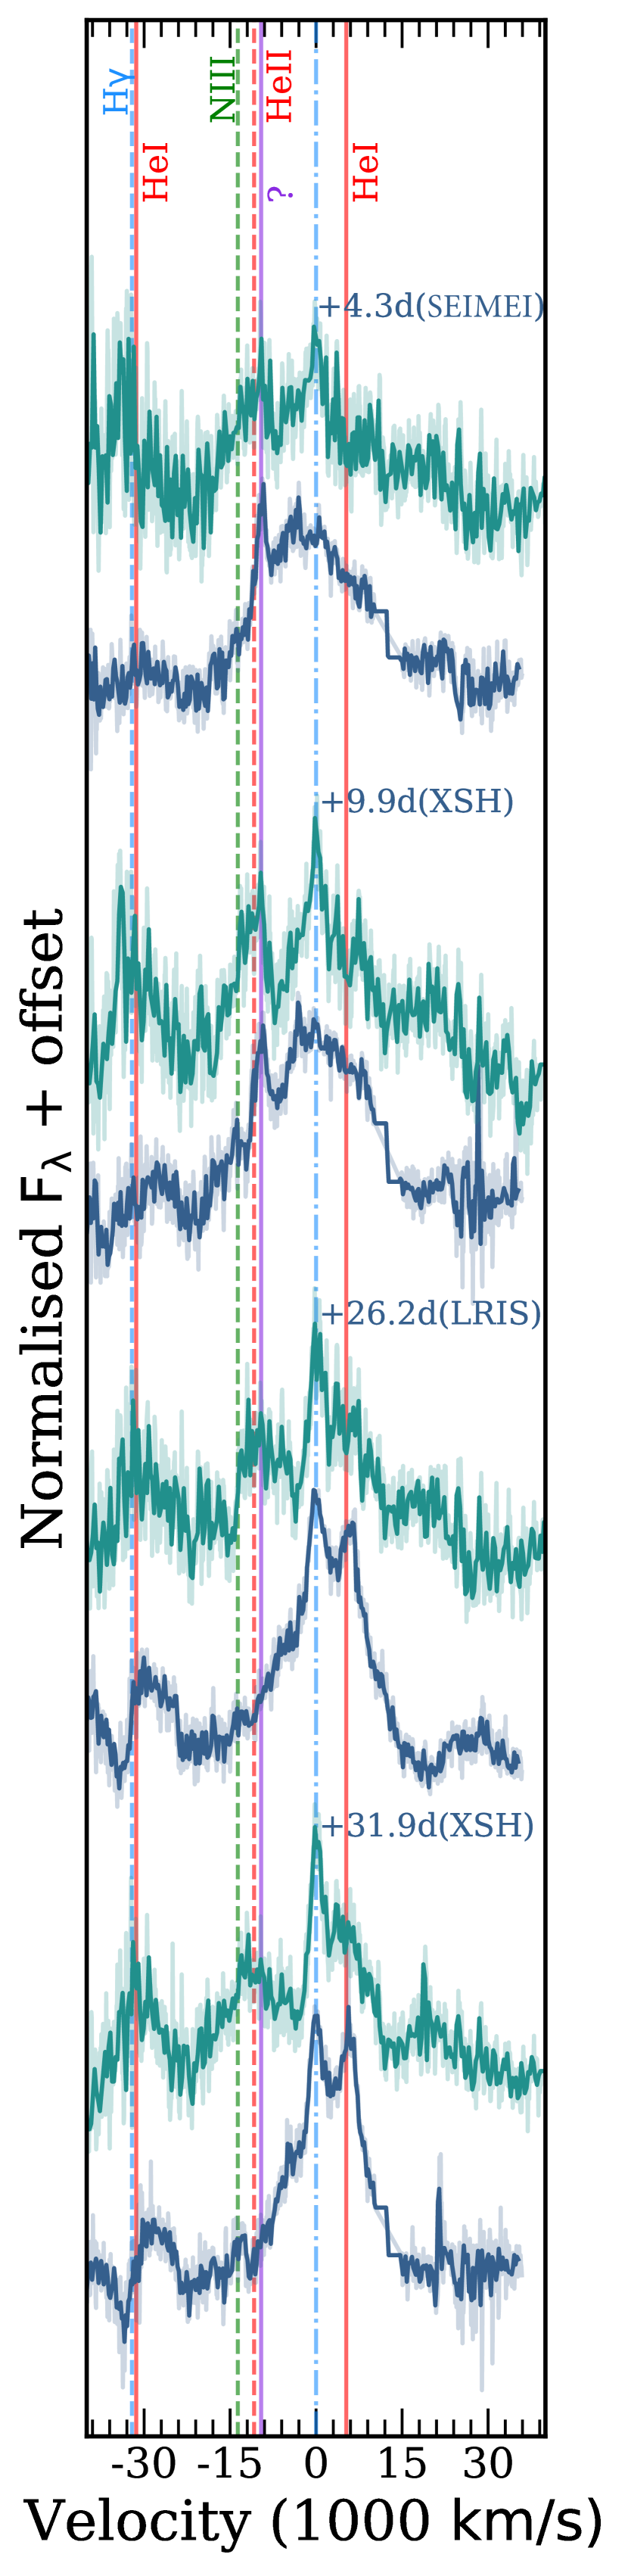
The short-lived emission feature at 6353 Å does not seem to coincide with any known wavelength of any emission line, at least prominent in TDEs. The wavelength coincides with Si II 6347,6371 however this line usually appears in supernovae (SNe) and in absorption. So we discard the silicon interpretation. Another option is that the feature is a fast moving component of H directed towards the observer with 9 584 . We look for a similar component with the same velocity offset on the blue side of H but this wavelength is almost identical with He II , hence it is hard to confirm or disregard the scenario because the He II peak is already there. In order to look at the emission features without the underlying continuum slopes, we subtracted the continuum by fitting fourth and fifth degree polynomials in the line-free regions of the spectra. In order to let the reader visually inspect all the above probabilities and make their own judgement, we present in Fig. 10, the H and H regions in velocity space of four high S/N spectra, two that include the feature at 6353 Å ( d and d) and two that do not ( d and d). From left to right, we show the original spectra without any subtraction, the host subtracted only spectra, and the host subtracted and continuum subtracted spectra. A longer discussion about the peculiar emission feature at 6353 Å can be found in Sect. 5.2.
4.3.2 Line fitting
We decided to study and fit the following lines: H, H, H, He II , He I and He I . In the first four spectra, we also fit the feature at 6353 Å. Following the procedures of Charalampopoulos et al. (2022), we fit the continuum subtracted spectra with both Gaussian and Lorentzian profiles and we find that the Lorentzians provide the better fit, as they both reproduce better the sharp peaks of, for example H and He I , and they give a better fit to the wings of the lines, especially when they are blended. The Lorentzians provided, in general, better chi-square values as well. In this way, we quantify the line luminosities, the velocity widths and the velocity offsets of the six lines mentioned above. We present the results in Fig. 11. The Balmer lines seem to have identical behaviour, their luminosity and width rise between 5–10 days post peak before they start to decline smoothly onward. The lines slowly become narrower with time as their luminosity drops, in contrast with AGNs where a decrease in luminosity is accompanied by an increase in line widths (e.g., Peterson et al. 2004; Denney et al. 2009). In Fig. 22 in the Appendix, we show the comparison of the H luminosity and width of AT 2023clx, against the TDEs of the sample of Charalampopoulos et al. (2022). We find that AT 2023clx has one of the brightest H compared to other TDEs and that the luminosity of the line declines smoothly and not very fast. We note that during the temperature minimum discussed in Sect. 4.2.2, H is very strong in luminosity, potentially leading to an overestimation of the blackbody temperature during those epochs.
5 Discussion
In the fist three sub-sections of this section, we discuss three distinct features of AT 2023clx in order of appearance, and attempt to combine them in a single scenario in Sect. 5.4.
5.1 The fast rise
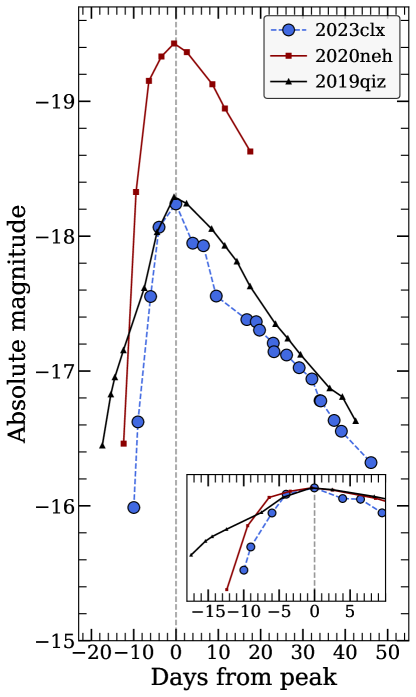
It has been suggested that the rapid rise of some TDEs could be correlated with low black hole mass (e.g. Gezari 2022). That means that IMBHs could be probed by fast-rising TDEs, and such candidates have been discovered; the spectacular fast blue optical transient AT 2018cow was suggested to be a TDE from an IMBH (Perley et al., 2019) and AT 2020neh was proposed to be the fastest rising TDE recorded, around an IMBH (Angus et al., 2022). In Fig. 12 we compare the early -band light curves of AT 2023clx against those of AT 2019qiz which is a fast TDE of similar luminosity to AT 2023clx, and AT 2020neh which is the fastest TDE to date. The inset figure shows the same data but normalised to peak light. AT 2023clx rises faster than both of those fast TDEs making it the fastest rising TDE recorded. Our average SMBH estimate (see Table 3) – excluding the high scatter estimate based on the empirical relation between the total galaxy stellar mass and the BH mass – is . We use this estimate for the rest of the manuscript. This estimate is too high for IMBHs that have masses , and lies firmly towards the lower mass range when compared to other TDEs. Thus, the fast rise of AT 2023clx cannot be directly attributed to the BH mass.
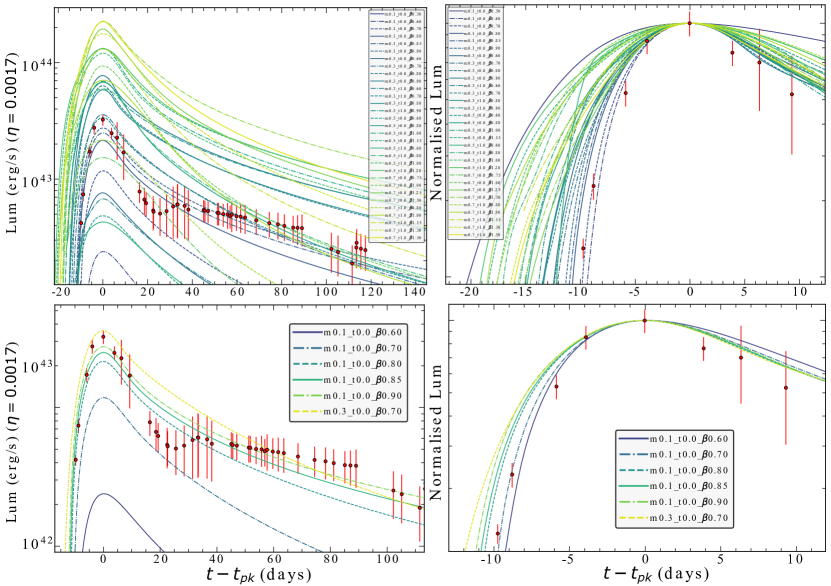
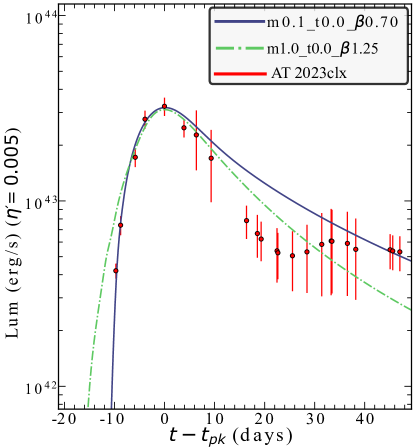
Law-Smith et al. (2020) presented a library of TDE simulations161616https://github.com/jamielaw-smith/STARS_library providing the mass fallback rate to the BH for a main-sequence (MS) star of any stellar mass, stellar age, and impact parameter, with realistic stellar structures and compositions. Conveniently for us, they used a BH mass in order to calculate their mass fallback rate models. This mass is identical to our average BH mass estimate for AT 2023clx. The impact parameter is defined as the ratio of the tidal radius to the pericenter distance; it is a measure of the \saystrength of the tidal interaction. The critical impact parameter () is defined as the smallest impact parameter for which full disruption can be achieved (where all the star’s mass is disrupted); below this critical value a partial disruption will occur. The scaled impact parameter is the ratio of the impact parameter to the critical one (i.e. ). The mass fallback rate is translated to bolometric luminosity through , where is the radiative efficiency. Law-Smith et al. (2020) find that, in general, less centrally concentrated and less massive stars have steeper mass fallback rate rise slopes and shallower decay slopes. This motivated us to compare the bolometric luminosity evolution of AT 2023clx against the models of Law-Smith et al. (2020) that could simultaneously match the rising luminosity rate and the peak luminosity, after converting the mass fallback rates to luminosity assuming an value. Our MOSFiT fits returned a best-fit value of that we used as our initial guess in converting the mass fallback rates. In Fig. 23 of the Appendix, we show the comparison of the bolometric luminosity evolution of AT 2023clx, against many of those mass fallback rate models. In the left panels the luminosities are not normalised while in the right panels the luminosities are normalised to peak light. In the panels, we indeed see that TDEs occurring from higher mass stars have shallower rises while lower mass stars should lead to faster rising light curves, as discussed by Law-Smith et al. (2020). Concentrating on lower mass and zero-age main sequence (ZAMS) stars that seem to better match with AT 2023clx evolution (bottom panels of the figure), we find models that have similar peak luminosities and rise times with AT 2023clx. Especially a model of a ZAMS star disrupted with an impact parameter of () shows an almost identical rising luminosity rate. Converting the mass fallback rate of this model with set to 0.005, we find also a match in peak luminosity. We also show the comparison with a fast rising model which still shows a slower rise time than AT 2023clx and that needed an unrealistically low efficiency parameter of 0.0003 in order to match the peak luminosity. We present the comparison of these models and AT 2023clx in Fig. 13. The model and the data show a nearly-identical rising rate. Also, the decline of AT 2023clx after the NUV break, is better described by the shallower decline of the model. Furthermore, the stellar mass of this model () agrees with our MOSFiT estimate where, as discussed in Sect. 4.2.3, the stellar mass best-fit value converges to . Also, we get a best-fit value for the scaled impact parameter , in broad agreement with the one of the model () as the MOSFiT systematic error was calculated by Mockler et al. (2019) to be . Hence, we suggest that AT 2023clx was caused by the disruption of a low-mass star (), with low central concentration () and a small radius (). The TDE could also have been caused by the disruption of a brown dwarf (). Such TDEs should exist and early modelling showed that they should indeed have steep rises and sub-Eddington luminosities (Law-Smith et al., 2017). In terms of observations, there were two early TDE candidates, suggested among other scenarios to be the disruption of brown dwarfs (Li et al., 2002; Nikolajuk & Walter, 2013). However, those candidates occurred before the era of optical wide-field surveys and were detected only in X-rays. Detailed modelling is needed in order to understand if the unique properties of AT 2023clx are caused by the disruption of a brown dwarf and how different the resulting observables would be in comparison with the disruption of a low-mass MS star.
5.2 The 6353 Å emission feature
The 6353 Å emission feature present in our first four spectra ( 4 – 10 days post-peak) is puzzling as it is the first time that it is detected in a TDE. One possibility that we considered is whether this feature is [O I] caused by far-UV (FUV) pumping. This mechanism requires a source of FUV photons (which exists in TDEs) which is absorbed by oxygen atoms that get excited to higher bound levels, followed by a cascade of radiative or collisional de-excitations leading to the upper levels of the forbidden lines. This interpretation would be consistent with the fact that we see the quick early decline in the NUV bands and the subsequent rise, coinciding with the disappearance of the emission feature. Typically, these [O I] lines would be at 6300,6364 and 5577 (Nemer et al., 2020). However, the central wavelength of the line is at 6353 Å. It could potentially be a blend of [O I] 6363 and 6300, however one would expect that the central wavelength would be closer to 6300 since this typically the stronger transition (with a ratio of 3 to 1 compared to the 6363, based on the Einstein coefficients). The fact that the line is narrow and there is almost no flux at 6300 weakens the possibility that the feature is indeed [O I] triggered by FUV pumping, although we cannot completely disregard this scenario.
Another possibility is that this is a high velocity hydrogen component related to H. This would require a velocity of 9 584 with a direction towards the observer (since the line is blueshifted if indeed related to H). Looking for a similar component with the same velocity offset on the blue side of H does not confirm or reject the scenario because this wavelength is almost identical with He II , and He II is still there when the 6353 Å feature disappears (see the line identification discussion as well on Sect. 4.3.2). The feature might disappear from the 6353 Å wavelength but it potentially slows down and drops in flux, since we see an extended wing/peak bluewards from the H central wavelength, for several epochs after the 6353 Å feature disappears (see spectra of d to d post-peak). The feature is relatively narrow (compared to typical TDE line widths); the full-width at half-maximum (FWHM) of the line is in the first two spectra ( d and d) and slightly rises to in the next two spectra ( d and d) before it disappears. This makes it six times narrower than the broad H profile seen in AT 2023clx. Based on these velocity widths, if the emitting material was pre-TDE-existing, that is, material surrounding the SMBH of the LINER, a Keplerian estimate of the distance from the central object would be cm. However this cannot explain the 9 584 blueshift (i.e. high velocity towards the observer). If this clumpy material is launched from the TDE, it could be preceding the bulk of an outflow. The bulk of this outflow would set the profile of H, and would match the simulated profiles of Roth & Kasen (2018) that suggested that electron scattering within an outflow would lead to early blueshifted H with an extended red wing, similar to what we see in the first epochs of AT 2023clx (see for example the top spectrum in Fig. 10 panel c). Hence, the 6353 Å emission feature could be clumpy material preceding the bulk of the outflow with a velocity of 9 584 , ionised by the light of the rapidly expanding blackbody photosphere, and recombining in order to radiate the Balmer line photons. In the outflow picture of Metzger & Stone (2016), the outflow has a velocity (see their Equation 12) which, if we solve for the parameters of AT 2023clx (, , , =0.005), would give 9 922 . This number ties nicely with the blueshift of the peculiar emission feature ( 9 584 ) as well as with the spread of velocities (FWHM) that the H line shows (see Fig. 11; middle panel), dictated by the bulk of the trailing outflow. So, in the picture of Metzger & Stone (2016) (see their figure 1), the outflow would be directed towards the observer. Within the viewing angle dependant reprocessing TDE scenario (e.g. Metzger & Stone 2016; Dai et al. 2018), that would explain the lack of detected X-ray emission and a potential very early ( d post-peak) radio detection (Sfaradi et al., 2023), similar to the radio detections of AT 2019qiz (Nicholl et al., 2020).
Law-Smith et al. (2020) also find that for a less centrally concentrated star, the outer layers are less vulnerable to tidal disruption and this material is then less stretched out post-disruption. This means that some structure in the debris is preserved and that the outflow would be less spherical. The fact that the debris are less spread could create the needed \sayclumpy nature of the high velocity component and the lack of sphericity might allow the H detection of the high velocity clumpy material, not seen in other TDEs. Deviation from outflow sphericity could also be caused by a highly spinning SMBH, as the debris streams might collide with an offset due to Lense-Thirring precession (Jankovič et al., 2023).
Another option would be that this high velocity material is post-disruption unbound material that escapes in unbound orbits and moves quickly towards the observer. In the same way as we described above, the light of the rapidly expanding blackbody photosphere would reach that material before it spreads too much, hence being dense enough to ionise and recombine, leading to emission lines. Based on the traditional picture (e.g. Bonnerot et al. 2021), the unbound debris should travel in the plane of the initial parabolic orbit of the star, towards the apocenter of this initial trajectory. This means that the observer should be aligned in this direction, in order to detect the high velocity blueshift.
5.3 The UV break
As we showed in Sect. 4.2.1, the broad-band light curves of AT 2023clx show distinct evolution in the (near) UV (NUV) and in the optical. In the bluest UVOT bands there is a \saydip around 18-28 days post-peak, of mags in three epochs in -band and of mag seen clearly in one epoch in the -band. The light curves in those bands cannot be fit with a single power-law, even though single power-laws provide very good fits for the rest of the bands (see the fits in Fig. 2). The effect is propagated into our blackbody fits, where a sudden drop in the temperature is seen during these days (see Sect. 4.2.2 and middle panel of Fig. 6). This behaviour can be interpreted either as a break in the NUV bands or as a \saydip that lasts ten days.
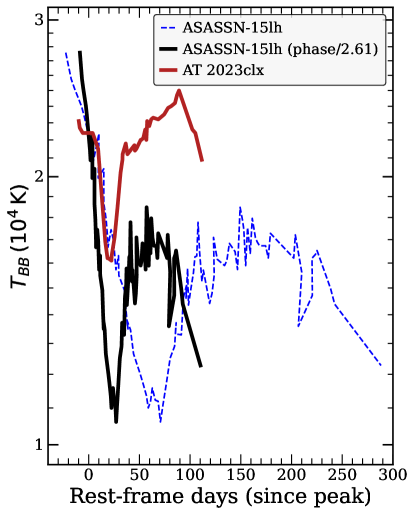
In the first scenario, it would mean that the NUV light curves probe two different phenomena that take place in the evolution of the TDE. The super-luminous transient ASASSN-15lh was argued to be a TDE from a highly spinning, very massive () BH (Leloudas et al. 2016, also see Margutti et al. 2017). A remarkable feature of this transient is that it showed a spectacular re-brightening at the UV wavelengths around two months after the transient peak, which has not been fully understood to date. Leloudas et al. (2016) explained this feature (as part of the TDE scenario) by suggesting that the initial evolution of the NUV light curves was due to the circularisation of the debris, while the re-brightening was due to the prompt formation of an accretion disc. Recently, Guo et al. (2023) came to the same conclusion after studying the inter-band cross-correlation function lags, where the UV consistently peaks earlier than the optical. A similar behaviour was seen in the light curves of the TDE candidate AT 2018fyk (Wevers et al., 2019) but it was later revealed that the re-brightenings kept appearing, making AT 2018fyk a repeating partial TDE (Wevers et al., 2022a). In Fig. 14, we plot the temperature evolution of AT 2023clx compared to the one of ASASSN-15lh in order to show the similarity of the initial very fast temperature drop, followed by an equally steep increase, in the two transients. ASASSN-15lh showed a much more prominent and longer change in the light curves while in AT 2023clx we see the large drop in only three epochs. For this reason, we also plot the compressed temperature evolution of ASASSN-15lh (by 2.61) in order to chronologically match the minimum temperature of the dip. The similarity is striking. However, the transients had big differences since ASASSN-15lh was one of the brightest transients ever recorded () and its spectra were featureless. However, even though their luminosities are very different, the evolution of the blackbody luminosities is similar as both show a break in the luminosity evolution, followed by a slow (or constant) decline (see Fig. 7). If ASASSN-15lh was indeed a TDE, it could be that both transients achieved prompt accretion disc formation after the circularisation of the debris, manifested in the NUV break.
Hong et al. (2022) studied the effects of disc formation efficiency in TDEs and they express this efficiency as a function of the BH mass, the disrupted star’s mass and the impact parameter. They find that the efficiency has a monotonically increasing trend towards and lower stellar mass. They visualise the above in their figure 2 left panels where contours of disc formation efficiencies are overplotted. Assuming , , , AT 2023clx would be in the contour, just in the locus of the highest possible efficiency and the star plunging directly into the BH event horizon without producing a detectable flare. This is the case for a BH mass (their middle panels) and is consistent with our prediction, that AT 2023clx must have undergone prompt and efficient disc formation. It is also interesting to see that for a BH mass of (bottom panel), Hong et al. (2022) find that the only possible disruption would be from a high mass star with low , leading to very high efficiency (). That would be the case for ASASSN-15lh, if it was a TDE around a very massive, highly spinning BH. The low stellar mass in AT 2023clx will lead to a small amount of available material (e.g. ) to form a reprocessing layer, making the layer low in density. That might be why we happen to see the first NUV peak (because of the circularisation after the debris stream self-crossing) and then the rise and plateauing of the NUV flux due to the prompt and efficient accretion (a scenario that was also suggested for ASASSN-15lh).
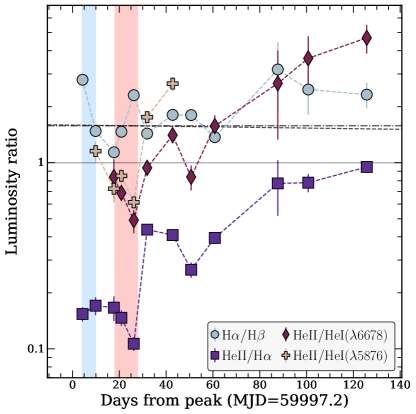
In Fig. 15 we plot several line ratios and see how they change during and after the temperature dip. During the dip, strong He I lines emerge. As the temperature starts rising again, He I gets ionized and He II luminosity starts rising again. The important question here is what caused this temperature/luminosity break, propagated into the properties of the line emitting region. Another interesting feature probed by the line luminosity ratios is the almost flat Balmer decrement (/). We perform a weighted linear fit () to the line ratio and find and . If we perform the same fit but with the assumption that the ratio is flat (i.e. ) we find . Both these fits are shown in Fig. 15. In a typical AGN broad line region (BLR) this ratio is which is consistent with Case B recombination (Osterbrock, 1974). A similar flat Balmer decrement was observed in TDE AT 2018hyz (/) and Short et al. (2020) suggested that the lines are collisionally excited rather than being produced via photoionisation. They suggested that the flat Balmer decrement together with the complex profiles (double-peaked Balmer lines) hints that the emission lines originate in a disc chromosphere, analogous to those seen in cataclysmic variables. Finally they suggest that a possible partial disruption of a star might lead to low optical depth of material that eventually allowed to observe these double-peaked, collisionally excited lines. In AT 2023clx we do not detect the double-peaked lines, however this could be due to a different viewing angle of observation. The early spectra of the two transients share a lot of similarities especially around the peak dates (see top panel of Fig. 9) and their blackbody luminosities also have a similar evolution (see Fig. 7) as they both show a break in the luminosity decline, which happens earlier and is more prominent in AT 2023clx. A prompt accretion disc formation was also suggested for AT 2018hyz (Hung et al., 2020), needed to explain the early detection of the double-peaked Balmer lines. Furthermore, based on the light curve shape and evolution, it was argued that AT 2018hyz was also caused by the disruption of a low-mass star (Gomez et al., 2020). We suggest that AT 2023clx also experienced prompt disc formation. Based on the discussion of Sect. 5.1, we have good reasons to believe that the disrupted star had a very low-mass (), and only a portion of this ( 50%) will end up bound around the SMBH. A reprocessing layer encompassing the SMBH predicted by the reprocessing TDE scenario (e.g. Guillochon & Ramirez-Ruiz 2013; Metzger & Stone 2016; Dai et al. 2018), would be of low density because of the low available mass, leading to the detection of the disc emission responsible for the NUV break.
5.4 A plausible scenario
Combining the above three subsections we here paint the picture of a plausible scenario for AT 2023clx.
AT 2023clx is the result of the tidal disruption of a low-mass () small radius () star, with low central concentration (), close to full disruption () but yet below the critical value. Following Law-Smith et al. (2020), such a disruption should show sharper rise and shallower decline in the light curves than disruptions occurring from other combinations of these parameters. Our observations confirm the above, since AT 2023clx is the fastest rising TDE to date and also shows a very shallow decline after the UV break.
Based on Hong et al. (2022), the combination of the above parameters (BH mass, stellar mass and ) favours highly efficient disc formation after the debris stream self-crossing. Combined with the low density of the reprocessing layer (due to the low initial mass of the star) we happen to see the first NUV peak because of the circularisation after the debris stream self-crossing and then the rise and plateauing of the NUV flux due to the prompt and efficient accretion (a scenario that was suggested for ASASSN-15lh).
The light from the rapidly expanding blackbody photosphere ionises either the i) clumpy preceding part of an outflow (as in the picture of Metzger & Stone 2016), or ii) some post-disruption unbound material. In either scenario, the ionised material is launched and moves quickly towards us, recombines and emits the peculiar 6353 Å blueshifted feature. This can happen because of the viewing angle. In scenario i), we happened to be in the direction of the outflow. In scenario ii), based on the traditional picture, the unbound debris should travel in the plane of the initial parabolic orbit of the star, towards the apocenter of this initial orbit. In both those scenarios, that would lead to an edge-on view within the reprocessing emission mechanism paradigm, explaining the lack of X-rays (which could also be obscured by the potential dust torus of the LINER host galaxy). Therefore, the unique properties of AT 2023clx (and the lack of those in other TDEs) could potentially be described by a combination of disruption parameters and viewing angle effects.
6 Conclusions
We have presented UV, optical and NIR follow-up and detailed study of AT 2023clx, the closest optical TDE to date, in the nucleus of the interacting LINER galaxy NGC 3799 (z=0.01107).
-
1.
After removing the stellar continuum, we place the host in a BPT diagram and find it to be a LINER galaxy, very close to the AGN and composite region locus.
-
2.
Strong Na I D absorption from the host galaxy spectrum motivated us to quantify the host extinction. Based on our archival SED fits, we find an = 0.177 mag for the host that we use when de-reddening our data.
-
3.
Employing several standard methods (M- relation and MOSFiT fits estimate), we estimate the mass of the central supermassive black hole to be .
-
4.
We measure a peak absolute magnitude of mag in the -band and a maximum bolometric luminosity of , making AT 2023clx an intermediate luminosity TDE.
-
5.
It rose to peak within days, making it the fastest rising TDE to date. Our SMBH mass estimate rules out the possibility of an IMBH as the reason of the fast rise. We suggest instead that the fast rise was caused by the disruption of a very low-mass star () with an impact parameter . Theoretical fallback rate estimates based on realistic stellar profiles (Law-Smith et al., 2020) can reproduce the rise profile with such disruption parameters. With a radiative efficiency of , the model can also match the peak brightness.
-
6.
Dense spectral follow-up revealed a blue continuum that cools slowly with time and broad Balmer and He II lines as well as weak He I 5876,6678 emission, features that are typically seen in TDEs. The lines slowly become narrower with time as their luminosity drops, also typically seen in TDEs.
-
7.
The early broad profile of H matches to what is theoretically expected from an optically thick outflow (Roth & Kasen, 2018). The Balmer lines show a flat Balmer decrement (/) suggesting that the lines are collisionally excited rather than being produced via photoionisation (Short et al., 2020), as in typical active galactic nuclei.
-
8.
We find, for the first time in TDEs, a sharp, narrow emission peak at a rest wavelength of 6353 Å, on top of the blue side of the broad H profile. This feature is clearly present in the first four spectra ( days post-peak) and then it disappears. We argue that this might be clumpy material preceding the bulk of the outflow which is directed towards the observer, manifested as a high-velocity component of H (). We also discuss other possibilities such as FUV pumping, but we conclude that it seems less likely.
-
9.
Fitting the SED data of AT 2023clx with a blackbody, we find a rapidly expanding blackbody photosphere with a very high constant velocity (i.e. 0.017c). Interestingly, there is a break observed in the near-UV light curves manifested as a dip in the temperature evolution, or as a small second peak in the radius evolution ( days post-peak). Such a break was seen in the light curves of the very bright transient ASASSN-15lh (which has been proposed to be an extreme TDE) but much shorter and less prominent in AT 2023clx.
-
10.
In the TDE scenario of ASASSN-15lh (Leloudas et al., 2016), it was suggested that the break in the in the NUV light curves was caused by the circularisation of the debris followed by an efficient accretion disc formation. Comparing with theoretical work (Hong et al., 2022), we show that for the disruption parameters (BH mass, stellar mass and ) arising from our analysis, even if they are much different than those of ASASSN-15lh, they also favour highly efficient disc formation after the debris stream self-crossing. Combined with the low density of the reprocessing layer (due to the low initial mass of the star), we are able to observe the NUV break caused by the prompt and efficient disc formation.
-
11.
In summary, we propose a plausible scenario for AT 2023clx involving the disruption of a very low-mass star () with an outflow launched to our line-of-sight, and disruption properties that led to circularisation and prompt and efficient accretion disc formation, observed through a low-density photosphere.
AT 2023clx adds to the diversity of observational properties of optical and UV TDEs showing that individual event studies still add to the variety of properties. Even if attempts are made to explain distinct features through superficial scenarios, questions regarding why such features are not observed in other TDEs will persist. Therefore, a comprehensive understanding of the diversity in TDE properties necessitates rigorous theoretical interpretation and modelling. Furthermore, its discovery and study showcases that ignoring transients based on their \sayAGN contextual classification in simple selection-cuts filters, might lead to missing valuable TDEs, as well as biasing us towards passive galaxies. That could be a very important factor for TDE rates estimates, which are famously below the theoretical estimates (see, e.g., Magorrian & Tremaine 1999; Wang & Merritt 2004; Stone & Metzger 2016 and review by Stone et al. 2020), during the era of the upcoming time-domain survey of the Rubin Observatory (LSST; Ivezić et al. 2019).
Acknowledgements.
We thank K. Uno, K. Maeda and T. Nagao for interesting discussions on the object. P.C. and R.K. acknowledges support via Research Council of Finland (grant 340613). G.L. is supported by a research grant (19054) from VILLUM FONDEN. PR acknowledges support from STFC grant 2742655. TR and SM acknowledge support from the Research Council of Finland project 350458. AA is supported by the European Research Council (ERC) under the European Union’s Horizon 2020 research and innovation programme (grant agreement No. 948381). This work was funded by ANID, Millennium Science Initiative, ICN12_009. I.A. acknowledges support from the European Research Council (ERC) under the European Union’s Horizon 2020 research and innovation program (grant agreement number 852097), from the Israel Science Foundation (grant number 2752/19), from the United States - Israel Binational Science Foundation (BSF; grant number 2018166), and from the Pazy foundation (grant number 216312). Y.-Z. Cai is supported by the National Natural Science Foundation of China (NSFC, Grant No. 12303054) and the International Centre of Supernovae, Yunnan Key Laboratory (No. 202302AN360001). TWC acknowledges the Yushan Young Fellow Program by the Ministry of Education, Taiwan for the financial support. L.G and T.E.M.B. acknowledges financial support from the Spanish Ministerio de Ciencia e Innovación (MCIN), the Agencia Estatal de Investigación (AEI) 10.13039/501100011033, and the European Union Next Generation EU/PRTR funds under the 2021 Juan de la Cierva program FJC2021-047124-I and the PID2020-115253GA-I00 HOSTFLOWS project, from Centro Superior de Investigaciones Científicas (CSIC) under the PIE project 20215AT016, and the program Unidad de Excelencia María de Maeztu CEX2020-001058-M , and from the Departament de Recerca i Universitats de la Generalitat de Catalunya through the 2021-SGR-01270 grant. CPG acknowledges financial support from the Secretary of Universities and Research (Government of Catalonia) and by the Horizon 2020 Research and Innovation Programme of the European Union under the Marie Skłodowska-Curie and the Beatriu de Pinós 2021 BP 00168 programme, from the Spanish Ministerio de Ciencia e Innovación (MCIN) and the Agencia Estatal de Investigación (AEI) 10.13039/501100011033 under the PID2020-115253GA-I00 HOSTFLOWS project, and the program Unidad de Excelencia María de Maeztu CEX2020-001058-M. MN is supported by the European Research Council (ERC) under the European Union’s Horizon 2020 research and innovation programme (grant agreement No. 948381) and by UK Space Agency Grant No. ST/Y000692/1. FO acknowledges support from MIUR, PRIN 2020 (grant 2020KB33TP) “Multimessenger astronomy in the Einstein Telescope Era (METE)”. M.P. acknowledges support from a UK Research and Innovation Fellowship (MR/T020784/1). A.N. acknowledges the Warwick Astrophysics PhD prize scholarship made possible thanks to a generous philanthropic donation. SJS acknowledges funding from STFC Grants ST/X006506/1, ST/T000198/1 and ST/X001253/1. YW acknowledges support from the Strategic Priority Research Program of the Chinese Academy of Sciences (Grant No. XDB0550200). This work is based (in part) on observations collected at the European Organisation for Astronomical Research in the Southern Hemisphere under ESO DDT program 110.25AX (PI: Wevers) and as part of ePESSTO+ under ESO program ID 108.220C and 111.24PR (PI: Inserra) and on observations made with the Nordic Optical Telescope, owned in collaboration by the University of Turku and Aarhus University, and operated jointly by Aarhus University, the University of Turku and the University of Oslo, representing Denmark, Finland and Norway, the University of Iceland and Stockholm University at the Observatorio del Roque de los Muchachos, La Palma, Spain, of the Instituto de Astrofisica de Canarias under NOT programmes 67-009. The NOT data presented here were obtained with ALFOSC, which is provided by the Instituto de Astrofisica de Andalucia (IAA) under a joint agreement with the University of Copenhagen and NOT. Some of the observations from the Nordic Optical Telescope were obtained through the NUTS2 collaboration which are supported in part by the Instrument Centre for Danish Astrophysics (IDA), and the Finnish Centre for Astronomy with ESO (FINCA) via Academy of Finland grant nr 306531. This publication makes use of data products from the Two Micron All Sky Survey, which is a joint project of the University of Massachusetts and the Infrared Processing and Analysis Center/California Institute of Technology, funded by the National Aeronautics and Space Administration and the National Science Foundation.References
- Aghanim et al. (2020) Aghanim, N., Akrami, Y., Ashdown, M., et al. 2020, A&A, 641, A6
- Alard & Lupton (1998) Alard, C. & Lupton, R. H. 1998, ApJ, 503, 325
- Alexander et al. (2020) Alexander, K. D., van Velzen, S., Horesh, A., & Zauderer, B. A. 2020, Radio Properties of Tidal Disruption Events
- Andreoni et al. (2022) Andreoni, I., Coughlin, M. W., Perley, D. A., et al. 2022, Nature, 612, 430
- Angus et al. (2022) Angus, C. R., Baldassare, V. F., Mockler, B., et al. 2022, Nat. Astron., 6, 1452
- Arcavi et al. (2014) Arcavi, I., Gal-Yam, A., Sullivan, M., et al. 2014, ApJ, 793, 38
- Auchettl et al. (2017) Auchettl, K., Guillochon, J., & Ramirez-Ruiz, E. 2017, ApJ, 838, 149
- Baldwin et al. (1981) Baldwin, J. A., Phillips, M. M., & Terlevich, R. 1981, PASP, 93, 5
- Bellm et al. (2019) Bellm, E. C., Kulkarni, S. R., Graham, M. J., et al. 2019, PASP, 131, 018002
- Blagorodnova et al. (2017) Blagorodnova, N., Gezari, S., Hung, T., et al. 2017, ApJ, 844, 46
- Blanchard et al. (2017) Blanchard, P. K., Nicholl, M., Berger, E., et al. 2017, ApJ, 843, 106
- Bonnerot et al. (2021) Bonnerot, C., Lu, W., & Hopkins, P. F. 2021, MNRAS, 504, 4885
- Bradley et al. (2019) Bradley, L., Sipőcz, B., Robitaille, T., et al. 2019, Zenodo
- Breeveld et al. (2011) Breeveld, A. A., Landsman, W., Holland, S. T., et al. 2011, AIPC, 1358, 373
- Brennan & Fraser (2022) Brennan, S. J. & Fraser, M. 2022, A&A, 667, A62
- Cannizzaro et al. (2020) Cannizzaro, G., Fraser, M., Jonker, P. G., et al. 2020, MNRAS, 493, 477
- Cannizzaro et al. (2021) Cannizzaro, G., Jonker, P. G., & Mata-Sánchez, D. 2021, ApJ, 909, 159
- Cannizzaro et al. (2022) Cannizzaro, G., Levan, A. J., Van Velzen, S., & Brown, G. 2022, MNRAS, 516, 529
- Cappellari (2017) Cappellari, M. 2017, MNRAS, 466, 798
- Cappellari & Emsellem (2004) Cappellari, M. & Emsellem, E. 2004, PASP, 116, 138
- Cardelli et al. (1989) Cardelli, J. A., Clayton, G. C., & Mathis, J. S. 1989, ApJ, 345, 245
- Cendes et al. (2023) Cendes, Y., Berger, E., Alexander, K. D., et al. 2023, arXiv, arXiv:2308.13595
- Charalampopoulos et al. (2023a) Charalampopoulos, P., Bulla, M., Bonnerot, C., & Leloudas, G. 2023a, A&A, 670, A150
- Charalampopoulos et al. (2022) Charalampopoulos, P., Leloudas, G., Malesani, D. B., et al. 2022, A&A, 659, A34
- Charalampopoulos et al. (2023b) Charalampopoulos, P., Pursiainen, M., Leloudas, G., et al. 2023b, A&A, 673, A95
- Cid Fernandes et al. (2011) Cid Fernandes, R., Mateus, A., Sodré, L., Stasinska, G., & Gomes, J. M. 2011, Astrophys. Source Code Libr. Rec. ascl1108.006, ascl:1108.006
- Dai et al. (2018) Dai, L., McKinney, J. C., Roth, N., Ramirez-Ruiz, E., & Miller, M. C. 2018, ApJ, 859, L20
- Denney et al. (2009) Denney, K. D., Peterson, B. M., Dietrich, M., Vestergaard, M., & Bentz, M. C. 2009, ApJ, 692, 246
- Evans & Kochanek (1989) Evans, C. R. & Kochanek, C. S. 1989, ApJ, 346, L13
- Ferrarese & Ford (2005) Ferrarese, L. & Ford, H. 2005, Space Sci. Rev., 116, 523
- Flesch (2023) Flesch, E. W. 2023, Open J. Astrophys., 6, 49
- Foreman-Mackey et al. (2013) Foreman-Mackey, D., Hogg, D. W., Lang, D., & Goodman, J. 2013, PASP, 125, 306
- Frederick et al. (2019) Frederick, S., Gezari, S., Graham, M. J., et al. 2019, ApJ, 883, 31
- Frederick et al. (2021) Frederick, S., Gezari, S., Graham, M. J., et al. 2021, ApJ, 920, 56
- French et al. (2016) French, K. D., Arcavi, I., & Zabludoff, A. 2016, ApJ, 818, L21
- French et al. (2020) French, K. D., Wevers, T., Law-Smith, J., Graur, O., & Zabludoff, A. I. 2020, The Host Galaxies of Tidal Disruption Events
- Gezari (2021) Gezari, S. 2021, Tidal Disruption Events
- Gezari (2022) Gezari, S. 2022, Nat. Astron. Vol. 6, p. 1351-1352, 6, 1351
- Gezari et al. (2012) Gezari, S., Chornock, R., Rest, A., et al. 2012, Nature, 485, 217
- Goldoni et al. (2006) Goldoni, P., Royer, F., François, P., et al. 2006, Ground-based Airborne Instrum. Astron., 6269, 62692K
- Gomez et al. (2020) Gomez, S., Nicholl, M., Short, P., et al. 2020, MNRAS, 497, 1925
- Goodwin et al. (2022) Goodwin, A. J., Van Velzen, S., Miller-Jones, J. C., et al. 2022, MNRAS, 511, 5328
- Graham et al. (2019) Graham, M. J., Kulkarni, S. R., Bellm, E. C., et al. 2019, PASP, 131, 078001
- Graur et al. (2018) Graur, O., French, K. D., Zahid, H. J., et al. 2018, ApJ, 853, 39
- Greene et al. (2020) Greene, J. E., Strader, J., & Ho, L. C. 2020, Annu. Rev. Astron. Astrophys., 58, 257
- Guillochon et al. (2014) Guillochon, J., Manukian, H., & Ramirez-Ruiz, E. 2014, ApJ, 783, 23
- Guillochon et al. (2018) Guillochon, J., Nicholl, M., Villar, V. A., et al. 2018, Astrophys. J. Suppl. Ser., 236, 6
- Guillochon & Ramirez-Ruiz (2013) Guillochon, J. & Ramirez-Ruiz, E. 2013, ApJ, 767, 25
- Gunn et al. (2006) Gunn, J. E., Siegmund, W. A., Mannery, E. J., et al. 2006, AJ, 131, 2332
- Guo et al. (2023) Guo, H., Sun, J., Li, S.-L., et al. 2023, arXiv, arXiv:2312.06771
- Guolo et al. (2023) Guolo, M., Gezari, S., Yao, Y., et al. 2023, arXiv, arXiv:2308.13019
- Hills (1975) Hills, J. G. 1975, Nature, 254, 295
- Hinkle et al. (2021) Hinkle, J. T., Holoien, T. W.-S., Shappee, B. J., & Auchettl, K. 2021, ApJ, 910, 83
- Holoien et al. (2019) Holoien, T. W.-S., Huber, M. E., Shappee, B. J., et al. 2019, ApJ, 880, 120
- Homan et al. (2023) Homan, D., Krumpe, M., Markowitz, A., et al. 2023, A&A, 672, A167
- Hong et al. (2022) Hong, T., Wong, T., Pfister, H., & Dai, L. 2022, ApJ, 927, L19
- Huber et al. (2015) Huber, M., Chambers, K., Flewelling, H., et al. 2015, Astron. Telegr., 7153
- Hung et al. (2019) Hung, T., Cenko, S. B., Roth, N., et al. 2019, ApJ, 879, 119
- Hung et al. (2020) Hung, T., Foley, R. J., Ramirez-Ruiz, E., et al. 2020, ApJ, 903, 31
- Hung et al. (2021) Hung, T., Foley, R. J., Veilleux, S., et al. 2021, ApJ, 917, 9
- Ivezić et al. (2019) Ivezić, Ž., Kahn, S. M., Tyson, J. A., et al. 2019, ApJ, 873, 111
- Jankovič et al. (2023) Jankovič, T., Bonnerot, C., & Gomboc, A. 2023, arXiv, 000, arXiv:2303.16230
- Jiang et al. (2021) Jiang, N., Wang, T., Hu, X., et al. 2021, ApJ, 911, 31
- Jiang et al. (2016) Jiang, Y.-F., Guillochon, J., & Loeb, A. 2016, ApJ, 830, 125
- Johansson et al. (2023) Johansson, J., Meynardie, W., Chu, M., & Fremling, C. 2023, Transient Name Serv. Classif. Report, No. 2023-1075, 2023-1075, 1
- Kaiser et al. (2002) Kaiser, N., Aussel, H., Burke, B. E., et al. 2002, Surv. Other Telesc. Technol. Discov. Ed. by Tyson, J. Anthony; Wolff, Sidney. Proc. SPIE, Vol. 4836, pp. 154-164 (2002)., 4836, 154
- Kankare et al. (2017) Kankare, E., Kotak, R., Mattila, S., et al. 2017, Nat. Astron., 1, 865
- Kesden (2012) Kesden, M. 2012, Phys. Rev. D, 85, 024037
- Komossa & Bade (1999) Komossa, S. & Bade, N. 1999, Astron. Astrophys. v.343, p.775-787, 343, 775
- Kool et al. (2020) Kool, E. C., Reynolds, T. M., Mattila, S., et al. 2020, MNRAS, 498, 2167
- Kormendy & Ho (2013) Kormendy, J. & Ho, L. C. 2013, Annu. Rev. Astron. Astrophys., 51, 511
- Kormendy & Richstone (1995) Kormendy, J. & Richstone, D. 1995, Annu. Rev. Astron. Astrophys. Vol. 33, 1995, pp. 581., 33, 581
- Lacy et al. (1982) Lacy, J. H., Townes, C. H., & Hollenbach, D. J. 1982, ApJ, 262, 120
- Lang (2014) Lang, D. 2014, AJ, 147, 108
- Law et al. (2009) Law, N. M., Kulkarni, S. R., Dekany, R. G., et al. 2009, PASP, 121, 1395
- Law-Smith et al. (2017) Law-Smith, J., MacLeod, M., Guillochon, J., Macias, P., & Ramirez-Ruiz, E. 2017, ApJ, 841, 132
- Law-Smith et al. (2020) Law-Smith, J. A. P., Coulter, D. A., Guillochon, J., Mockler, B., & Ramirez-Ruiz, E. 2020, ApJ, 905, 141
- Lawrence et al. (2007) Lawrence, A., Warren, S. J., Almaini, O., et al. 2007, MNRAS, 379, 1599
- Leja et al. (2017) Leja, J., Johnson, B. D., Conroy, C., van Dokkum, P. G., & Byler, N. 2017, ApJ, 837, 170
- Leloudas et al. (2019) Leloudas, G., Dai, L., Arcavi, I., et al. 2019, ApJ, 887, 218
- Leloudas et al. (2016) Leloudas, G., Fraser, M., Stone, N. C., et al. 2016, Nat. Astron., 1, 0002
- Li et al. (2002) Li, L.-X., Narayan, R., & Menou, K. 2002, ApJ, 576, 753
- Lodato & Rossi (2011) Lodato, G. & Rossi, E. M. 2011, MNRAS, 410, 359
- Lu & Bonnerot (2020) Lu, W. & Bonnerot, C. 2020, MNRAS, 492, 686
- Lu et al. (2016) Lu, W., Kumar, P., & Evans, N. J. 2016, MNRAS, 458, 575
- Magorrian & Tremaine (1999) Magorrian, J. & Tremaine, S. 1999, MNRAS, 309, 447
- Margutti et al. (2017) Margutti, R., Metzger, B. D., Chornock, R., et al. 2017, ApJ, 836, 25
- Masci et al. (2019) Masci, F. J., Laher, R. R., Rusholme, B., et al. 2019, PASP, 131
- Mattila et al. (2018) Mattila, S., Pérez-Torres, M., Efstathiou, A., et al. 2018, Sci, 361, 482
- Metzger & Stone (2016) Metzger, B. D. & Stone, N. C. 2016, MNRAS, 461, 948
- Miller et al. (2015) Miller, J. M., Kaastra, J. S., Miller, M. C., et al. 2015, Nature, 526, 542
- Mockler et al. (2019) Mockler, B., Guillochon, J., & Ramirez-Ruiz, E. 2019, ApJ, 872, 151
- Modigliani et al. (2010) Modigliani, A., Goldoni, P., Royer, F., et al. 2010, Proc. SPIE, Vol. 7737, id. 773728 (2010)., 7737, 773728
- Nemer et al. (2020) Nemer, A., Goodman, J., & Wang, L. 2020, ApJ, 904, L27
- Newville et al. (2021) Newville, M., Otten, R., Nelson, A., Ingargiola, A., & Stensitzki, T. 2021, Lmfit: non-linear least-square minimization and curve-fitting for Python
- Nicholl (2018) Nicholl, M. 2018, Res. Notes AAS, 2, 230
- Nicholl et al. (2020) Nicholl, M., Wevers, T., Oates, S. R., et al. 2020, MNRAS, 499, 482
- Nikolajuk & Walter (2013) Nikolajuk, M. & Walter, R. 2013, A&A, 552, A75
- Osterbrock (1974) Osterbrock, D. E. 1974, Astrophysics of gaseous nebulae, 69
- Pasham et al. (2023) Pasham, D. R., Lucchini, M., Laskar, T., et al. 2023, Nat. Astron., 7, 88
- Perley et al. (2019) Perley, D. A., Mazzali, P. A., Yan, L., et al. 2019, MNRAS, 484, 1031
- Peterson et al. (2004) Peterson, B. M., Ferrarese, L., Gilbert, K. M., et al. 2004, ApJ, 613, 682
- Petrushevska et al. (2023) Petrushevska, T., Leloudas, G., Ilić, D., et al. 2023, A&A, 669, A140
- Phinney (1989) Phinney, E. S. 1989, Manifestations of a Massive Black Hole in the Galactic Center, ed. M. Morris, Vol. 136, 543
- Piran et al. (2015) Piran, T., Svirski, G., Krolik, J., Cheng, R. M., & Shiokawa, H. 2015, ApJ, 806
- Poole et al. (2008) Poole, T. S., Breeveld, A. A., Page, M. J., et al. 2008, MNRAS, 383, 627
- Poznanski et al. (2012) Poznanski, D., Prochaska, J. X., & Bloom, J. S. 2012, MNRAS, 426, 1465
- Ramos Padilla et al. (2020) Ramos Padilla, A. F., Ashby, M. L., Smith, H. A., et al. 2020, MNRAS, 499, 4325
- Ramsden et al. (2022) Ramsden, P., Lanning, D., Nicholl, M., & Mcgee, S. L. 2022, MNRAS, 515, 1146
- Rees (1988) Rees, M. J. 1988, Nature, 333, 523
- Reines & Volonteri (2015) Reines, A. E. & Volonteri, M. 2015, ApJ, 813, 82
- Reynolds et al. (2022) Reynolds, T. M., Mattila, S., Efstathiou, A., et al. 2022, A&A, 664, A158
- Roth & Kasen (2018) Roth, N. & Kasen, D. 2018, ApJ, 855, 54
- Roth et al. (2016) Roth, N., Kasen, D., Guillochon, J., & Ramirez-Ruiz, E. 2016, ApJ, 827, 3
- Schlafly & Finkbeiner (2011) Schlafly, E. F. & Finkbeiner, D. P. 2011, ApJ, 737, 103
- Sfaradi et al. (2023) Sfaradi, I., Horesh, A., Bright, J., et al. 2023, ATel, 15918, 1
- Shappee et al. (2014) Shappee, B., Prieto, J., Stanek, K. Z., et al. 2014, Am. Astron. Soc., 223, 236.03
- Shingles et al. (2021) Shingles, L., Smith, K. W., Young, D. R., et al. 2021, TNSAN, 7, 1
- Short et al. (2023) Short, P., Lawrence, A., Nicholl, M., et al. 2023, MNRAS, 525, 1568
- Short et al. (2020) Short, P., Nicholl, M., Lawrence, A., et al. 2020, MNRAS, 498, 4119
- Shrestha et al. (2020) Shrestha, M., Steele, I. A., Piascik, A. S., et al. 2020, MNRAS, 494, 4676
- Siegmund et al. (2004) Siegmund, O. H. W., Welsh, B. Y., Martin, C., et al. 2004, in UV Gamma-Ray Sp. Telesc. Syst., Vol. 5488 (SPIE), 13
- Skrutskie et al. (2006) Skrutskie, M. F., Cutri, R. M., Stiening, R., et al. 2006, AJ, 131, 1163
- Smartt et al. (2015) Smartt, S. J., Valenti, S., Fraser, M., et al. 2015, A&A, 579, 6
- Smith et al. (2020) Smith, K. W., Smartt, S. J., Young, D. R., et al. 2020, PASP, 132, 1
- Smith et al. (2019) Smith, K. W., Williams, R. D., Young, D. R., et al. 2019, Res. Notes AAS, 3, 26
- Speagle (2020) Speagle, J. S. 2020, MNRAS, 493, 3132
- Stanek (2023) Stanek, K. Z. 2023, Transient Name Serv. Discov. Report, No. 2023-421, 2023-421, 1
- Stone & Metzger (2016) Stone, N. C. & Metzger, B. D. 2016, MNRAS, 455, 859
- Stone et al. (2020) Stone, N. C., Vasiliev, E., Kesden, M., et al. 2020, Space Sci. Rev., 216, 35
- Strubbe & Quataert (2009) Strubbe, L. E. & Quataert, E. 2009, MNRAS, 400, 2070
- Tadhunter et al. (2021) Tadhunter, C., Patel, M., & Mullaney, J. 2021, MNRAS, 504, 4377
- Taguchi et al. (2023) Taguchi, K., Uno, K., Nagao, T., & Maeda, K. 2023, Transient Name Serv. Classif. Report, No. 2023-438, 2023-438, 1
- Thomsen et al. (2022) Thomsen, L. L., Kwan, T. M., Dai, L., et al. 2022, ApJ, 937, L28
- Tonry et al. (2018) Tonry, J. L., Denneau, L., Heinze, A. N., et al. 2018, PASP, 130, 064505
- Van Velzen et al. (2016) Van Velzen, S., Anderson, G. E., Stone, N. C., et al. 2016, Sci, 351, 62
- van Velzen et al. (2021) van Velzen, S., Gezari, S., Hammerstein, E., et al. 2021, ApJ, 908, 4
- van Velzen et al. (2020) van Velzen, S., Holoien, T. W., Onori, F., Hung, T., & Arcavi, I. 2020, Space Sci. Rev., 216, 124
- van Velzen et al. (2016) van Velzen, S., Mendez, A. J., Krolik, J. H., & Gorjian, V. 2016, ApJ, 829, 19
- Wang & Merritt (2004) Wang, J. & Merritt, D. 2004, ApJ, 600, 149
- Wevers et al. (2022a) Wevers, T., Coughlin, E. R., Pasham, D. R., et al. 2022a, ApJL, 942, L33
- Wevers et al. (2022b) Wevers, T., Nicholl, M., Guolo, M., et al. 2022b, A&A, 666, A6
- Wevers et al. (2019) Wevers, T., Pasham, D. R., van Velzen, S., et al. 2019, MNRAS, 488, 4816
- Wevers et al. (2017) Wevers, T., van Velzen, S., Jonker, P. G., et al. 2017, MNRAS, 471, 1694
- Wright et al. (2010) Wright, E. L., Eisenhardt, P. R., Mainzer, A. K., et al. 2010, AJ, 140, 1868
- Yao et al. (2023) Yao, Y., Ravi, V., Gezari, S., et al. 2023, ApJ, 955, L6
- York et al. (2000) York, D. G., Adelman, J., Anderson, Jr., J. E., et al. 2000, AJ, 120, 1579
- Young (2023) Young, D. R. 2023, thespacedoctor/sherlock: The QUB Transient Classifier
- Zauderer et al. (2011) Zauderer, B. A., Berger, E., Soderberg, A. M., et al. 2011, Nature, 476, 425
- Zhu et al. (2023) Zhu, J., Jiang, N., Wang, T., et al. 2023, ApJ, 952, L35
Appendix A Photometry Tables
| Date | MJD | Phase (d) | Telescope | Band | Mag (Error) |
|---|---|---|---|---|---|
| 2023-02-27 | 60002.75 | 5.50 | SWIFT | W2 | 14.76 (0.22) |
| 2023-03-05 | 60008.37 | 11.12 | SWIFT | W2 | 15.42 (0.26) |
| 2023-03-09 | 60012.47 | 15.22 | SWIFT | W2 | 15.85 (0.28) |
| 2023-03-11 | 60014.33 | 17.08 | SWIFT | W2 | 15.85 (0.28) |
| 2023-03-14 | 60017.78 | 20.53 | SWIFT | W2 | 16.77 (0.46) |
| 2023-03-17 | 60020.29 | 23.04 | SWIFT | W2 | 16.67 (0.43) |
| 2023-03-19 | 60022.53 | 25.28 | SWIFT | W2 | 17.13 (0.61) |
| 2023-03-22 | 60025.98 | 28.73 | SWIFT | W2 | 16.19 (0.32) |
| 2023-03-27 | 60030.29 | 33.04 | SWIFT | W2 | 16.33 (0.31) |
| 2023-03-31 | 60034.78 | 37.53 | SWIFT | W2 | 16.19 (0.33) |
| 2023-04-06 | 60040.61 | 43.36 | SWIFT | W2 | 16.35 (0.33) |
| 2023-04-09 | 60043.31 | 46.06 | SWIFT | W2 | 16.67 (0.43) |
| 2023-04-11 | 60045.70 | 48.45 | SWIFT | W2 | 16.50 (0.36) |
| 2023-04-24 | 60058.21 | 60.96 | SWIFT | W2 | 16.67 (0.43) |
| 2023-04-27 | 60061.11 | 63.86 | SWIFT | W2 | 16.57 (0.41) |
| 2023-05-03 | 60067.53 | 70.28 | SWIFT | W2 | 16.87 (0.5) |
| 2023-05-08 | 60072.04 | 74.79 | SWIFT | W2 | 16.87 (0.5) |
| 2023-05-13 | 60077.44 | 80.19 | SWIFT | W2 | 16.77 (0.46) |
| 2023-06-01 | 60096.10 | 98.85 | SWIFT | W2 | 17.13 (0.61) |
| 2023-02-27 | 60002.75 | 5.50 | SWIFT | M2 | 15.02 (0.15) |
| 2023-03-05 | 60008.37 | 11.12 | SWIFT | M2 | 15.68 (0.25) |
| 2023-03-09 | 60012.47 | 15.22 | SWIFT | M2 | 15.57 (0.18) |
| 2023-03-11 | 60014.33 | 17.08 | SWIFT | M2 | 15.68 (0.19) |
| 2023-03-14 | 60017.78 | 20.53 | SWIFT | M2 | 16.77 (0.46) |
| 2023-03-17 | 60020.29 | 23.04 | SWIFT | M2 | 16.67 (0.43) |
| 2023-03-19 | 60022.53 | 25.28 | SWIFT | M2 | 17.13 (0.61) |
| 2023-03-22 | 60025.98 | 28.73 | SWIFT | M2 | 16.19 (0.32) |
| 2023-03-27 | 60030.29 | 33.04 | SWIFT | M2 | 16.33 (0.31) |
| 2023-03-31 | 60034.78 | 37.53 | SWIFT | M2 | 16.19 (0.33) |
| 2023-04-06 | 60040.61 | 43.36 | SWIFT | M2 | 16.35 (0.33) |
| 2023-04-09 | 60043.31 | 46.06 | SWIFT | M2 | 16.67 (0.43) |
| 2023-04-11 | 60045.70 | 48.45 | SWIFT | M2 | 16.50 (0.36) |
| 2023-04-24 | 60058.21 | 60.96 | SWIFT | M2 | 16.67 (0.43) |
| 2023-04-27 | 60061.11 | 63.86 | SWIFT | M2 | 16.57 (0.41) |
| 2023-05-03 | 60067.53 | 70.28 | SWIFT | M2 | 16.87 (0.5) |
| 2023-05-08 | 60072.04 | 74.79 | SWIFT | M2 | 16.87 (0.5) |
| 2023-05-13 | 60077.44 | 80.19 | SWIFT | M2 | 16.77 (0.46) |
| 2023-06-01 | 60096.10 | 98.85 | SWIFT | M2 | 17.13 (0.61) |
| 2023-02-27 | 60002.75 | 5.50 | SWIFT | W1 | 15.02 (0.15) |
| 2023-03-05 | 60008.37 | 11.12 | SWIFT | W1 | 15.68 (0.25) |
| 2023-03-09 | 60012.47 | 15.22 | SWIFT | W1 | 15.57 (0.18) |
| 2023-03-11 | 60014.33 | 17.08 | SWIFT | W1 | 15.68 (0.19) |
| 2023-03-14 | 60017.78 | 20.53 | SWIFT | W1 | 16.77 (0.46) |
| 2023-03-17 | 60020.29 | 23.04 | SWIFT | W1 | 16.67 (0.43) |
| 2023-03-19 | 60022.53 | 25.28 | SWIFT | W1 | 17.13 (0.61) |
| 2023-03-22 | 60025.98 | 28.73 | SWIFT | W1 | 16.19 (0.32) |
| 2023-03-27 | 60030.29 | 33.04 | SWIFT | W1 | 16.33 (0.31) |
| Date | MJD | Phase (d) | Telescope | Band | Mag (Error) |
|---|---|---|---|---|---|
| 2023-03-31 | 60034.78 | 37.53 | SWIFT | W1 | 16.19 (0.33) |
| 2023-04-06 | 60040.61 | 43.36 | SWIFT | W1 | 16.35 (0.33) |
| 2023-04-09 | 60043.31 | 46.06 | SWIFT | W1 | 16.67 (0.43) |
| 2023-04-11 | 60045.70 | 48.45 | SWIFT | W1 | 16.50 (0.36) |
| 2023-04-24 | 60058.21 | 60.96 | SWIFT | W1 | 16.67 (0.43) |
| 2023-02-27 | 60002.75 | 5.50 | SWIFT | U | 15.05 (0.15) |
| 2023-03-05 | 60008.37 | 11.12 | SWIFT | U | 15.68 (0.25) |
| 2023-03-09 | 60012.47 | 15.22 | SWIFT | U | 15.57 (0.18) |
| 2023-03-11 | 60014.33 | 17.08 | SWIFT | U | 15.68 (0.19) |
| 2023-03-14 | 60017.78 | 20.53 | SWIFT | U | 16.09 (0.22) |
| 2023-03-17 | 60020.29 | 23.04 | SWIFT | U | 15.85 (0.20) |
| 2023-03-19 | 60022.53 | 25.28 | SWIFT | U | 16.09 (0.22) |
| 2023-03-22 | 60025.98 | 28.73 | SWIFT | U | 16.17 (0.23) |
| 2023-03-27 | 60030.29 | 33.04 | SWIFT | U | 16.14 (0.20) |
| 2023-03-31 | 60034.78 | 37.53 | SWIFT | U | 16.32 (0.25) |
| 2023-04-06 | 60040.61 | 43.36 | SWIFT | U | 16.39 (0.24) |
| 2023-04-09 | 60043.31 | 46.06 | SWIFT | U | 16.67 (0.32) |
| 2023-04-11 | 60045.70 | 48.45 | SWIFT | U | 16.70 (0.29) |
| 2023-04-24 | 60058.21 | 60.96 | SWIFT | U | 16.95 (0.39) |
| 2023-04-27 | 60061.11 | 63.86 | SWIFT | U | 17.18 (0.46) |
| 2023-05-03 | 60067.52 | 70.27 | SWIFT | U | 17.18 (0.46) |
| 2023-05-08 | 60072.03 | 74.78 | SWIFT | U | 16.77 (0.46) |
| 2023-05-13 | 60077.44 | 80.19 | SWIFT | U | 17.31 (0.52) |
| 2023-05-25 | 60089.23 | 91.98 | SWIFT | U | 17.18 (0.46) |
| 2023-06-01 | 60096.10 | 98.85 | SWIFT | U | 17.31 (0.52) |
| 2023-06-08 | 60103.43 | 106.18 | SWIFT | U | 17.46 (0.58) |
| 2023-02-27 | 60002.75 | 5.50 | SWIFT | B | 15.34 (0.27) |
| 2023-03-09 | 60012.47 | 15.22 | SWIFT | B | 15.96 (0.45) |
| 2023-03-11 | 60014.33 | 17.08 | SWIFT | B | 15.96 (0.45) |
| 2023-03-14 | 60017.78 | 20.53 | SWIFT | B | 15.96 (0.45) |
| 2023-03-17 | 60020.29 | 23.04 | SWIFT | B | 16.26 (0.58) |
| 2023-03-19 | 60022.53 | 25.28 | SWIFT | B | 16.05 (0.48) |
| 2023-03-31 | 60034.78 | 37.53 | SWIFT | B | 16.38 (0.64) |
| 2023-02-10 | 59985.44 | 11.81 | ZTF | g | 18.65 (99.00) |
| 2023-03-13 | 60016.21 | 18.96 | ZTF | g | 16.03 (0.12) |
| 2023-03-17 | 60020.22 | 22.97 | ZTF | g | 16.19 (0.12) |
| 2023-03-28 | 60031.29 | 34.04 | ZTF | g | 16.62 (0.12) |
| 2023-04-02 | 60036.32 | 39.07 | ZTF | g | 16.84 (0.14) |
| 2023-04-09 | 60043.33 | 46.08 | ZTF | g | 17.08 (0.12) |
| 2023-04-11 | 60045.32 | 48.07 | ZTF | g | 16.98 (0.12) |
| 2023-04-16 | 60050.18 | 52.93 | ZTF | g | 17.16 (0.12) |
| 2023-04-18 | 60052.27 | 55.02 | ZTF | g | 17.19 (0.12) |
| 2023-04-20 | 60054.26 | 57.01 | ZTF | g | 17.39 (0.13) |
| 2023-04-22 | 60056.21 | 58.96 | ZTF | g | 17.56 (0.12) |
| 2023-04-24 | 60058.30 | 61.05 | ZTF | g | 17.42 (0.12) |
| 2023-04-26 | 60060.25 | 63.00 | ZTF | g | 17.55 (0.12) |
| 2023-04-28 | 60062.26 | 65.01 | ZTF | g | 17.59 (0.12) |
| 2023-05-03 | 60067.35 | 70.10 | ZTF | g | 17.51 (0.18) |
| 2023-05-09 | 60073.34 | 76.09 | ZTF | g | 17.54 (0.13) |
| 2023-05-13 | 60077.27 | 80.02 | ZTF | g | 17.67 (0.13) |
| 2023-05-16 | 60080.24 | 82.99 | ZTF | g | 17.67 (0.13) |
| 2023-05-20 | 60084.25 | 87.00 | ZTF | g | 17.72 (0.12) |
| 2023-05-22 | 60086.26 | 89.01 | ZTF | g | 17.86 (0.13) |
| Date | MJD | Phase (d) | Telescope | Band | Mag (Error) |
|---|---|---|---|---|---|
| 2023-05-24 | 60088.28 | 91.03 | ZTF | g | 17.98 (0.13) |
| 2023-06-06 | 60101.75 | 104.50 | ZTF | g | 18.34 (0.26) |
| 2023-06-09 | 60104.73 | 107.48 | ZTF | g | 18.40 (0.17) |
| 2023-06-16 | 60111.25 | 114.00 | ZTF | g | 18.60 (0.15) |
| 2023-06-18 | 60113.27 | 116.02 | ZTF | g | 18.32 (0.14) |
| 2023-06-20 | 60115.24 | 117.99 | ZTF | g | 18.40 (0.14) |
| 2023-06-22 | 60117.27 | 120.02 | ZTF | g | 18.43 (0.18) |
| 2023-02-11 | 59986.28 | 10.97 | ASASSN | g | 19.04 (99.00) |
| 2023-02-12 | 59987.27 | 9.98 | ASASSN | g | 17.41 (0.50) |
| 2023-02-13 | 59988.25 | 9.00 | ASASSN | g | 16.78 (0.24) |
| 2023-02-16 | 59991.24 | 6.01 | ASASSN | g | 15.85 (0.15) |
| 2023-02-18 | 59993.24 | 4.01 | ASASSN | g | 15.33 (0.13) |
| 2023-02-22 | 59997.22 | 0.03 | ASASSN | g | 15.16 (0.12) |
| 2023-02-26 | 60001.20 | 3.95 | ASASSN | g | 15.45 (0.13) |
| 2023-02-28 | 60003.72 | 6.47 | ASASSN | g | 15.47 (0.13) |
| 2023-03-03 | 60006.76 | 9.51 | ASASSN | g | 15.84 (0.19) |
| 2023-03-10 | 60013.99 | 16.74 | ASASSN | g | 16.02 (0.20) |
| 2023-03-13 | 60016.98 | 19.73 | ASASSN | g | 16.09 (0.15) |
| 2023-03-17 | 60020.40 | 23.15 | ASASSN | g | 16.25 (0.15) |
| 2023-03-20 | 60023.38 | 26.13 | ASASSN | g | 16.28 (0.15) |
| 2023-03-23 | 60026.34 | 29.09 | ASASSN | g | 16.37 (0.16) |
| 2023-03-26 | 60029.36 | 32.11 | ASASSN | g | 16.46 (0.15) |
| 2023-03-28 | 60031.46 | 34.21 | ASASSN | g | 16.62 (0.15) |
| 2023-03-31 | 60034.61 | 37.36 | ASASSN | g | 16.76 (0.27) |
| 2023-04-09 | 60043.87 | 46.62 | ASASSN | g | 16.95 (0.22) |
| 2023-04-15 | 60049.64 | 52.39 | ASASSN | g | 17.14 (0.22) |
| 2023-04-21 | 60055.40 | 58.15 | ASASSN | g | 17.13 (0.22) |
| 2023-02-18 | 59993.34 | 3.91 | ATLAS | c | 15.83 (0.11) |
| 2023-02-22 | 59997.96 | 0.71 | ATLAS | c | 15.42 (0.11) |
| 2023-02-26 | 60001.70 | 4.45 | ATLAS | c | 15.68 (0.11) |
| 2023-03-02 | 60005.28 | 8.03 | ATLAS | c | 15.87 (0.11) |
| 2023-03-17 | 60020.95 | 23.70 | ATLAS | c | 16.67 (0.12) |
| 2023-03-29 | 60032.95 | 35.70 | ATLAS | c | 16.99 (0.12) |
| 2023-04-13 | 60047.83 | 50.58 | ATLAS | c | 17.40 (0.16) |
| 2023-04-15 | 60049.73 | 52.48 | ATLAS | c | 17.76 (0.15) |
| 2023-04-17 | 60051.39 | 54.14 | ATLAS | c | 17.79 (0.14) |
| 2023-04-21 | 60055.80 | 58.55 | ATLAS | c | 18.00 (0.17) |
| 2023-04-23 | 60057.37 | 60.12 | ATLAS | c | 18.10 (0.17) |
| 2023-05-15 | 60079.33 | 82.08 | ATLAS | c | 18.35 (0.24) |
| 2023-05-18 | 60082.78 | 85.53 | ATLAS | c | 18.72 (0.27) |
| 2023-06-10 | 60105.33 | 108.08 | ATLAS | c | 18.67 (0.26) |
| 2023-06-12 | 60107.55 | 110.30 | ATLAS | c | 18.51 (0.25) |
| 2023-06-15 | 60110.99 | 113.74 | ATLAS | c | 18.96 (0.37) |
| 2023-06-18 | 60113.34 | 116.09 | ATLAS | c | 18.95 (0.36) |
| Date | MJD | Phase (d) | Telescope | Band | Mag (Error) |
|---|---|---|---|---|---|
| 2023-02-17 | 59992.36 | 4.89 | ZTF | r | 16.14 (0.11) |
| 2023-03-13 | 60016.35 | 19.10 | ZTF | r | 16.27 (0.10) |
| 2023-03-28 | 60031.30 | 34.05 | ZTF | r | 16.75 (0.11) |
| 2023-04-24 | 60058.21 | 60.96 | ZTF | r | 17.78 (0.15) |
| 2023-05-26 | 60090.18 | 92.93 | ZTF | r | 18.22 (0.23) |
| 2023-06-04 | 60099.25 | 102.00 | ZTF | r | 18.30 (0.23) |
| 2023-02-11 | 59986.47 | 10.78 | ATLAS | o | 18.86 (99.00) |
| 2023-02-13 | 59988.03 | 9.22 | ATLAS | o | 18.45 (0.22) |
| 2023-02-14 | 59989.24 | 8.01 | ATLAS | o | 18.10 (0.18) |
| 2023-02-15 | 59990.33 | 6.92 | ATLAS | o | 17.82 (0.15) |
| 2023-02-27 | 60002.10 | 4.85 | ATLAS | o | 16.10 (0.10) |
| 2023-02-28 | 60003.94 | 6.69 | ATLAS | o | 16.17 (0.10) |
| 2023-03-03 | 60006.13 | 8.88 | ATLAS | o | 16.16 (0.11) |
| 2023-03-04 | 60007.94 | 10.69 | ATLAS | o | 16.12 (0.11) |
| 2023-03-10 | 60013.75 | 16.50 | ATLAS | o | 16.56 (0.12) |
| 2023-03-13 | 60016.71 | 19.46 | ATLAS | o | 16.63 (0.10) |
| 2023-03-14 | 60017.95 | 20.70 | ATLAS | o | 16.93 (0.13) |
| 2023-03-17 | 60020.93 | 23.68 | ATLAS | o | 16.59 (0.12) |
| 2023-03-19 | 60022.25 | 25.00 | ATLAS | o | 16.95 (0.11) |
| 2023-03-21 | 60024.85 | 27.60 | ATLAS | o | 17.25 (0.12) |
| 2023-03-23 | 60026.45 | 29.20 | ATLAS | o | 17.46 (0.17) |
| 2023-03-26 | 60029.02 | 31.77 | ATLAS | o | 17.28 (0.12) |
| 2023-03-27 | 60030.39 | 33.14 | ATLAS | o | 17.24 (0.12) |
| 2023-03-30 | 60033.76 | 36.51 | ATLAS | o | 17.41 (0.14) |
| 2023-03-31 | 60034.88 | 37.63 | ATLAS | o | 17.47 (0.15) |
| 2023-04-07 | 60041.64 | 44.39 | ATLAS | o | 17.48 (0.19) |
| 2023-04-09 | 60043.91 | 46.66 | ATLAS | o | 17.40 (0.17) |
| 2023-04-11 | 60045.42 | 48.17 | ATLAS | o | 17.69 (0.18) |
| 2023-05-08 | 60072.10 | 74.85 | ATLAS | o | 18.37 (0.29) |
| 2023-05-21 | 60085.29 | 88.04 | ATLAS | o | 18.77 (0.26) |
| 2023-05-25 | 60089.28 | 92.03 | ATLAS | o | 18.54 (0.22) |
| 2023-03-14 | 60018.07 | 20.82 | NOT | J | 17.38 (0.12) |
| 2023-04-25 | 60059.98 | 62.73 | NOT | J | 18.97 (0.10) |
| 2023-05-29 | 60094.89 | 97.64 | NOT | J | 19.50 (0.13) |
| 2023-03-14 | 60018.07 | 20.82 | NOT | H | 17.72 (0.11) |
| 2023-04-25 | 60059.98 | 62.73 | NOT | H | 18.75 (0.15) |
| 2023-05-29 | 60094.89 | 97.64 | NOT | H | 19.47 (0.21) |
| 2023-03-14 | 60018.07 | 20.82 | NOT | K | 18.23 (0.11) |
| 2023-04-25 | 60059.98 | 62.73 | NOT | K | 18.62 (0.13) |
| 2023-05-29 | 60094.89 | 97.64 | NOT | K | 19.13 (0.11) |
Appendix B Supplementary figures