Magneto-Thermoelectric Transport in
Graphene Quantum Dot with Strong Correlations
Abstract
Disorder at the etched edges of graphene quantum dots (GQD) enables random all-to-all interactions between localized charges in partially-filled Landau levels, providing a potential platform to realize the Sachdev-Ye-Kitaev (SYK) model. We use quantum Hall edge states in the graphene electrodes to measure electrical conductance and thermoelectric power across the GQD. We observe a rapid diminishing of electric conductance fluctuations and slowly decreasing thermoelectric power across the GQD with increasing temperature, consistent with recent theoretical predictions for the SYK regime.
Strong electronic correlations can generate an emergent system that hosts collective excitations without quasiparticles, deviating from the conventional Fermi liquid picture. One proposed description is the Sachdev-Ye-Kitaev (SYK) model, characterized by random, all-to-all four-body interactions. Originally a model for strange metals and complex quantum phases [1], this model also has been shown to be holographically dual to theories of quantum gravity [2, 3, 4], prompting searches for an experimental, solid-state realization of the SYK model [5].
Generating an SYK state requires many electrons at the same energy with random all-to-all interactions. A theoretical proposal suggests creating these conditions by applying an external magnetic field to a graphene quantum dot (GQD) with an irregular boundary [6, 7]. The dispersionless nature of Landau levels (LLs) on the lattice allow the electrons inside the GQD to remain nearly degenerate, despite the presence of edge disorder. The irregular shape of the GQD edge causes the electronic wavefunctions to acquire a random spatial structure, creating random all-to-all interactions between the degenerate fermions in the dot, precisely as needed for the SYK model.
Experimentally, it has been shown that the charge transport across etch-defined GQDs often exhibits the emergence of chaotic dynamics, as a result of the combination of confinement and disorder [8, 9]. Detailed theoretical modeling [7] suggests that an etch-defined, nanoscale GQD subjected to quantizing out-of-plane magnetic fields of 10-20 T may host strongly-correlated dynamics reminiscent of the SYK model. Due to the non-Fermi liquid (NFL) nature of the SYK system, transport through SYK GQDs can produce distinctive characteristic behavior compared to a Fermi liquid (FL) description. For example, nonvanishing extensive entropy in the low-temperature in a SYK QD produces temperature-independent, non-vanishing thermoelectric power (TEP), strongly deviating from the conventional Mott prediction in the FL regime [10]. Electrical conductance fluctuations, which in the FL regime are large and governed by single-particle random matrix theory, are suppressed in the SYK regime, a result of the absence of quasiparticle excitations [11]. Since FL-to-NFL transition in the GQD can be tuned by magnetic field and temperature [12], temperature- and field-dependent transport through the dot can be utilized to investigate emergence of SYK physics in this system.
In this work, we study the interplay of disorder, spatial confinement and strong electronic interactions in disordered GQD subjected to quantizing magnetic fields of up to 10 T. We measure electrical conductance and TEP across the GQD as a function of temperature, identifying a low-temperature FL phase and high-temperature NFL phase separated by a transition regime. We observe strong suppression of electrical conductance fluctuations and nearly temperature-independent TEP in the NFL regime, consistent with theoretical expectations for the SYK model.
The inset of Figure 1(a) shows a schematic diagram and electron microscope picture of a GQD used in this study. The device consists of hBN-encapsulated monolayer graphene with top and bottom graphite gates, fabricated using standard polymer stacking techniques [13, 14]. We shape the heterostructure into a Hall bar geometry using reactive ion etching, then etch a constriction with a 100 nm diameter island in the center, dividing the active region of the device into two large reservoirs that act as external contacts coupled to the central graphene dot. The top graphite gate above the constriction has been removed to enable independent tuning of the charge carrier densities in the GQD and graphene reservoirs. We note that the bottom graphite is separated from GQD with a thin (5.1 nm) hBN layer in order to reduce the Coulomb charging energy.
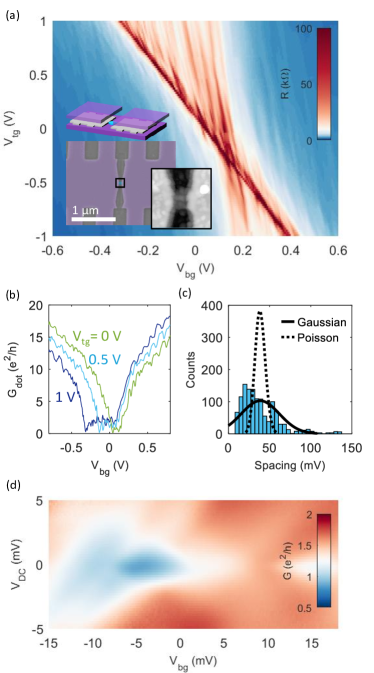
The resistance measured across the dot () is measured by biasing the GQD using the graphene reservoir electrodes. Figure 1(a) shows as a function of the bottom and top graphite gate voltages, and . The main diagonal feature in this plot corresponds to the charge neutrality point (CNP) of the graphene reservoirs. Near this reservoir CNP line, an array of steeper vertical features strongly controlled by arise from conductance fluctuations in the dot. Due to our device structure, it is expected that the GQD is more strongly coupled to the bottom gate than the top gate. Line cuts of the dot conductance in Figure 1(b) highlight these features, which resemble previous studies of etched GQDs [8, 15]. We also observe that the is maximized (100 k) when both the reservoirs and the GQD are at their respective CNPs. We can identify 4 different segmented regions bounded by the CNP lines of the reservoirs and GQD in the – plane. Generally we find is larger in the (reservoirs -doped and GQD -doped) or regimes compared to and regimes due to the reduced coupling of GQD to the reservoirs when their charge carrier polarities are opposite.
A histogram of conductance minima spacing in the regime (Fig. 1(c)) shows better resemblance to Gaussian than Poissonian statistics, suggesting chaotic dynamics [8, 16]. Figure 1(d) shows a bias voltage () and gate voltage dependent conductance map in a suppressed conductance region of Fig. 1(b), where the GQD is near its CNP while the reservoirs are -doped. We find the conductance in this stability diagram remains finite and lacks sharp Coulomb blockade features, suggesting the charging energy of the GQD is much smaller than the experimental base temperature of 350 mK. This is consistent with our design parameters for the device.
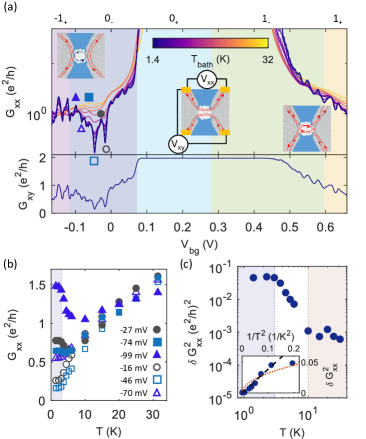
Upon applying a strong perpendicular magnetic field, , the wide graphene reservoir regions show a robust onset of the quantum Hall (QH) effect (see Supplemental Material (SM)). We use the QH edge states in the reservoir regions to deliver charge current to the GQD. As shown in the insets of Figure 2(a), we measure the longitudinal (transverse) voltage (). The upper and lower panels of Figure 2(a) show the corresponding longitudinal (transverse) conductance () as a function of . Here, we keep the graphene reservoirs at constant filling fraction by adjusting the top and bottom gate voltages simultaneously. In these measurements, we observe three principal zones of behavior: (1) suppressed conductance when the dot and reservoirs have opposite carrier types (i.e., or regimes); (2) full transmission of integer QH edge states (i.e., the GQD is in QHE regime, resulting in in Fig. 2(a)); and (3) reentrance of finite conductance fluctuations where . Combining this gate-dependent transport data with the TEP measured across the GQD (see Fig. 4(a), which will be discussed later), we can identify the gate voltage regions corresponding to the Landau level (LL) specified by , where is the LL index and subscript corresponds to the electron (hole) side of the LL.
Since the LL filling fraction of the graphene reservoir regions is kept at , the GQD is weakly coupled to graphene electrodes for . This condition prevents the highly-conductive QH edge states from shorting the graphene reservoirs, allowing us to study charge transport through the GQD. The QH edge states in the reservoir serve as few-mode FL electrodes, tunnel coupled to the GQD. Employing a small number of FL modes to probe the GQD is important for preserving signatures of SYK physics, as coupling an SYK dot to a large number of FL modes is predicted to disrupt the SYK phase [12, 17]. In this transport regime, where the GQD filling changes from to , we find exhibits large fluctuations as is changed. As the temperature increases, these fluctuations diminish toward a smoothly and slowly-varying background value, as shown in the upper panel of Figure 2(a). To highlight the temperature-dependent electrical conductance changes in the SYK transport regime, Figure 2(b) shows the temperature dependence of local extrema of in the GQD regime, with specific minima (maxima) marked by open (closed) symbols in Figure 2(a). We find that the temperature dependence of the local minima of is nearly flat for temperature 3 K, then linearly increasing at higher temperatures. Local conductance maxima in the same transport regime similarly show nearly-constant magnitudes up to K, drop toward the values of the minima as temperature increases to K, and increase approximately linearly as the temperature increases further.
To quantify the temperature dependence GQD conductance fluctuation, we study the variance of the conductance within transport regime after subtracting the broadly-modulated baseline value. Figure 2(c) shows in the temperature range between 1.4 K and 30 K. This analysis highlights two relevant transition temperatures identified in the behavior of discussed above: while in the low temperature limit K, is nearly constant, for K, decreases rapidly, then less steeply for .
Recent theoretical work[7, 11] has predicted strong suppression of in SYK QDs coupled to FL reservoirs. In the presence of single-particle hopping energy between the localized states, SYK physics can be realized when the temperature is smaller than the coherence energy , where is the strength of all-to-all interactions in the SYK dot. Here, the theory predicts for , crossing over to for [11]. As shown in Figure 2(c), the experimentally-observed variance exhibits in the high-temperature limit (blue dashed line in inset), followed by in the intermediate temperature regime, before saturating in the low temperature limit. The strong suppression () of the conductance fluctuations that we observe is a potential hallmark of SYK dynamics in the GQD, although the exact predicted temperature dependence is contingent on the coupling between the GQD and the reservoirs [12, 11].
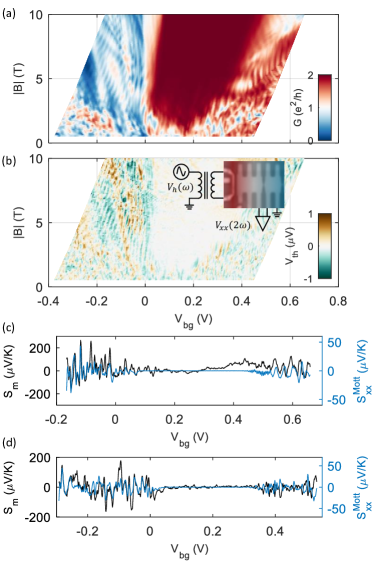
The strong suppression of conductance fluctuations in the GQD described above spurs us to investigate its thermoelectric response in similar transport regimes, in search of a more distinctive signature of the emergence of SYK physics [10, 11, 18]. Here, we apply an AC bias at frequency to a substrate heater at the edge of one of the graphene reservoirs (inset of Fig. 3(b)). The heating current generates a temperature gradient across the device modulated at frequency . By measuring the voltage response across the GQD at frequency , we obtain the thermoelectric voltage in response to the temperature difference across the GQD. Figure 3(a-b) provides a comparison of the magnetic field dependence of (measured in the center of the plateau at each field) with the thermally-induced voltage . In the magnetic field-dependent measurement (Fig. 3(a)), both reservoir edge states are transmitted through the GQD in a wide range of densities down to 3 T. The and regimes show shifting patterns of oscillations as a function of and the carrier density in the GQD, reminiscent of previous studies of larger quantum Hall and junctions[19, 20, 21, 22, 23]. At lower magnetic fields, the region of maximal conductance through the dot shrinks and the transport becomes completely dominated by fluctuations. The thermally-induced voltage measured under the same conditions (Fig. 3(b)) exhibits many of similar features, suggesting a strong correlation between the conductance and TEP in the GQD.
To obtain the TEP of the dot, , we need to estimate across the GQD for a given heater bias . We employ temperature-dependent minima in the QHE regime, measured at a pair of contacts in the graphene reservoirs. The minima of are lifted as a function of the thermal bath temperature and , which allow us to estimate the temperature difference across the GQD, after considering the device geometry (see SM for details).
As a benchmark, we compare the measured TEP with a generalized version of the conventional Mott formula [24],
| (1) |
where is the electrical conductance tensor and is the chemical potential. At T (Fig. 3(c)), these quantities are broadly similar, but their magnitudes differ significantly. There is greater qualitative resemblance at lower magnetic field T (Fig. 3(d)), but the magnitudes of is larger than .
An important contributing factor to the magnitude discrepancy is likely that is calculated based on measurements of the nearest pair of voltage leads in the two reservoirs, which is necessarily larger than the temperature gradient across the dot itself. In contrast, arises almost entirely in the dot, since the reservoirs are kept at = 2, which does not contribute to the TEP in this experimental configuration [25, 24, 26, 27]. As such, it is to be expected that overestimates the true TEP of the GQD. For these reasons, our observation is consistent with expectations. In the following analysis, we discuss trends in the TEP that are not impacted by questions of geometric rescaling.
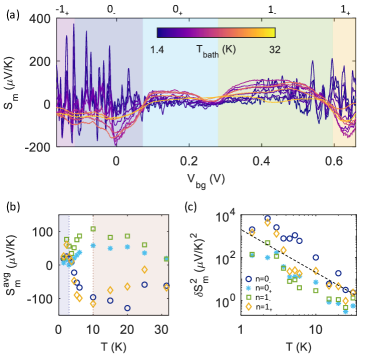
Examining the temperature-dependent TEP reveals many of the similar relevant energy scales and regimes of behavior as we observe in the electrical conductance. Figure 4(a) shows as a function of at T, at temperatures between 1.4 and 32 K. In the low temperature limit, follows the same gate dependence trend as , as discussed above. Particularly, in the region 0.10.4 V. This gate range is where we observe , indicating both the GQD and graphene reservoirs are in the QH state. Vanishing TEP in the regime of the QH plateau is in agreement with previous studies [24, 28, 25, 26, 29]. Outside of this QHE plateau region, however, and exhibit rapid oscillations. The fact that the pattern of fluctuations can be explained by Eq. 1 suggests that the resonance transport across the GQD is responsible for these rapid changes of as a function of .
As increases, similar to the higher-temperature behavior of , the fluctuations of as a function of gate voltage are suppressed. In the high-temperature regime ( K), at half-filling of the LLs (i.e, gate voltage corresponding to the transitions between and for LL and between and for LL), due to the particle-hole symmetry across the LL in the GQD. We also observe at the transition between and for K, which corresponds to the center of the well-developed QHE plateau at across the entire device. Away from these vanishing points of TEP, varies smoothly. We found, however, unlike the low-temperature regime ( K), does not follow the trend of at high temperatures ( K), suggesting the breakdown of the single-particle picture described by the Mott formula (see SM for additional data).
Fig. 4(b) shows , the temperature-dependent averaged within the gate voltage regions corresponding to . In all gate regimes, we find that exhibits distinctively different characteristic temperature-dependent behaviors. For , changes relatively slowly as large gate-dependent fluctuations dominate, similar to the low-temperature regime of discussed previously. For , monotonically increases as increases until it reaches the maximum value near , and then decreases slowly as temperature increases further. We further compute the variance of the TEP, , in each sector (Fig. 4(c)). We find that decreases as increases, generally consistent with scaling across the entire measured range.
The complete breakdown of the Mott formalism in the high-temperature regime, particularly the slowly decreasing we observe for , is inconsistent with conventional FL physics in the GQD. Indeed, recent numerical modeling of the GQD thermoelectric properties [11] predicts that the TEP in the low-temperature FL regime transitions into the SYK regime at higher temperatures, where slowly decreasing TEP is expected. Our experimental observations bear a resemblance to these theoretical predictions, suggesting an identification of as related to the energy scale of coupling to the reservoirs and . However, we note that the temperature dependence of is inconsistent with the predictions of scaling in this theoretical study. Some of these discrepancies from the theory, particularly in SYK regime, may be related to the relatively small population of SYK modes in the GQD [10]. The approximate number of localized states at T is , where is the area of the GQD. While , it is still far from the conformal limit (), necessitating the inclusion of higher-order terms to fully account for the temperature scaling behavior, and the consideration of as another relevant energy scale. It is also possible that the strength of , which we cannot directly measure, is significantly smaller than recent theoretical assumptions [12, 10, 7]. In this case, the system may never access the conformal limit of the SYK model, instead inhabiting a crossover regime between Fermi liquid and SYK dynamics [30].
In conclusion, we have fabricated GQDs with suppressed single-electron charging energy. Under strong magnetic fields, edge disorder alters charge transport in the strongly-correlated electronic system at elevated temperatures. We observe temperature-dependent conductance fluctuation and thermoelectric power that exhibit transitioning behaviors from the FL to the putative SYK regime. Further experimental and theoretical studies, particularly considering the effects of varied coupling between the FL leads and the GQD, may distinguish between the emergence of an SYK phase and alternative scenarios, such as disordered junction network formation [19, 23] in the disordered GQD under magnetic fields. For more comprehensive statistics on disorder averaging, it will be beneficial to undertake a series of similar experiments with different GQDs, complemented by extensive characterization of the temperature- and magnetic field-dependent transport behavior. Furthermore, shot noise measurements might yield valuable insights into SYK dynamics [31]. Our work demonstrates the possibility of disordered GQDs as an SYK platform and provides a first step toward experimental exploration of this novel quantum phase in solid-state systems.
Acknowledgements.
The authors thank Bertrand Halperin and Alexander Altland for useful discussions. The major part of the experiment was supported by DOE (DE-SC0012260). L.E.A acknowledges support from ONR MURI (N00014-21-1-2537). K.W. and T.T. acknowledge support from the JSPS KAKENHI (Grant Numbers 20H00354 and 23H02052) and World Premier International Research Center Initiative (WPI), MEXT, Japan. H.S. and S.S. acknowledge support from U.S. National Science Foundation grant No. DMR-2245246. A.K. was supported by the Branco Weiss Society in Science, ETH Zurich, through the grant on flat bands, strong interactions and SYK physics, and Swiss National Science Foundation Grant No. CRSK-2_221180. This work was performed, in part, at the Center for Nanoscale Systems (CNS), a member of the National Nanotechnology Infrastructure Network, which is supported by the NSF under Grant No. ECS-0335765. CNS is part of Harvard University.References
- Sachdev and Ye [1993] S. Sachdev and J. Ye, Physical Review Letters 70, 3339 (1993).
- Kitaev [2015] A. Kitaev, Talk at KITP Program “Entanglement in Strongly-Correlated Quantum Matter” (2015).
- Sachdev [2010] S. Sachdev, Physical Review Letters 105, 151602 (2010).
- Chowdhury et al. [2022] D. Chowdhury, A. Georges, O. Parcollet, and S. Sachdev, Reviews of Modern Physics 94, 035004 (2022).
- Franz and Rozali [2018] M. Franz and M. Rozali, Nature Reviews Materials 3, 491 (2018).
- Chen et al. [2018] A. Chen, R. Ilan, F. de Juan, D. I. Pikulin, and M. Franz, Physical Review Letters 121, 036403 (2018).
- Brzezińska et al. [2023] M. Brzezińska, Y. Guan, O. V. Yazyev, S. Sachdev, and A. Kruchkov, Physical Review Letters 131, 036503 (2023).
- Ponomarenko et al. [2008] L. A. Ponomarenko, F. Schedin, M. I. Katsnelson, R. Yang, E. W. Hill, K. S. Novoselov, and A. K. Geim, Science 320, 356 (2008).
- Engels et al. [2013] S. Engels, A. Epping, C. Volk, S. Korte, B. Voigtländer, K. Watanabe, T. Taniguchi, S. Trellenkamp, and C. Stampfer, Applied Physics Letters 103, 073113 (2013).
- Kruchkov et al. [2020] A. Kruchkov, A. A. Patel, P. Kim, and S. Sachdev, Physical Review B 101, 205148 (2020).
- Shackleton et al. [2023] H. Shackleton, L. E. Anderson, P. Kim, and S. Sachdev, arXiv:2309.05741 (2023).
- Can et al. [2019] O. Can, E. M. Nica, and M. Franz, Physical Review B 99, 045419 (2019).
- Dean et al. [2010] C. R. Dean, A. F. Young, I. Meric, C. Lee, L. Wang, S. Sorgenfrei, K. Watanabe, T. Taniguchi, P. Kim, K. L. Shepard, and J. Hone, Nature Nanotechnology 5, 722 (2010).
- Wang et al. [2013] L. Wang, I. Meric, P. Y. Huang, Q. Gao, Y. Gao, H. Tran, T. Taniguchi, K. Watanabe, L. M. Campos, D. A. Muller, J. Guo, P. Kim, J. Hone, K. L. Shepard, and C. R. Dean, Science 342, 614 (2013).
- Güttinger et al. [2009] J. Güttinger, C. Stampfer, F. Libisch, T. Frey, J. Burgdörfer, T. Ihn, and K. Ensslin, Physical Review Letters 103, 046810 (2009).
- Huang et al. [2011] L. Huang, Y. C. Lai, and C. Grebogi, Chaos 21, 013102 (2011).
- Banerjee and Altman [2017] S. Banerjee and E. Altman, Physical Review B 95, 134302 (2017).
- Davison et al. [2017] R. A. Davison, W. Fu, A. Georges, Y. Gu, K. Jensen, and S. Sachdev, Physical Review B 95, 155131 (2017).
- Wei et al. [2018] D. S. Wei, T. van der Sar, S. H. Lee, K. Watanabe, T. Taniguchi, B. I. Halperin, and A. Yacoby, Science 362, 229 (2018).
- Williams et al. [2007] J. R. Williams, L. DiCarlo, and C. M. Marcus, Science 317, 638 (2007).
- Abanin and Levitov [2007] D. A. Abanin and L. S. Levitov, Science 317, 641 (2007).
- Özyilmaz et al. [2007] B. Özyilmaz, P. Jarillo-Herrero, D. Efetov, D. A. Abanin, L. S. Levitov, and P. Kim, Physical Review Letters 99, 166804 (2007).
- Wang et al. [2019] K. Wang, A. Harzheim, T. Taniguchi, K. Watanabei, J. U. Lee, and P. Kim, Physical Review Letters 122, 146801 (2019).
- Zuev et al. [2009] Y. M. Zuev, W. Chang, and P. Kim, Physical Review Letters 102, 096807 (2009).
- Checkelsky and Ong [2009] J. G. Checkelsky and N. P. Ong, Physical Review B 80, 081413(R) (2009).
- Ghahari Kermani [2014] F. Ghahari Kermani, Interaction Effects on Electric and Thermoelectric Transport in Graphene, Ph.D. thesis, Columbia University (2014).
- Duan et al. [2018] W. Duan, J. F. Liu, C. Zhang, and Z. Ma, Physica E: Low-Dimensional Systems and Nanostructures 104, 173 (2018).
- Wei et al. [2009] P. Wei, W. Bao, Y. Pu, C. N. Lau, and J. Shi, Physical Review Letters 102, 166808 (2009).
- Ghahari et al. [2016] F. Ghahari, H. Y. Xie, T. Taniguchi, K. Watanabe, M. S. Foster, and P. Kim, Physical Review Letters 116, 136802 (2016).
- Altland et al. [2019] A. Altland, D. Bagrets, and A. Kamenev, Physical Review Letters 123, 226801 (2019).
- Nikolaenko et al. [2023] A. Nikolaenko, S. Sachdev, and A. A. Patel, Physical Review Research 5, 043143 (2023).