SN 2020udy: A new piece of the homogeneous bright group in the diverse Iax subclass
Abstract
We present optical observations and analysis of a bright type Iax SN 2020udy hosted by NGC 0812. The light curve evolution of SN 2020udy is similar to other bright Iax SNe. Analytical modeling of the quasi bolometric light curves of SN 2020udy suggests that 0.080.01 M⊙ of 56Ni would have been synthesized during the explosion. Spectral features of SN 2020udy are similar to the bright members of type Iax class showing weak Si II line. The late-time spectral sequence is mostly dominated by Iron Group Elements (IGEs) with broad emission lines. Abundance tomography modeling of the spectral time series of SN 2020udy using TARDIS indicates stratification in the outer ejecta, however, to confirm this, spectral modeling at a very early phase is required. After maximum light, uniform mixing of chemical elements is sufficient to explain the spectral evolution. Unlike the case of normal type Ia SNe, the photospheric approximation remains robust until +100 days, requiring an additional continuum source. Overall, the observational features of SN 2020udy are consistent with the deflagration of a Carbon-Oxygen white dwarf.
1 Introduction
Thermonuclear supernovae (SNe), also known as type Ia SNe, are the outcome of the explosive burning of Carbon-Oxygen (CO) white dwarfs. They are known as one parameter family and are extensively used in cosmology as standard candles (Phillips, 1993; Phillips et al., 1999). With the increasing sample, diversity has been observed among type Ia SNe leading to their subclassification (Taubenberger, 2017). Distinguishing different subclasses can help improve the precision of their distance measurements (Wang et al., 2009) and identify their physical origins (Wang et al., 2013).
There are different subtypes of type Ia SNe having some similarities and dissimilarities. Amongst them, type Iax SNe (Li et al., 2003; Jha et al., 2006b; Foley et al., 2013) are one of the peculiar subclasses of SNe Ia, having low luminosity (Mr = 12.7 mag, Karambelkar et al. 2021 to MV = 18.4 mag, Narayan et al. 2011) and lower energy budget (Jha, 2017, and references therein). The light curves of SNe Iax are characterized by a faster rise to the maximum and post-maximum decline in the bluer bands than normal type Ia SNe (Magee et al., 2016, 2017; Jha, 2017; Li et al., 2018). Due to the lack of fairly good pre-maximum coverage for a good fraction of type Iax SNe, precise measurement of peak absolute magnitudes and rise time is difficult. This also poses a problem in putting strong observational constraints on the explosion models. The occurrence rate of SNe Iax is 5% to 30% of that of normal type Ia SNe (Foley et al., 2013; Miller et al., 2017; Srivastav et al., 2022).
As a class, type Iax SNe show homogeneous spectral evolution (Jha et al., 2006a; Jha, 2017) with low expansion velocities at maximum ranging from 2000 to 8000 km s-1 (Foley et al., 2009; Stritzinger et al., 2014). The early spectra of SNe Iax show Fe III features along with features due to intermediate mass elements (IMEs), similar to 1991T-like SNe. During the late phase, type Iax SNe exhibit significant differences from the type Ia class. Strong and wide P-Cygni lines dominate the optical wavelengths until 4-6 months after explosion. Even later, type Iax SNe do not enter into a fully nebular phase. Permitted spectral lines mainly of Fe co-exist with forbidden emission lines in the late time spectra of all type Iax SNe (McCully et al., 2014a; Stritzinger et al., 2015; Foley et al., 2016). The spectral synthesis of SN 2014dt (the only example with continuous observations from its maximum to +550 days) showed that the assumption of an expanding photosphere provides a remarkable match with the observed spectral evolution during the first days. At even later epochs, the approximation is capable of reproducing the P-Cygni lines formed by Fe, Ca, and Na (Camacho-Neves et al., 2023).
The progenitor system and explosion scenario of type Iax SNe has been a matter of debate for many years. Being low luminosity and less energetic events, type Iax SNe hint towards a different progenitor scenario from type Ia SNe. High-resolution pre-explosion images of a few type Iax SNe, obtained with the HST, are used to identify the progenitor systems of these events. SN 2012Z is one such type Iax SNe, hosted by a nearby galaxy NGC 1309. McCully et al. (2014b) analyzed the pre-explosion images of SN 2012Z and suggested that a binary consisting of a white dwarf and Helium star is one of the most plausible progenitor systems for SN 2012Z. Another type Iax with pre-explosion images is SN 2014dt, and a similar progenitor system has been suggested as one of the possibilities (Foley et al., 2015) for this SN. However, except for a few type Iax SNe (Foley et al., 2013; Greiner et al., 2023), helium is not detected in spectroscopic studies (White et al., 2015; Jacobson-Galán et al., 2019; Magee et al., 2019).
The observed explosion parameters of many of the bright type Iax SNe are successfully explained by the pure deflagration of a CO white dwarf (Jordan et al., 2012; Kromer et al., 2013; Fink et al., 2014). However, several other explosion models have been proposed to explain the observational properties of bright type Iax SNe such as pulsational delayed detonation (PDD, Baron et al. 2012; Dessart et al. 2014), deflagration to detonation transition (DDT, Seitenzahl et al. 2013; Sim et al. 2013), etc. The deflagration of CO white dwarf cannot explain the observables of faint members of this class. Instead, they can be explained by the deflagration of a hybrid Carbon–Oxygen–Neon (CONe) white dwarf (Meng & Podsiadlowski, 2014; Kromer et al., 2015).
SN 2020udy was spotted by Nordin & Perley (2020) using automated detection software AMPEL (Nordin et al., 2019) in association with Zwicky Transient Facility (ZTF, Bellm et al. 2019; Fremling et al. 2020) on 24 September 2020 and was classified as type Iax SN (Nordin et al. 2020a, b). The SN exploded in a spiral galaxy NGC 0812 at a redshift of 0.017222 (Falco et al., 1999). The SN was located at R.A.(J2000.0) 02h06m49.35s, Dec.(J2000.0) 44o35′15.29′′, 52.82 N and 23.13 W from the center of the host galaxy.
Maguire et al. (2023) have presented an analysis of SN 2020udy. The very early detection of the SN allowed them to place strict limits on companion interaction. They ruled out the possibility of a main sequence star with mass 2 and 6 M⊙, to be the companion, however a helium star with a narrow range of viewing angle is suggested as a probable companion. They have shown that the light curve and spectra of SN 2020udy are in good agreement with the deflagration model of a CO white dwarf, specifically the N5-def model of Fink et al. (2014).
This paper presents a detailed photometric and spectroscopic analysis of SN 2020udy. The light curve has been modeled using analytical prescription proposed by Arnett (1982) and Valenti et al. (2008). To confirm the line identification and expansion velocity of the ejecta, the early spectral sequence is modeled with SYNAPPS. One-dimensional radiative transfer code TARDIS has been used to perform abundance tomography modeling of the entire observed spectral sequence. Section 2 gives details about observations and methods used to reduce the data of SN 2020udy. In Section 3 we estimate the distance, the explosion time, and the line-of-sight extinction of the SN. Section 4 presents the photometric properties and the modeling of the pseudo-bolometric light curve of SN 2020udy. Spectroscopic features of SN 2020udy, the evolution of the photospheric velocity, and spectral modeling are presented in Section 5. A brief discussion of the observational features of SN 2020udy and their comparison with a few explosion scenarios proposed for the type Iax class are given in Section 6. Section 7 summarizes our results.
2 Observations and data reduction
Optical photometric follow-up of SN 2020udy began 5 days after discovery and continued up to 130 days, with the 1 m Las Cumbres Observatory (LCO) telescopes (Brown et al., 2013) under the Global Supernova Project and 80 cm Tsinghua-NAOC Telescope (TNT, Wang et al. 2008; Huang et al. 2012, National Astronomical Observatories of China). The observations were carried out in the BgVri photometric bands.
The LCO photometric data were reduced using the lcogtsnpipe routines (Valenti et al., 2016), which performs point-spread-function (PSF) photometry of the stars and the SN. The instrumental BV magnitudes were calibrated to the Vega system using the APASS catalog (Henden et al., 2016) 111https://www.aavso.org/aavso-photometric-all-sky-survey-data-release-1 and the instrumental gri magnitudes were calibrated to the AB system using the SDSS catalog (Gunn et al., 2006).
The pre-processing of the photometric data, obtained with the 80 cm TNT was carried out following standard procedures using a custom Fortran program. The photometry was then performed by the automatic pipeline ZrutyPhot (Jun Mo, et al., in prep.). The pipeline utilizes the Software for Calibrating AstroMetry and Photometry (SCAMP, Bertin 2006) and the IRAF222Image Reduction and Analysis Facility, http://iraf.noao.edu/ Daophot package. The TNT instrumental magnitudes of the SN were calibrated to the Vega system and the instrumental magnitudes were calibrated to the AB system using the PanSTARRS (Panoramic Survey Telescope and Rapid Response System333https://catalogs.mast.stsci.edu/panstarrs) catalog. The optical photometry of SN 2020udy are tabulated in Table LABEL:tab:photometric_observational_log_2020udy. The errors mentioned in Table LABEL:tab:photometric_observational_log_2020udy are obtained by propagating the photometric and the calibration errors in quadrature.
| Date | JD† | Phase‡ | B | g | V | r | i | Telescope |
|---|---|---|---|---|---|---|---|---|
| (Days) | (mag) | (mag) | (mag) | (mag) | (mag) | |||
| 2020-09-29 | 122.24 | -8.29 | 17.270.02 | 17.160.01 | 17.270.02 | 17.170.01 | 17.340.02 | 2 |
| 2020-10-01 | 124.23 | -6.30 | 16.910.03 | 16.820.01 | 16.920.02 | 16.850.01 | 17.020.01 | 2 |
| 2020-10-02 | 124.98 | -5.55 | 16.800.04 | 16.780.05 | 16.700.03 | 16.720.03 | 16.940.07 | 1 |
| 2020-10-04 | 127.19 | -3.34 | 16.800.02 | 16.580.01 | 16.660.02 | 16.570.00 | 16.690.01 | 2 |
| 2020-10-05 | 127.98 | -2.55 | 16.560.03 | 16.610.04 | 16.420.03 | 16.340.04 | 16.490.05 | 1 |
| 2020-10-05 | 128.23 | -2.30 | 16.740.01 | 16.550.00 | 16.570.01 | 16.480.01 | 16.610.01 | 2 |
| 2020-10-07 | 130.18 | -0.35 | 16.720.01 | 16.460.00 | 16.410.01 | 16.350.00 | 16.470.01 | 2 |
| 2020-10-08 | 130.88 | 0.35 | 16.490.09 | 16.460.13 | 16.100.16 | 16.280.04 | 1 | |
| 2020-10-11 | 133.73 | 3.20 | 16.740.05 | 16.550.06 | 16.230.11 | 16.180.03 | 16.300.04 | 1 |
| 2020-10-16 | 139.23 | 8.70 | 17.380.01 | 16.860.00 | 16.450.00 | 16.210.00 | 16.250.00 | 2 |
| 2020-10-17 | 139.63 | 9.10 | 17.390.03 | 16.990.03 | 16.450.02 | 16.200.04 | 16.190.03 | 1 |
| 2020-10-17 | 140.22 | 9.69 | 17.470.02 | 16.930.01 | 16.480.01 | 16.230.01 | 16.220.01 | 2 |
| 2020-10-18 | 141.19 | 10.66 | 17.630.01 | 17.040.01 | 16.530.01 | 16.260.00 | 16.240.01 | 2 |
| 2020-10-19 | 142.23 | 11.70 | 17.740.02 | 17.130.01 | 16.590.01 | 16.280.00 | 16.240.01 | 2 |
| 2020-10-20 | 142.77 | 12.24 | 17.770.09 | 17.400.05 | 16.700.09 | 16.320.05 | 16.220.06 | 1 |
| 2020-10-21 | 144.21 | 13.68 | 18.030.02 | 17.380.01 | 16.750.01 | 16.390.00 | 16.310.00 | 2 |
| 2020-10-22 | 144.94 | 14.41 | 18.060.04 | 17.680.06 | 16.840.05 | 16.500.10 | 16.330.08 | 1 |
| 2020-10-22 | 144.94 | 14.41 | 18.100.07 | 17.610.05 | 16.860.06 | 16.510.09 | 16.310.09 | 1 |
| 2020-10-23 | 146.33 | 15.80 | 18.290.02 | 17.590.00 | 16.920.01 | 16.500.00 | 16.400.00 | 2 |
| 2020-10-25 | 148.29 | 17.76 | 18.510.03 | 17.790.01 | 17.050.01 | 16.610.01 | 16.480.01 | 2 |
| 2020-10-26 | 149.28 | 18.75 | 18.520.03 | 17.790.01 | 17.120.01 | 16.670.00 | 16.490.01 | 2 |
| 2020-10-31 | 153.90 | 23.37 | 18.980.10 | 18.430.06 | 17.380.03 | 16.770.05 | 16.560.05 | 1 |
| 2020-10-31 | 153.91 | 23.38 | 19.030.09 | 18.380.06 | 17.480.03 | 16.700.06 | 1 | |
| 2020-11-03 | 157.28 | 26.75 | 18.960.11 | 18.340.05 | 17.650.04 | 17.180.01 | 16.980.02 | 2 |
| 2020-11-04 | 157.75 | 27.22 | 19.120.06 | 18.400.06 | 17.640.03 | 17.030.05 | 16.760.05 | 1 |
| 2020-11-04 | 157.75 | 27.22 | 19.010.05 | 18.400.04 | 17.620.04 | 17.030.06 | 16.720.06 | 1 |
| 2020-11-04 | 158.23 | 27.70 | 19.190.11 | 18.360.04 | 17.680.03 | 17.140.01 | 16.960.01 | 2 |
| 2020-11-06 | 160.23 | 29.70 | 19.230.09 | 18.470.02 | 17.750.02 | 17.270.01 | 17.100.01 | 2 |
| 2020-11-07 | 161.22 | 30.69 | 18.940.08 | 18.380.03 | 17.620.03 | 17.250.01 | 17.030.02 | 2 |
| 2020-11-08 | 161.87 | 31.34 | 19.080.13 | 18.520.04 | 17.610.02 | 17.190.04 | 17.140.01 | 1 |
| 2020-11-08 | 162.23 | 31.70 | 19.170.05 | 18.500.03 | 17.620.02 | 17.210.04 | 2 | |
| 2020-11-08 | 162.24 | 31.71 | 17.790.02 | 17.320.01 | 2 | |||
| 2020-11-09 | 163.26 | 32.73 | 19.320.04 | 18.550.01 | 17.850.01 | 17.400.01 | 17.210.01 | 2 |
| 2020-11-10 | 163.89 | 33.36 | 19.220.03 | 18.630.04 | 17.790.01 | 17.330.05 | 17.190.06 | 1 |
| 2020-11-10 | 163.89 | 33.36 | 19.270.04 | 18.650.04 | 17.770.02 | 17.090.05 | 1 | |
| 2020-11-13 | 167.26 | 36.73 | 19.400.09 | 17.920.02 | 2 | |||
| 2020-11-14 | 167.75 | 37.22 | 19.350.05 | 18.750.04 | 17.990.04 | 17.370.09 | 1 | |
| 2020-11-14 | 167.76 | 37.23 | 19.340.05 | 18.770.04 | 17.980.05 | 1 | ||
| 2020-11-15 | 169.21 | 38.68 | 19.340.05 | 18.630.02 | 17.970.02 | 17.550.01 | 17.400.01 | 2 |
| 2020-11-18 | 171.76 | 41.23 | 19.220.12 | 17.830.08 | 1 | |||
| 2020-11-18 | 171.77 | 41.24 | 19.240.08 | 17.890.08 | 1 | |||
| 2020-11-22 | 175.84 | 45.31 | 18.700.06 | 17.610.05 | 1 | |||
| 2020-11-22 | 175.84 | 45.31 | 18.710.06 | 17.710.09 | 1 | |||
| 2020-11-26 | 179.81 | 49.28 | 19.440.07 | 18.740.08 | 17.950.05 | 17.930.13 | 17.720.06 | 1 |
| 2020-11-26 | 179.82 | 49.29 | 17.870.05 | 17.890.06 | 1 | |||
| 2020-11-27 | 181.08 | 50.55 | 19.440.26 | 18.620.08 | 18.270.07 | 17.880.03 | 17.730.03 | 2 |
| 2020-11-28 | 182.05 | 51.52 | 19.320.17 | 18.230.06 | 17.910.03 | 17.750.03 | 2 | |
| 2020-11-29 | 183.02 | 52.49 | 19.540.21 | 18.720.09 | 18.190.06 | 17.920.04 | 17.800.03 | 2 |
| 2020-11-30 | 184.14 | 53.61 | 19.460.17 | 18.820.07 | 18.180.07 | 17.950.03 | 17.780.03 | 2 |
| 2020-12-02 | 185.71 | 55.18 | 19.530.09 | 18.990.06 | 18.220.05 | 17.960.06 | 17.820.08 | 1 |
| 2020-12-02 | 185.72 | 55.19 | 19.520.09 | 18.910.06 | 18.290.04 | 17.910.06 | 17.890.09 | 1 |
| 2020-12-02 | 186.07 | 55.54 | 19.920.30 | 18.890.11 | 18.100.07 | 17.930.04 | 17.870.04 | 2 |
| 2020-12-03 | 187.09 | 56.56 | 19.480.14 | 18.820.05 | 18.320.04 | 18.030.02 | 17.920.02 | 2 |
| 2020-12-04 | 188.09 | 57.56 | 19.570.09 | 18.860.04 | 18.280.02 | 17.980.01 | 17.890.02 | 2 |
| 2020-12-08 | 191.71 | 61.18 | 19.490.15 | 1 | ||||
| 2020-12-09 | 193.02 | 62.49 | 19.550.05 | 18.900.02 | 18.380.02 | 18.120.01 | 18.020.01 | 2 |
| 2020-12-10 | 194.05 | 63.52 | 19.640.05 | 18.940.02 | 18.450.02 | 18.180.01 | 18.040.01 | 2 |
| 2020-12-11 | 195.05 | 64.52 | 19.730.07 | 18.950.02 | 18.450.02 | 18.170.01 | 18.070.02 | 2 |
| 2020-12-12 | 195.70 | 65.17 | 19.710.04 | 18.420.10 | 1 | |||
| 2020-12-12 | 195.71 | 65.18 | 19.690.03 | 18.440.10 | 1 | |||
| 2020-12-16 | 200.11 | 69.58 | 19.680.04 | 18.990.02 | 18.530.02 | 18.290.01 | 18.200.01 | 2 |
| 2020-12-17 | 201.09 | 70.56 | 19.530.06 | 18.980.03 | 18.510.02 | 18.260.02 | 18.170.02 | 2 |
| 2020-12-18 | 201.76 | 71.23 | 19.610.04 | 18.870.06 | 18.440.02 | 18.240.08 | 18.100.06 | 1 |
| 2020-12-18 | 201.78 | 71.25 | 19.610.04 | 18.910.05 | 18.470.02 | 18.150.08 | 1 | |
| 2020-12-25 | 208.71 | 78.18 | 19.790.07 | 18.970.10 | 18.350.05 | 1 | ||
| 2020-12-25 | 208.71 | 78.18 | 19.840.07 | 18.970.11 | 18.320.05 | 1 | ||
| 2021-01-02 | 216.72 | 86.19 | 19.960.08 | 19.240.11 | 18.850.04 | 18.610.09 | 1 | |
| 2021-01-02 | 216.72 | 86.19 | 19.930.08 | 19.270.11 | 18.840.05 | 1 | ||
| 2021-01-08 | 222.70 | 92.17 | 19.900.06 | 18.640.04 | 1 | |||
| 2021-01-08 | 222.71 | 92.18 | 19.990.06 | 18.690.04 | 1 | |||
| 2021-01-12 | 227.03 | 96.50 | 19.250.14 | 18.890.19 | 18.730.08 | 18.530.07 | 2 | |
| 2021-01-14 | 228.71 | 98.18 | 18.830.05 | 2 | ||||
| 2021-01-14 | 228.71 | 98.18 | 18.850.05 | 2 | ||||
| 2021-01-15 | 230.07 | 99.54 | 18.700.06 | 18.500.05 | 18.480.04 | 2 | ||
| 2021-01-16 | 231.10 | 100.57 | 19.920.08 | 19.210.05 | 19.000.05 | 18.950.03 | 18.720.03 | 2 |
| 2021-01-17 | 232.06 | 101.53 | 20.050.09 | 19.370.05 | 19.040.04 | 18.950.03 | 18.800.03 | 2 |
| 2021-01-26 | 240.61 | 110.08 | 19.930.15 | 18.950.07 | 18.890.10 | 1 | ||
| 2021-01-26 | 240.63 | 110.10 | 19.040.12 | 18.890.13 | 1 | |||
| 2021-01-30 | 245.04 | 114.51 | 19.220.24 | 18.620.31 | 19.030.15 | 18.930.14 | 2 | |
| 2021-02-01 | 246.62 | 116.09 | 20.000.21 | 19.670.21 | 19.180.11 | 1 | ||
| 2021-02-01 | 246.64 | 116.11 | 19.670.25 | 19.170.11 | 1 | |||
| 2021-02-04 | 250.04 | 119.51 | 19.670.31 | 19.170.31 | 18.930.22 | 18.910.18 | 18.900.13 | 2 |
| 2021-02-07 | 252.62 | 122.09 | 20.400.31 | 19.900.29 | 19.280.24 | 1 | ||
| † JD 2,459,000+ , ‡ Phase has been calculated with respect to max = 2459130.53, ⋆ 1: LCO, 2: TNT | ||||||||
The spectroscopic observations of SN 2020udy spanning up to 121 days after the maximum, were obtained with the LCO 2-m Faulkes Telescope North (FTN) in Hawaii, Beijing Faint Object Spectrograph and Camera (BFOSC), mounted on the Xinglong 2.16 m telescope of NAOC (XLT; Fan et al. 2016), and Dual Imaging Spectrograph (DIS) on the 3.5 m telescope (Astrophysical Research Consortium, ARC) at the Apache Point Observatory. The 1D wavelength and flux-calibrated LCO spectra were extracted using the floydsspec pipeline444https://github.com/svalenti/FLOYDSpipeline (Valenti et al., 2014). The wavelength calibration of the BFOSC data and DIS data was done using Fe/Ar and He/Ar arc lamp spectra, respectively. The flux calibration was performed using standard star spectra which had similar airmass as that of the SN. All the spectra were scaled with the photometry to correct for slit loss. Finally, the spectra were corrected for the heliocentric redshift of the host galaxy. The log of spectroscopic observations is given in Table 2.
| Date | JD† | Phase‡ | Spectral Range | Telescope/Instrument |
|---|---|---|---|---|
| (Days) | (Å) | |||
| 2020-10-01 | 123.87 | -6.6 | 3300-11000 | FTN/FLOYDS |
| 2020-10-02 | 125.20 | -5.3 | 3500-10000 | Xinglong/BFOSC |
| 2020-10-04 | 127.19 | -3.3 | 3500-10000 | Xinglong/BFOSC |
| 2020-10-07 | 129.82 | -0.7 | 3300-11000 | FTN/FLOYDS |
| 2020-10-09 | 132.21 | 1.68 | 3500-10000 | Xinglong/BFOSC |
| 2020-10-15 | 137.81 | 7.27 | 3300-11000 | FTN/FLOYDS |
| 2020-10-19 | 142.15 | 11.6 | 3500-10000 | Xinglong/BFOSC |
| 2020-10-21 | 143.88 | 13.4 | 3300-11000 | FTN/FLOYDS |
| 2020-10-23 | 144.94 | 14.4 | 3500-9000 | ARC/DIS |
| 2020-10-26 | 148.81 | 18.3 | 3300-11000 | FTN/FLOYDS |
| 2020-10-26 | 149.17 | 18.6 | 3500-10000 | Xinglong/BFOSC |
| 2020-10-27 | 150.29 | 19.7 | 3500-10000 | Xinglong/BFOSC |
| 2020-11-04 | 157.87 | 27.3 | 3300-11000 | FTN/FLOYDS |
| 2020-11-13 | 166.76 | 36.2 | 3300-11000 | FTN/FLOYDS |
| 2020-11-14 | 168.20 | 37.7 | 3500-10000 | Xinglong/BFOSC |
| 2020-11-26 | 179.91 | 49.4 | 3300-11000 | FTN/FLOYDS |
| 2020-12-03 | 186.89 | 56.4 | 3300-11000 | FTN/FLOYDS |
| 2020-12-23 | 206.86 | 76.3 | 3300-11000 | FTN/FLOYDS |
| 2021-01-05 | 219.81 | 89.3 | 3300-11000 | FTN/FLOYDS |
| 2021-02-06 | 251.72 | 121.2 | 3300-11000 | FTN/FLOYDS |
†JD 2,459,000+ ‡ Phase has been calculated with respect to max = 2459130.53
3 Distance, extinction and explosion epoch
3.1 Distance and extinction
There are eight different distance estimates available for the host galaxy of SN 2020udy using Tully-Fisher method (Karachentsev et al., 2006; Theureau et al., 2007; Tully et al., 2013; Sorce et al., 2014; Tully et al., 2016). Out of these, we have used four recent measurements and scaled them to H0 = 73.00 km s-1 Mpc-1 (Spergel et al., 2007). The average of these four estimates, 56.2012.48 Mpc (consistent with Maguire et al. 2023) is used in this work.
The SN is located at the outskirts of the host galaxy, so significant reddening from the host galaxy is not expected. Also, in the spectral sequence of SN 2020udy, we do not find the NaID feature associated with the host galaxy. Hence, for reddening correction, we have used only the extinction within the Milky Way, which is = 0.067 mag (Av = 0.210 mag) (Schlafly & Finkbeiner, 2011).
3.2 Explosion epoch
The first ZTF band detection at JD 2459116.8 with the last non-detection in band at 0.87 days ago, together with the comprehensive sampling of SN 2020udy in ZTF -bandpasses during a few weeks before its explosion allows a careful inspection of its time of the explosion. Assuming SN 2020udy exploded as an expanding fireball whose luminosity scales with its surface area, the flux () thus increases with the square of the time after the explosion (i.e., , Arnett, 1982; Riess et al., 1999; Nugent et al., 2011). Hence, we use Equation 1 to fit the extinction-corrected flux in ZTF and bands, separately.
| (1) |
where A is a scale factor and the power-law index has been fixed to 2 in the initial fitting, which gives JD 2459111.90.6 and JD 2459113.30.4. Such a 1.4 day discrepancy contradicts the band last non detection at 2459115.9 JD (see Figure 1).
Deviation from the expanding fireball during the early-rising phase of type Iax SNe has been reported for multiple cases (Magee et al., 2016; Miller et al., 2020). In the next iteration of fitting, we thus kept as a free parameter. This resulted in estimates of explosion epochs which were off by 0.5 day between both the bands with g=0.91 0.05 and r=1.090.04.
Further, we fit both the light curves iteratively by varying simultaneously for both the bands in such a way that for the same value of , they converge to the same explosion epoch, which is a free parameter as before.
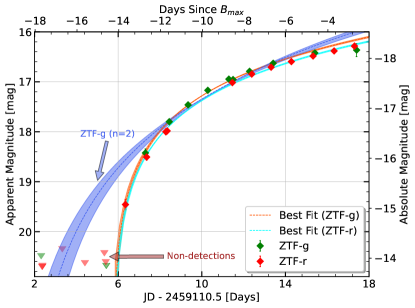
We found that both the light curves converge to the same explosion epoch () for = 1.03. Maguire et al. (2023) quote a similar value for explosion epoch (JD 2459115.7), however, they estimated the power index 1.3 using a modified functional form. In this work, we use JD as the explosion date.
4 Light curve properties
4.1 Light curve and color curve
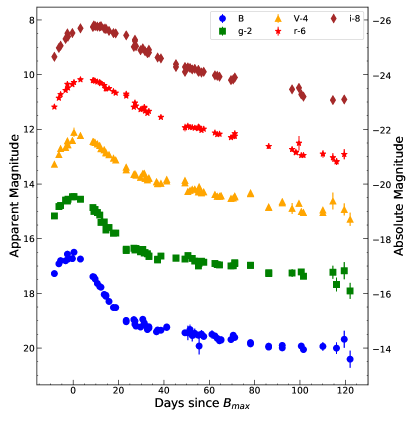
Figure 2 presents the BgVri band photometry of SN 2020udy. The light curves are well sampled around the SN peak brightness in all bandpasses. We use cubic spline fit to estimate the time and magnitude at maximum light in BgVri bands, the decline in magnitude from the light curve peak to 15 days after (i.e., ) is also estimated for these bands (Table 3).
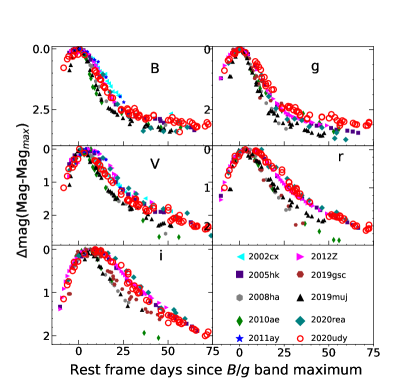
In Figure 3 we compare the light curves of SN 2020udy with several other well-sampled type Iax SNe, including SNe 2002cx (Li et al., 2003), 2005hk (Sahu et al., 2008), 2008ha (Foley et al., 2009), 2010ae (Stritzinger et al., 2014), 2011ay (Stritzinger et al., 2015), 2012Z (Stritzinger et al., 2015), 2019gsc (Srivastav et al., 2020; Tomasella et al., 2020), 2019muj (Barna et al., 2021a), and 2020rea (Singh et al., 2022). The light curves are normalized to their peak magnitudes in the respective bands and plotted in the rest frame of individual SN. In B band, SN 2020udy declines slower than SNe 2002cx and 2011ay and its light curve shape looks remarkably similar to that of SNe 2012Z and 2020rea. In g band, SN 2020udy declines slower than all the comparison SNe. The V band light curve evolution of SN 2020udy is faster than SNe 2002cx, 2005hk, 2011ay, 2012Z, 2020rea and slower compared to the other SNe presented in our sample. With a slower decline in r and i bands, SN 2020udy appears to be very similar to SNe 2012Z and 2020rea (Figure 3).
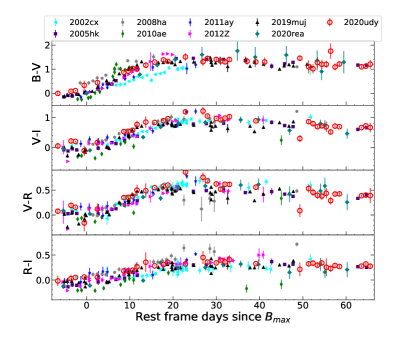
The B-V, V-I, V-R, and R-I color evolution of SN 2020udy and its comparison with other type Iax SNe have been depicted in Figure 4. All the colors are corrected for total reddening and brought to the rest frame of each SN. The color evolution of SN 2020udy seems to follow the same pattern as other type Iax SNe used for comparison.
| SN 2020udy | B band | g band | V band | r band | i band |
|---|---|---|---|---|---|
| JD of maximum light (2459000+) | 130.531.0 | 130.541.0 | 130.541.0 | 133.741.0 | 139.931.0 |
| Magnitude at maximum (mag) | 16.720.02 | 16.460.01 | 16.400.01 | 16.180.03 | 16.250.01 |
| Absolute magnitude at maximum (mag) | -17.410.34 | -17.560.34 | -17.760.34 | -17.830.34 | -17.820.33 |
| m15( mag) | 1.360.04 | 1.180.04 | 0.450.04 | 0.490.03 | 0.660.04 |
4.2 Analysis of bolometric light curve
The pseudo-bolometric BgVri light curve of SN 2020udy is constructed using SuperBol (Nicholl, 2018), adopting distance and extinction discussed in Section 3.1. In SuperBol, the dereddened magnitudes and associated errors of the SN are converted to fluxes and flux errors. These fluxes are used to construct the spectral energy distribution (SED) at all epochs, which are integrated using trapezoidal rule in the limit of the input passbands to obtain the pseudo-bolometric luminosity. The flux errors and bandwidths are used to calculate the corresponding pseudo-bolometric luminosity error. The integration spans the wavelength range between 3960 and 8120 Å. To estimate the missing flux in UV and NIR region, SuperBol fits blackbody functions to SED at each epoch and applies this correction to the pseudo-bolometric luminosities to construct the total bolometric luminosity. Figure 5 shows the pseudo-bolometric light curve of SN 2020udy along with a few other bright type Iax SNe. The pseudo-bolometric light curves of all the SNe presented in Figure 5 are constructed similarly. We have added another bright type Iax SN 2018cni (Singh et al., 2023) for comparison in Figure 5. Around maximum, SN 2020udy looks slightly fainter than SNe 2005hk and 2018cni but after 10 days their pseudo-bolometric luminosities are comparable. This shows that SN 2020udy is a bright type Iax SN with peak (BgVri) luminosity 2.060.14 1042 erg sec-1.
To estimate the explosion parameters, such as the mass of 56Ni and ejecta mass (Mej), we employed an analytical model proposed by Arnett (1982) and Valenti et al. (2008). This model assumes spherically symmetric and optically thick ejecta, a small initial radius, constant optical opacity, and the presence of 56Ni in the ejected matter. We fitted the pseudo bolometric light curve with the analytical model using scipy.optimize.curve_fit algorithm, setting to 0.1 cm2 g-1 and the photospheric velocity to 8000 km s-1 at maximum. From the fitting, we obtained the following values of the parameters: 56Ni mass = 0.080.01 M⊙ and ejecta mass (Mej) = 1.390.09 M⊙, with the errors obtained from the covariance matrix.
The bolometric rise time obtained through this fit is 15 days. This is consistent with the rise time estimated independently by fitting the early light curves of SN 2020udy (see, Section 3.2).
To obtain the total bolometric luminosity from the pseudo-bolometric luminosity, the contribution from the missing bands needs to be added. For type Iax SNe, a definite contribution of UV and NIR fluxes to the total bolometric luminosity is not known, as for only a handful of objects, both UV and NIR coverage are available in literature (Phillips et al., 2007; Yamanaka et al., 2015; Tomasella et al., 2016; Srivastav et al., 2020; Dutta et al., 2022; Srivastav et al., 2022). Based on the available estimates, if the contribution from UV and NIR bands to the total luminosity at maximum is taken as 35%, the mass of 56Ni increases to 0.11 M⊙.
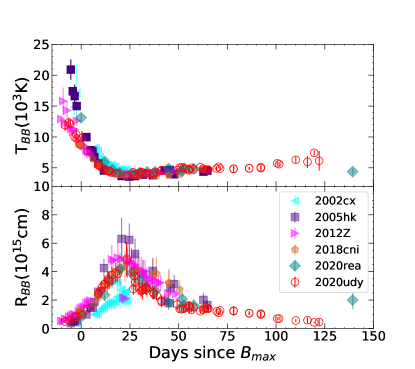
Figure 6 compares the evolution of blackbody temperature and radius of SN 2020udy with that estimated for several other well-studied type Iax SNe. The blackbody temperature evolves in a similar fashion for all the type Iax SNe presented in Figure 6, whereas the blackbody radius is proportional to the luminosity of the SN.
In Figure 7, we compare the pseudo-bolometric luminosity of SN 2020udy with deflagration models presented in Fink et al. (2014). The model light curves N1-def, N3-def, N5-def, and N10-def are adopted from the HESMA database. The numerical value indicates number of the ignition spots of the model, which approximately scales with the strength of the deflagration. During the photospheric phase, the pseudo-bolometric luminosity of SN 2020udy lies between N3-def and N5-def models. Around 30 days post-explosion, SN 2020udy shows a slower decrease in the bolometric luminosity as compared to all the models presented in Figure 7, which may indicate a higher ejecta mass of SN 2020udy compared to the model predictions.
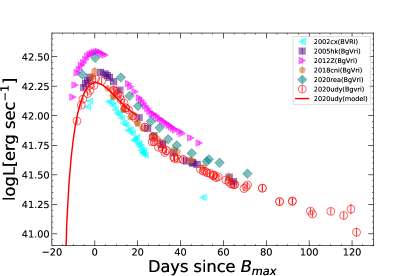
deflagration models presented in Fink et al. (2014).
5 Spectral evolution
5.1 Spectral features of SN 2020udy and their comparison with other type Iax SNe
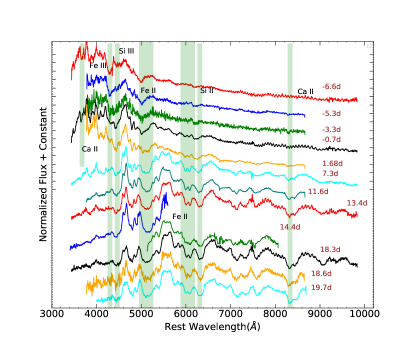
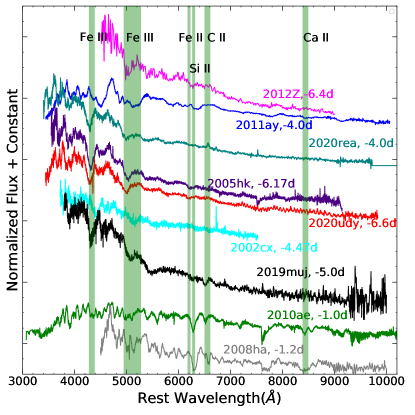
Figures 8 and 9 present the spectroscopic evolution of SN 2020udy spanning from 6.6 to 121.2 days relative to its B-band maximum light. During the pre-maximum phase, the spectra of SN 2020udy show a blue continuum with features due to Ca II H&K, Fe III, Si III, Fe II, and Si II. Prominent P-Cygni profiles with a broad absorption component can also be identified. Similar to other bright type Iax SNe, SN 2020udy also exhibits a rather shallow Si II absorption line at 6355 Å. We do not detect the C II feature at 6580 Å. Figure 10 presents a comparison of the earliest spectrum of SN 2020udy at 6.6 days with several other type Iax SNe observed at similar phases. Fe III features near 4400 and 5000 Å are present in all the SNe. Additionally, we remark that the strength of both Si II and C II features diminishes with the increasing luminosity of type Iax SNe. For example, fainter events like SNe 2008ha and 2010ae display significantly stronger Si II and obvious C II absorption lines compared to bright events such as SNe 2012Z, 2020rea, 2020udy etc. Similarly, in faint type Iax SNe, Ca II NIR feature also emerges earlier than in the bright type Iax SNe.
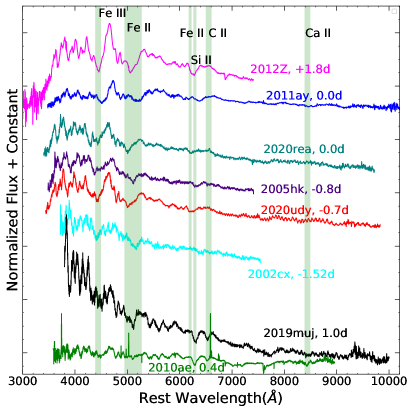
Comparison of spectral features near maximum (Figure 11) indicates similarity between SN 2020udy and other bright type Iax SNe. Near maximum, the strength of Si II 6355 Å line increases. Features due to Fe III near 4400 Å, Fe II near 5000 Å, Si II, and Ca II NIR triplet are prominently seen in all the SNe. In the early post-maximum phase ( 7 days), the blue part of the spectrum gets suppressed because of cooling of the ejecta and line blanketing (Figure 8). With time, the Si II line is replaced by the progressively emerging Fe/Co lines (Figure 9). The features between 5500 to 7000 Å are mostly dominated by Fe II lines.
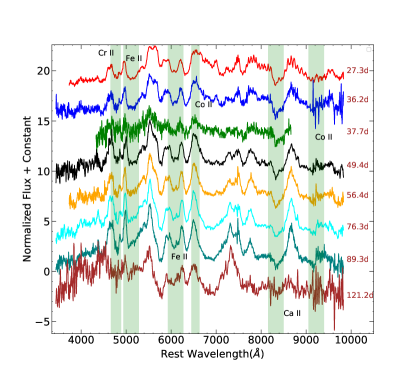
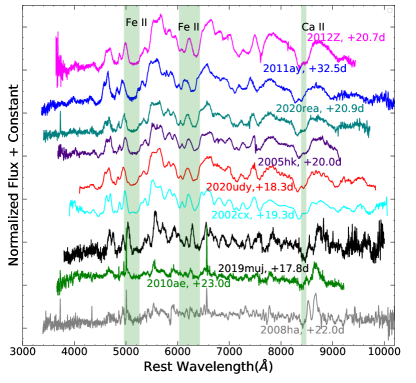
Post maximum (after 20 days since maximum) spectral evolution of SN 2002udy is shown in Figure 9. Cr II feature near 4800 Å and Co II feature near 6500 Å are clearly visible. Ca II NIR triplet becomes progressively stronger. Figure 12 compares the spectrum of SN 2020udy obtained at day 18.3 with the spectra of other type Iax SNe at similar phases. The spectra of all SNe in the sample are dominated by Iron Group Elements (IGEs). SN 2020udy exhibits remarkable similarities to bright type Iax SNe such as SNe 2005hk, 2011ay, and 2020rea. An absorption feature at 9000 Å, due to Co II is also seen in SN 2020udy. As the inner ejecta of the SN becomes optically thin during the late phase, emission lines increase in strength.
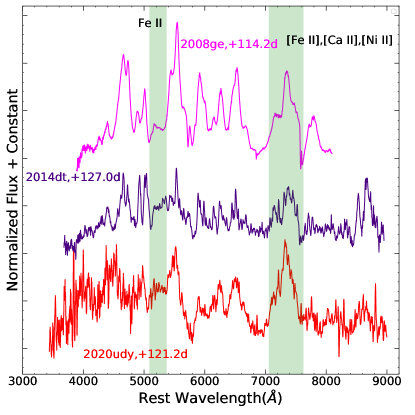
In the late phase, spectral features become narrow (Figure 9). The region around 7300 Å is composed of forbidden lines of Fe/Ni and Ca (Foley et al., 2016). The presence of both forbidden and permitted lines in the late phase spectra of SN 2020udy indicates that the spectrum is not fully nebular. Type Iax SNe posses a long-lived photosphere with the presence of permitted lines even at late times (Jha et al., 2006b; Sahu et al., 2008; Foley et al., 2010a, 2016). Figure 13 shows nebular phase spectral comparison between SNe 2020udy, 2008ge (Foley et al., 2010b), and 2014dt (Singh et al., 2018) at comparable epoch. The nebular phase spectrum of SN 2020udy and SN 2008ge (Foley et al., 2010b) shows broad emission feature, while SN 2014dt has narrow spectral features. Maguire et al. (2023) have also reported broad emission features in the spectrum of SN 2020udy at 119 and 137 days and suggested that it might be coming from the SN ejecta. In the case of SN 2012Z, similar broad emission features were reported at a very late phase ( 190 days, Stritzinger et al. 2015). Foley et al. (2016) suggested that relatively bright type Iax SNe with higher ejecta velocities exhibit broad forbidden lines; SN 2020udy is consistent with these findings.
5.2 Evolution of photospheric velocity
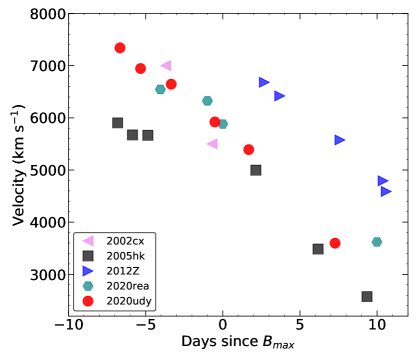
Figure 14 displays the photosphere expansion velocity of SN 2020udy traced by the evolution of the Si II line at 6355 Å and that measured for several other type Iax SNe. We estimate the expansion velocity by fitting a Gaussian profile to the absorption minimum of the Si II line. The expansion velocity of SN 2020udy around maximum light is 6000 km s-1. During and days, the photospheric velocity of SN 2020udy is similar to SN 2020rea, higher than SN 2005hk, and lower than SN 2012Z. The photospheric velocity estimated by the absorption minimum of the Si II line at 6355 Å becomes unreliable after two weeks relative to the band peak brightness due to the increasing blending with the emerging iron lines. Type Iax SNe having higher luminosity are known to have high photospheric velocity (McClelland et al., 2010; Foley et al., 2013) except for a few outliers. We found that SN 2020udy is consistent with such a luminosity-velocity correlation.
5.3 Spectral modelling
5.3.1 Spectral modeling with SYNAPPS
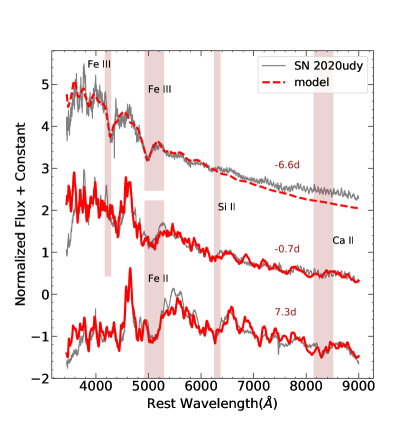
Photospheric spectra of SN 2020udy at three epochs: 6.6, 0.7, and 7.3 days relative to the band peak brightness are modeled using the spectrum synthesis code SYNAPPS (Thomas et al., 2011) and are shown in Figure 15. The photospheric velocity in the best-fit model falls from 11250 km s-1 at 6.6 days to 6570 km s-1 at 7.3 days. The outer ejecta velocity used in the modeling is 30000 km s-1. The photospheric temperature evolves from 12200 K at 6.6 days to 8500 K at 7.3 days. The chemical species used in the modeling are Fe, Si, Ca, Mg, and S. Specifically, in the pre-maximum spectral fitting, we used S II, Si II, Si III, Mg II, Ca II, Fe II and Fe III ions. The prominent Fe II and Fe III features in the pre-maximum spectrum are reproduced very well in the models. In the model spectra at maximum and post maximum, most of the spectral features such as Fe, Si, Ca, etc. match well with our observed spectra.
5.3.2 Spectral modeling with TARDIS
We perform spectral modeling for SN 2020udy using the one-dimensional radiative transfer code TARDIS, following the principles of abundance tomography. The setting of TARDIS and the fitting strategy is almost the same as in our previous study, where SNe 2018cni and 2020kyg were the subjects of analysis (Singh et al., 2023). The method was previously applied for abundance tomography of normal SNe Ia using Artificial Intelligence-Assisted Inversion (AIAI, Chen et al., 2020, 2022) and fit-by-eye method (Barna et al., 2021b) as well, providing similar abundance profiles and the same goodness of fit.
The present spectral synthesis covers a longer range of time, days after the maximum. Camacho-Neves et al. (2023) showed that radiative transfer codes assuming a blackbody-emitting photosphere can reproduce most of the spectral features and their evolution over years after the explosion because type Iax SNe never show a fully nebular spectrum. At the same time, spectral synthesis is less sensitive to the exact mass fractions of chemical elements at days, compared to the earlier epochs. The information is retrievable from late-time spectral fitting limits to luminosity (), photospheric velocity (), and identification of the presence of chemical elements.
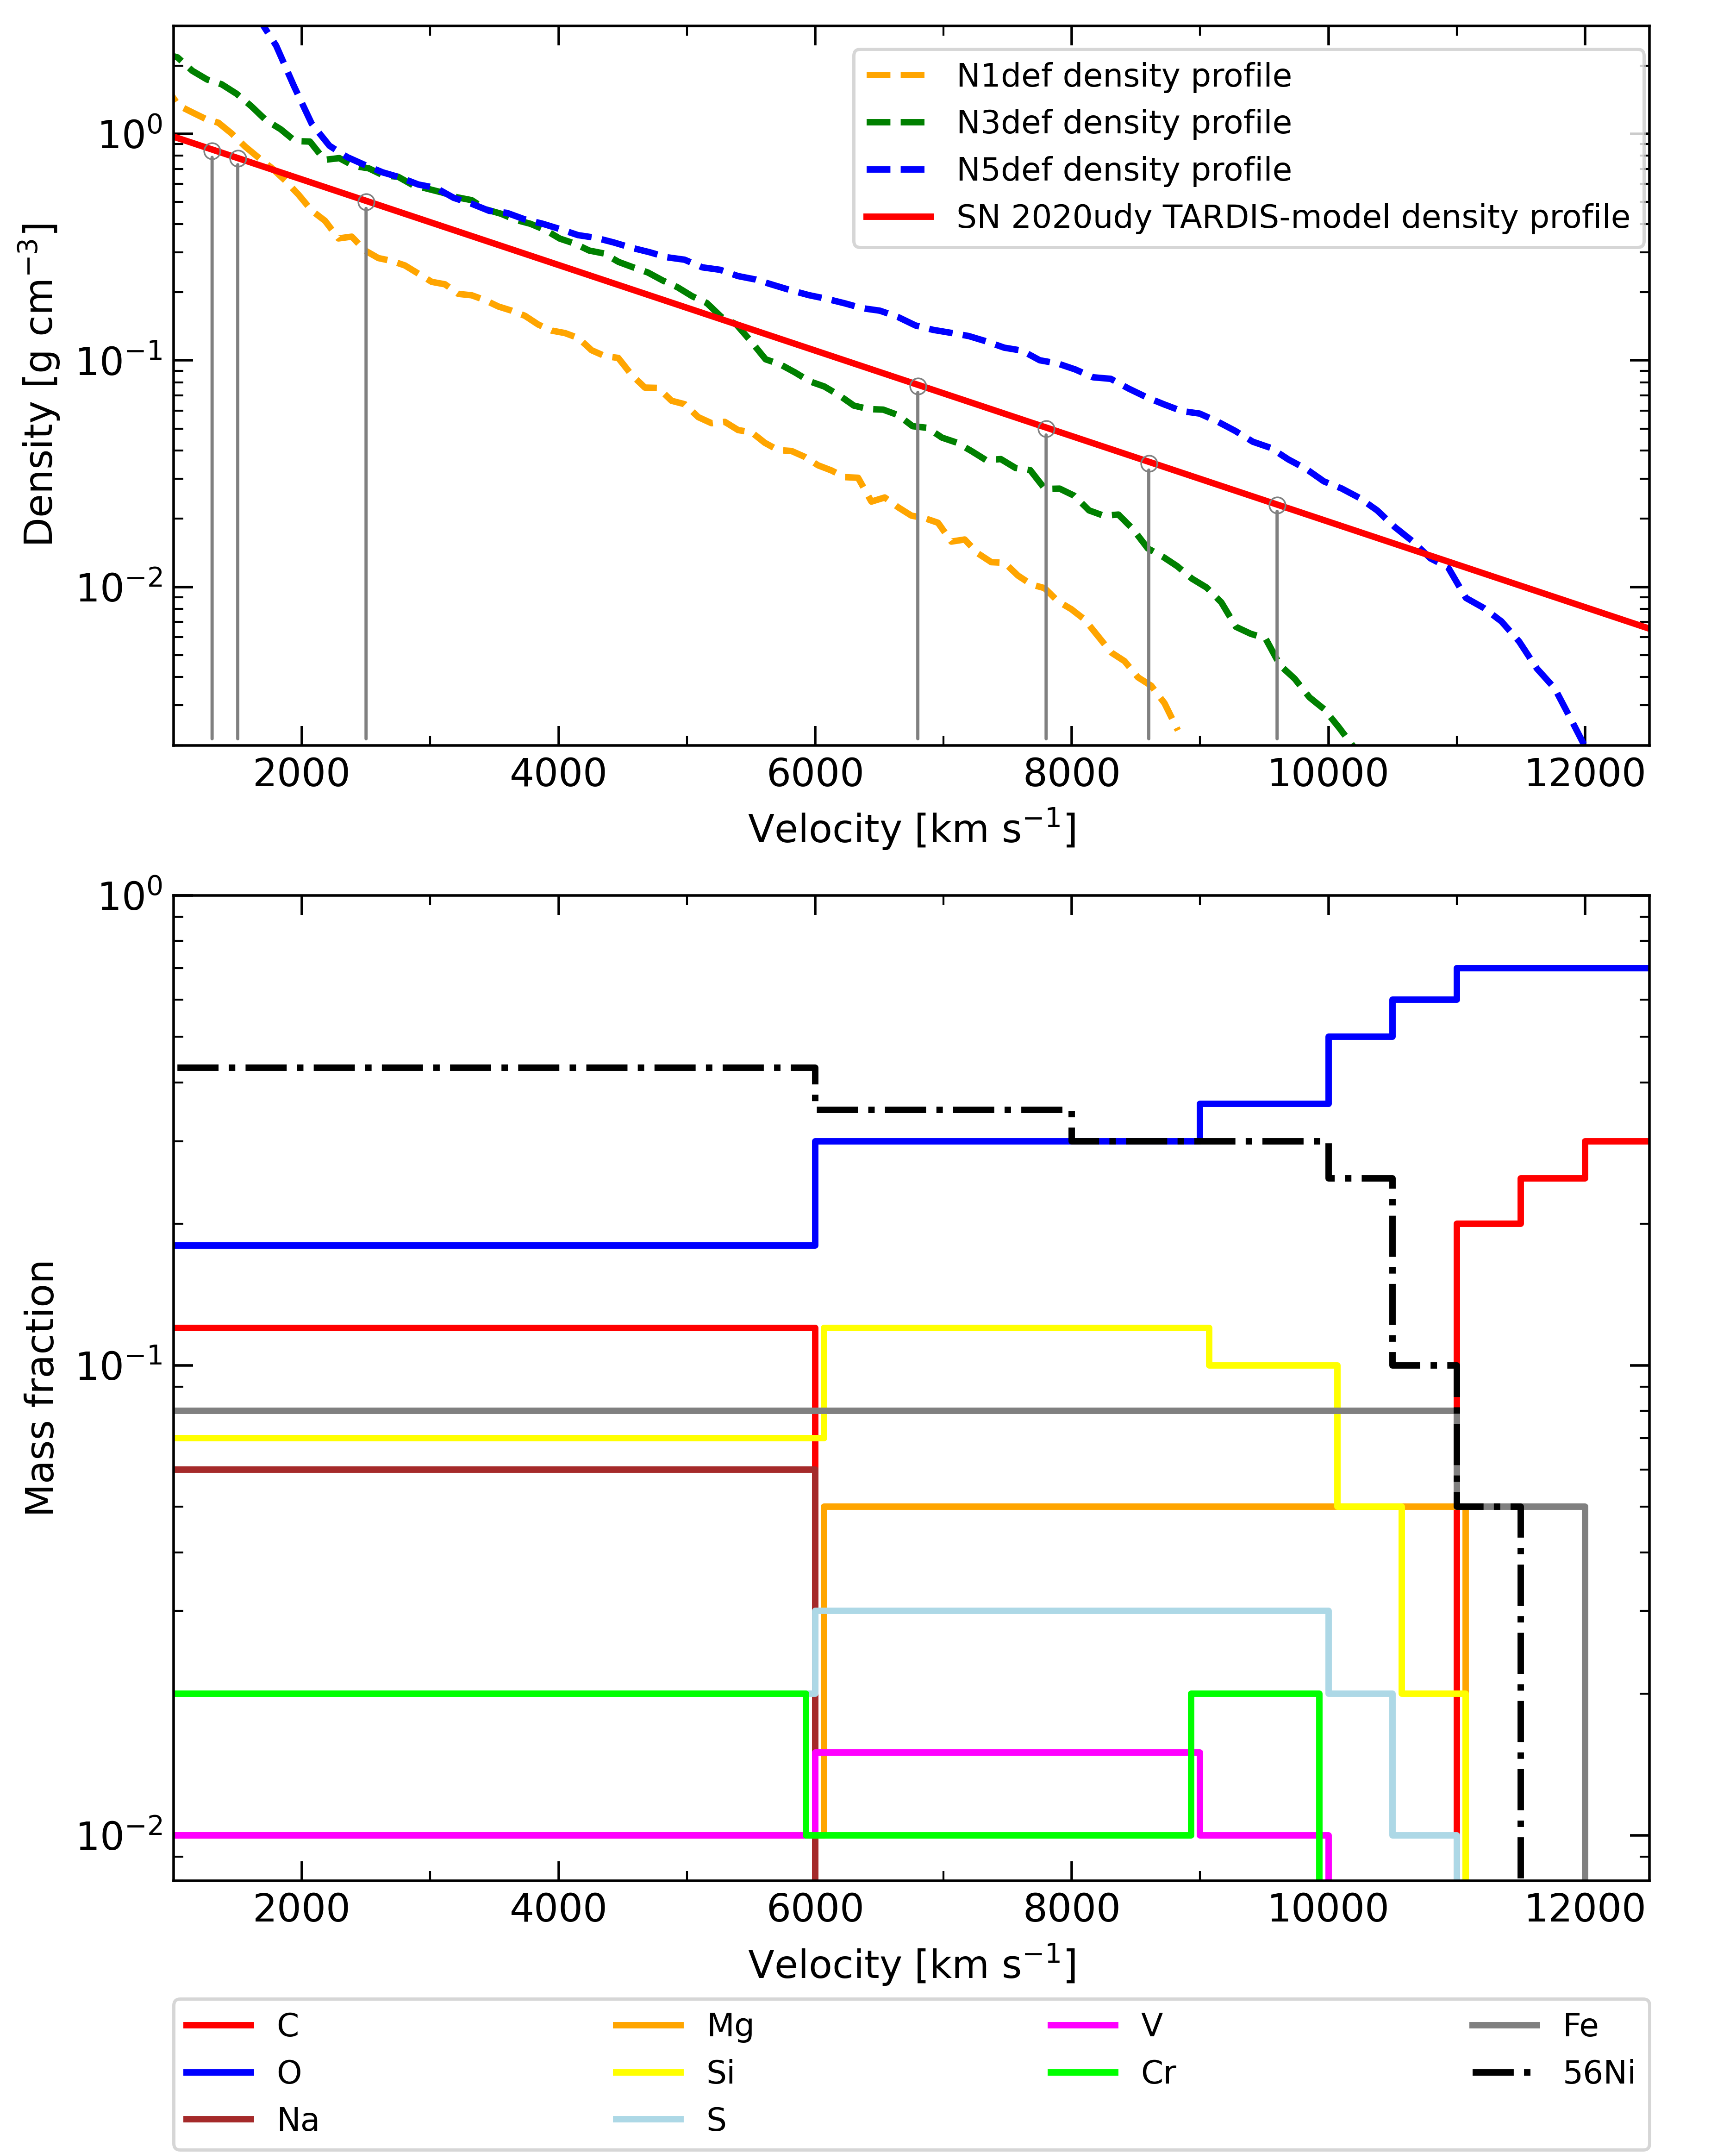
The abundance tomography presented in this study is split into two parts: before days from the date of explosion (hereafter referred to as early epochs), we follow the standard technique for synthesizing a spectral time series (Singh et al., 2023), while for the later epochs, a simplified method is adopted similar to that of Camacho-Neves et al. (2023). For both phases, the same time of the explosion (), which is within the uncertainty range of the time derived from early light curve synthesis (see in Section 3.2), and density profile are used for the fit of any epochs. The latter one is chosen as a simple exponential function and constrained from the fitting as:
| (2) |
where g cm-3 is the core density shortly after the time of the explosion () when the homologous expansion starts (here, chosen as s); while km s-1 is the exponential steepness of the density structure decreasing outwards. The chemical composition of ten elements (see in Figure 16) is fit in radial shells with a velocity width of 500 km s-1. Our initial assumption on each element’s abundance was the constant fit of the abundance structure of the N5-def deflagration model (Fink et al., 2014). During the fitting process, we aimed for simplicity and modified the actual abundance structure of a shell only when the quality of the match between the synthetic and observed spectra is clearly improved with the change. At later epochs ( days), the minor changes in abundance have little or no impact on the outcome of the radiative transfer, thus, we fixed the initially assumed constant values with minor modifications regarding the presence of lines of certain elements (see below). Note that despite several simplifications, the number of fitting parameters is way too high to fully cover the parameter space, thus, our ’best-fit’ model can be considered as a feasible solution at its best.
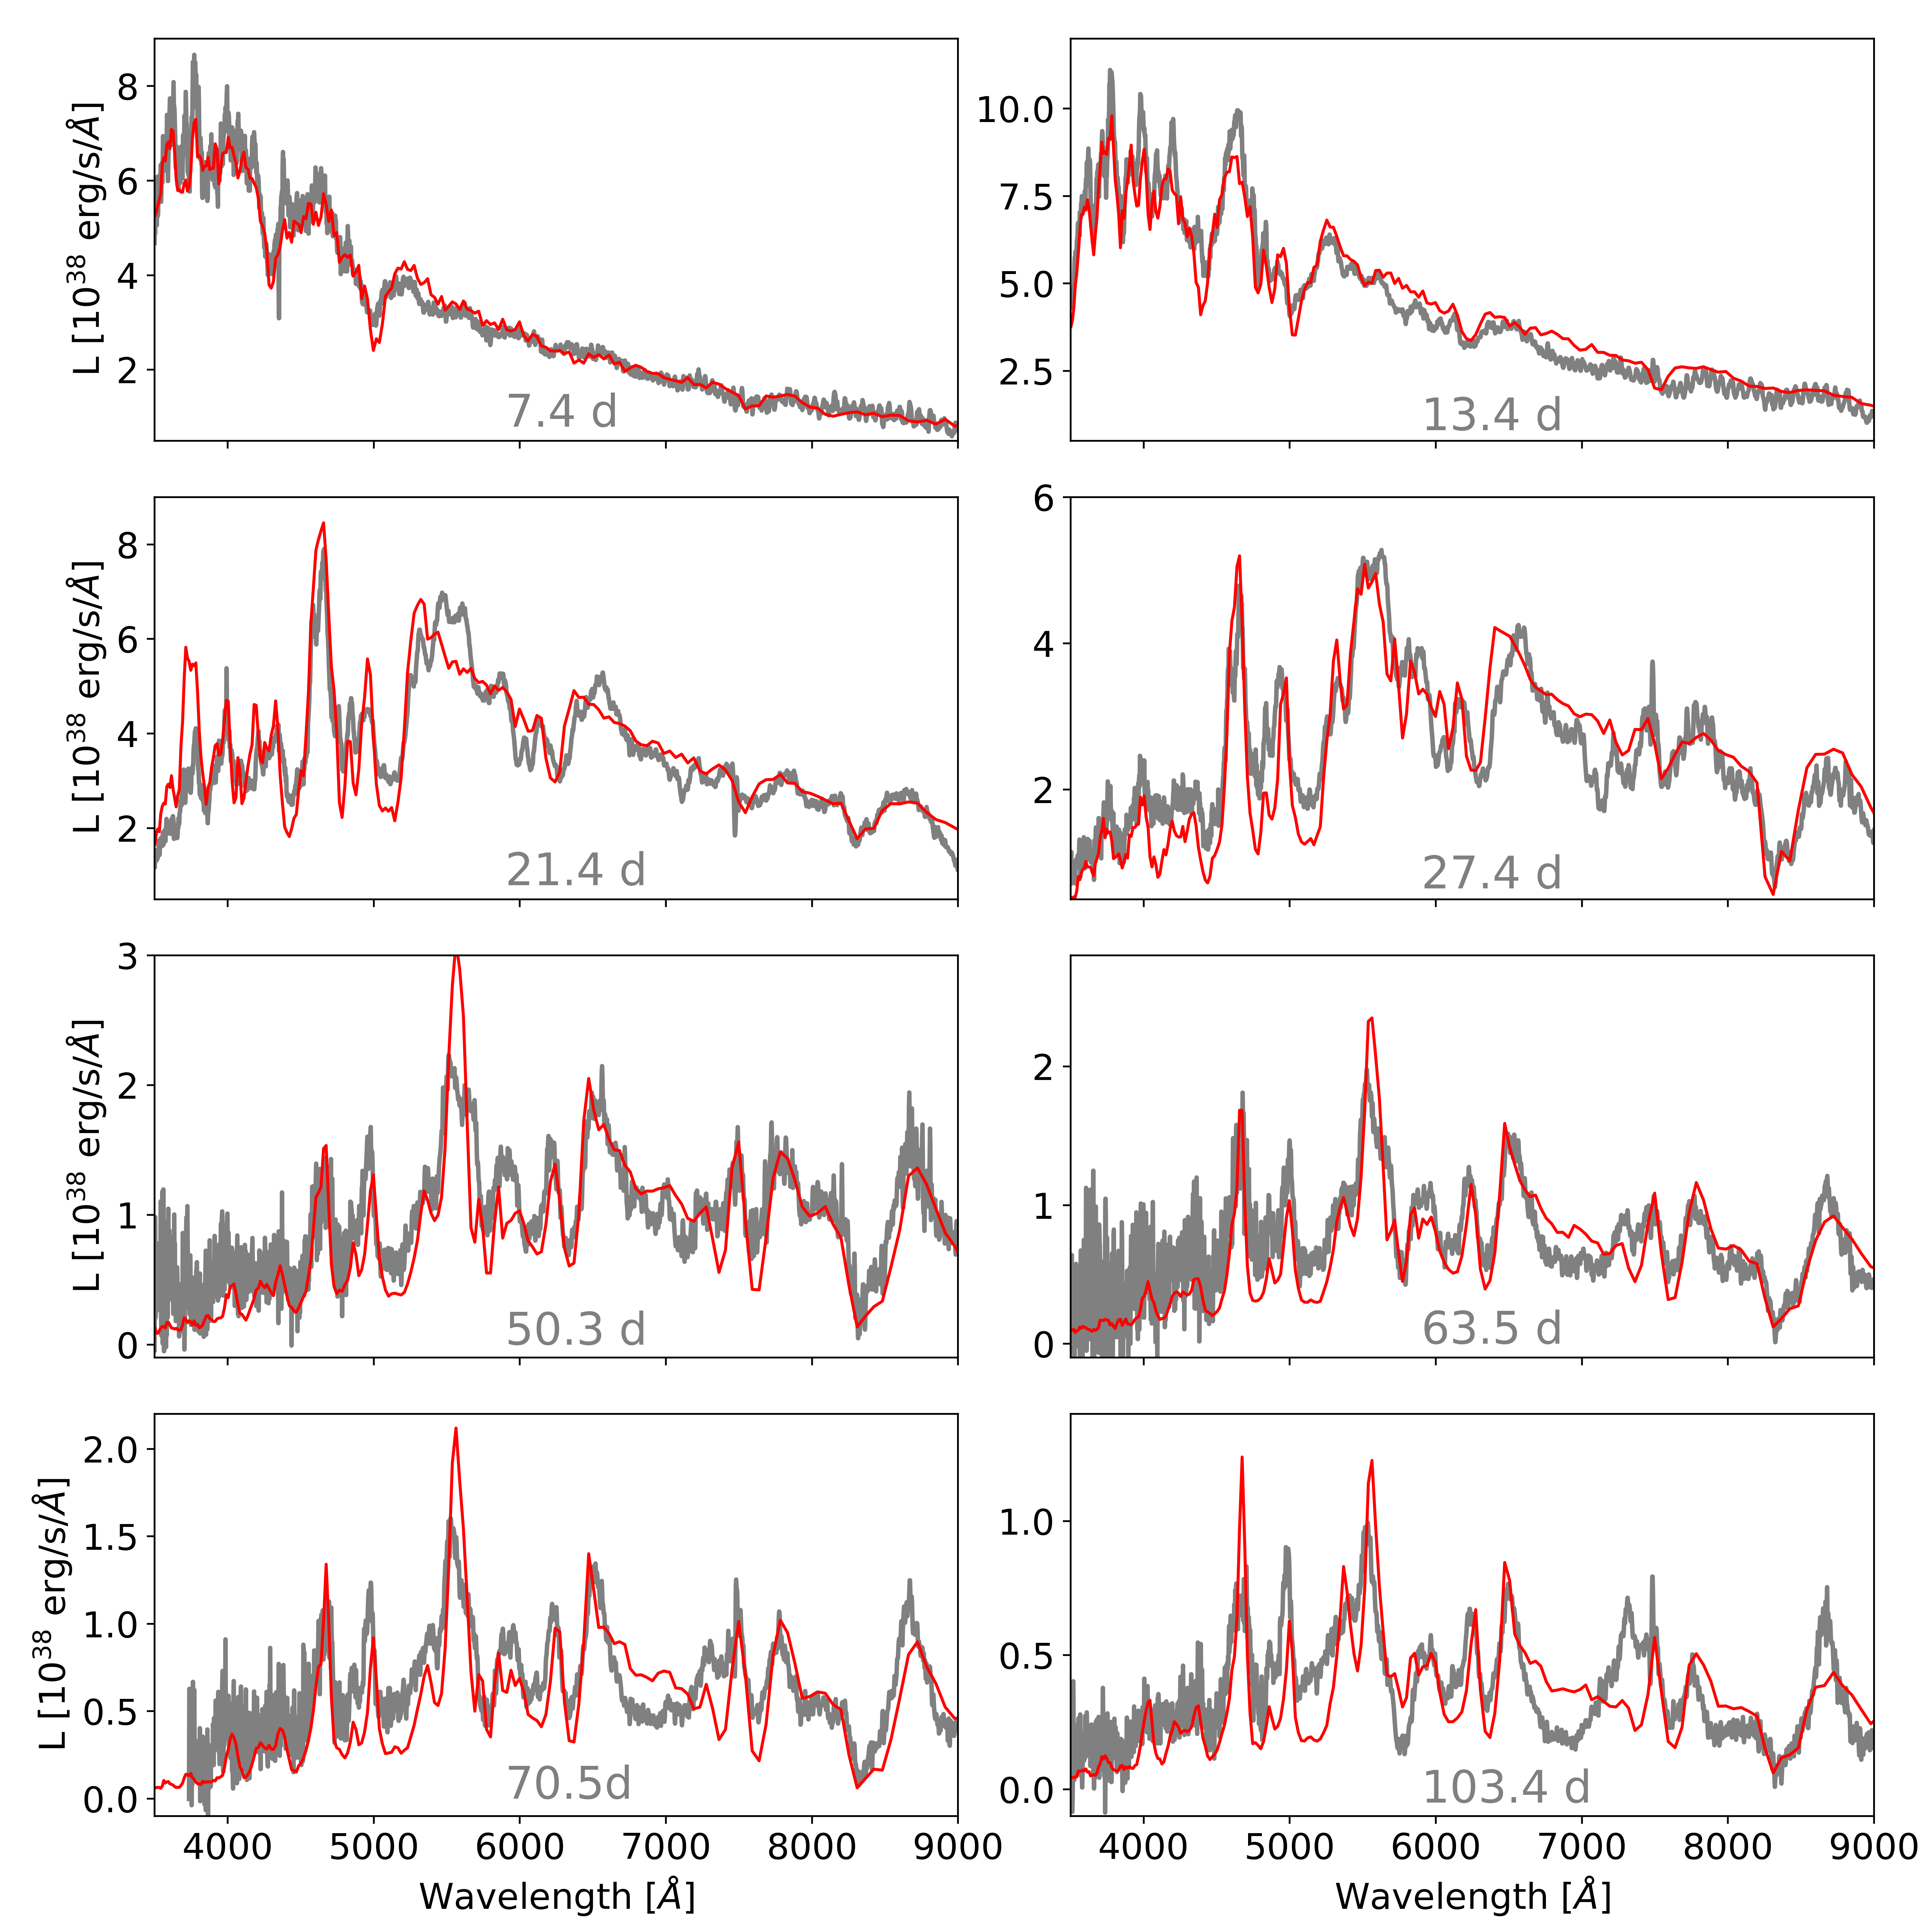
The synthetic spectra are displayed in Figure 17. The dominant spectral features of SN 2020udy are reproduced by our final model at every epoch. The absorption profiles of IMEs such as Si, S, Ca, etc. are nicely fitted at all phases. As an observable weakness of the fits, the P-Cygni features of IGEs after 20 days are overestimated in general (see between 4000 and 5500 Å in Figure 17). However, the fix of this issue involves either reduced Fe and 56Ni abundances or lower to decrease the outer densities; but both options would reduce the goodness of the fits at other epochs.
The best-fit density profile (upper panel of Figure 16) shows the same steepness ( km s-1) as that of other type Iax SNe, which were the subject of similar abundance tomography analysis (Barna et al., 2018, 2021a). The inferred function scales the densities between those of the N3-def and N5-def models during the early epochs, which is consistent with Figure 7. The constrained abundance structure shows a strong stratification of both of the IGE and IME mass fractions that reproduce the fast evolution of spectral lines. As a further contradiction to the pure deflagration models, C is not allowed below 11 000 km s-1 in our model to prevent the appearance of extremely strong C II 4618 and 6578. The possible detection of such stratification in the outermost region of type Iax SNe is not unprecedented in the literature (see e.g. Seitenzahl et al., 2013; Barna et al., 2018), but studies with other methodologies of spectral synthesis argued against chemical layering (Magee et al., 2022). Note that due to the high level of degeneracy of our fitting process, the results regarding the stratification are inconclusive. Optical spectroscopy at even earlier phases ( days) and/or UV spectral observations are required to resolve this issue.
The fits of the late-time epochs (below km s-1) support the existence of a uniform chemical structure in the inner ejecta (Fink et al., 2014). Similar to Camacho-Neves et al. (2023), we set a high Na mass fraction to produce the P - Cygni feature at Å. As a further modification, we increase the abundance of V and Cr to create the features observed around and Å, respectively. While the overabundance of Na is well-justified due to the unambiguous identification, similar to that of the extremely late-time spectral synthesis of SN 2014dt, the presence of Cr and V with the 1-2% mass fraction is not conclusive.
6 Discussion
The relatively complete photometric coverage of pre-maximum evolution of SN 2020udy allows us to constrain its rise time to 15 days in band, which is similar to SN 2005hk (Phillips et al., 2007). Our analysis of the pseudo bolometric light curve of SN 2020udy estimates the 56Ni mass of 0.080.01 M⊙ and the ejecta mass of 1.390.09 M⊙. Comparison of the pseudo bolometric light curves of SN 2020udy with different deflagration models shows that SN 2020udy lies between N3-def and N5-def models during the photospheric phase. Spectroscopic features and photospheric velocity evolution of SN 2020udy are similar to other bright type Iax SNe. The late nebular phase spectral features of SN 2020udy are broad and similar to SN 2012Z. To ascertain the most probable explosion scenario/progenitor system, we compare the observational properties of SN 2020udy with different proposed models for type Iax SNe.
The PDD scenario starts with a slow deflagration which expands the white dwarf. Subsequently, infalling C-O layer triggers detonation (Ivanova et al., 1974; Khokhlov, 1991a, b; Khokhlov et al., 1993; Hoeflich et al., 1995; Hoeflich & Khokhlov, 1996; Bravo & García-Senz, 2006; Baron et al., 2012; Dessart et al., 2014). The mass of 56Ni estimated in SN 2020udy is less than the mass of 56Ni produced in PDD scenario (0.12 to 0.66 M⊙, Hoeflich et al. 1995). The observed (B-V) color (0.33 mag) of SN 2020udy at maximum is slightly bluer than the (B-V) color (0.44 mag, Hoeflich et al. 1995) expected in PDD54 model.
In DDT models (Khokhlov, 1991a, c; Khokhlov et al., 1993; Hoeflich et al., 1995; Hoeflich & Khokhlov, 1996; Höflich et al., 2002; Seitenzahl et al., 2013; Sim et al., 2013), a deflagration flame is ignited by nuclear burning followed by expansion of the star. A considerable amount of the fuel burns into IMEs at lower ignition densities. Subsequently, a detonation commences which consumes most of the fuel. The mass of synthesized 56Ni in the case of SN 2020udy (0.080.01 M⊙ ) is significantly less than the expected mass of synthesized 56Ni produced in the DDT explosion (0.32 - 1.1 M⊙, Sim et al. 2013). Although the (B-V) color of SN 2020udy (0.33 mag) at maximum falls in the range of the DDT models (0.15 - 0.56 mag), other parameters such as the band absolute magnitude of SN 2020udy (MB,max = 17.410.34 mag) is not consistent with the DDT model prediction ( to 18.16 mag).
The three-dimensional pure deflagration of a white dwarf yields a range of synthesized 56Ni mass of 0.03–0.38 M⊙ (Fink et al., 2014). The rise time and peak absolute magnitudes provided by these models fall in the range of 7.6 to 14.4 days and 16.84 to 18.96 mag, respectively. Most of the observed parameters of SN 2020udy fit well within the range of parameters predicted by such a 3D pure deflagration process. Type Iax SNe are considered as a heterogeneous class, the progenitor and explosion scenario at the two extreme ends of luminosity distribution are shown to be different. However, bright members of this class (excluding outliers) behave in a similar manner and most of the observed properties of other bright type Iax SNe such as SNe 2020rea (Singh et al., 2022), 2020sck (Dutta et al., 2022), etc., are consistent with the pure deflagration of a white dwarf in 3D (Fink et al., 2014). Based on the comparison of bolometric light curves and the density structure constrained from the abundance tomography analysis, SN 2020udy resembles a transition between the N3-def and N5-def pure deflagration models (Fink et al., 2014).
7 Summary
The extensive photometric and spectroscopic follow-up of SN 2020udy reveals the following features:
-
•
SN 2020udy is a bright member of the type Iax class with MB,max = 17.410.34 mag.
-
•
The analytical modelling of the pseudo-bolometric light curve yields 0.080.01 M⊙ of synthesized 56Ni with a well constrained rise time of 15 days.
-
•
Spectroscopic features of SN 2020udy show similarity with the other bright members of the type Iax class.
-
•
Abundance tomography modeling of SN 2020udy shows photospheric velocity of 8000 km s-1 at maximum. This fits into the general trend of the Iax class, as brighter objects expand with higher velocity.
-
•
Comparison of proposed explosion models with the observational parameters shows that SN 2020udy is consistent with explosion models of pure deflagration of a white dwarf.
-
•
While the earliest spectra, which sample the outermost layers of the ejecta, show some indications of chemical stratification, the post-maximum evolution of SN 2020udy is consistent with the predictions of the pure deflagration scenario.
-
•
Thus, SN 2020udy is an addition to the bright type Iax SNe population. The observed similarities of SN 2020udy with other bright Iax SNe indicate homogeneity within bright members of this class.
8 acknowledgments
We thank the anonymous referee for providing useful comments and suggestions towards improvement of the manuscript. We acknowledge Wiezmann Interactive Supernova data REPository http://wiserep.weizmann.ac.il (WISeREP) (Yaron & Gal-Yam, 2012). This research has made use of the CfA Supernova Archive, which is funded in part by the National Science Foundation through grant AST 0907903. This research has made use of the NASA/IPAC Extragalactic Database (NED) which is operated by the Jet Propulsion Laboratory, California Institute of Technology, under contract with the National Aeronautics and Space Administration. RD acknowledges funds by ANID grant FONDECYT Postdoctorado Nº 3220449. The work of XW is supported by the National Natural Science Foundation of China (NSFC grants 12288102, 12033003, and 11633002), the Science Program (BS202002) and the Innovation Project (23CB061) of Beijing Academy of Science and Technology, and the Tencent Xplorer Prize. This work makes use of data obtained with the LCO Network. This research made use of TARDIS, a community-developed software package for spectral synthesis in supernovae (Kerzendorf et al., 2018, 2019). The development of TARDIS received support from the Google Summer of Code initiative and from ESA’s Summer of Code in Space program. TARDIS makes extensive use of Astropy and PyNE. This work made use of the Heidelberg Supernova Model Archive (HESMA)555https://hesma.h-its.org. DAH, GH, and CM were supported by NSF Grants AST-1313484 and AST-1911225. We acknowledge the usage of the HyperLeda database (http://leda.univ-lyon1.fr). The SDSS is managed by the Astrophysical Research Consortium for the Participating Institutions. The Participating Institutions are the American Museum of Natural History, Astrophysical Institute Potsdam, University of Basel, University of Cambridge, Case Western Reserve University, University of Chicago, Drexel University, Fermilab, the Institute for Advanced Study, the Japan Participation Group, Johns Hopkins University, the Joint Institute for Nuclear Astrophysics, the Kavli Institute for Particle Astrophysics and Cosmology, the Korean Scientist Group, the Chinese Academy of Sciences (LAMOST), Los Alamos National Laboratory, the Max-Planck-Institute for Astronomy (MPIA), the Max-Planck-Institute for Astrophysics (MPA), New Mexico State University, Ohio State University, University of Pittsburgh, University of Portsmouth, Princeton University, the United States Naval Observatory, and the University of Washington.
References
- Arnett (1982) Arnett, W. D. 1982, ApJ, 253, 785, doi: 10.1086/159681
- Barna et al. (2018) Barna, B., Szalai, T., Kerzendorf, W. E., et al. 2018, Monthly Notices of the Royal Astronomical Society, 480, 3609, doi: 10.1093/mnras/sty2065
- Barna et al. (2021a) Barna, B., Szalai, T., Jha, S. W., et al. 2021a, MNRAS, 501, 1078, doi: 10.1093/mnras/staa3543
- Barna et al. (2021b) Barna, B., Pereira, T., Taubenberger, S., et al. 2021b, MNRAS, 506, 415, doi: 10.1093/mnras/stab1736
- Baron et al. (2012) Baron, E., Höflich, P., Krisciunas, K., et al. 2012, The Astrophysical Journal, 753, 105, doi: 10.1088/0004-637x/753/2/105
- Bellm et al. (2019) Bellm, E. C., Kulkarni, S. R., Barlow, T., et al. 2019, PASP, 131, 068003, doi: 10.1088/1538-3873/ab0c2a
- Bertin (2006) Bertin, E. 2006, in Astronomical Society of the Pacific Conference Series, Vol. 351, Astronomical Data Analysis Software and Systems XV, ed. C. Gabriel, C. Arviset, D. Ponz, & S. Enrique, 112
- Bravo & García-Senz (2006) Bravo, E., & García-Senz, D. 2006, ApJ, 642, L157, doi: 10.1086/504713
- Brown et al. (2013) Brown, T. M., Baliber, N., Bianco, F. B., et al. 2013, PASP, 125, 1031, doi: 10.1086/673168
- Camacho-Neves et al. (2023) Camacho-Neves, Y., Jha, S. W., Barna, B., et al. 2023, ApJ, 951, 67, doi: 10.3847/1538-4357/acd558
- Chen et al. (2020) Chen, X., Hu, L., & Wang, L. 2020, ApJS, 250, 12, doi: 10.3847/1538-4365/ab9a3b
- Chen et al. (2022) Chen, X., Wang, L., Hu, L., & Brown, P. J. 2022, arXiv e-prints, arXiv:2210.15892, doi: 10.48550/arXiv.2210.15892
- Dessart et al. (2014) Dessart, L., Blondin, S., Hillier, D. J., & Khokhlov, A. 2014, MNRAS, 441, 532, doi: 10.1093/mnras/stu598
- Dutta et al. (2022) Dutta, A., Sahu, D. K., Anupama, G. C., et al. 2022, ApJ, 925, 217, doi: 10.3847/1538-4357/ac366f
- Falco et al. (1999) Falco, E. E., Kurtz, M. J., Geller, M. J., et al. 1999, PASP, 111, 438, doi: 10.1086/316343
- Fan et al. (2016) Fan, Z., Wang, H., Jiang, X., et al. 2016, Publications of the Astronomical Society of the Pacific, 128, 115005, doi: 10.1088/1538-3873/128/969/115005
- Fink et al. (2014) Fink, M., Kromer, M., Seitenzahl, I. R., et al. 2014, MNRAS, 438, 1762, doi: 10.1093/mnras/stt2315
- Foley et al. (2010a) Foley, R. J., Brown, P. J., Rest, A., et al. 2010a, ApJ, 708, L61, doi: 10.1088/2041-8205/708/1/L61
- Foley et al. (2016) Foley, R. J., Jha, S. W., Pan, Y.-C., et al. 2016, MNRAS, 461, 433, doi: 10.1093/mnras/stw1320
- Foley et al. (2015) Foley, R. J., Van Dyk, S. D., Jha, S. W., et al. 2015, ApJ, 798, L37, doi: 10.1088/2041-8205/798/2/L37
- Foley et al. (2009) Foley, R. J., Chornock, R., Filippenko, A. V., et al. 2009, AJ, 138, 376, doi: 10.1088/0004-6256/138/2/376
- Foley et al. (2010b) Foley, R. J., Rest, A., Stritzinger, M., et al. 2010b, AJ, 140, 1321, doi: 10.1088/0004-6256/140/5/1321
- Foley et al. (2013) Foley, R. J., Challis, P. J., Chornock, R., et al. 2013, ApJ, 767, 57, doi: 10.1088/0004-637X/767/1/57
- Fremling et al. (2020) Fremling, C., Miller, A. A., Sharma, Y., et al. 2020, The Astrophysical Journal, 895, 32, doi: 10.3847/1538-4357/ab8943
- Greiner et al. (2023) Greiner, J., Maitra, C., Haberl, F., et al. 2023, Nature, 615, 605, doi: 10.1038/s41586-023-05714-4
- Gunn et al. (2006) Gunn, J. E., Siegmund, W. A., Mannery, E. J., et al. 2006, AJ, 131, 2332, doi: 10.1086/500975
- Henden et al. (2016) Henden, A. A., Templeton, M., Terrell, D., et al. 2016, VizieR Online Data Catalog, II/336
- Hoeflich & Khokhlov (1996) Hoeflich, P., & Khokhlov, A. 1996, ApJ, 457, 500, doi: 10.1086/176748
- Hoeflich et al. (1995) Hoeflich, P., Khokhlov, A. M., & Wheeler, J. C. 1995, ApJ, 444, 831, doi: 10.1086/175656
- Höflich et al. (2002) Höflich, P., Gerardy, C. L., Fesen, R. A., & Sakai, S. 2002, ApJ, 568, 791, doi: 10.1086/339063
- Huang et al. (2012) Huang, F., Li, J.-Z., Wang, X.-F., et al. 2012, Research in Astronomy and Astrophysics, 12, 1585, doi: 10.1088/1674-4527/12/11/012
- Ivanova et al. (1974) Ivanova, L. N., Imshennik, V. S., & Chechetkin, V. M. 1974, Ap&SS, 31, 497, doi: 10.1007/BF00644102
- Jacobson-Galán et al. (2019) Jacobson-Galán, W. V., Foley, R. J., Schwab, J., et al. 2019, MNRAS, 487, 2538, doi: 10.1093/mnras/stz1305
- Jha et al. (2006a) Jha, S., Branch, D., Chornock, R., et al. 2006a, AJ, 132, 189, doi: 10.1086/504599
- Jha et al. (2006b) Jha, S., Kirshner, R. P., Challis, P., et al. 2006b, AJ, 131, 527, doi: 10.1086/497989
- Jha (2017) Jha, S. W. 2017, Type Iax Supernovae, ed. A. W. Alsabti & P. Murdin, 375, doi: 10.1007/978-3-319-21846-5_42
- Jordan et al. (2012) Jordan, IV, G. C., Perets, H. B., Fisher, R. T., & van Rossum, D. R. 2012, ApJ, 761, L23, doi: 10.1088/2041-8205/761/2/L23
- Karachentsev et al. (2006) Karachentsev, I. D., Kudrya, Y. N., Karachentseva, V. E., & Mitronova, S. N. 2006, Astrophysics, 49, 450, doi: 10.1007/s10511-006-0044-9
- Karambelkar et al. (2021) Karambelkar, V. R., Kasliwal, M. M., Maguire, K., et al. 2021, The Astrophysical Journal Letters, 921, L6, doi: 10.3847/2041-8213/ac2e90
- Kerzendorf et al. (2018) Kerzendorf, W., Nöbauer, U., Sim, S., et al. 2018, tardis-sn/tardis: TARDIS v2.0.2 release, v2.0.2, Zenodo, doi: 10.5281/zenodo.1292315
- Kerzendorf et al. (2019) —. 2019, tardis-sn/tardis: TARDIS v3.0 alpha2, v3.0-alpha.2, Zenodo, doi: 10.5281/zenodo.2590539
- Khokhlov et al. (1993) Khokhlov, A., Mueller, E., & Hoeflich, P. 1993, A&A, 270, 223
- Khokhlov (1991a) Khokhlov, A. M. 1991a, A&A, 245, L25
- Khokhlov (1991b) —. 1991b, A&A, 246, 383
- Khokhlov (1991c) —. 1991c, A&A, 245, 114
- Kromer et al. (2013) Kromer, M., Fink, M., Stanishev, V., et al. 2013, MNRAS, 429, 2287, doi: 10.1093/mnras/sts498
- Kromer et al. (2015) Kromer, M., Ohlmann, S. T., Pakmor, R., et al. 2015, MNRAS, 450, 3045, doi: 10.1093/mnras/stv886
- Li et al. (2018) Li, L., Wang, X., Zhang, J., et al. 2018, MNRAS, 478, 4575, doi: 10.1093/mnras/sty1303
- Li et al. (2003) Li, W., Filippenko, A. V., Chornock, R., et al. 2003, PASP, 115, 453, doi: 10.1086/374200
- Magee et al. (2022) Magee, M. R., Gillanders, J. H., Maguire, K., Sim, S. A., & Callan, F. P. 2022, MNRAS, 509, 3580, doi: 10.1093/mnras/stab3123
- Magee et al. (2019) Magee, M. R., Sim, S. A., Kotak, R., Maguire, K., & Boyle, A. 2019, A&A, 622, A102, doi: 10.1051/0004-6361/201834420
- Magee et al. (2016) Magee, M. R., Kotak, R., Sim, S. A., et al. 2016, A&A, 589, A89, doi: 10.1051/0004-6361/201528036
- Magee et al. (2017) —. 2017, A&A, 601, A62, doi: 10.1051/0004-6361/201629643
- Maguire et al. (2023) Maguire, K., Magee, M. R., Leloudas, G., et al. 2023, MNRAS, 525, 1210, doi: 10.1093/mnras/stad2316
- McClelland et al. (2010) McClelland, C. M., Garnavich, P. M., Galbany, L., et al. 2010, ApJ, 720, 704, doi: 10.1088/0004-637X/720/1/704
- McCully et al. (2014a) McCully, C., Jha, S. W., Foley, R. J., et al. 2014a, ApJ, 786, 134, doi: 10.1088/0004-637X/786/2/134
- McCully et al. (2014b) —. 2014b, Nature, 512, 54, doi: 10.1038/nature13615
- Meng & Podsiadlowski (2014) Meng, X., & Podsiadlowski, P. 2014, ApJ, 789, L45, doi: 10.1088/2041-8205/789/2/L45
- Miller et al. (2017) Miller, A. A., Kasliwal, M. M., Cao, Y., et al. 2017, The Astrophysical Journal, 848, 59, doi: 10.3847/1538-4357/aa8c7e
- Miller et al. (2020) Miller, A. A., Yao, Y., Bulla, M., et al. 2020, ApJ, 902, 47, doi: 10.3847/1538-4357/abb13b
- Narayan et al. (2011) Narayan, G., Foley, R. J., Berger, E., et al. 2011, ApJ, 731, L11, doi: 10.1088/2041-8205/731/1/L11
- Nicholl (2018) Nicholl, M. 2018, Research Notes of the American Astronomical Society, 2, 230, doi: 10.3847/2515-5172/aaf799
- Nordin et al. (2020a) Nordin, J., Maguire, K., Miller, A., et al. 2020a, Transient Name Server AstroNote, 185, 1
- Nordin et al. (2020b) —. 2020b, Transient Name Server Classification Report, 2020-2940, 1
- Nordin & Perley (2020) Nordin, J., & Perley, D. 2020, Transient Name Server Discovery Report, 2020-2929, 1
- Nordin et al. (2019) Nordin, J., Brinnel, V., van Santen, J., et al. 2019, A&A, 631, A147, doi: 10.1051/0004-6361/201935634
- Nugent et al. (2011) Nugent, P. E., Sullivan, M., Cenko, S. B., et al. 2011, Nature, 480, 344, doi: 10.1038/nature10644
- Phillips (1993) Phillips, M. M. 1993, ApJ, 413, L105, doi: 10.1086/186970
- Phillips et al. (1999) Phillips, M. M., Lira, P., Suntzeff, N. B., et al. 1999, AJ, 118, 1766, doi: 10.1086/301032
- Phillips et al. (2007) Phillips, M. M., Li, W., Frieman, J. A., et al. 2007, PASP, 119, 360, doi: 10.1086/518372
- Riess et al. (1999) Riess, A. G., Filippenko, A. V., Li, W., et al. 1999, AJ, 118, 2675, doi: 10.1086/301143
- Sahu et al. (2008) Sahu, D. K., Tanaka, M., Anupama, G. C., et al. 2008, ApJ, 680, 580, doi: 10.1086/587772
- Schlafly & Finkbeiner (2011) Schlafly, E. F., & Finkbeiner, D. P. 2011, ApJ, 737, 103, doi: 10.1088/0004-637X/737/2/103
- Seitenzahl et al. (2013) Seitenzahl, I. R., Ciaraldi-Schoolmann, F., Röpke, F. K., et al. 2013, MNRAS, 429, 1156, doi: 10.1093/mnras/sts402
- Sim et al. (2013) Sim, S. A., Seitenzahl, I. R., Kromer, M., et al. 2013, MNRAS, 436, 333, doi: 10.1093/mnras/stt1574
- Singh et al. (2018) Singh, M., Misra, K., Sahu, D. K., et al. 2018, MNRAS, 474, 2551, doi: 10.1093/mnras/stx2916
- Singh et al. (2022) —. 2022, MNRAS, 517, 5617, doi: 10.1093/mnras/stac3059
- Singh et al. (2023) Singh, M., Sahu, D. K., Dastidar, R., et al. 2023, ApJ, 953, 93, doi: 10.3847/1538-4357/acd559
- Sorce et al. (2014) Sorce, J. G., Tully, R. B., Courtois, H. M., et al. 2014, MNRAS, 444, 527, doi: 10.1093/mnras/stu1450
- Spergel et al. (2007) Spergel, D. N., Bean, R., Doré, O., et al. 2007, The Astrophysical Journal Supplement Series, 170, 377, doi: 10.1086/513700
- Srivastav et al. (2020) Srivastav, S., Smartt, S. J., Leloudas, G., et al. 2020, ApJ, 892, L24, doi: 10.3847/2041-8213/ab76d5
- Srivastav et al. (2022) Srivastav, S., Smartt, S. J., Huber, M. E., et al. 2022, MNRAS, 511, 2708, doi: 10.1093/mnras/stac177
- Stritzinger et al. (2014) Stritzinger, M. D., Hsiao, E., Valenti, S., et al. 2014, A&A, 561, A146, doi: 10.1051/0004-6361/201322889
- Stritzinger et al. (2015) Stritzinger, M. D., Valenti, S., Hoeflich, P., et al. 2015, A&A, 573, A2, doi: 10.1051/0004-6361/201424168
- Taubenberger (2017) Taubenberger, S. 2017, in Handbook of Supernovae, ed. A. W. Alsabti & P. Murdin, 317, doi: 10.1007/978-3-319-21846-5_37
- Theureau et al. (2007) Theureau, G., Hanski, M. O., Coudreau, N., Hallet, N., & Martin, J. M. 2007, A&A, 465, 71, doi: 10.1051/0004-6361:20066187
- Thomas et al. (2011) Thomas, R. C., Nugent, P. E., & Meza, J. C. 2011, PASP, 123, 237, doi: 10.1086/658673
- Tomasella et al. (2016) Tomasella, L., Cappellaro, E., Benetti, S., et al. 2016, MNRAS, 459, 1018, doi: 10.1093/mnras/stw696
- Tomasella et al. (2020) Tomasella, L., Stritzinger, M., Benetti, S., et al. 2020, MNRAS, 496, 1132, doi: 10.1093/mnras/staa1611
- Tully et al. (2016) Tully, R. B., Courtois, H. M., & Sorce, J. G. 2016, AJ, 152, 50, doi: 10.3847/0004-6256/152/2/50
- Tully et al. (2013) Tully, R. B., Courtois, H. M., Dolphin, A. E., et al. 2013, AJ, 146, 86, doi: 10.1088/0004-6256/146/4/86
- Valenti et al. (2008) Valenti, S., Benetti, S., Cappellaro, E., et al. 2008, MNRAS, 383, 1485, doi: 10.1111/j.1365-2966.2007.12647.x
- Valenti et al. (2014) Valenti, S., Sand, D., Pastorello, A., et al. 2014, MNRAS, 438, L101, doi: 10.1093/mnrasl/slt171
- Valenti et al. (2016) Valenti, S., Howell, D. A., Stritzinger, M. D., et al. 2016, MNRAS, 459, 3939, doi: 10.1093/mnras/stw870
- Wang et al. (2013) Wang, X., Wang, L., Filippenko, A. V., Zhang, T., & Zhao, X. 2013, Science, 340, 170, doi: 10.1126/science.1231502
- Wang et al. (2008) Wang, X., Li, W., Filippenko, A. V., et al. 2008, ApJ, 675, 626, doi: 10.1086/526413
- Wang et al. (2009) Wang, X., Filippenko, A. V., Ganeshalingam, M., et al. 2009, ApJ, 699, L139, doi: 10.1088/0004-637X/699/2/L139
- White et al. (2015) White, C. J., Kasliwal, M. M., Nugent, P. E., et al. 2015, ApJ, 799, 52, doi: 10.1088/0004-637X/799/1/52
- Yamanaka et al. (2015) Yamanaka, M., Maeda, K., Kawabata, K. S., et al. 2015, ApJ, 806, 191, doi: 10.1088/0004-637X/806/2/191
- Yaron & Gal-Yam (2012) Yaron, O., & Gal-Yam, A. 2012, PASP, 124, 668, doi: 10.1086/666656