Luminescence properties of closely packed organic color centers grafted on a carbon nanotube
Abstract
We report on the photo-luminescence of pairs of organic color centers in single-wall carbon nanotubes grafted with 3,5 dichlorobenzene. Using various techniques such as intensity correlations, super-localization microscopy or luminescence excitation spectroscopy, we distinguish two pairs of color centers grafted on the same nanotube; the distance between the pairs is on the order of several hundreds of nanometers. In contrast, by studying the strong temporal correlations in the spectral diffusion in the framework of photo-induced Stark effect, we can estimate the distance within each pair to be of the order of a few nanometers. Finally, the electronic population dynamics is investigated using time-resolved luminescence and saturation measurements, showing a biexponential decay with a fast overall recombination (compatible with a fast population transfer between the color centers within a pair) and a weak delayed repopulation of the traps possibly due to the diffusion of excitons along the tube axis.
keywords:
Carbon nanotube, Organic Color Center, Spectral Diffusion, Coupled Emitters1 Introduction
Color centers stand for pseudo atomic systems embedded in a solid-state material that can be manipulated optically for coherent control, single photon emission and other quantum operations 1, 2, 3. They stand up as valuable building blocks for quantum technologies, in particular for all the technological advantages associated to solid-state systems. Among many possible approaches for quantum manipulations, the case of quantum emitters in close vicinity () is of particular interest for sensing 4, 5 or to implement quantum superpositions and entangled states yielding for instance super and sub-radiance effects… Such effects have been demonstrated using incidental pairs of quantum dots 6 or pairs of molecules embedded in a matrix at low temperature 7, 8. In this respect, the control of the relative position of the emitters at the nanoscale, at least along one or two directions, would open the way to a better control over the fabrication of coupled quantum emitters, for applications in solid-state quantum technologies.
Carbon nanotubes (CNTs) have recently been considered for such applications due to the possibility to use them as a functionalizable backbone to graft various molecules by means of organic chemistry tools such as diazonium chemistry 9, 10, 11, 12, 13. The molecule grafted on a semi-conducting carbon nanotube acts as a deep potential well ( meV) for the excitons generated across the bandgap of the nanotube, yielding the concept of organic color centers (OCC) which proved to be an original single photon source in the near infrared (telecom bands O and C) up to room temperature 10. This 1D backbone increases drastically the probability to generate pairs of closely packed emitters (much closer than the wavelength ) since it basically scales like using the 1D template whereas it scales like in a random 3D case, yielding a fold enhancement. This concept was recently explored for guanine decorated CNTs, where closely spaced OCCs could be observed, giving rise to anti-correlation signatures 14.
In this work, we report on the observation of two couples of OCC along the same nanotube, showing strong spectral correlations, which we analyse in the framework of Stark induced spectral diffusion. We obtain an estimate of the distance between OCCs within each pair of the order of a few nanometers. Using saturation and time-resolved spectroscopy, we investigate the population dynamics within each pair of OCC.
2 Methods
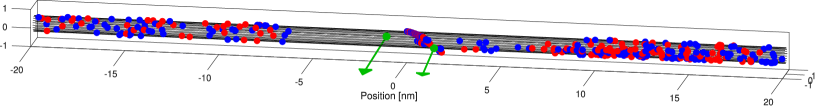
The sample consists in (7,5) single-wall carbon nanotubes (CNTs) dispersed and wrapped in a polymer (PFO) in suspension in a 5 % mass polystyrene in toluene solution. This solution is spin-coated on a Bragg mirror resulting in individual (7,5) CNTs embedded in a 160 nm thick polystyrene layer. The CNTs are then functionalized by 3,5 dichlorobenzene diazonium salt by the dip doping method 10. The 3,5 dichlorobenzene ion is covalently attached to the CNT surface by converting a into a bound. In this study, we focused on the subclass of the photoluminescent states of the OCC, that emit in the O band 10.
The experimental setup consists in a home-made microscope with the objective inside a closed-cycle cryostat. The sample is cooled at 9K (see details in 15, 16). The excitation laser at a wavelength of 800 nm is either a cw or pulsed Ti:Saphire laser (tunable cw MSquared laser or pulsed Coherent Vitesse Laser). The photo-luminescence (PL) was analyzed either with a spectrometer (IsoPlane 300) coupled to an InGaAs CCD (Princeton NIRvana) or with a fibered superconducting single photon detector (Scontel SSPD). The CNT is coupled to a fiber Fabry-Perot cavity, as described in 16. Here, the cavity is used primarily as a sharp tunable band-pass filter.
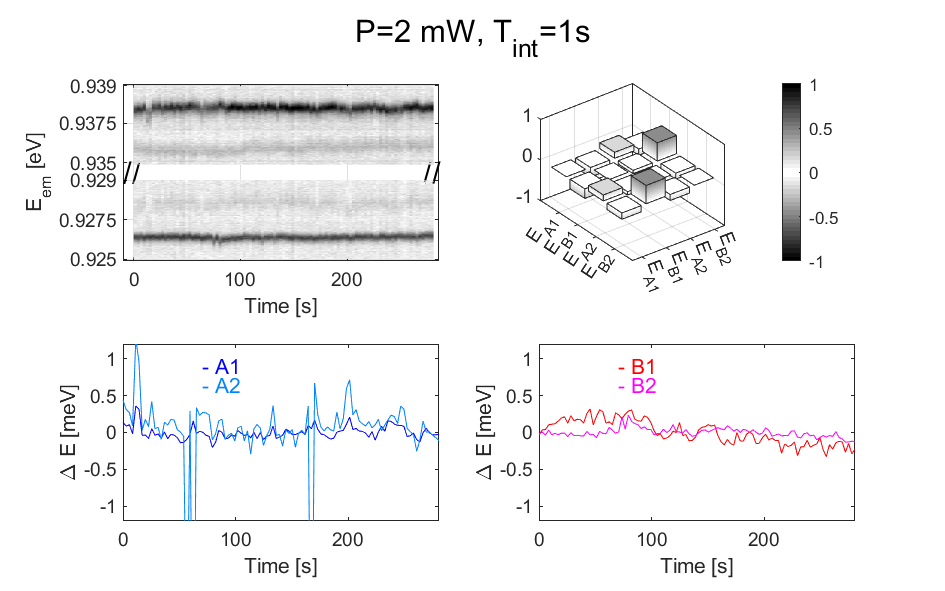
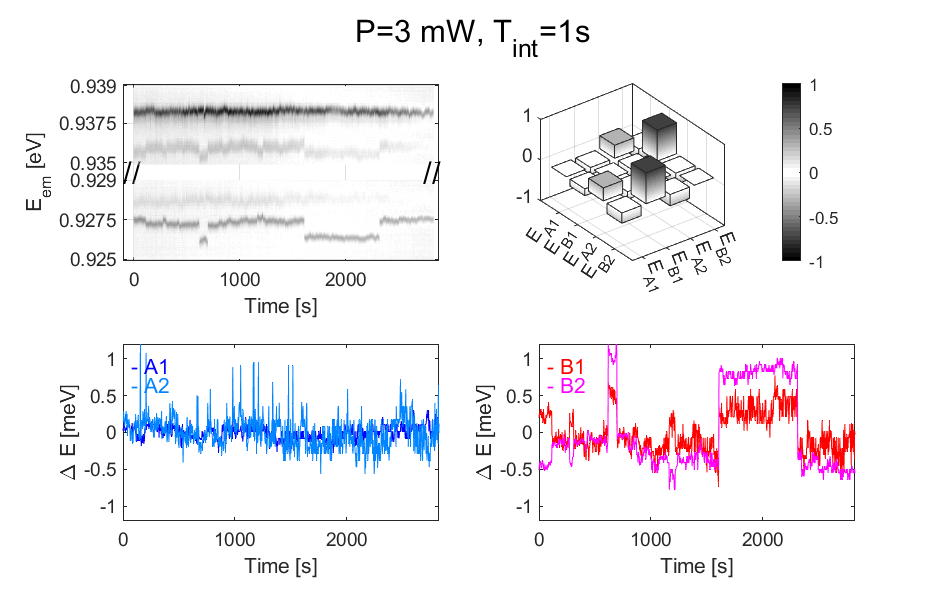
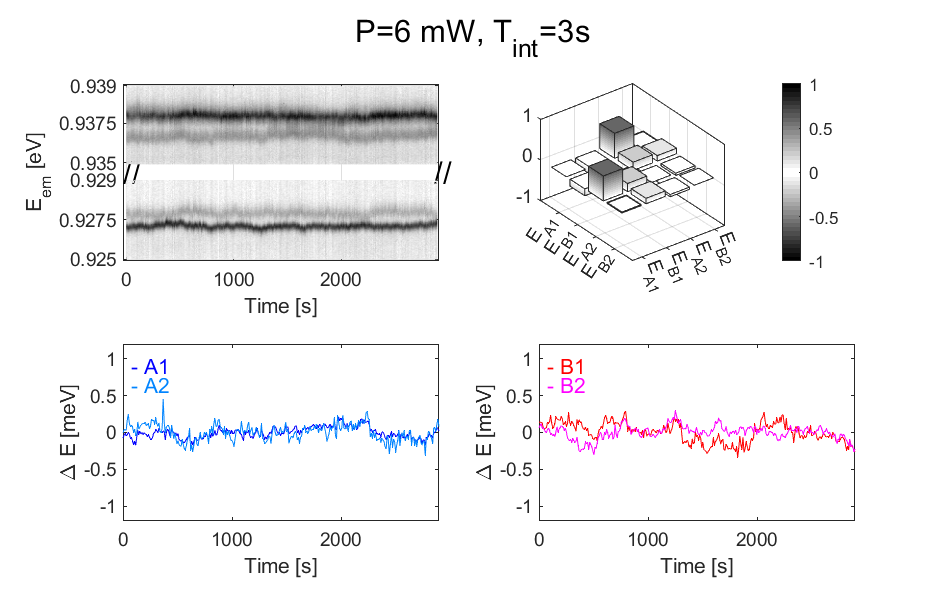
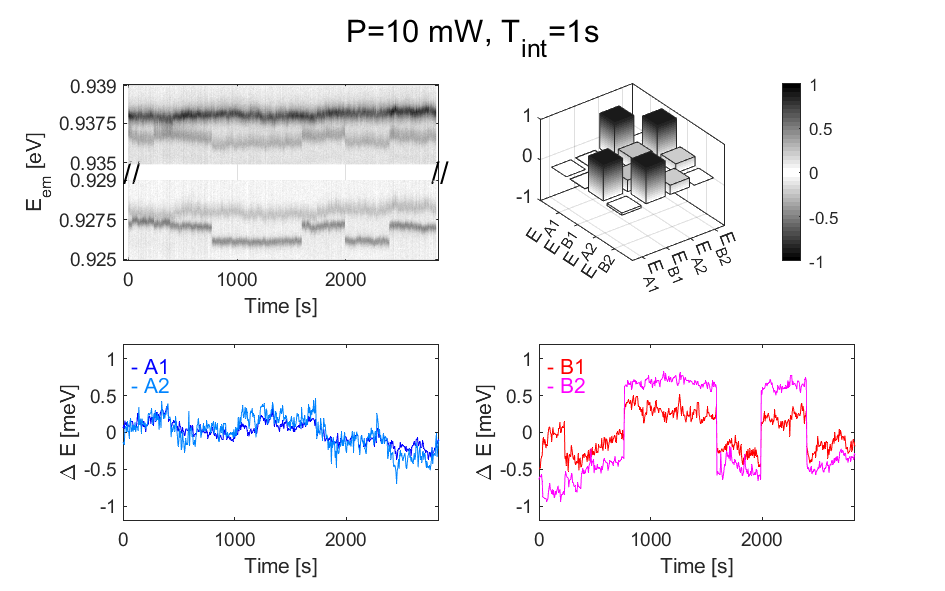
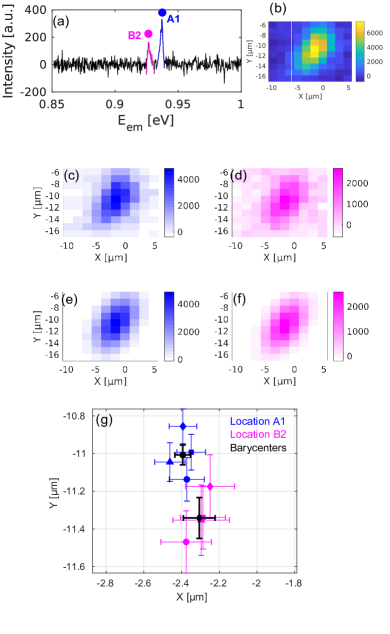
Observations. We investigated a 20 meV wide spectral band around 0.93 eV, in the telecom O band. Beside numerous spectra consisting in a single line, we happened to observe more complex spectra such as that of Fig. 1(b), which consists of 4 lines. The evolution of the spectrum over time (with a 1 s time bin) is shown in Fig.1 (c). Correlated spectral wandering and jumps can be observed. Quantitative assessment of the correlations between these lines can be gained by computing the correlation matrix of the spectral position of the four lines over time Fig.1 (d). The emission energies are temporally correlated for lines and (Fig.1 (e)) in the one hand and lines and on the other hand (Fig.1 (f)).
Such correlations may have several origins. They are either the signature of two very close emitters sharing the same electrostatic environment and thus having correlated Stark shifts, or the signature of a single emitter showing two bright levels or a single emitter subject to fast switching between two energy levels (much faster than the detection time scale, hence showing up as two lines) due to the interaction of a single emitter with a nearby fast fluctuator. In the following, we show that the spectrum of Fig. 1(b) actually arises from two pairs of closely packed emitters as depicted in Fig. 1(a).
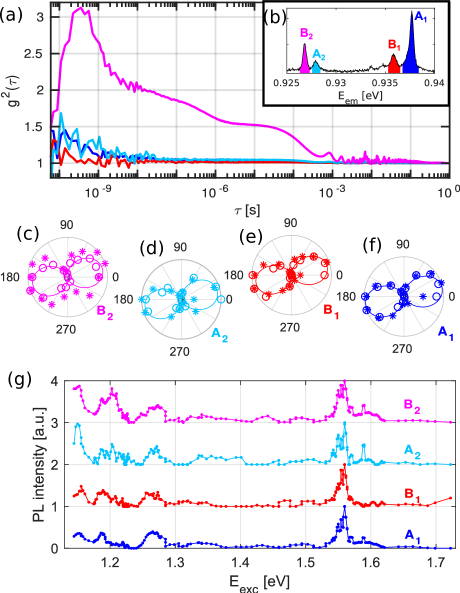
Eventhough the dark/bright splitting reported for both pristine and aryl-functionalized (7,5) SWCNT (4 meV to 15 meV) under high magnetic field ( 5 T) 17, 18 roughly matches the splittings we observe for pair and pair (Fig. 1(b)), we rule out the interpretation because in the absence of a magnetic field the intensity contrast would be much larger than observed here. In addition, the observation of such split lines in our sample is very unusual, at contrast with an intrinsic dark/bright splitting which should be ubiquitous. A fluctuator - such as a charge or a dipole switching rapidly between two states or positions in the close environment of the OCC - could split the excitonic emission energy on a time scale much shorter than the acquisition time. The fluctuations of these lines on the longer (1 s) time-scale would naturally be correlated since both lines arise from the same microscopic object. In addition, the intensity auto-correlation function should show a signature at the timescale of this switching. More specifically, the autocorrelations of both lines should exhibit a step at the same time delay (an exponential decay appears as a step when the time axis is represented in logarithmic scale); the product of the two step amplitudes being equal to one (see model in SI). Fig. 2(a) shows the auto-correlations of each of the four lines, over a time span between 60 ps and 1 s (semi-log scale). Although steps can be identified, the amplitudes in B1 and B2 or in A1 and A2 do not fulfill the condition described above, ruling out the hypothesis of a fast fluctuator. Note that the presence of oscillations in the autocorrelations for times exceeding 0.1 ms are signatures of mechanical vibrations in our setup due to the high sensitivity of the Fabry-Perot cavity used for spectral filtering. In addition, for such fast switching scenario, one would also observe cross-correlations in the intensity fluctuations or cross-correlations between the intensity and the energy position corresponding to the slow variations of the charge state of the emitter 19. This is not the case here, as showed by the correlation matrices (SI). Finally, we show below that each line has its own decay dynamics, which tend to confirm that they actually arise from physically different OCCs. Hence, we rule out the scenario of a fast switching system and we are left with the simplest explanation : each pair of lines arises from two distinct OCCs that are close enough to probe the same fluctuating electrostatic environment.
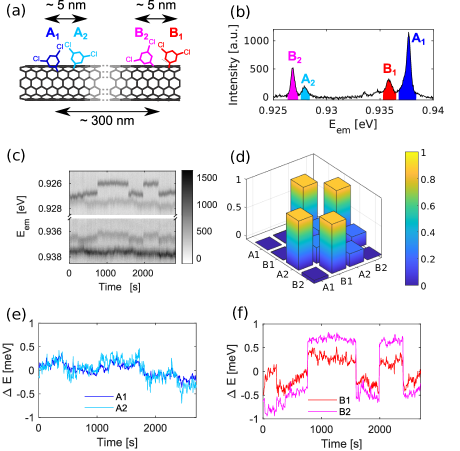
The diffraction limited resolution of the microscope is not sufficient to decide whether the four OCC actually belong to the same nanotube or to distinct ones (within the diffraction spot). To investigate this question further, we first checked their polarization diagrams. In fact, due to the strong aspect ratio of the nanotube, depolarization effects strongly polarize both their intrinsic PL and that arising from nearby emitters 20 along the nanotube axis. The diagrams are shown in Fig. 2 (c-f), open circles, together with a dipolar diagram fit. The four spectral lines are co-polarized in emission with the same angle (with respect to an arbitrary horizontal direction). Interestingly, the same copolarization signature is observed on the excitation diagrams (full symbols in Fig. 2(c-f), meaning that the exciton generation is favored for the same polarization orientation for all the lines. This strongly suggests that the four OCCs are attached to the same nanotube and fed by the excitons generated at higher energy in the nanotube. To confirm this interpretation, we performed an excitation resolved PL study (PLE). The excitation spectrum of each line in displayed in Fig. 2(g). The four emitters show the same resonances especially at about 1.56 eV, in line with a common feeding process from the intrinsic excitons of the nanotube. Finally, we performed a spectrally resolved super-localization measurement in the spirit of the work by Raynaud et al. 21 in order to possibly determine a sub-wavelength localization of the emission sites. The spatial precision of such measurement relies on a trade-off between the integration time and the signal-to-noise ratio and was typically 15 nm to 25 nm for optimized setups such as in 21 or 22 . Our setup was not design for such experiment and we could only resolve the brightest emitters and and we measured a distance of 300 nm 150 nm between them (see SI). The distance within the pairs could not be resolved with this technique.
3 Results and discussion
Correlated Stark shifts. We used the correlated Stark shifts to evaluate the typical distance between the two emitters. Within the framework of the linear Stark effect, the energy shifts are given by: , where is the electric field and a permanent dipole associated with the OCC. Glückert et al. 23 showed that an oxygen OCC has a permanent dipolar moment of the order of 0.15 e.Å (where is the elementary charge). This permanent dipole (carried by the OCC) has to be differentiated from the transition dipole. In particular, it is not necessarily oriented along the CNT axis but would rather point along the direction of the molecular substituent making up the OCC. As a first approach, we thus computed the Stark shifts using the permanent dipole moment of 3,5 dichlorobenzene which is of 0.47 e.Å (2 Debye).
This dipole is in interaction with the electrostatic environment. Using the superposition principle, the trapping/detrapping of an elementary charge in the vicinity of the dipole yields a Stark shift :
| (1) |
where is the polystyrene static dielectric permittivity, is the permanent dipole moment, is the vector between the positions of the dipole and the charge, the positive (resp. negative) sign corresponds to a trapping (resp. detrapping) event. Experimentally, represents the spectral shift between two consecutive acquisitions. Indeed, we observe sharp spectral jumps which are compatible with individual charge trapping events. In contrast, if many events occurred within the integration time, one would rather observe smooth spectral drifts.
In addition, we observed that the magnitude of the spectral diffusion increases with the optical power, pointing towards photo-generated charges. Since the polystyrene matrix is transparent at this wavelength, absorption mainly occurs in the carbon nanotube, with charges being possibly transferred to the close vicinity of the nanotube due to photo-ionisation. Hence, in a first approach, we chose a quasi 1D model where the fluctuating charges are bound to the nanotube axis. Hence, for each line, we computed the energy difference between consecutive spectra. These energy differences are represented in a bi-dimensional plot (Fig. 3(a,c)). To account for the 33 µeV resolution of our spectrometer, we represented each point as a 2D Gaussian spot with a standard deviation of 33 µeV. After summing up all these contributions, we obtain a density plot representing the dual probability of spectral jumps of the two lines of the pair (Fig. 3(b,d)). The two pairs show contrasted distributions. For the pair A, the energy shifts and are linearly correlated with no observable deviation for meV. For pair B, the density plot shows five main lobes with symmetry center in (0,0). The central lobe also shows linear correlations (a fit leads to a slope of 0.22 with only 0.01 errorbar). The pair of lobes that are symmetrical with respect to the origin correspond to finite spectral shifts of either identical signs (lobes Z2) or opposite signs (lobes Z3). We modeled this distribution assuming that each point corresponds to the trapping or de-trapping of an elementary charge in the vicinity of the nanotube resulting in a shift given by eq.1. Small energy shifts are related to remote charges and the slope of the central lobe can be related to the values of the permanents dipoles or more precisely their projections along the nanotube axis.
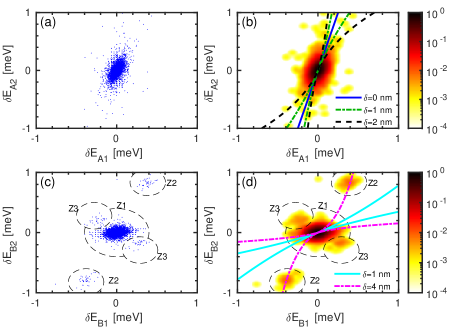
For pair A, this analysis imposes an upper bound on the distance between the two dipoles nm. In fact, for larger dipole separation a splitting of the central lobe is expected (dashed black line), due to an increasing differential effect of a charge along the tube axis on the left and right side OCC. In addition, the absence of side lobes (such as those of pair B) also points to a low distance between the OCCs. In particular, the absence of the anti-symmetric lobes rules out a configuration with a charge trapped in-between the OCCs and thus points to a tiny separation within pair A.
For pair B, we can formally exclude that the two dipoles are located at the same position since correlated shifts (lobes Z2) and anti-correlated shifts (lobes Z3) are observed, which corresponds to the case where the trapped charge is located between the two OCC. As explained above, the lobe Z1 results from fluctuating charges located far away from the pair. Lobe Z2 corresponds to a peculiar nearby trapping site on the CNT axis. We can deduce the dipole-dipole separation in pair B to be of the order of 4 nm. In a 1D model, lobe Z3 would correspond to a single trapping site between the two dipoles. However, in this configuration, the distances between the charge and the dipoles is comparable to the diameter of the nanotube and the 1D approximation has to be reconsidered. By considering the 3D geometry of the nanotube and different dipole orientations, the spectral shifts observed in Fig.3(c,d) can be reproduced. Examples of possible 3D configuration of the dipole on a nanotube are presented in the SI.
We finally end up with the picture of two pairs of OCCs separated by a distance of the order of 300 nm whereas the distance within each pair is on the order of a few nanometers. This tiny separation between the OCCs in each pair is likely to impact the dynamics of the system 14, 24, which we investigate in the following section.
Population dynamics. To measure the PL decay, we exploit the coupling of the nanotube to a tunable fiber Fabry-Perot cavity, as described in 16, allowing us to obtain a good spectral rejection with a typical width of 50 µeV. After filtering the excitation, the emission is sent to an SSPD detector. The PL transients are shown in Fig. 4(c-f) together with bi-exponential fits (mono-exponential fit for panel (f)). For both pairs of OCCs, the upper energy line shows the fastest weighted average decay. For the pair , the decay times of each emitter are similar, yet the weight of the longer decay is 6 times greater for the lower energy level. Note that the short decay time is below our time-resolution. According to literature the lifetime of (7,5) aryl-functionalized SWCNT is typically between 100-200 ps with a dominating contribution of the longer component 10, 25 ( being the integrated weight of the long component). Emitters and (upper levels in each pair) thus exhibit unusually fast decay revealing possible interaction with other levels. However, even line is significantly faster than previously reported, especially regarding the significant weight of the short decay component. In a first approximation, show similar behavior with a dominant fast decay (below our resolution of 10 ps) and a small weight long component with a decay time of the order of 100 ps. For each pair of OCC, we model this behavior by a four level scheme with a ground state, an upper reservoir level pumped by the laser that populates the two OCCs levels corresponding to the two lines of the pair (Fig. 4 (a)). Each level has its own decay time and we include a possible population transfer between the levels. In a phonon assisted process, this population mixing process is most likely strongly asymmetrical due to the large energy splitting (compared to ) within each pair ( meV). Hence this coupling simply results in reducing the lifetime of the upper level, in agreement with the observations. However, this coupling cannot explain the fast component of the lower level as it rather results in a finite rise time, which we cannot observe due to our limited time-resolution. The high energy excitation scheme used in our experiments is assumed to populate both the OCC levels and a population reservoir repopulating the OCC levels over a 100 ps time scale . This reservoir can be either the excitonic level of the nanotubes (in agreement with lifetime in the literature 15) due to exciton diffusion along the tube axis, or from OCC dark states 25 , giving rise to the long decay observed in all transient. This repopulation process does not contradict the high purity of single photon emission of OCCs in the literature 10. In fact, the weight of this mechanism is small and common OCCs have a longer lifetime than this repopulation process, thereby substantially decreasing the likelihood of double photon emission. The atypical value measured for the short decay component, which thus corresponds to the OCC lifetime in our model, may be caused by an unusually fast non-radiative decay for this specific OCC. In contrast, can be accurately modeled by a mono-exponential decay of the order of 150 ps. Here, it is important to note that if the OCC lifetime is longer than the repopulation time from the reservoir, the overall decay is not distinguishable from a mono-exponential decay, as is the case here, due to limited signal-to-noise ratio. This also explains why can be very low for long-lived OCCs.
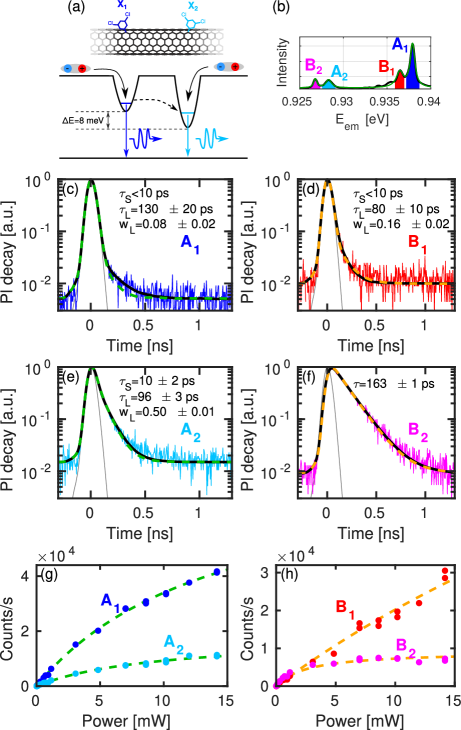
To investigate the system dynamics from a different perspective, we performed saturation measurements under cw excitation as shown in Fig. 4 (g,h). The saturation curves are well reproduced by the usual behavior , where the saturation power are , and , whereas could not be extracted for this range of excitation densities. Within a pair, the ratio of the saturation power should reflect the ratio of the decay rates of the corresponding levels. For pair , the ratio of is at least larger than 15, thus confirming the hypothesis that the lifetime of corresponds mainly to the short component in the biexponential decay. In contrast emitters and show relatively similar saturation thresholds, indicating that their unresolved rapid decay component are comparable.
We could reproduce simultaneously both the decay and the saturation curves of each pair using the four-level scheme (Fig. 4 (a)). The green dashed lines for pair and orange dashed lines for pair in Fig. 4 (c-h) correspond to a simultaneous fitting of the two transients and of the two saturation curves for each pair. We attempted to determine if the fast decay of the upper levels could be related to an efficient tunnel coupling of the population to the lower level in each pair (especially considering the small intra-pair OCC distance of pair A ( nm as estimated in the previous section, which is comparable to the exciton Bohr radius in CNTs). This scenario is compatible with the data. However, our limited time-resolution prevents us from observing directly the rise time of the lower level signal that is expected in this scenario.
4 Conclusion
We presented a thorough investigation of an original system composed of 4 OCCs, the emission energies of which are temporally correlated by pairs. Long time-scale intensity auto-correlations show that the system cannot be described with fewer emitters hosting several states. Using a full set of optical tools, we showed that these emitters are most certainly all attached to the same CNT. Using a thorough analysis and modeling of the correlated Stark shifts, we could distinguish two closely packed pairs separated by several hundreds of nm, while the distance between OCCs within a pair is on the order of a few nm. Finally, the dynamics and saturation of the lines show rather untypical behaviors for the upper levels with unusually fast decays, however the resolution is not sufficient to prove unambiguously that this is due to a population transfer to the lower levels; this hypothesis remains however plausible, in view of the inter-OCC distances within a pair, which are comparable to the exciton Bohr radius in nanotubes. This study reveals that grafted OCCs on the backbone of a CNTs is a promising way to build ensembles of closely packed quantum emitters, with possible electronic coupling. The strange coincidence of finding two such pairs within a diffraction spot, raises the question whether the grafting would be a collaborative process, possibly fostered by the lattice deformation induced by the first OCC. The question also comes if inter-level coupling could be achieved (at shorter distance), paving the way to advanced quantum manipulations of coupled OCC states.
Funding sources
This work was supported by the French National Research Agency (ANR) through the grant DELICACY (ANR-22-CE47-0001) and by the FLAG-ERA Grant OPERA (DFG 437130745 and ANR-19-GRF1-0002).
The authors thanks X. He for sample preparation. The authors thank C. Diederichs, E. Baudin, G. Hetet, Z. Said for fruitful discussion.
References
- Dolan et al. 2018 Dolan, P. R.; Adekanye, S.; Trichet, A. A. P.; Johnson, S.; Flatten, L. C.; Chen, Y. C.; Weng, L.; Hunger, D.; Chang, H.-C.; Castelletto, S.; Smith., J. M. Robust, tunable, and high purity triggered single photon source at room temperature using a nitrogen-vacancy defect in diamond in an open microcavity. Opt. Express 2018, 26, 7056–7065
- Wang et al. 2020 Wang, J.-F.; Yan, F.-F.; Li, Q.; Liu, Z.-H.; Liu, H.; Guo, G.-P.; Guo, L.-P.; Zhou, X.; Cui, J.-M.; Wang, J.; Zhou, Z.-Q.; Xu, X.-Y.; Xu, J.-S.; Li, C.-F.; Guo, G.-C. Coherent Control of Nitrogen-Vacancy Center Spins in Silicon Carbide at Room Temperature. Phys. Rev. Lett. 2020, 124, 223601
- Dolde et al. 2013 Dolde, F.; Jakobi, I.; Naydenov, B.; Zhao, N.; Pezzagna, S.; Trautmann, C.; Meijer, J.; Neumann, P.; Jelezko, F.; Wrachtrup, J. Room-temperature entanglement between single defect spins in diamond. Nature Physics 2013, 9, 139–143
- Ji et al. 2024 Ji, W.; Liu, Z.; Guo, Y.; Hu, Z.; Zhou, J.; Dai, S.; Chen, Y.; Yu, P.; Wang, M.; Xia, K.; Shi, F.; Wang, Y.; Du, J. Correlated sensing with a solid-state quantum multisensor system for atomic-scale structural analysis. Nature Photonics 2024,
- Delord et al. 2024 Delord, T.; Monge, R.; Meriles, C. A. Correlated spectroscopy of stochastic Coulomb fields with sub-diffraction color center clusters. arXiv Preprint 2024,
- Koong et al. 2022 Koong, Z. X.; Cygorek, M.; Scerri, E.; Santana, T. S.; Park, S. I.; Song, J. D.; Gauger, E. M.; Gerardot, B. D. Coherence in cooperative photon emission from indistinguishable quantum emitters. Science Advances 2022, 8
- Hettich et al. 2002 Hettich, C.; Schmitt, C.; Zitzmann, J.; Kühn, S.; Gerhardt, I.; Sandoghdar, V. Nanometer Resolution and Coherent Optical Dipole Coupling of Two Individual Molecules. Science 2002, 298, 385–389
- Trebbia et al. 2022 Trebbia, J.-B.; Deplano, Q.; Tamarat, P.; Lounis, B. Tailoring the superradiant and subradiant nature of two coherently coupled quantum emitters. Nature Communications 2022, 13
- Piao et al. 2013 Piao, Y.; Meany, B.; Powell, L. R.; Valley, N.; Kwon, H.; Schatz, G. C.; Wang, Y. Brightening of carbon nanotube photoluminescence through the incorporation of sp3 defects. Nat. Chem. 2013, 5, 840–845
- He et al. 2017 He, X.; Hartmann, N. F.; Ma, X.; Kim, Y.; Ihly, R.; Blackburn, J. L.; Gao, W.; Kono, J.; Yomogida, Y.; Hirano, A.; Tanaka, T.; Kataura, H.; Htoon, H.; Doorn, S. K. Tunable room-temperature single-photon emission at telecom wavelengths from sp3 defects in carbon nanotubes. Nature Photonics 2017, 11, 577–582
- Ma et al. 2015 Ma, X.; Hartmann, N. F.; Baldwin, J. K. S.; Doorn, S. K.; Htoon, H. Room-temperature single-photon generation from solitary dopants of carbon nanotubes. Nature Nanotechnology 2015, 10, 671–675
- Berger et al. 2019 Berger, F. J.; Lüttgens, J.; Nowack, T.; Kutsch, T.; Lindenthal, S.; Kistner, L.; Müller, C. C.; Bongartz, L. M.; Lumsargis, V. A.; Zakharko, Y.; Zaumseil, J. Brightening of Long, Polymer-Wrapped Carbon Nanotubes by sp3 Functionalization in Organic Solvents. ACS Nano 2019, 13, 9259–9269
- Settele et al. 2021 Settele, S.; Berger, F. J.; Lindenthal, S.; Zhao, S.; Yumin, A. A. E.; Zorn, N. F.; Asyuda, A.; Zharnikov, M.; Högele, A.; Zaumseil, J. Synthetic control over the binding configuration of luminescent sp3-defects in single-walled carbon nanotubes. Nature Communications 2021, 12
- Zheng et al. 2021 Zheng, Y.; Kim, Y.; Jones, A. C.; Olinger, G.; Bittner, E. R.; Bachilo, S. M.; Doorn, S. K.; Weisman, R. B.; Piryatinski, A.; Htoon, H. Quantum Light Emission from Coupled Defect States in DNA-Functionalized Carbon Nanotubes. ACS Nano 2021, 15, 10406–10414, Publisher: American Chemical Society
- Jeantet et al. 2016 Jeantet, A.; Chassagneux, Y.; Raynaud, C.; Roussignol, P.; Lauret, J.; Besga, B.; Estève, J.; Reichel, J.; Voisin, C. Widely Tunable Single-Photon Source from a Carbon Nanotube in the Purcell Regime. Physical Review Letters 2016, 116
- Borel et al. 2023 Borel, A.; Habrant-Claude, T.; Rapisarda, F.; Reichel, J.; Doorn, S. K.; Voisin, C.; Chassagneux, Y. Telecom Band Single-Photon Source Using a Grafted Carbon Nanotube Coupled to a Fiber Fabry–Perot Cavity in the Purcell Regime. ACS Photonics 2023, 10, 2839–2845
- Gandil et al. 2019 Gandil, M.; Matsuda, K.; Lounis, B.; Tamarat, P. Spectroscopic signatures of spin-orbit coupling and free excitons in individual suspended carbon nanotubes. Phys. Rev. B 2019, 100, 081411
- Kim et al. 2020 Kim, Y.; Goupalov, S. V.; Weight, B. M.; Gifford, B. J.; He, X.; Saha, A.; Kim, M.; Ao, G.; Wang, Y.; Zheng, M.; Tretiak, S.; Doorn, S. K.; Htoon, H. Hidden Fine Structure of Quantum Defects Revealed by Single Carbon Nanotube Magneto-Photoluminescence. ACS Nano 2020, 14, 3451–3460, _eprint: https://doi.org/10.1021/acsnano.9b09548
- Boiron et al. 1999 Boiron, A.-M.; Tamarat, P.; Lounis, B.; Brown, R.; Orrit, M. Are the spectral trails of single molecules consistent with the standard two-level system model of glasses at low temperatures? Chemical Physics 1999, 247, 119–132
- Roquelet et al. 2012 Roquelet, C.; Vialla, F.; Diederichs, C.; Roussignol, P.; Delalande, C.; Deleporte, E.; Lauret, J.-S.; Voisin, C. Local Field Effects in the Energy Transfer between a Chromophore and a Carbon Nanotube: A Single-Nanocompound Investigation. ACS Nano 2012, 6, 8796–8802
- Raynaud et al. 2019 Raynaud, C.; Claude, T.; Borel, A.; Amara, M. R.; Graf, A.; Zaumseil, J.; Lauret, J.-S.; Chassagneux, Y.; Voisin, C. Superlocalization of Excitons in Carbon Nanotubes at Cryogenic Temperature. Nano Letters 2019, 19, 7210–7216, PMID: 31487461
- Danné et al. 2018 Danné, N.; Kim, M.; Godin, A. G.; Kwon, H.; Gao, Z.; Wu, X.; Hartmann, N. F.; Doorn, S. K.; Lounis, B.; Wang, Y.; Cognet, L. Ultrashort Carbon Nanotubes That Fluoresce Brightly in the Near-Infrared. ACS Nano 2018, 12, 6059–6065, PMID: 29889499
- Glückert et al. 2018 Glückert, J. T.; Adamska, L.; Schinner, W.; Hofmann, M. S.; Doorn, S. K.; Tretiak, S.; Högele, A. Dipolar and charged localized excitons in carbon nanotubes. Phys. Rev. B 2018, 98, 195413
- Zheng et al. 2021 Zheng, Y.; Weight, B. M.; Jones, A. C.; Chandrasekaran, V.; Gifford, B. J.; Tretiak, S.; Doorn, S. K.; Htoon, H. Photoluminescence Dynamics Defined by Exciton Trapping Potential of Coupled Defect States in DNA-Functionalized Carbon Nanotubes. ACS Nano 2021, 15, 923–933, PMID: 33395262
- Kim et al. 2019 Kim, Y.; Velizhanin, K. A.; He, X.; Sarpkaya, I.; Yomogida, Y.; Tanaka, T.; Kataura, H.; Doorn, S. K.; Htoon, H. Photoluminescence Intensity Fluctuations and Temperature-Dependent Decay Dynamics of Individual Carbon Nanotube sp3 Defects. J. Phys. Chem. Lett. 2019, 10, 1423–1430, Publisher: American Chemical Society
5 Supplementary informations
6 Temporal correlations
6.1 Grafted SWCNT
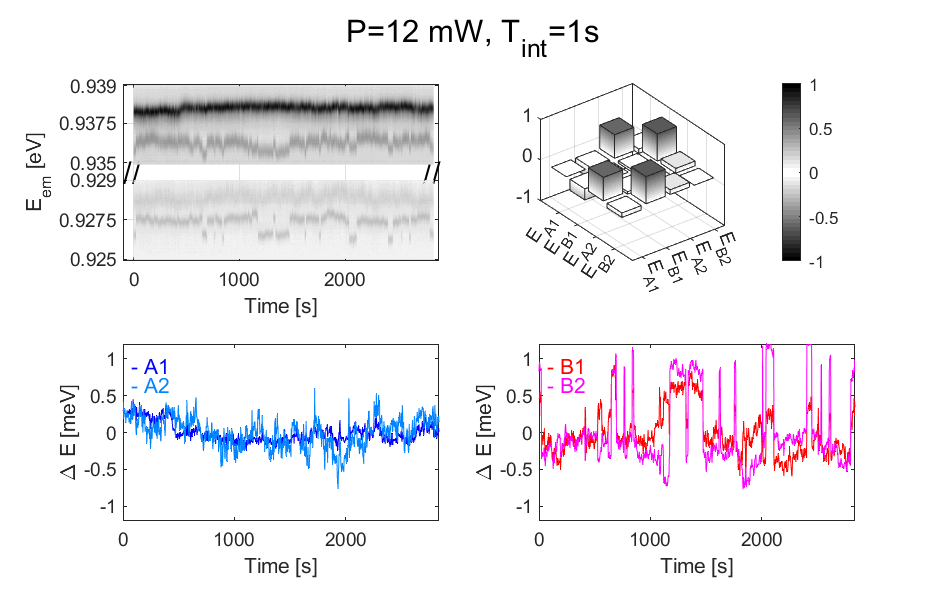
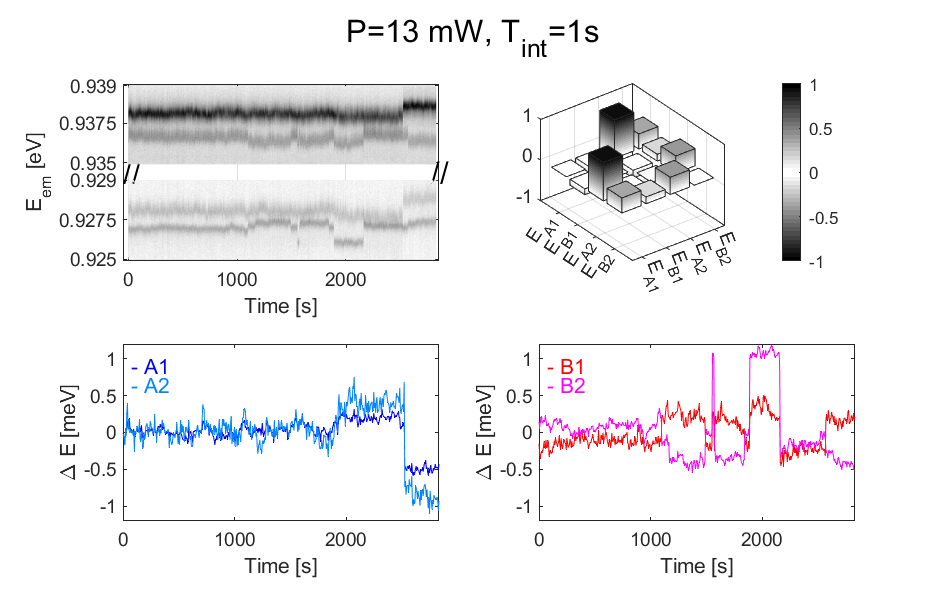
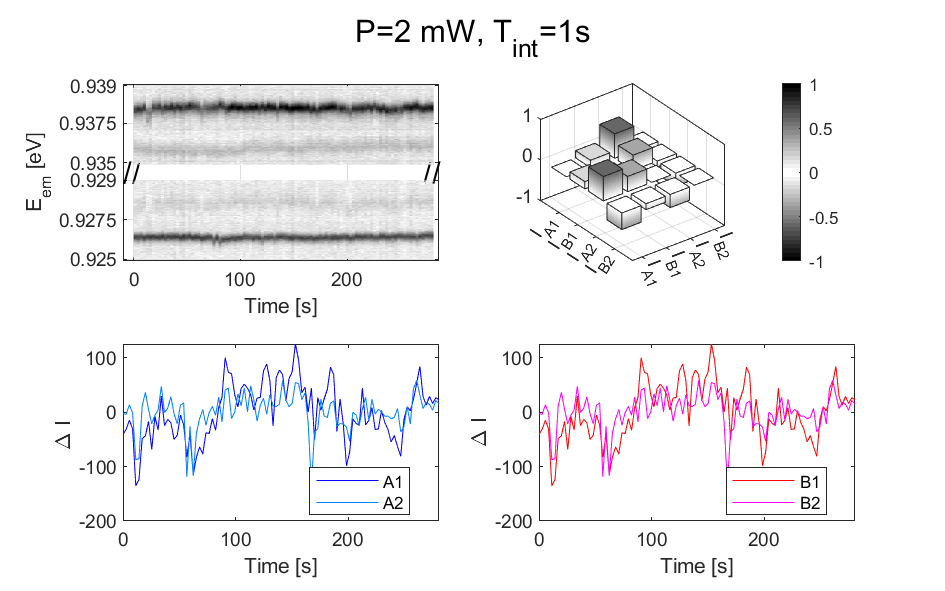
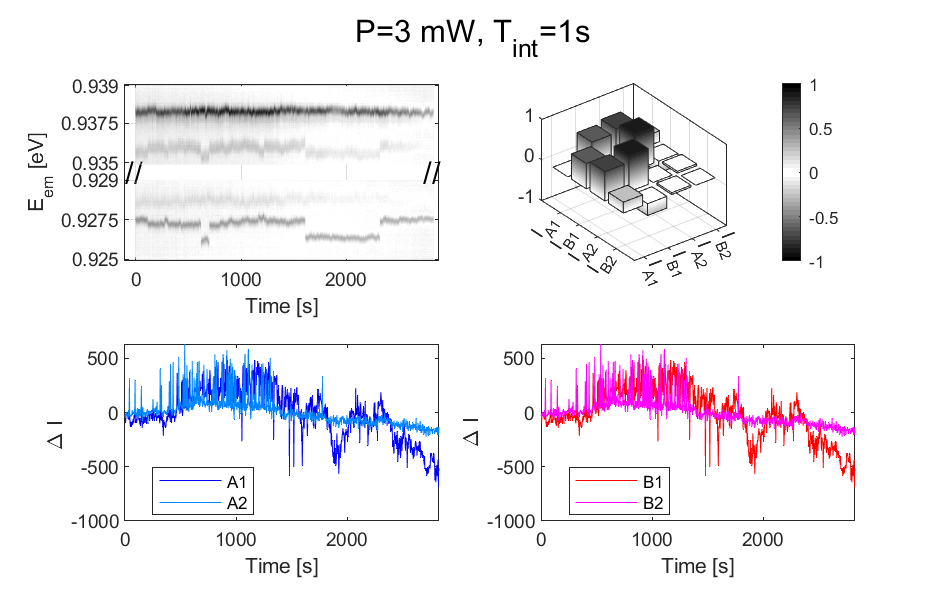
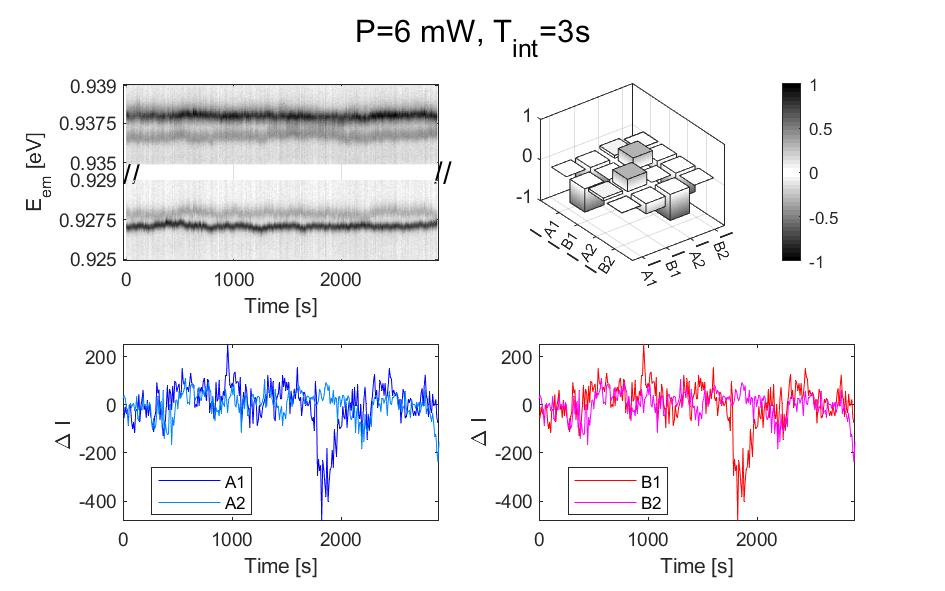
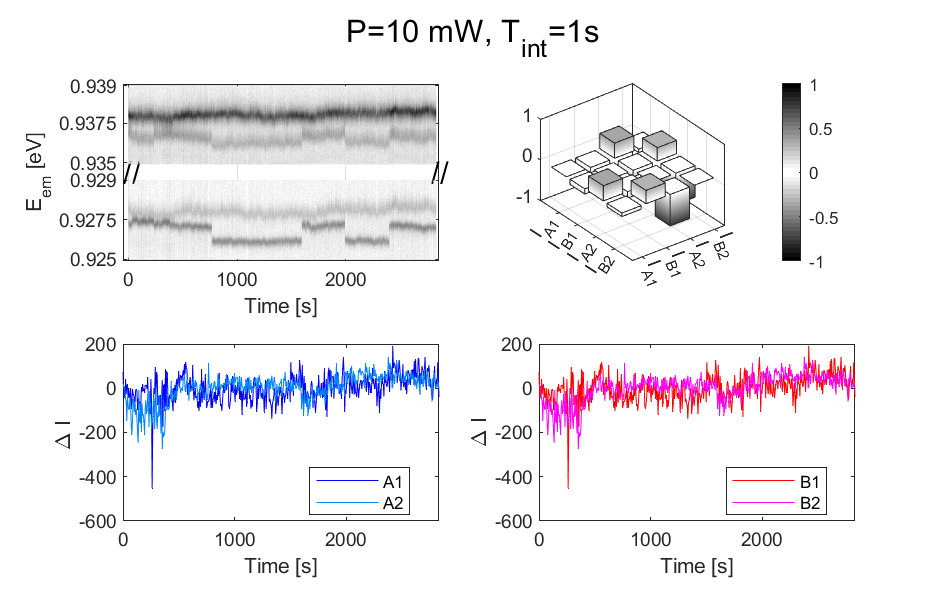
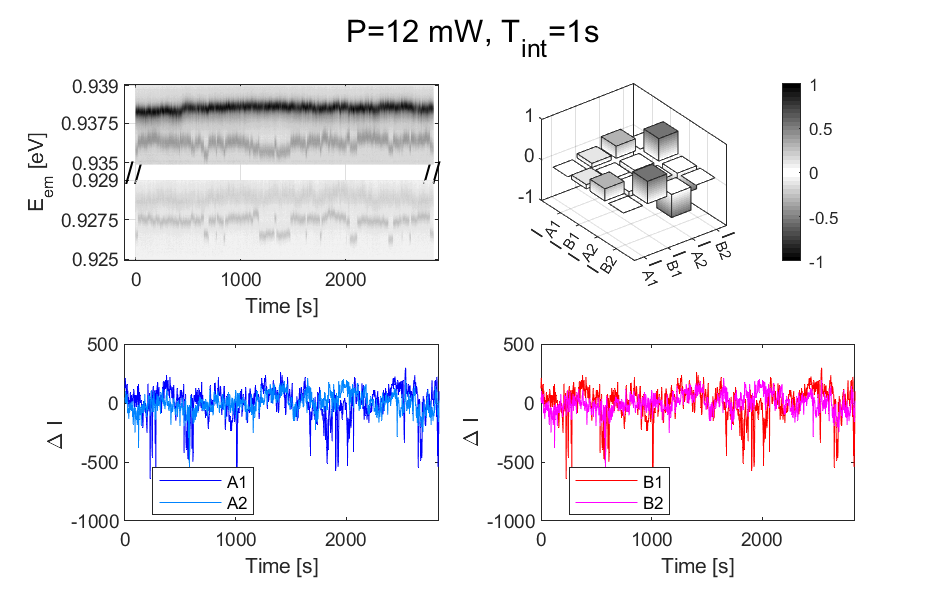
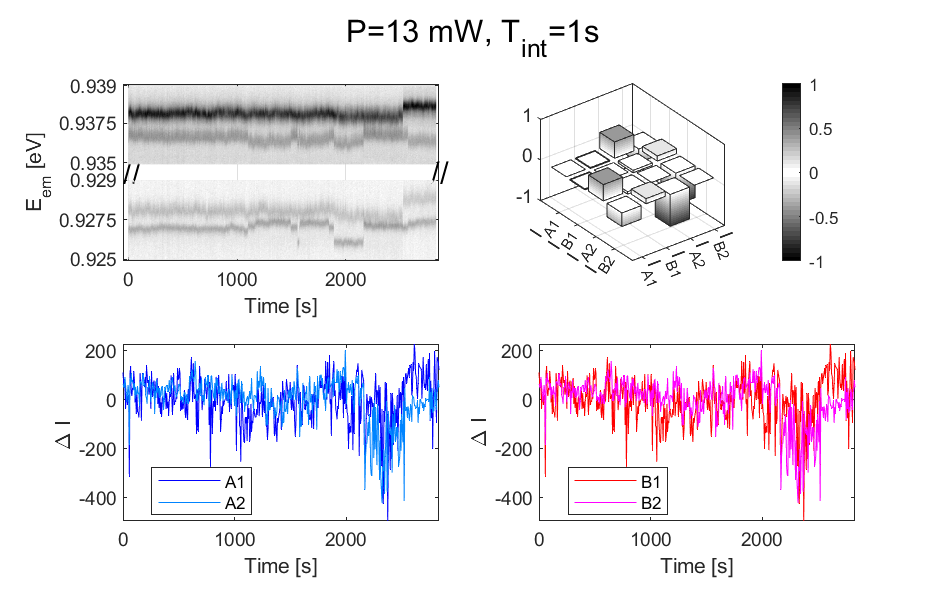
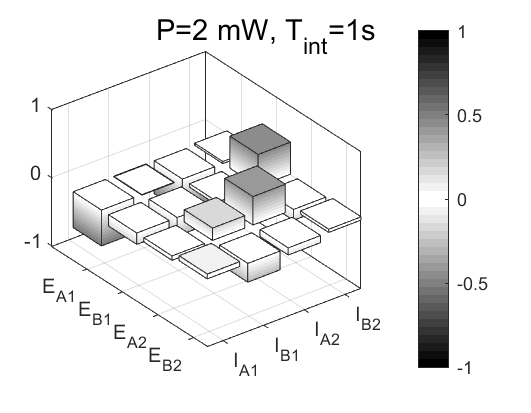
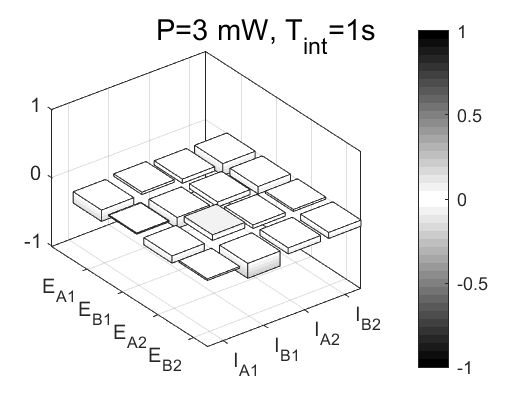
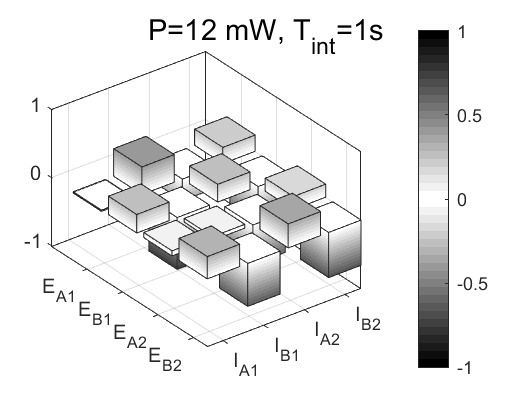
We recorded a series of 2500 spectra each with an integration time of 1s (time traces) for several excitation powers. We fitted each emission line by a Lorentzian function and extracted their emission energies and intensities. We computed the Pearson correlation coefficient between these parameters. For the sake of readability, we artificially set the auto-correlation coefficients to 0. The spectral fluctuations increase with excitation power density, pointing to a photo-induced effect, possibly mediated by photo-generated charges.


7 Super-localization
The super-localization technique is used to locate a nano-object with a precision much below the diffraction limit. It consists in measuring the PL intensity while scanning the sample spatially in a confocal setup. The resulting map is the convolution of the emitter geometry with the point spread function (PSF) of the optical setup. For a point-like emitter (such as a nano-emitter) the PL map boils down to the PSF. This latter can be modeled by a 2D Gaussian function, which in the appropriate (eigen) frame, reads:
| (2) |
where is the amplitude, and are the spatial coordinates of the emitter, is the width of the Gaussian function in the and directions respectively and is a global offset.
In our experimental setup we coupled the emitter PL into a single mode fiber. The fiber core acts as a pinhole ensuring spatial selectivity. The emitters are excited from the backside of the substrate with a cw 800nm laser and the PL is collected through an aspheric lens (Thorlabs C330-TND-C, NA=0.7). The core of the fiber is thus conjugated to the collection spot on the sample which can be scanned using a fast steering mirror in the 4f configuration.
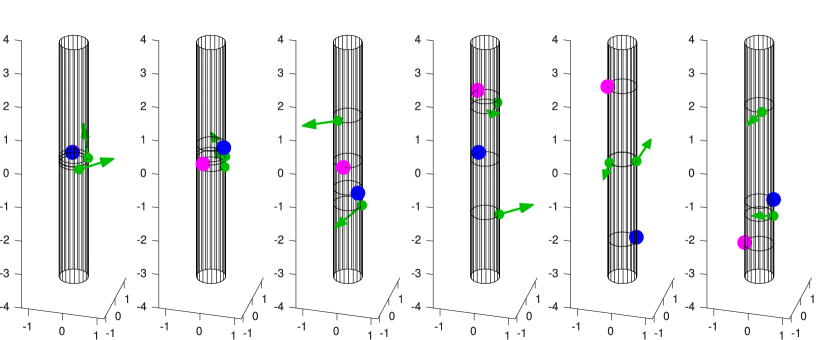
To get the best of the superlocalization technique, the measurement should last less than the typical mechanical drift. Due to the low signal level, we chose to work with a 150 lines/mm grating to reduce the integration time down to 7s per spectra, for a typical mapping time of 15 minutes. Thus, only the two brightest emitters, A1 and B2, could be resolved (Figure S-8(a)).
The spectrally resolved map of emitter A1 (resp. B2) is displayed in Figure S-8.(c) (resp. S-8(d)). These maps were fitted by a 2D Gaussian function as shown in figure S-8.(e-f). The center of the Gaussian is reported in map (g). The measurement was repeated 4 times successively to assess the mechanical drift. Each measurement is identified by a different symbol among which the color circle (resp. diamond) symbol stands for the result of the first (resp. last) measurement. We can observe for both emitter a typical drift of 200 nm in the Y direction between the first and last measurements. The barycentres are represented in black. We end up with typical distance of 260 100 nm between the emitters, which allow us to unambiguously confirm that the two pairs A and B are well separated and can be considered as independent.
8 Couple B: possible 3D electrostatic configuration
In Figure S-9, some possible 3D configurations of the dipoles associated with pair B are presented, that are compatible with the experimental data presented in Figure 3 of the main text. The average slope of the central lobe (Z1) (corresponding to trapping and detrapping of remote charges) sets the ratio of the projections of the two dipoles along the nanotube axis. The lobes Z2 and Z3 correspond to charges in the vicinity of the dipoles, for which the 3D geometry matters. We search numerically for such a 3D geometry implying the orientation and position of the two dipoles and the position of the two charge traps responsible for the lobes Z2 and Z3. A range of possible configurations are found among which we show here six examples.
To further confirm the adequacy of such a configuration with the whole set of experimental data, we try to reproduce directly all the experimental points observed in Figure 3 of the main paper. To do so, for each of the configurations found in fig S-9, we search numerically for the positions of the trapping or detrapping events responsible for the main lobe Z1, using trap positions as close as possible to the nanotube surface (as an example see Figure S-10, corresponding to the third dipole configuration displayed in Figure S-9).
9 Autocorrelation function for a fast switching emitter
In this paragraph we compute the auto-correlation function of a two-level system emitter that switches between two configurations, resulting in two distinct emission lines when observed with a long integration time. The switching rates between the two configurations (labelled ”1” and ”2”) are given by and .
The autocorrelation function is given by
| (3) |
where corresponds to the configuration. The autocorrelation can be related to conditional probabilities:
| (4) |
The probabilities are given by ():
| (5) | |||||
| (6) | |||||
| (7) | |||||
| (8) |
where and are defined by , . This leads to:
| (9) | |||||
| (10) |
A fast switching event is thus characterized by a step (in semi-logx scale) in the auto-correlation of both lines, at the same characteristic time . Moreover the product of the amplitudes of this step of each line is equal to one (for a normalized function).
10 1D vs 3D emitter pair generation probability
For an emitter numeric concentration , the probability to find emitters within an elementary volume reads: . The manipulation of a quantum coupled pair requires that two emitters are in close vicinity (within a few nm3) and are the only pair within a volume of the order of , where is the transition wavelength used to manipulate the system. This configuration has a probability . This probability is maximum for a concentration and amounts to . In a 3D system, with , this reads: , whereas for a 1D system, one gets . Hence, for typical configurations where , the 1D configuration is times more favorable than its 3D counterpart, showing the strong interest of using a nanotube as a 1D backbone to anchor the OCCs.